Article

Exploration on the Extraction of Phenolic Acid from Abutilon theophrasti and Antioxidant and Antibacterial Activities

1
Engineering Research Center of Forest Bio-Preparation, Ministry of Education, Northeast Forestry University, Harbin 150040, China
2
College of Chemistry, Chemical Engineering and Resource Utilization, Northeast Forestry University, Harbin 150040, China
3
Key Laboratory of Forest Plant Ecology, Ministry of Education, Northeast Forestry University, Harbin 150040, China
4
Heilongjiang Provincial Key Laboratory of Ecological Utilization of Forestry-Based Active Substances, Northeast Forestry University, Harbin 150040, China
5
State Key Laboratory of Utilization of Woody Oil Resource, Northeast Forestry University, Harbin 150040, China
*
Authors to whom correspondence should be addressed.
Separations 2025, 12(11), 288; https://doi.org/10.3390/separations12110288
Submission received: 10 September 2025 / Revised: 18 October 2025 / Accepted: 19 October 2025 / Published: 22 October 2025
(This article belongs to the Section Analysis of Natural Products and Pharmaceuticals)

Abstract

This study selected Abutilon theophrasti Medicus as the research object and optimized the ultrasonic-assisted heat reflux extraction process using response surface methodology to achieve efficient extraction of phenolic acids from its leaves. The optimized conditions were as follows: methanol was used as the extraction solvent, with a liquid–solid ratio of 30:1 (mL/g), ultrasonic power of 200 W, ultrasonic time of 30 min, and reflux temperature of 70 °C. Under these conditions, the extraction yield of total phenolic acid reached 213.29 μg/g, which significantly higher than those obtained using traditional extraction methods. Subsequently, six phenolic acid compounds, gallic acid, protocatechuic acid, chlorogenic acid, vanillic acid, syringic acid, and p-hydroxybenzoic acid, were successfully separated and identified from the leaf extract. Meanwhile, the phenolic acid contents in the roots, stems, and leaves of A. theophrasti were analyzed by HPLC method. The results showed that the phenolic acid content in the leaves was significantly higher than in the roots and stems. Furthermore, the antioxidant and antibacterial activities of extracts obtained from different plant parts, and those of the six separated phenolic acids, were systematically evaluated. The results demonstrated that all the samples exhibited notable antioxidant and antibacterial activities. Among them, gallic acid, protocatechuic acid, syringic acid, and vanillic acid displayed strong antioxidant activity, while gallic acid and vanillic acid showed the highest antibacterial efficacy.

1. Introduction

Abutilon theophrasti (A. theophrasti), an annual malvaceous sub-shrubby herb, has long been regarded as a weed due to its rapid growth and vigorous reproductive capacity [1,2]. Recently, its medicinal value has attracted increasing attention. The roots, stems, and leaves are rich in bioactive compounds such as phenolics, flavonoids, and polysaccharides, which exhibit anti-inflammatory, antibacterial, and hepatoprotective properties [2,3,4]. These naturally occurring compounds hold significant potential for application in pharmaceuticals, nutraceuticals, and functional foods [5]. Therefore, establishing an efficient extraction system and conducting comprehensive investigations into its antioxidant and antimicrobial activities are essential for fully harnessing the value of this underutilized resource [6,7].
Phenolic acids are a kind of important phenolic substances, which are widely present in various plants [8,9], such as gallic acid (GA), chlorogenic acid (CA), protocatechuic acid (PA), vanillic acid (VA), syringic acid (SA), and p-hydroxycinnamic acid (PHCA) [10]. In recent years, a large number of studies have shown that phenolic acid compounds are closely related to human health, food quality, and plant growth [11,12,13]. Therefore, the metabolic regulation of phenolic acid compounds in plants, and explorations on the optimized extraction, content determination, and separation and identification of these compounds from plant sources, have attracted growing attention.
However, the traditional extraction method for phenolic acids from A. theophrasti presents several limitations. For instance, the conventional hot reflux extraction method is constrained by the cell wall barrier, leading to a slow dissolution rate, prolonged extraction time, and low extraction yield [14,15,16]. In addition, prolonged exposure to high temperatures can also lead to the oxidation and degradation of phenolic acids, thereby significantly diminishing their biological activity [17]. To address these challenges, an Ultrasonic-Assisted Reflux Extraction (UARE) method was applied for the efficient extraction of bioactive phenolic acids from A. theophrasti in this study. Ultrasonic extraction utilizes acoustic cavitation to enhance mass transfer [18]. It has been widely adopted in the isolation of natural products, food processing, and pharmaceutical applications due to its operational simplicity, short processing time, minimal thermal damage, and high extraction yield [19,20]. UARE is a coupled technology that integrates the ultrasonic cavitation effect with thermal reflux continuous extraction, enabling the simultaneous achievement of dual objectives and enhancing extraction kinetics and preserving active structures. This method enables efficient extraction of target compounds from complex plant matrices by the physical disruptive effects of ultrasound, including cell wall disruption, reduction in the mass transfer boundary layer, and combining the continuous thermal energy provided from the reflux system with dynamic solvent circulation [21]. In the extraction of phenolic acids from A. theophrasti, UARE fully combined the advantages of ultrasonic treatment, which is highly efficient and low-temperature operation, and the characteristics of reflux extraction, which ensures adequate mass transfer and thorough dissolution, thereby achieving a synergistic effect [22]. Compared with traditional methods such as Soxhlet extraction and hot maceration, this extraction method not only significantly reduces extraction time and energy consumption, but also enhances the yield and extraction efficiency of target phenolic acids [23,24]. It offers high efficiency and a rapid component dissolution rate, making it particularly suitable for the extraction of thermally stable compounds [25]. This technology has been widely applied in the fields of natural product extraction, pharmaceuticals, and food processing.
Phenolic acids in plants are an important component of natural antioxidants [26]. They can combine with excessive free radicals in the body to form phenoxyl radicals, thereby protecting the body from free radical damage [27]. Its antioxidant mechanism primarily involves two pathways: direct binding with oxygen free radicals to interrupt the free radical chain reaction, and indirect scavenging of free radicals through interactions with enzymes associated with free radical generation [28]. In addition, phenolic acid compounds exhibit notable antibacterial activity. This natural antibacterial property enables plants containing these compounds to hold broad application potential in fields such as medicine and food [29]. Therefore, exploration on plants containing phenolic acids deeply, which possess natural antioxidant and antibacterial properties, holds considerable scientific significance and practical application value.
In this study, UARE of phenolic acids from A. theophrasti leaves was optimized using response surface methodology, with ultrasonic power, liquid–solid ratio, and extraction time selected as the three independent variables. Compared to conventional ultrasonic extraction and heat-reflux extraction methods, UARE exhibited significantly enhanced extraction yield. Six phenolic acid compounds were separated and structurally identified, and a highly sensitive analytical method was developed for their quantification in A. theophrasti. Furthermore, the antioxidant and antimicrobial activities of both the crude extract and the individual phenolic acids were evaluated.

2. Experimental

2.1. Reagents and Materials

Abutilon theophrasti was picked from Kangrong Town, Lanxi County, Heilongjiang Province, China. The samples collected on 25 August 2024 were identified by Professor Liqiang Mu from Northeast Forestry University. Its roots, stems, and leaves were dried at 40 °C and then ground into powder (60 mesh) using a grinder for subsequent use. The standardized compounds gallic acid, protocatechuic acid, chlorogenic acid, vanillic acid, syringic acid, and p-hydroxycinnamic acid (98%) were purchased from Chengdu Ruifens Bio-Technology Co. Ltd., (Chengdu, China). Folin–Ciocalteu reagent and vanillin were purchased from Sigma-Aldrich Trading Co. Ltd., (Shanghai, China). All the other chemicals were analytical grade, and the deionized water was prepared by the Milli-Q Pure Water System (RSJ, Xiamen, China).

2.2. Determination of Total Phenolic Acid Content

The total phenolic acid content from A. theophrasti was determined using the Folin–Ciocalteu Assay [30]. First, a precisely weighed quantity of GA was dissolved to prepare a standard solution, which was subsequently diluted to obtain standard solutions with different concentrations. A volume of 2 μL standard solution was taken and mixed with 10 μL of Folin–Ciocalteu reagent, 20 μL of deionized water, and 10 μL of 20% (w/v) sodium carbonate solution. After allowing the mixture to react for 2 h, the absorbance (OD value) was measured at 760 nm. A standard curve was then constructed based on the relationship between OD value and the mass concentration (mg/mL) of GA. Subsequently, the extracts of A. theophrasti roots, stems, and leaves were prepared into 2 mg/mL sample solutions, and the total phenolic acid content was determined following the aforementioned procedure.

2.3. Optimization of Extraction Parameters

To efficiently extract total phenolic acid from A. theophrasti, methanol was selected as the extraction solvent under a fixed water bath temperature of 70 °C. Single-factor optimization experiments were conducted on three parameters: ultrasonic time, ultrasonic power, and liquid–solid ratio. Through extraction experiments performed under these controlled conditions, the influence range of each factor on the extraction yield was determined. Based on the results, with the extraction yield of total phenolic acid (Y) as response variable. A three-factor, three-level Box–Behnken design (BBD) was employed to investigate the effects of liquid–solid ratio (X1, mL/g), extraction time (X2, min), and ultrasonic power (X3, W) on the yield of the target phytochemicals by UARE. The experimental design and response surface analysis were carried out using the Design-Expert 8.0.6 software. The extraction process is illustrated in Figure 1.

2.4. Comparison of UARE with Traditional Methods

Based on the optimal extraction process parameters: ultrasonic time of 30 min, ultrasonic power of 200 W, and liquid–solid ratio of 30:1 mL/g, the extraction yield of phenolic acid from A. theophrasti using UARE was compared with those of the single ultrasonic method and the thermal reflux method.

2.5. Separation and Identification of Phenolic Acid

Following the extraction of A. theophrasti, the crude extract was subjected to column chromatography on Sephadex LH-20 (5 cm × 80 cm) using a gradient elution system of methanol–water (100:0 to 0:100, v/v), with 1 L of solvent mixture delivered at a flow rate of 2.0 mL/min. Elution fractions were monitored by thin-layer chromatography (TLC) on silica gel plates using ethyl acetate–formic acid–water (8:1:1, v/v/v) as the developing system. Fractions eluted with 30–70% methanol were collected and combined according to TLC profile similarities. The combined fraction was concentrated under low pressure, re-dissolved in a 30% methanol–water solution, and subsequently used a reversed-phase C18 column (2.0 cm × 25 cm, 10 μm) for further separation. The column was eluted at a flow rate of 1.0 mL/min with 30% methanol in water, and the elution process was monitored by TLC. Subsequently, purification was performed using prepared TLC with toluene–ethyl acetate–formic acid (5:4:1, v/v/v) as the mobile phase. Target compounds were scraped from the plate, and extracted from the silica gel with methanol–water (8:2, v/v) by ultrasonic assistance. Following concentration, six high-purity compounds (I-VI) were obtained. The structures of the separated compounds were identified by ultraviolet spectrophotometer (UV), melting point apparatus (mp), electrospray mass spectrometry with an electrospray ionization (ESI) source (ESI-MS, Thermo Scientific, Waltham, MA, USA), nuclear magnetic hydrogen (1H NMR) spectrum, and nuclear magnetic carbon (13C NMR) spectrum. MS conditions: spray voltage 3.5 kV, auxiliary gas heater temperature 320 °C, auxiliary gas flow rate 10 L/min, nebulizer 50 psi. The chromatographic column used was the ACQUITY UPLC BEH C18 column (100 × 2.1 mm, 1.7 μm).

2.6. Determination of Phytochemicals by HPLC

HPLC (Agilent 1260, Agilent, Santa Clara, CA, USA) equipped with HiQ Sil C18 column (250 mm × 4.6 mm, 5 µm) was used to quantify GA, PA, CA, VA, SA, and PHCA. The mobile phase consisted of two components: phase A (methanol–acetic acid–water, 10:1:89) and phase B (methanol–acetic acid–water, 90:1:9). The elution condition was as follows: 0–20 min 5–30% (B), 20–28 min 30–40% (B). All the analyses were performed at a detection wavelength of 260 nm, with a flow rate of 1 mL/min, an injection volume of 10 µL, and a column temperature of 30 °C.

2.7. Antioxidant Activity

The antioxidant capacity of A. theophrasti extract and six phenolic acids was evaluated using the following assays: total antioxidant capacity (FRAP method), DPPH radical scavenging assay, and ABTS radical scavenging assay. Ascorbic acid (Vc) was used as the positive control, while distilled water served as the blank control. The FRAP method was performed following a previously reported procedure [31]. Total antioxidant capacity was determined by measuring OD value at 593 nm. The DPPH free radical scavenging activity was assessed based on the reference [32], with scavenging rate (%) calculated from OD value measured at 517 nm. The ABTS assay was also conducted according to the previously described method [33], where the clearance (%) was calculated based on OD value at 734 nm. All the experiments were carried out using 96-well plates and repeated three times to ensure data reliability.

2.8. Antibacterial Activity

The antibacterial activity was evaluated using the agar well diffusion method [34]. The plates inoculated with bacterial suspension were placed in a laminar flow hood. A sterile puncher with a diameter of 9 mm was used to create six evenly spaced wells on each plate. Subsequently, take 0.5 g of extracts from different parts of A. theophrasti and six phenolic acid compounds, respectively, dissolve them in a small volume of anhydrous methanol, and dilute to a final volume of 10 mL with sterile distilled water to obtain a concentration of 50 mg/mL solutions. A total of 100 μL of the sample solution was added to each well, with sterile water added to the fourth well as a control group, and streptomycin (for Staphylococcus aureus, Escherichia coli, Bacillus subtilis, and Pseudomonas aeruginosa) and fluconazole (for Candida albicans) as a positive control [35,36]. The plates were then incubated in a constant temperature incubator for 24 h. Staphylococcus aureus (S. aureus, ATCC 35844), Escherichia coli (E. coli, ATCC 11775(T)), and Candida albicans (C. albicans, ATCC 10231(T)) were incubated at 37 °C, Bacillus subtilis (B. subtilis, NCIB 3610(T)) at 30 °C, Pseudomonas aeruginosa (P. aeruginosa, JCM 5962(T)) at 35 °C. After incubation, the antimicrobial activity was observed, and the diameter of the inhibition zone was measured using the cross method. Relative Inhibition Activity (RIA) is a quantitative method that compares the effect of samples against that of a positive control, providing a percentage that indicates the relative efficacy. The calculation formula of RIC is as follows:
RIA (%) = (DsampleDdisk)/(DcontrolDdisk) × 100%
In the formula, Dsample: the diameter of the inhibition zone of the test sample (mm); Dcontrol: the diameter of the inhibition zone of the positive control (mm); Ddisk: the diameter of the carrier used (mm).
The minimum inhibitory concentration (MIC) was determined using the two-fold dilution method [37]. Eight sterile test tubes were labeled sequentially from 1 to 8. A volume of 3.6 mL of sterilized nutrient broth medium was added to test tube 1, while 2 mL of the medium was added to each of test tubes 2 through 7. Subsequently, 0.4 mL of the test solution was added to the medium in test tube 1 and thoroughly mixed. Then, 2 mL of this mixture was transferred from test tube 1 to test tube 2, and the dilution process was repeated sequentially through test tube 8. Following this, 0.05 mL of a bacterial suspension with a concentration of 106 CFU/mL was added to each of the eight test tubes containing the test solution, and the contents were mixed thoroughly. All the test tubes were then incubated in a constant temperature incubator for 24 h. Another set of eight test tubes was prepared and labeled 9 to 16. These were diluted in the same manner as described above but without bacterial inoculation, serving as blank controls. The lowest concentration in the test solution tubes at which no bacterial growth was observed was defined as the MIC of the test substance. Three parallel replicates were performed for each group.

2.9. Data Analysis

All the measured data were expressed as the mean obtained from three repeated experiments and statistically analyzed by SPSS 19.0 and by variance (ANOVA). When p < 0.05, the difference was considered statistically significant.

3. Results and Discussion

3.1. Optimization of Extraction Condition

3.1.1. Effect of Extraction Time

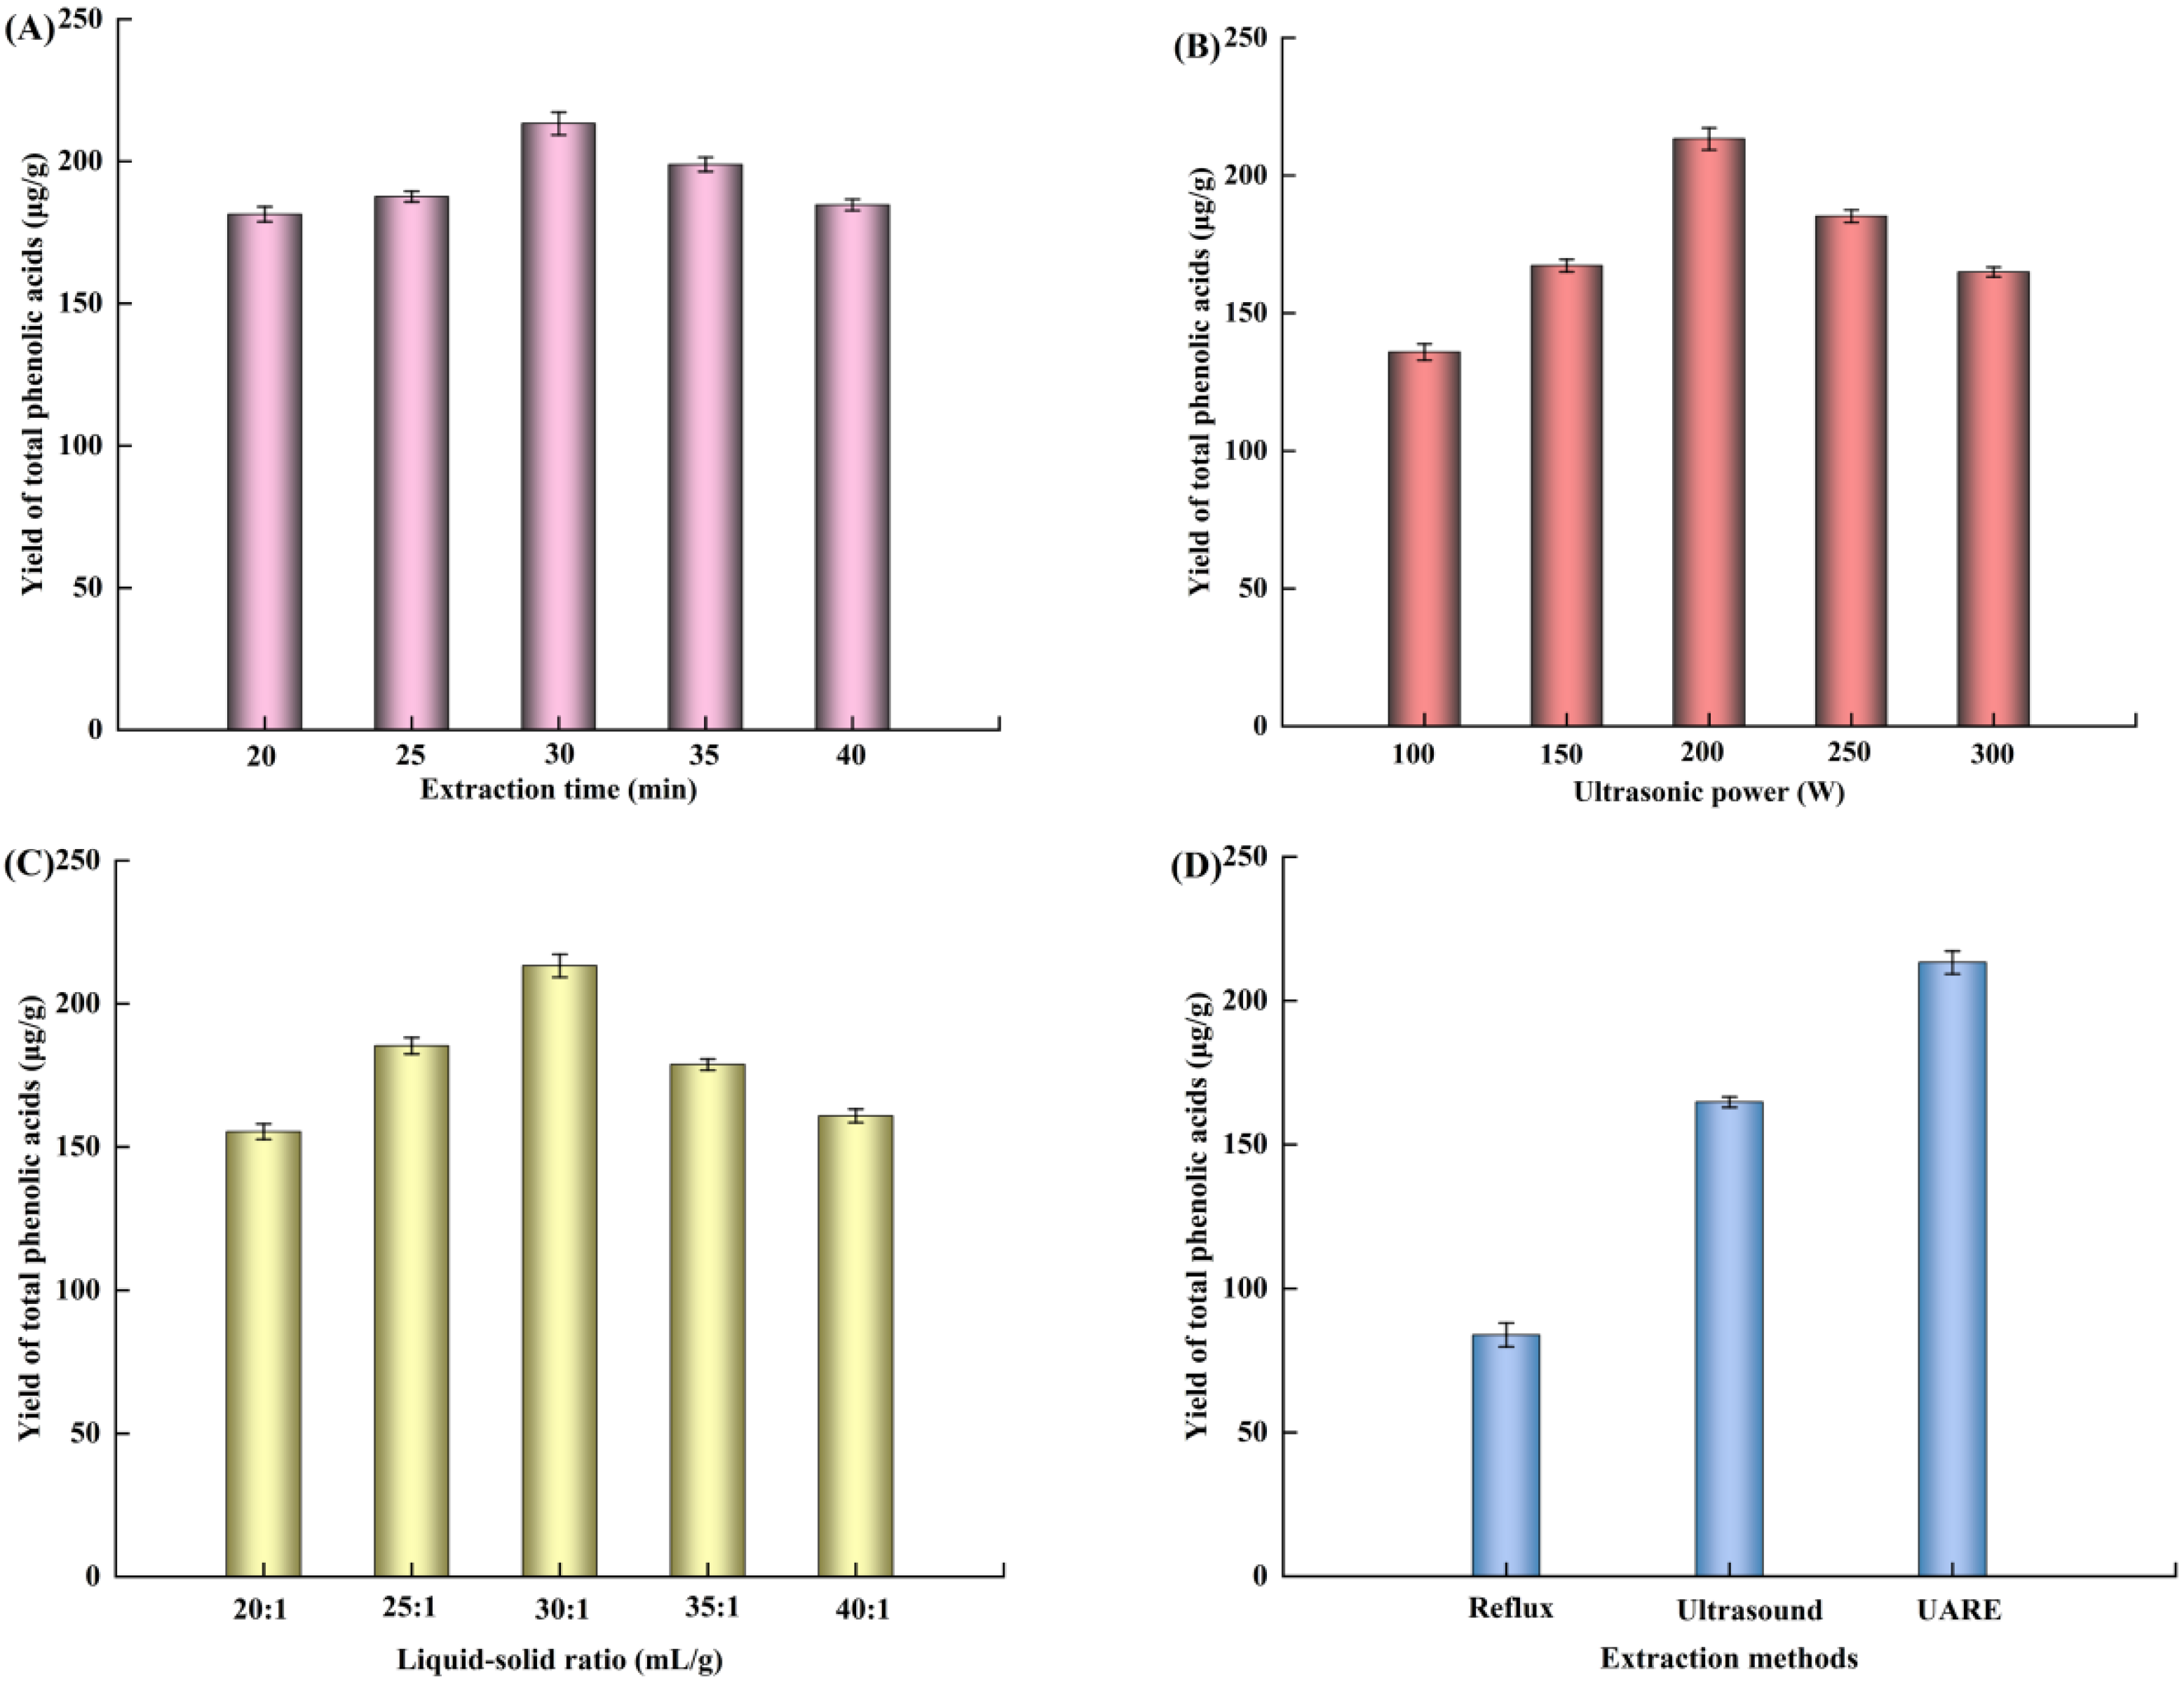
Under the conditions for a fixed ultrasonic power of 200 W, a reflux temperature of 70 °C, and a liquid–solid ratio of 30:1 (mL/g), the effects of extraction time on the extraction yield of total phenolic acids were systematically investigated (Figure 2A). The results indicate that as the ultrasonic time increases, the extraction yield initially increase. When the ultrasonic time reached 30 min, no significant increase was observed. This phenomenon may be attributed to the fact that the cavitation effect induced by ultrasound fully disrupts the plant cell walls within 30 min, thereby accelerating the release of phenolic acids [38]. Beyond this point, the disruption of cell walls does not significantly intensify, and prolonging the ultrasonic time has minimal impact on improving extraction yield. Therefore, 30 min was selected as the optimal ultrasonic time for the subsequent tests.

3.1.2. Effect of Ultrasonic Power

Under the conditions for a fixed extraction time of 30 min, a reflux temperature of 70 °C, and a liquid–solid ratio of 30:1 (mL/g), the effects of ultrasonic power on both the extraction yield of total phenolic acids were investigated (Figure 2B). The results indicate that as ultrasonic power increases, the extraction yield rise gradually. However, this increasing trend becomes less pronounced when the ultrasonic power reached 200 W. When the power was increased to 250 W, the extraction yield began to decrease. This phenomenon may be attributed to excessive ultrasonic power inducing the degradation of compounds and damaging certain phenolic acid constituents [20]. Therefore, 200 W was selected as the optimal ultrasonic power for subsequent tests.

3.1.3. Effect of Liquid–Solid Ratio

Under the conditions for a fixed ultrasonic power of 200 W, an ultrasonic time of 30 min, and a reflux temperature of 70 °C, the effects of the liquid–solid ratio on the extraction yield of total phenolic acid were investigated (Figure 2C). The results indicate that the extraction yield initially increases with an increasing liquid–solid ratio. The maximum yield was achieved when the liquid–solid ratio reached 30:1 (mL/g). However, further increasing the ratio led to a decrease in extraction yield. This phenomenon may be attributed to the fact that an appropriate solvent volume effectively dissolves and releases intracellular phenolic acid components, whereas excessive solvent may cause re-adsorption of the extracted phenolic acids onto plant residues, reducing extraction yield [39,40]. Therefore, a liquid–solid ratio of 30:1 (mL/g) was selected as the optimal condition for subsequent tests.

3.1.4. Results of BBD and RSM Analysis

Taking the liquid–solid ratio (X1), ultrasonic time (X2), and ultrasonic power (X3) as the independent variables, and taking the optimal extraction process parameters obtained from the single-factor experiment as the central value, the Box–Behnken design was used to conduct the response surface analysis experiment of three factors and three levels. The experimental design scheme and results are shown in Table 1.
The regression equations for the extraction yield of phenolic acid in A. theophrasti leaves are as follows:
Y = −749.168 + 18X1 + 2.203X2 + 30.855X3 − 0.003X1X2 + 0.006X1X3 −0.003X2X3 − 0.283X12
− 0.005X23 − 0.51X32                           
An analysis of variance (ANOVA) was performed on the regression model, and the results are presented in Table 2. Both the regression models reached a statistically significant level (p < 0.0001), while the lack-of-fit terms were not significant (p > 0.01), indicating that the experimental models were well-fitted. The coefficient of determination (R2 = 0.9923) demonstrates that the models exhibit a high degree of fit, with strong correlations between the predicted values and the actual observed values. Therefore, these models can be effectively used to analyze and predict the extraction yield of phenolic acid from A. theophrasti leaves. The main influencing factors, in descending order of significance, are ultrasonic time, liquid–solid ratio, and ultrasonic power. According to the results of analysis of variance (ANOVA), the effects of each factor on the extraction yield of phenolic acid from A. theophrasti leaves was as follows: the linear terms X1, X3, X12, X22, and X32 showed extremely significant effects (p < 0.01).
The optimal extraction process parameters obtained through optimization using the Design-Expert 7.15 software are as follows: methanol was selected as the extraction solvent, with a liquid–solid ratio of 29.45:1 (g/mL), an ultrasonic power of 201.12 W, and an ultrasonic time of 30.57 min (Figure 3). Under these conditions, the extraction yield of phenolic acid from A. theophrasti leaves was 215.42 μg/g. For the convenience of practical operation, the final extraction conditions were adjusted to methanol as the extraction solvent, a liquid–solid ratio of 30:1 (mL/g), an ultrasonic power of 200 W, and an ultrasonic time of 30 min. Under the adjusted conditions, the extraction yield remained at 213.29 μg/g, indicating that the response surface-optimized parameters are reliable and applicable under practical experimental conditions.

3.2. Comparison of Different Extraction Processes

Figure 2D shows the effects of ultrasonic method, reflux method, and UARE method on the extraction yield of total phenolic acid from A. theophrasti leaves. It can be clearly seen that the extraction yield obtained by the UARE method is significantly higher than that of using the ultrasonic method and the thermal reflux method alone. Specifically, the extraction yield obtained by UARE method is 2.54 and 1.29 times that of the traditional reflux and ultrasonic method, respectively. This result indicates that UARE method has significant advantages in extracting phenolic acids from A. theophrasti leaves and is superior to the traditional single extraction method.

3.3. SEM

To evaluate the extent of structural damage caused by the UARE method to A. theophrasti leaves, the surface morphology changes in the raw material after different extraction treatments were observed using scanning electron microscopy (SEM) (Figure 4). The results indicate that the surface structure of the raw material remains largely intact. After conventional hot reflux and ultrasonic extraction, some degree of surface damage is observed, although portions of the raw structure remain preserved. In contrast, following UARE, the plant material is extensively fragmented with widespread pore formation. These surface pores facilitate the diffusion of active constituents and enhance the mass transfer rate, thereby significantly improving the extraction yield [41].

3.4. Separation and Identification of Phenolic Acids

The identification of compounds I–VI was completed through mass spectrometry (MS) analysis combined with a comparison of literature data. The six phenolic acid compounds were ultimately confirmed as follows: I-GA, II-PA, III-CA, IV-VA, V-SA, and VI-PHCA. They are considered to be excellent antioxidant and antibacterial active components. The catechol structure of GA and PA can efficiently eliminate free radicals through hydrogen supply, while the methoxy group of SA gives electrons to stabilize the phenolic oxygen radical, thereby prolonging the antioxidant effect [42,43]. VA and PHCA, although they have only one phenolic hydroxyl group and relatively weak antioxidant capacity, can still contribute to the overall free radical scavenging capacity. In terms of antibacterial activity, the six phenolic acids typically disrupt membrane integrity and increase permeability, inhibit key virulence factors such as urease and protease, bind to membrane proteins to impair their functions, and induce DNA oxidative damage, collectively contributing to the potent, broad-spectrum, and long-lasting antioxidant and antibacterial properties of the extract, with potential synergistic interactions among the phenolic acids [44]. Detailed spectral data and the identification procedures are provided in the Supplementary Materials.

3.5. Determination of the Contents of Six Phenolic Acid

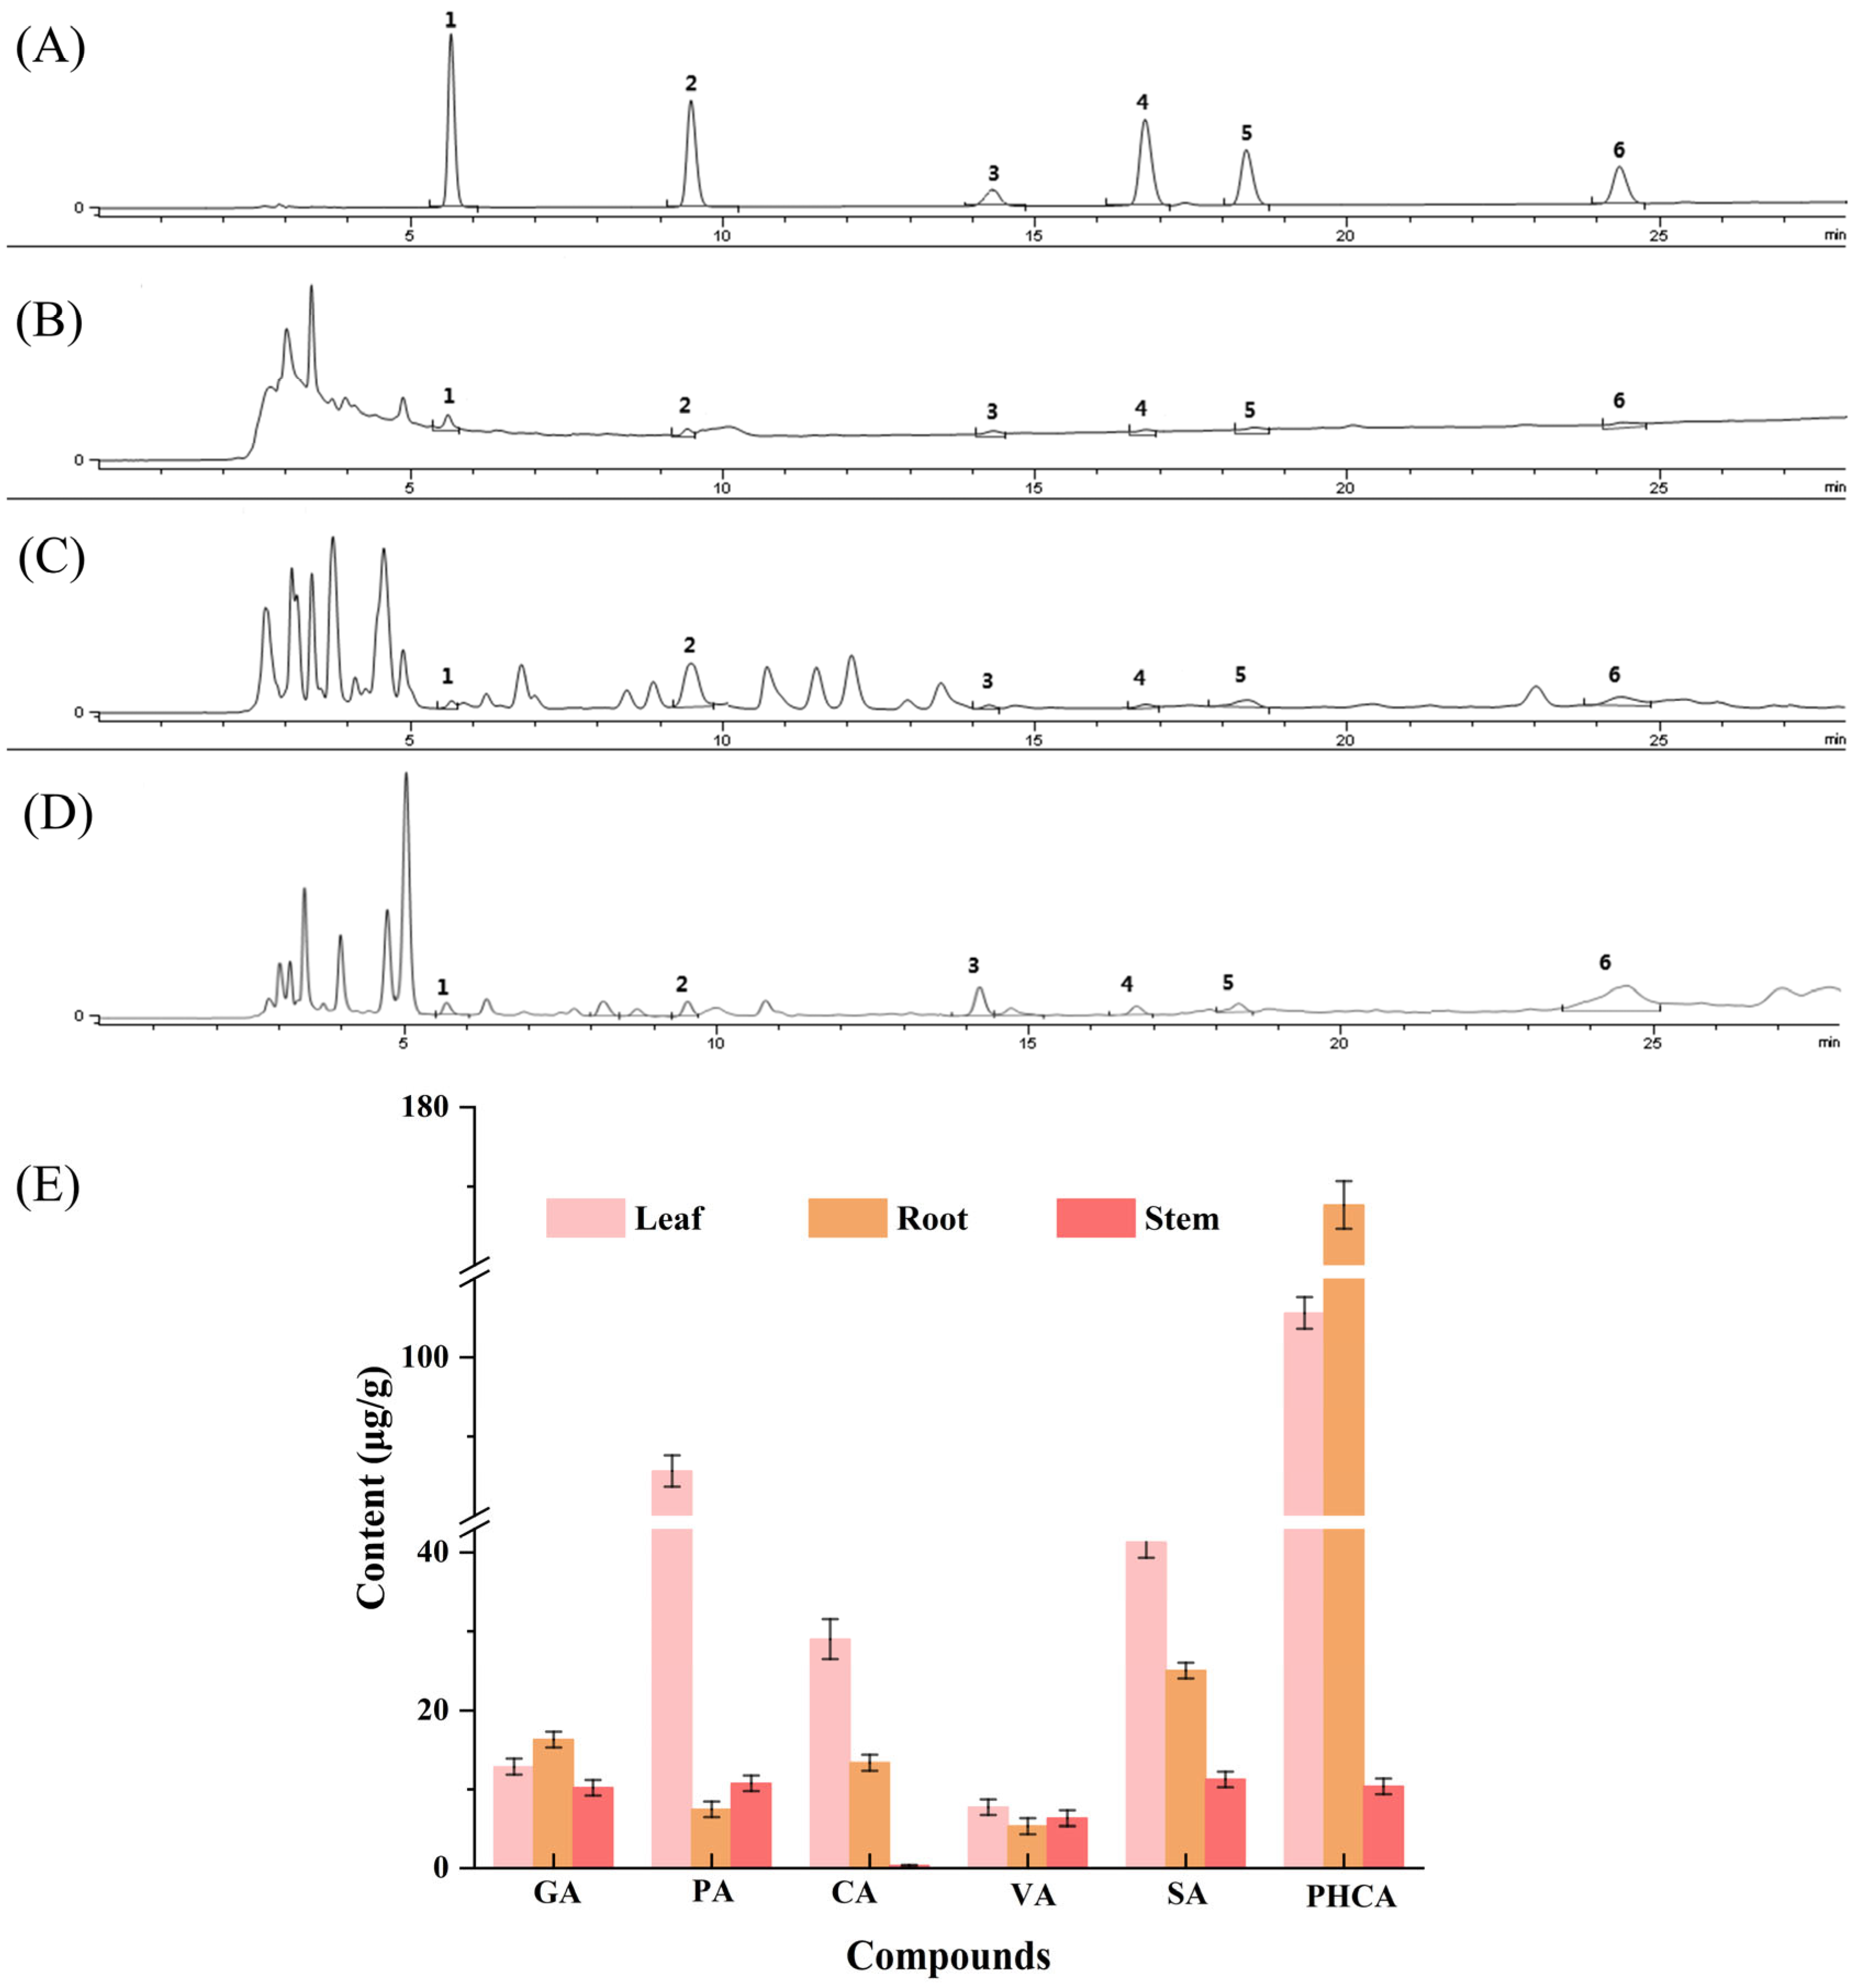
As shown in Figure 5A–D, six phenolic acid compounds in different parts of A. theophrasti were analyzed under liquid chromatographic detection conditions. As illustrated in Figure 5E, the differences were observed in the contents of six phenolic acids among the leaves, stems, and roots of A. theophrasti. The highest phenolic acid content was found in the leaves, followed by the roots, with the lowest content detected in the stems.

3.6. Results of Antioxidant Activity

3.6.1. The FRAP of Extracts and Six Phenolic Acids

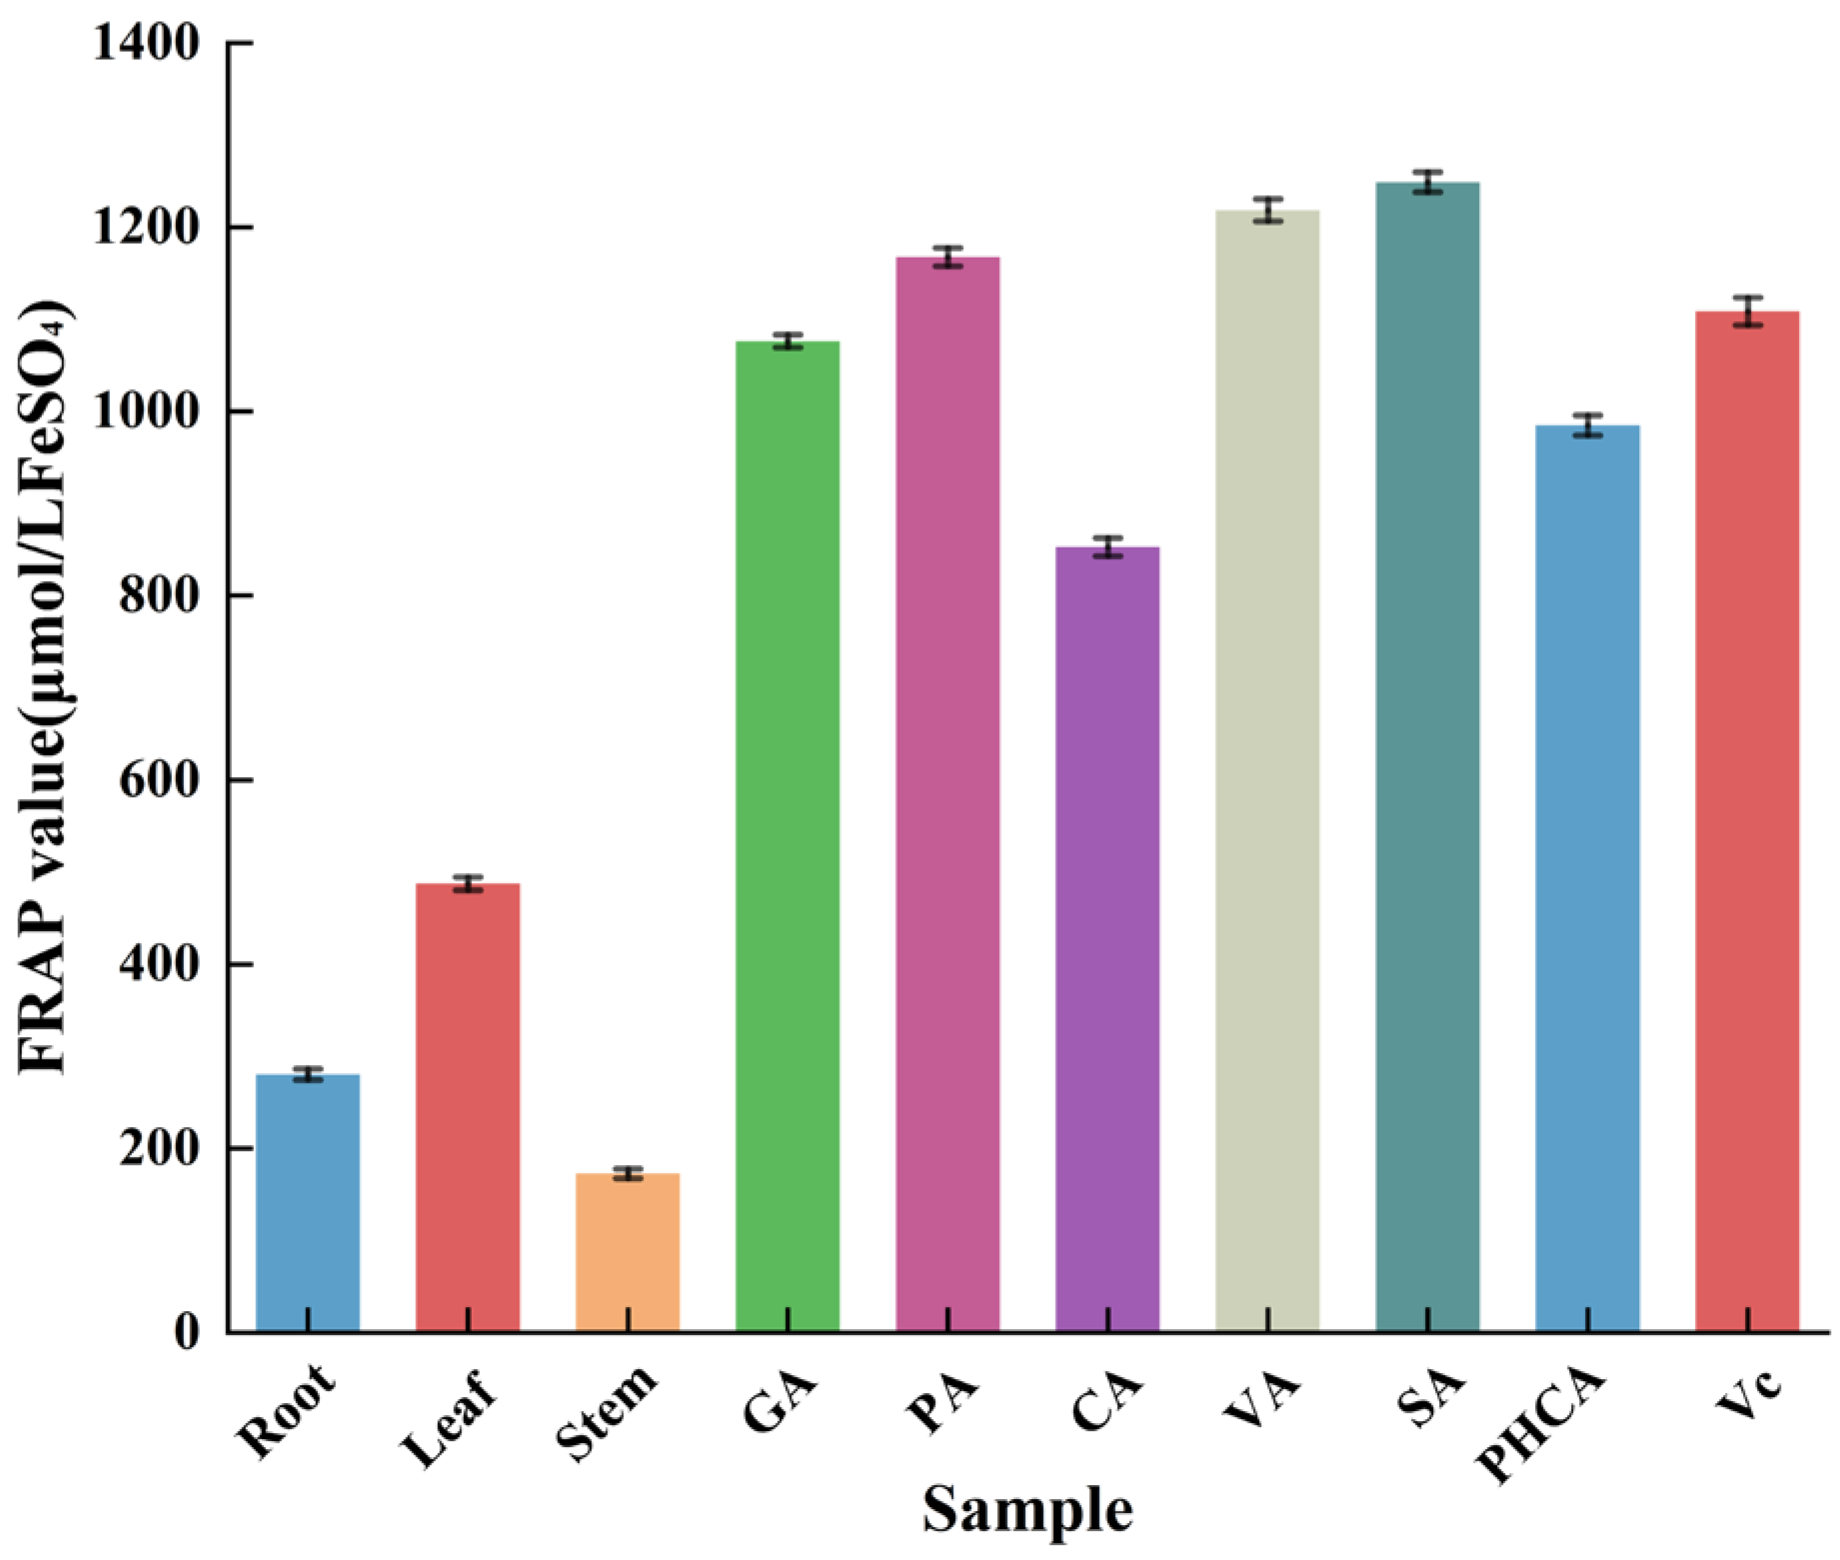
Antioxidants are capable of reducing Fe3+ to Fe2+ and forming stable complexes with free radicals, thereby interrupting the free radical chain reaction [45]. The greater the electron-donating capacity of a sample, the stronger its ability to reduce Fe3+. The total antioxidant capacity of a sample can be evaluated by its FRAP value—higher values indicate stronger antioxidant activity [46]. As shown in Figure 6, at a concentration of 1.5 mg/mL, the FRAP values are ranked in descending order as follows: SA > VA > PA > Vc > GA > PHCA > CA > leaf extract > root extract > stem extract.

3.6.2. The DPPH of Extracts and Six Phenolic Acids

As shown in Figure 7A, the DPPH free radical scavenging activity of extracts from different parts of A. theophrasti increases with increasing extract concentration [47]. When the concentration of A. theophrasti leaf extract reached 1.0 mg/mL, its hydroxyl radical scavenging capacity reached 63.88%, while that of root extract reached 55.21%, and stem extract exhibits a scavenging rate of 43.35%. The DPPH free radical scavenging capacities of six phenolic acids was compared (Figure 7B): the scavenging abilities of GA PA, SA, VA, and PHCA are all higher than that of Vc, whereas CA shows slightly lower scavenging activity compared to Vc. These results indicate that the phenolic acid compounds present in A. theophrasti exhibit strong DPPH free radical scavenging capabilities. By calculating the EC50 values of extracts from different parts of A. theophrasti, Vc, and the six phenolic acids, it was determined that the order of scavenging ability is as follows: GA > PA > PHCA > VA> Vc > CA > leaf extract > root extract > stem extract.

3.6.3. The ABTS of Extracts and Six Phenolic Acids

The ABTS free radical scavenging activity of extracts from different parts of A. theophrasti increases with increasing extract concentration (Figure 7C,D). Moreover, the scavenging ability of ABTS radicals by A. theophrasti leaf extract is stronger than that of root and stem extracts. A comparison of the scavenging capacities of the six phenolic acids revealed that GA exhibited the highest scavenging activity when the treatment concentration was below 0.3 mg/mL. When the concentration exceeded 0.3 mg/mL, PA and SA demonstrated very strong free radical scavenging abilities. At concentrations greater than 2 mg/mL, the scavenging capacity of Vc was higher than that of CA but lower than that of the other five phenolic acid compounds. The EC50 values of A. theophrasti extracts from different plant parts, Vc, and the six phenolic acids were calculated, revealing the following order of scavenging ability: GA > PA > SA > PHCA > VA > Vc > CA > leaf extract > root extract > stem extract.
The antioxidant activities of the root, stem, and leaves of A. theophrasti and six phenolic acid compounds were evaluated by FRAP, DPPH, and ABTS. The results indicated that the various phenolic acids formed a highly efficient and stable natural antioxidant system. These phenolic acid compounds generally exhibit superior capacity in providing electron or hydrogen and higher efficiency in scavenging various types of free radicals compared to the common antioxidant Vc, demonstrating potent antioxidant activity. Among them, GA exhibits extremely high reaction efficiency at low concentrations, while PA and SA demonstrate strong clearance potential over a wider range of concentrations. The comparison of extracts from various parts further confirmed that the leaves are the main part for the accumulation of these highly effective antioxidant compounds, and their activity is significantly higher than that of the roots and stems. Therefore, A. theophrasti, particularly its leaves, represents a highly valuable source of natural antioxidants, with its antioxidant activity primarily attributed to the potent phenolic acid compounds.
Although the results indicate that individual phenolic acids exhibit higher antioxidant activity than Vc in its standard form, the overall antioxidant activity of the A. theophrasti extract is lower than that of these individual compounds. This phenomenon indicates that in addition to the identified phenolic acids, the extract also contains some unknown impurity. These complex interactions among these impurity and phenolic acids may significantly influence antioxidant activity [43,48].

3.6.4. Correlation Analysis

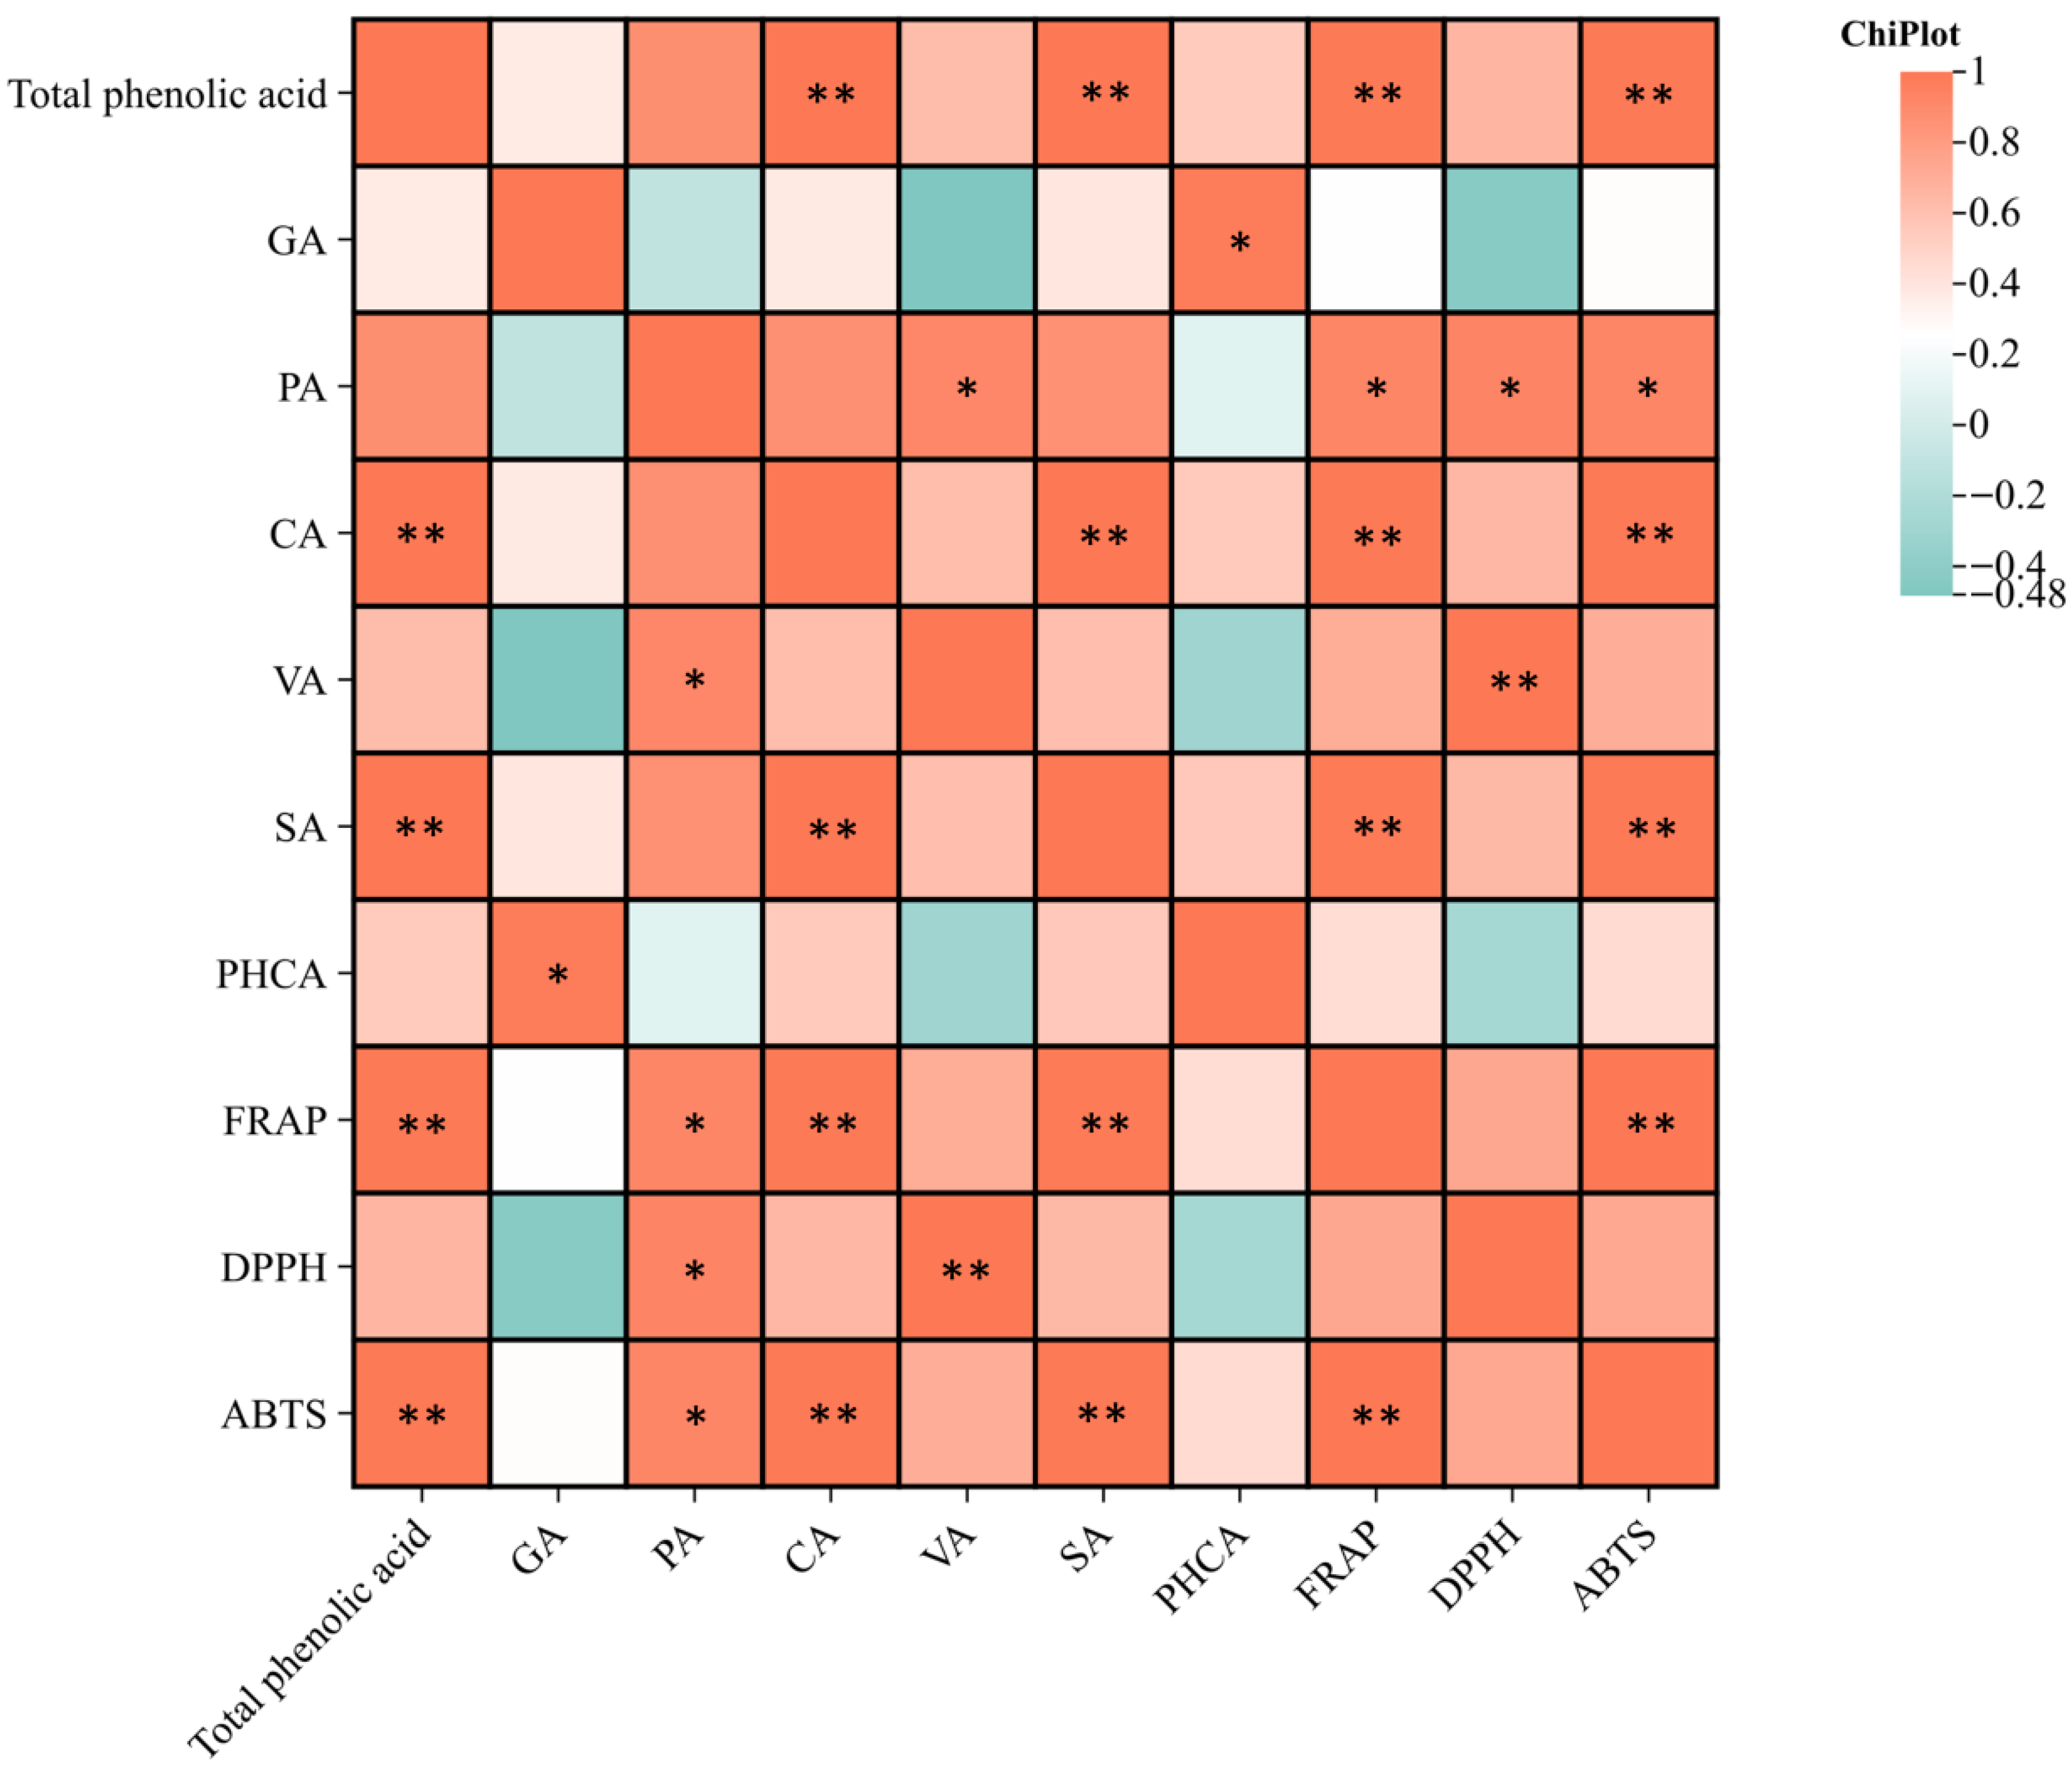
The total phenolic acid content in A. theophrasti leaves, the individual contents of six phenolic acids, and their DPPH and ABTS free radical scavenging activities and total antioxidant capacity were analyzed using SPSS 19.0 to determine the correlation coefficients (R2). As shown in Figure 8, the total phenolic content in A. theophrasti is positively correlated with DPPH and ABTS scavenging activities, and total antioxidant capacity. This suggests that the antioxidant activity of A. theophrasti extract is primarily associated with its total phenolic content. Furthermore, the total phenolic acid content showed a significantly positive correlation with the contents of chlorogenic acid and eugenic acid. Among the six phenolic acids, CA and SA exhibited highly significant correlations with both the FRAP value and ABTS radical scavenging rate. PA showed significant correlations with the FRAP value, ABTS scavenging activity, and DPPH clearance rate. VA was highly significantly correlated with the DPPH radical scavenging rate. These findings indicate that PA, CA, VA, and SA play a key role in the antioxidant activity of A. theophrasti.

3.7. Antibacterial Activity of Extract and Six Phenolic Acids

3.7.1. Antibacterial Activity of Extracts from Different Parts

The antibacterial activity against the target bacterial strains was evaluated by measuring the inhibition zone diameters of A. theophrasti extracts from different plant parts [49]. Figure 9 shows the positive control results for five bacterial strains at a drug concentration of 50 mg/mL. A clearly visible inhibition zone was observed for S. aureus (20.4 mm), C. albicans (26.5 mm), P. aeruginosa (26.4 mm), B. subtilis (30.6 mm), and E. coli (24.8 mm), indicating antibacterial activity and confirming the reliability of the experimental conditions. When the concentration exceeds 200 mg/mL, the root, stem, and leaf extracts of A. theophrasti exhibited inhibitory effects on all five bacterial species (Figure 9 and Table 3). However, the antibacterial efficacy varies among extracts from different parts at concentrations below 200 mg/mL. The stem extract shows no significant inhibitory effect against any of the five tested bacteria at a concentration of 100 mg/mL. The root extract demonstrates a moderate inhibitory effect only against S. aureus, with no noticeable activity against other bacterial strains. In contrast, the leaf extract exhibits inhibitory activity against S. aureus, E. coli, C. albicans, and P. aeruginosa, but shows minimal effect on B. subtilis.

3.7.2. Antibacterial Activity of Six Phenolic Acids

The inhibitory effects of the six phenolic acids on the tested bacterial strains varied in both spectrum and intensity, and were positively correlated with concentration (Figure 10). At high concentrations, all six phenolic acids exhibited clear inhibition zones against the five bacterial strains. However, upon reduction in concentration, the inhibitory effects of most phenolic acids markedly diminished. When the concentration was reduced to 2.5 mg/mL or lower, the six phenolic acids showed little to no activity against the five strains. As presented in Table 4, GA and VA exhibited the broadest antibacterial spectra, followed by PA and CA, whereas CA and SA displayed narrower antibacterial ranges. Specifically, GA and VA demonstrated the strongest overall antibacterial activity against the tested strains, followed by PA, PHCA, CA, and SA. Among them, GA showed strong inhibitory activity against S. aureus, B. subtilis, and C. albicans, VA exhibited potent inhibition against S. aureus, C. albicans, and P. aeruginosa, PA was highly effective against E. coli, PHCA showed significant inhibitory activity against B. subtilis, P. aeruginosa and C. albicans, and SA exhibited strong inhibition only against S. aureus.
At a sample concentration of 50 mg/mL, the relative inhibitory activities of the six phenolic acids against the five bacterial strains are presented in Table 5. The table clearly indicates that among the various phenolic acids tested, PA and GA exhibit the broadest antimicrobial spectrum and the strongest antibacterial activity, particularly against S. aureus and C. albicans. However, E. coli and P. aeruginosa demonstrate inherent resistance to most of the tested compounds.
Based on the antibacterial results, extracts from roots, stems, and leaves of A. theophrasti, along with six phenolic acid compounds, exhibited significant antibacterial activity. However, notable differences were observed in their ability and antibacterial spectra. Overall, the leaf extract exhibits the strongest antibacterial effect. At a concentration of 100 mg/mL, it effectively inhibits pathogenic bacteria such as S. aureus and E. coli. In contrast, the root and stem extracts show relatively weak activity at the same concentration, suggesting that the antibacterial active components are predominantly concentrated in the leaves. Among the six phenolic acid compounds, GA and VA exhibited the broadest antibacterial spectrum and the strongest inhibitory activity. Notably, GA showed outstanding effects against Gram-positive bacteria and C. albicans, whereas PA displayed selective activity against E. coli. When the concentration decreased to 2.5 mg/mL, the antibacterial activity of all phenolic acids was nearly disappeared, indicating that their antibacterial effect is concentration-dependent. The results also revealed differences in strain sensitivity. For instance, Gram-negative bacteria exhibited inherent resistance to most of the tested compounds, whereas S. aureus and C. albicans were sensitive to various phenolic acids.

3.8. The Minimum Inhibitory Concentrations of Extract and Six Phenolic Acids

3.8.1. The Minimum Inhibitory Concentrations of Extracts from Different Parts

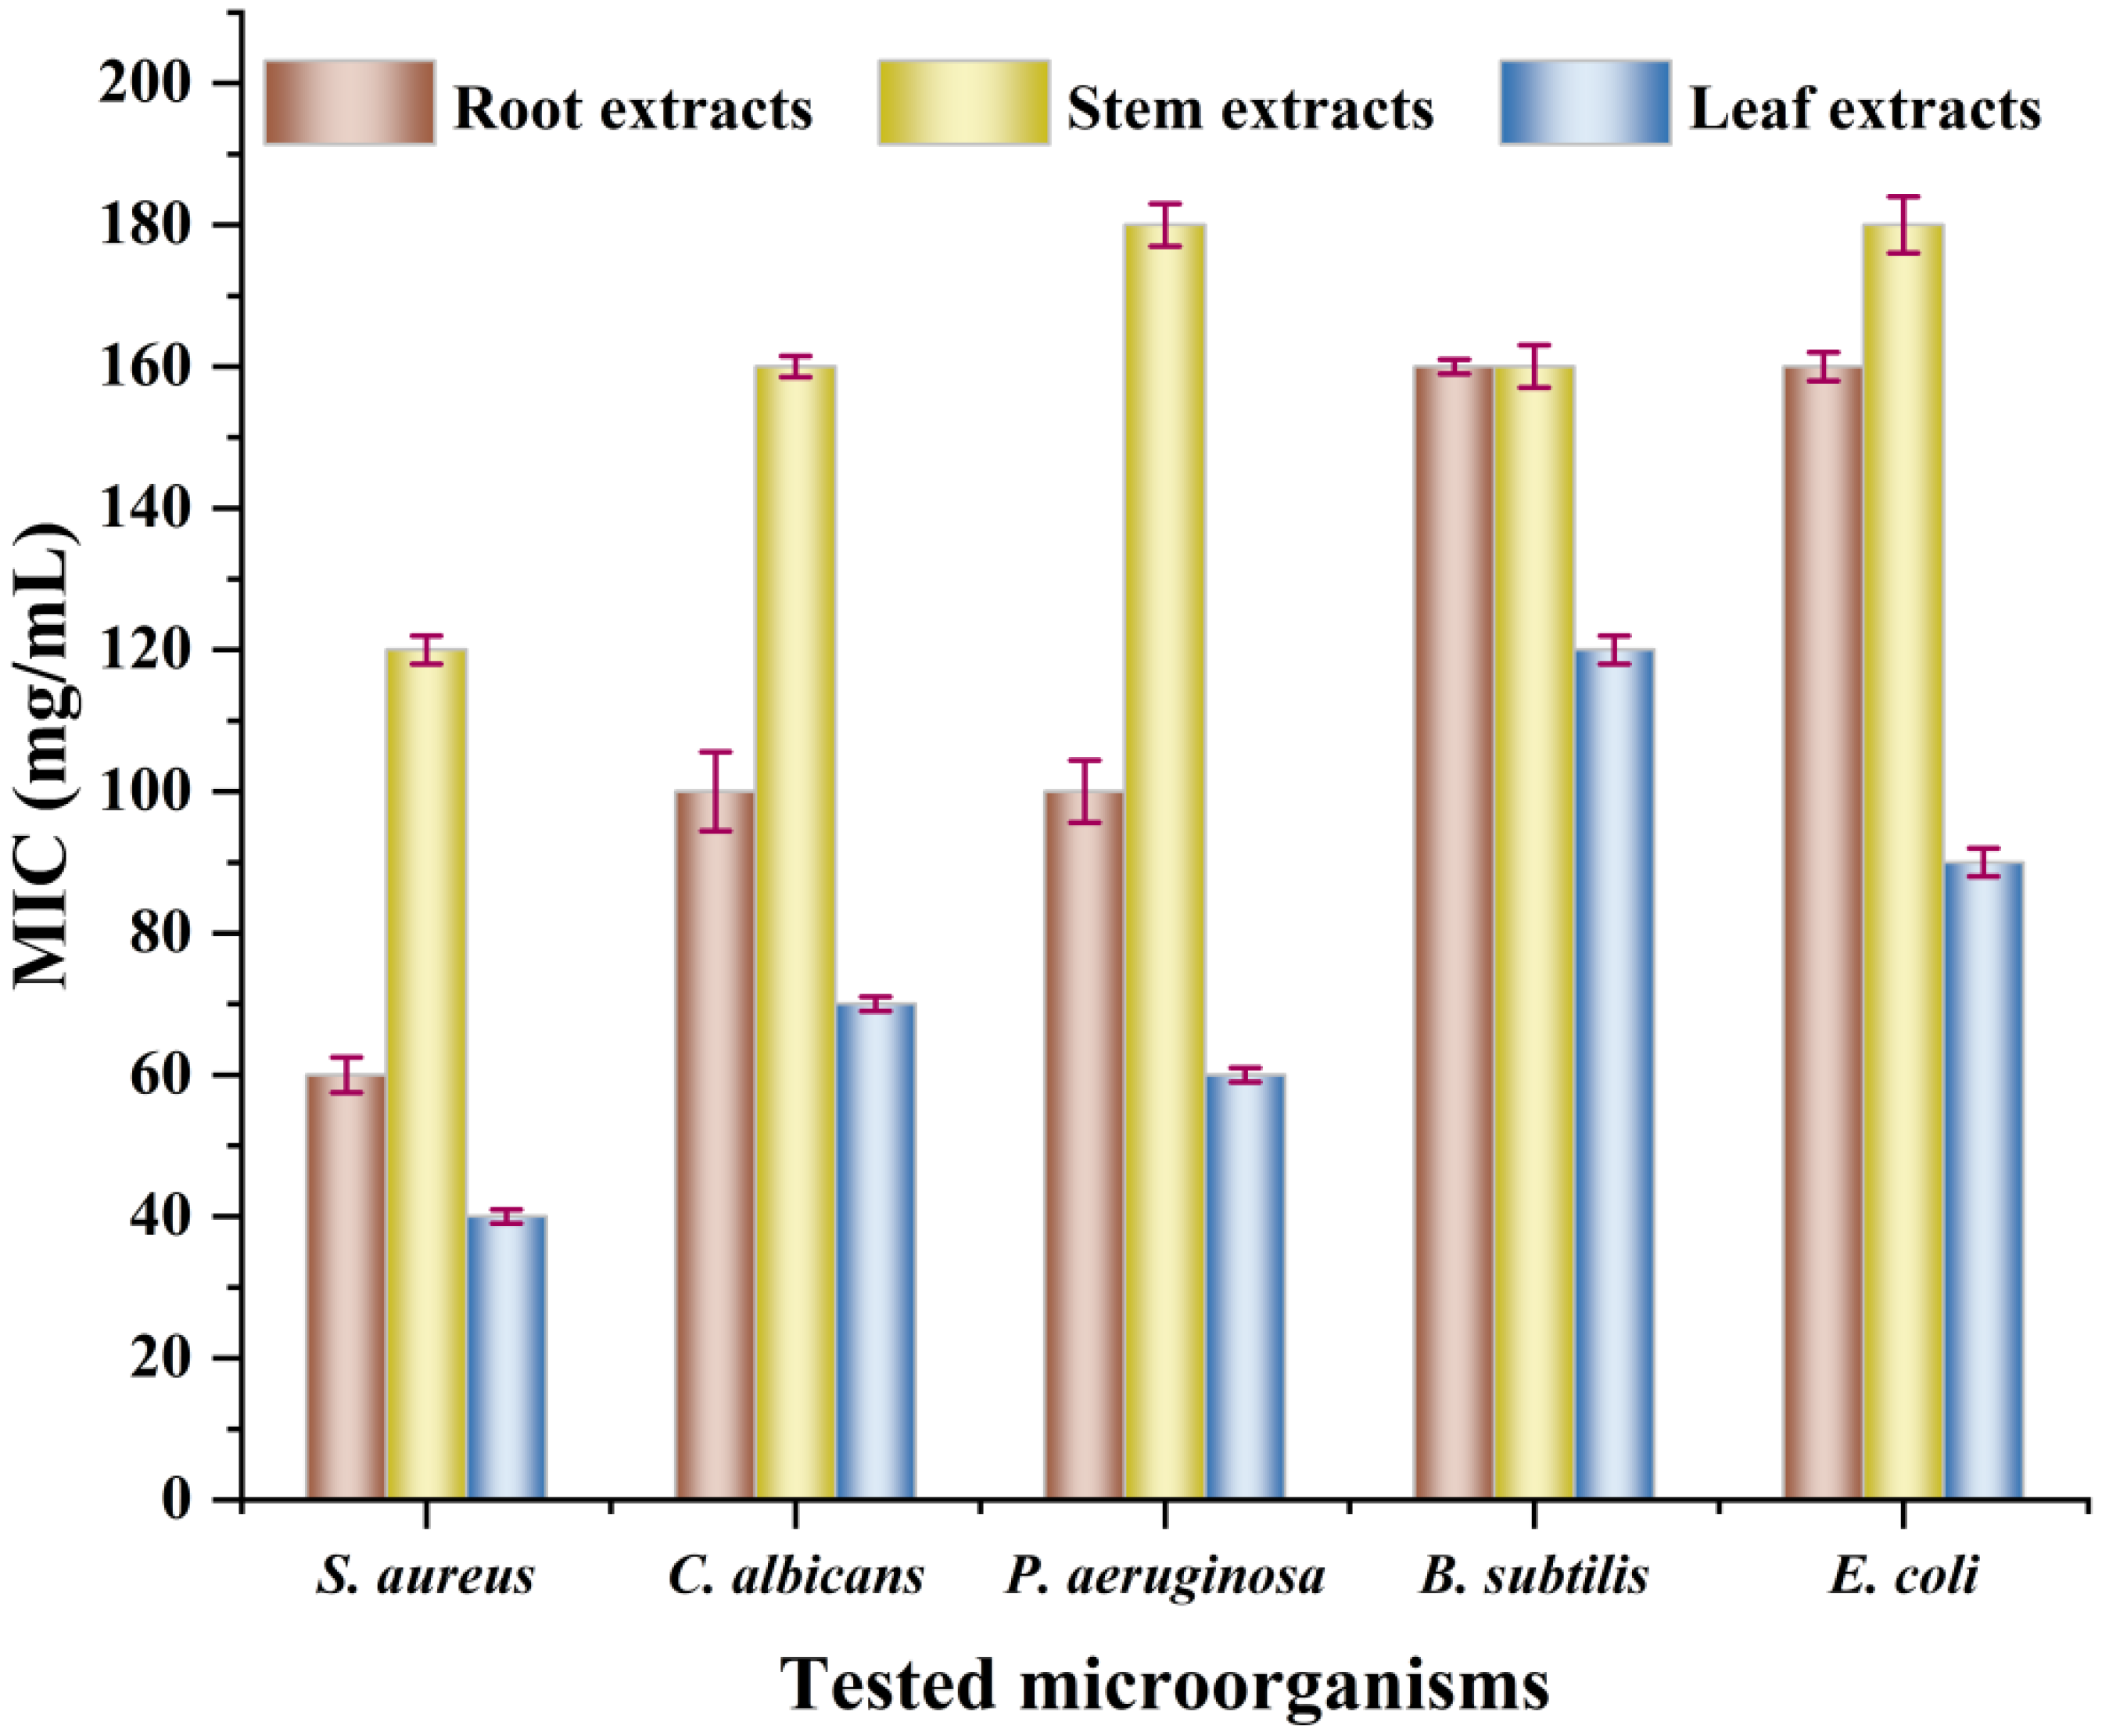
As shown in Figure 11, the extracts from different parts of A. theophrasti have inhibitory effects on the growth of five tested bacteria (S. aureus, E. coli, C. albicans, B. subtilis, and P. aeruginosa). Among them, the minimum inhibitory concentration (MIC) of the extract from the stem of A. theophrasti is the largest, the MIC of the extract from the root is smaller than that from the stem, and the MIC of the extract from the leaf is the smallest, indicating that the leaf has the strongest inhibitory ability.

3.8.2. The Minimum Inhibitory Concentrations of Six Phenolic Acid

As shown in Table 6, the MIC of the six phenolic acids against the tested bacterial strains vary significantly. GA, PA, CA and VA exhibit broad-spectrum antibacterial activity. CA demonstrates a lower MIC against P. aeruginosa but higher MIC values against other bacterial species. VA shows lower MIC values against S. aureus, P. aeruginosa, B. subtilis, and E. coli, but higher MIC against C. albicans. PHCA exhibits lower MIC against P. aeruginosa and B. subtilis, while showing higher MICs against S. aureus and C. albicans. SA displays a lower MIC specifically against S. aureus but higher MICs against E. coli and P. aeruginosa. Overall, GA and VA possess the broadest antibacterial spectrum and the strongest overall antibacterial activity, followed by PA and CA have a relatively broad antibacterial spectrum but exhibits weaker activity compared to GA and VA. SA demonstrates potent activity only against S. aureus, whereas PHCA shows moderate activity primarily against P. aeruginosa. CA exhibits generally weaker antibacterial activity across all tested strains. These findings are consistent with the antibacterial effects determined using the well diffusion method.
This study not only confirmed the identification of six major phenolic acids of A. theophrasti using HPLC-MS/MS combined with NMR, but also systematically compared the antioxidant and antibacterial activities of extracts from different plant parts with those of the individual phenolic acids. Based on the results of antioxidant and antibacterial activity, it was confirmed that the leaves are the primary part for the accumulation of active components. Furthermore, by comprehensively applying three antioxidant assays (FRAP, DPPH, and ABTS) and two antibacterial evaluation models (agar diffusion method and MIC determination) combined with correlation analysis, a complete evidence was established, enhancing the reliability of the findings and providing a chemical basis for the development of A. theophrasti as a novel natural antioxidant and antibacterial agents.

4. Conclusions

This study successfully constructed and verified an UARE method, achieving efficient extraction of phenolic acids from A. theophrasti leaves. Furthermore, the antioxidant and antibacterial activities of the extract were systematically investigated. The results indicated that under the optimized extraction conditions, the extraction yield of total phenolic acid reached 213.29 μg/g. The yield was significantly higher than those obtained using traditional extraction methods. Therefore, this method shows advantages in extraction efficiency and time. Moreover, six phenolic acid compounds, GA, PA, CA, VA, SA, and PHCA were separated and identified from the A. theophrasti leaf extract, and a corresponding HPLC-based quantitative analysis method was established. Antioxidant activity assays demonstrated that the leaf extract and the separated phenolic acids exhibited antioxidant capacities, with GA, PA, and SA showing particularly prominent activities. Antibacterial experiments revealed that the A. theophrasti leaf extract possessed broad-spectrum antibacterial activity, and there was a positive correlation between phenolic acid content and antibacterial efficacy. The antioxidant and antibacterial activities of these compounds were systematically evaluated, confirming the potential of A. theophrasti and its phenolic acid components as sources of natural bioactive substances. It not only provides a scientific basis for the resource utilization, but also provides a synergistic technical strategy for the extraction, analysis and activity of natural phenolic compounds. Additionally, cytotoxicity profiling remains to be performed, and cytotoxicity assays will explore deeply to comprehensively assess biomedical applicability in future work.

Supplementary Materials

The following supporting information can be downloaded at https://www.mdpi.com/article/10.3390/separations12110288/s1. Figure S1: Mass spectrum (a), 1H NMR spectrum (b), 13C NMR spectrum (C) of gallic acid; Figure S2: Mass spectrum (a), 1H NMR spectrum (b), 13C NMR spectrum (C) of protocatechuic acid; Figure S3: Mass spectrum (a), 1H NMR spectrum (b), 13C NMR spectrum (C) of chlorogenic acid; Figure S4: Mass spectrum (a), 1H NMR spectrum (b), 13C NMR spectrum (C) of vanillic acid; Figure S5: Mass spectrum (a), 1H NMR spectrum (b), 13C NMR spectrum (C) of syringic acid; Figure S6: Mass spectrum (a), 1H NMR spectrum (b), 13C NMR spectrum (C) of p-Hydroxy cinnamic acid.

Author Contributions

Conceptualization, X.X. and C.Z.; methodology, W.Z., Q.L. (Qi Liang), Y.Y., C.Z. and C.L.; software, J.L. and Y.Y.; validation, J.L. and Y.Y.; formal analysis, X.X., Q.L. (Qi Liang) and K.C.; investigation, W.Z. and Q.L. (Quanyu Lin), Q.L. (Qi Liang); resources, C.Z.; writing—original draft preparation, X.X.; writing—review and editing, K.C. and Q.L. (Quanyu Lin); visualization C.Z.; supervision, C.L.; project administration, C.Z.; funding acquisition, C.Z. and C.L. All authors have read and agreed to the published version of the manuscript.

Funding

This research was funded by the Heilongjiang Provincial Fund Program for Returned Overseas Students, grant number LC2017005.

Data Availability Statement

The original contributions presented in this study are included in the article/Supplementary Materials. Further inquiries can be directed to the corresponding authors.

Conflicts of Interest

The authors declare no conflicts of interest.

References

  1. Rico, C.M.; Wagner, D.C.; Ofoegbu, P.C.; Kirwa, N.J.; Clubb, P.; Coates, K.; Zenobio, J.E.; Adeleye, A.S. Toxicity assessment of perfluorooctanesulfonic acid (PFOS) on a spontaneous plant, velvetleaf (Abutilon theophrasti), via metabolomics. Sci. Total Environ. 2024, 907, 167894. [Google Scholar] [PubMed]
  2. Sandhya, K.; Bhagavanth Reddy, G.; Ayodhya, D.; Venkatesh, B.; Noorjahan, M.; Girija Mangatayaru, K. Biogenic and hydrothermal synthesis, characterization, antioxidant and anticancer activities of PdNPs using Abutilon indicum leaf extract. Inorg. Chem. Commun. 2024, 166, 112629. [Google Scholar] [CrossRef]
  3. Tian, C.; Wang, H.; Guo, Y.; Qiu, P.; Cui, C.; Liu, M. Abutilon theophrasti medic. Episperms as a total flavonoids fraction for pharmaceutical applications: In vitro antioxidant, antibacterial, anti-inflammatory activities, extraction technology and HPLC-MS profiles. Ind. Crops Prod. 2019, 134, 100–106. [Google Scholar]
  4. Mata, R.; Nakkala, J.R.; Sadras, S.R. Biogenic silver nanoparticles from Abutilon indicum: Their antioxidant, antibacterial and cytotoxic effects in vitro. Colloids Surf. B Biointerfaces 2015, 128, 276–286. [Google Scholar] [PubMed]
  5. Ashokkumar, V.; Flora, G.; Sevanan, M.; Sripriya, R.; Chen, W.H.; Park, J.-H.; Rajesh Banu, J.; Kumar, G. Technological advances in the production of carotenoids and their applications- A critical review. Bioresour. Technol. 2023, 367, 128215. [Google Scholar] [CrossRef]
  6. More, P.R.; Jambrak, A.R.; Arya, S.S. Green, environment-friendly and sustainable techniques for extraction of food bioactive compounds and waste valorization. Trends Food Sci. Technol. 2022, 128, 296–315. [Google Scholar] [CrossRef]
  7. Luo, F.; Zeng, F.; Zhao, Z.; Ren, X.; He, Y.; Yang, X.; Zhang, F.; Pang, H.; Shi, W. A novel green and efficient strategy for natural products by extraction with acidic electrolytic oxidation water-assisted deep eutectic solvent. ACS Sustain. Chem. Eng. 2025, 13, 9316–9330. [Google Scholar] [CrossRef]
  8. Saini, N.; Anmol, A.; Kumar, S.; Wani, A.W.; Bakshi, M.; Dhiman, Z. Exploring phenolic compounds as natural stress alleviators in plants-a comprehensive review. Physiol. Mol. Plant Pathol. 2024, 133, 102383. [Google Scholar]
  9. Hashempour, H.; Mohammadnejad, M.; Moharrami, S. Development of cold plasma pretreatment ultrasound-assisted extraction for enhancing phenolic acids extractability from Salvia sclarea. Microchem. J. 2024, 207, 112052. [Google Scholar] [CrossRef]
  10. Zhu, X.; Cheng, Y.; Chen, P.; Peng, P.; Liu, S.; Li, D.; Ruan, R. Effect of alkaline and high-pressure homogenization on the extraction of phenolic acids from potato peels. Innov. Food Sci. Emerg. Technol. 2016, 37, 91–97. [Google Scholar] [CrossRef]
  11. Zhu, C.; Lin, Z.; Jiang, H.; Wei, F.; Wu, Y.; Song, L. Recent advances in the health benefits of phenolic acids in whole grains and the impact of processing techniques on phenolic acids: A Comprehensive Review. J. Agric. Food Chem. 2024, 72, 24131–24157. [Google Scholar] [CrossRef]
  12. Sahu, S.; Kumari, D.; Kusam; Kuila, A.; Gurjar, R.S.; Sharma, K.; Verma, R. Deep eutectic solvent extraction of polyphenol from plant materials: Current status and future prospects in food applications. Food Chem. 2025, 482, 144125. [Google Scholar]
  13. Duan, S.; Kwon, S.J.; Jeong, D.Y.; Kim, J.H.; Park, Y.R.; Kim, C.K.; Kim, J.-H.; Eom, S.H. Antioxidant activities in Kenaf (Hibiscus cannabinus) shoots during growth stages and destination of chlorogenic acid and kaempferol glycosides. Antioxidants 2024, 13, 532. [Google Scholar] [CrossRef]
  14. Cao, S.; Liang, J.; Chen, M.; Xu, C.; Wang, X.; Qiu, L.; Zhao, X.; Hu, W. Comparative analysis of extraction technologies for plant extracts and absolutes. Front. Chem. 2025, 13, 1536590. [Google Scholar] [CrossRef]
  15. Liang, Y.F.; Wen, Q.; Yang, Z.F.; Li, C.Q.; Li, F.R. Optimization of ultrasound-assisted extraction of glycyrrhizic acid and glabridin from Glycyrrhiza glabra L. using response surface methodology and development of a green analytical method. Sustain. Chem. Pharm. 2024, 37, 101385. [Google Scholar] [CrossRef]
  16. Peng, W.; Wang, Y.; Wang, L.; Wang, W.; Huang, J.; Zhou, R.; Bo, R.; Liu, C.; Liu, M.; Li, J. Eco-friendly extraction of polysaccharides from Moringa oleifera Lam. leaves using COSMO-RS screened natural deep eutectic solvents. Food Res. Int. 2025, 217, 116859. [Google Scholar]
  17. Wijesekara, T.; Xu, B. A critical review on the stability of natural food pigments and stabilization techniques. Food Res. Int. 2024, 179, 114011. [Google Scholar] [CrossRef]
  18. Wang, Z.; Wang, D.; Fang, J.; Song, Z.; Geng, J.; Zhao, J.; Fang, Y.; Wang, C.; Li, M. Green and efficient extraction of flavonoids from Perilla frutescens (L.) Britt. leaves based on natural deep eutectic solvents: Process optimization, component identification, and biological activity. Food Chem. 2024, 452, 139508. [Google Scholar] [CrossRef] [PubMed]
  19. Wang, S.; Lei, T.; Liu, L.; Tan, Z. CO2-responsive deep eutectic solvents for the enhanced extraction of hesperidin from Fertile orange peel. Food Chem. 2024, 432, 137255. [Google Scholar] [PubMed]
  20. Niu, L.; Zhang, S.; Si, X.; Fang, Y.; Wang, S.; Li, L.; Sheng, Z. Ultrasonic-assisted extraction of luteolin from peanut shells using ionic liquid and its molecular mechanism. Ultrason. Sonochemistry 2025, 113, 107228. [Google Scholar] [CrossRef] [PubMed]
  21. Jha, A.K.; Sit, N. Extraction of bioactive compounds from plant materials using combination of various novel methods: A review. Trends Food Sci. Technol. 2022, 119, 579–591. [Google Scholar] [CrossRef]
  22. Mungwari, C.P.; King’ondu, C.K.; Sigauke, P.; Obadele, B.A. Conventional and modern techniques for bioactive compounds recovery from plants: Review. Sci. Afr. 2025, 27, e02509. [Google Scholar] [CrossRef]
  23. Meng, Y.; Yang, H.; Li, Z.; Zhang, W.; Guo, L.; Zhang, Y.; Jiang, Y. Intelligent transformation of ultrasound-assisted novel solvent extraction plant active ingredients: Tools for machine learning and deep learning. Food Chem. 2025, 486, 144649. [Google Scholar] [CrossRef]
  24. Belokurov, S.S.; Narkevich, I.A.; Flisyuk, E.V.; Kaukhova, I.E.; Aroyan, M.V. Modern extraction methods for medicinal plant raw material (review). Pharm. Chem. J. 2019, 53, 559–563. [Google Scholar] [CrossRef]
  25. Nisoa, M.; Kaewpradit, S.; Nahar, L.; Sarker, S.D.; Charoensup, R.; Puttarak, P.; Yusakul, G. Extraction of curcumin and curcuminoids: From conventional methods to innovative extraction using deep eutectic solvents. Microchem. J. 2025, 215, 114269. [Google Scholar] [CrossRef]
  26. Musilová, J.; Franková, H.; Fedorková, S.; Lidiková, J.; Vollmannová, A.; Sulírová, K.; Árvay, J.; Kasal, P. Comparison of polyphenols, phenolic acids, and antioxidant activity in sweet potato (Ipomoea batatas L.) tubers after heat treatments. J. Agric. Food Res. 2024, 18, 101271. [Google Scholar] [CrossRef]
  27. Liu, J.; Wang, T.; Huang, B.; Zhuang, Y.; Hu, Y.; Fei, P. Pectin modified with phenolic acids: Evaluation of their emulsification properties, antioxidation activities, and antibacterial activities. Int. J. Biol. Macromol. 2021, 174, 485–493. [Google Scholar] [CrossRef]
  28. Yin, R.; Jiang, J.; Ma, X.; Xie, Y.; Cui, M.; Chen, Y.; Li, Y.; Hu, Y.; Cheng, W.; Gao, F. Dynamic changes of physicochemical parameters, antioxidant activity, organic acids, polyphenols, and volatile components in prune vinegar during fermentation. Food Biosci. 2024, 59, 104042. [Google Scholar] [CrossRef]
  29. Babaei-Rad, S.; Mumivand, H.; Mollaei, S.; Khadivi, A. Postharvest UV-B and UV-C treatments combined with fermentation enhance the quality characteristics of Capparis spinosa L. fruit, improving total phenols, flavonoids, anthocyanins, phenolic acids, and antioxidant activity. Food Chem. 2025, 483, 144306. [Google Scholar] [CrossRef] [PubMed]
  30. Pérez, M.; Dominguez-López, I.; Lamuela-Raventós, R.M. The chemistry behind the Folin-Ciocalteu method for the estimation of (Poly) phenol content in food: Total phenolic intake in a mediterranean dietary pattern. J. Agric. Food Chem. 2023, 71, 17543–17553. [Google Scholar] [PubMed]
  31. Donoso-Bustamante, V.; Osorio, E.; Arias-Santé, M.F.; De Camargo, A.C.; Rincón-Cervera, M.Á.; Amalraj, J.; Carrasco, B.; Palomo, I.; Araya-Maturana, R. Antioxidant activity of sinapic acid anilides: DPPH, ABTS, FRAP, electrochemical and theoretical analysis. LWT 2025, 222, 117656. [Google Scholar] [CrossRef]
  32. Atoui, A.K.; Mansouri, A.; Boskou, G.; Kefalas, P. Tea and herbal infusions: Their antioxidant activity and phenolic profile. Food Chem. 2005, 89, 27–36. [Google Scholar] [CrossRef]
  33. Liu, Q.; Kong, B.; Xiong, Y.L.; Xia, X. Antioxidant activity and functional properties of porcine plasma protein hydrolysate as influenced by the degree of hydrolysis. Food Chem. 2010, 118, 403–410. [Google Scholar] [CrossRef]
  34. Wang, L.; Mu, W.; Liu, Y.; Wang, X.; Zheng, X. Antibacterial properties of reduced graphene oxide fibers fabricated by hydrothermal method. J. Ind. Eng. Chem. 2025, 141, 297–304. [Google Scholar]
  35. Li, Y.; Mu, Y.; Cao, Y.; Xu, D.; Liu, X.; Xu, G. Synthesis and evaluation of novel 1-methyl-1h-pyrazol-5-amine derivatives with disulfide moieties as potential antimicrobial agents. J. Agric. Food Chem. 2024, 72, 20658–20669. [Google Scholar]
  36. Xu, R.; Chen, K.; Han, X.; Lou, Y.; Gu, S.; Gao, Y.; Shang, S.; Song, Z.; Song, J.; Li, J. Design and synthesis of antifungal candidates containing triazole scaffold from natural rosin against valsa mali for crop protection. J. Agric. Food Chem. 2023, 71, 9718–9727. [Google Scholar] [CrossRef]
  37. Kowalska-Krochmal, B.; Dudek-Wicher, R. The minimum inhibitory concentration of antibiotics: Methods, interpretation, clinical relevance. Pathogens 2021, 10, 165. [Google Scholar] [CrossRef]
  38. Fu, M.; Sun, X.; Fei, C.; Li, D.; Zhang, D.; Tuo, X.; Gao, S.; Han, X.; Xiu, J.; Wang, J.; et al. Optimization and characterization of pectin extracted from hawthorn by deep eutectic solvent. Int. J. Biol. Macromol. 2024, 256, 128688. [Google Scholar]
  39. Gong, J.; Tian, M.; Liu, Y.; Zhang, Y.; Xing, J.; Liang, Q.; Xie, X.; Li, C.; Zhao, C. Smart dual-responsive ionic liquid as transformable and recyclable media for extracting and separating phytochemicals from Wild Rumex acetosa L. ACS Sustain. Chem. Eng. 2025, 13, 251–266. [Google Scholar] [CrossRef]
  40. Cheng, J.; Tian, M.; Gul, Z.; Liang, C.; Qiao, B.; Gao, Y.; Zhao, C.; Li, C. pH-responsive functionalized surface active ionic liquid as an enhanced medium for efficient extraction and in-situ separation of flavonoids in Vitex negundo L. Leaves. Microchem. J. 2023, 193, 109080. [Google Scholar] [CrossRef]
  41. Nie, F.; Feng, C.; Ahmad, N.; Tian, M.; Liu, Q.; Wang, W.; Lin, Z.; Li, C.; Zhao, C. A new green alternative solvent for extracting echinacoside and acteoside from Cistanche deserticola based on ternary natural deep eutectic solvent. J. Ind. Eng. Chem. 2023, 118, 499–510. [Google Scholar] [CrossRef]
  42. Qin, L.; Yang, L.; Yang, J.; Weber, R.; Ranguelova, K.; Liu, X.; Lin, B.; Li, C.; Zheng, M.; Liu, G. Photoinduced formation of persistent free radicals, hydrogen radicals, and hydroxyl radicals from catechol on atmospheric particulate matter. iScience 2021, 24, 102193. [Google Scholar] [CrossRef] [PubMed]
  43. Chen, J.; Yang, J.; Ma, L.; Li, J.; Shahzad, N.; Kim, C.K. Structure-antioxidant activity relationship of methoxy, phenolic hydroxyl, and carboxylic acid groups of phenolic acids. Sci. Rep. 2020, 10, 2611. [Google Scholar] [PubMed]
  44. Chen, X.; Lan, W.; Xie, J. Natural phenolic compounds: Antimicrobial properties, antimicrobial mechanisms, and potential utilization in the preservation of aquatic products. Food Chem. 2024, 440, 138198. [Google Scholar] [CrossRef] [PubMed]
  45. Gulcin, İ.; Alwasel, S.H. Fe3+ reducing power as the most common assay for understanding the biological functions of Antioxidants. Processes 2025, 13, 1296. [Google Scholar] [CrossRef]
  46. Hao, J.W.; Wang, W.T.; Chen, N.D.; Shen, Y. Identification of 13 natural antioxidants in green calyx plum using AAPH, ABTS, and FRAP-coupled HPLC-DAD via QTOF-MS/MS. Food Chem. 2025, 477, 143568. [Google Scholar]
  47. Yang, J.; Chen, J.; Hao, Y.; Liu, Y. Identification of the DPPH radical scavenging reaction adducts of ferulic acid and sinapic acid and their structure-antioxidant activity relationship. LWT 2021, 146, 111411. [Google Scholar] [CrossRef]
  48. Bayram, I.; Decker, E.A. Underlying mechanisms of synergistic antioxidant interactions during lipid oxidation. Trends Food Sci. Technol. 2023, 133, 219–230. [Google Scholar] [CrossRef]
  49. Faúndez, X.; Báez, M.E.; Martínez, J.; Zúñiga-López, M.C.; Espinoza, J.; Fuentes, E. Evaluation of the generation of reactive oxygen species and antibacterial activity of honey as a function of its phenolic and mineral composition. Food Chem. 2023, 426, 136561. [Google Scholar] [CrossRef]
Figure 1. Process diagram of extraction, separation, and identification of phenolic acid from A. theophrasti.
Separations 12 00288 g001
Figure 2. Effects of extraction time (A), ultrasonic power (B), liquid–solid ratio (C), and different extraction methods (D) on extraction yield of total phenolic acids.
Separations 12 00288 g002
Figure 3. The effects of different factors on the extraction yield of total phenolic acids in extract.
Separations 12 00288 g003
Figure 4. SEM image of raw materials (A), reflux extract (B), ultrasonic extract (C), and UARE extract (D).
Separations 12 00288 g004
Figure 5. The HPLC chromatogram of six phenolic acids (A), stem extract (B), leaf extract (C), and root extract (D), 1–6: GA, PA, CA, VA, SA, and PHCA, respectively. The contents of six compounds in different parts of A. theophrasti (E).
Separations 12 00288 g005
Figure 6. The contents of six compounds in different parts of total antioxidant capacities of extracts in different parts of A. theophrasti and six phenolic acids.
Separations 12 00288 g006
Figure 7. DPPH radical scavenging activity of extracts from different part of A. theophrasti (A) and six phenolic acids (B), ABTS radical scavenging activity of extracts in different parts of A. theophrasti (C), and six phenolic acids (D).
Separations 12 00288 g007
Figure 8. Correlation of total phenolic acids, six phenolic compounds in A. theophrasti leaf extracts, and their antioxidant activity. * indicates a significant correlation (p < 0.05), and ** indicates an extremely significant correlation (p < 0.01).
Separations 12 00288 g008
Figure 9. The antimicrobial effect of extracts from different parts in A. theophrasti (a) and positive control (b). A to E represent different types of tested bacteria. A is S. aureus, B is P. aeruginosa, C is E. coli, D is C. albicans, and E is B. subtilis. 1: the root extract; 2: the leaf extract; 3: the stem extract; 4: distilled water; 5: streptomycin; 6: fluconazole.
Separations 12 00288 g009
Figure 10. The antimicrobial effect of six phenolic acids. 1: PA; 2: CA; 3: GA; 5: VA; 6: PHCA; 7: SA; both 4 and 8 are water controls; (AE) represent different tested bacterial species, (A) is E. coli, (B) is P. aeruginosa, (C) is S. aureus, (D) is B. subtilis, and (E) is C. albicans.
Separations 12 00288 g010
Figure 11. The MIC of selected bacteria (mg/mL) for extracts from different parts of A. theophrasti.
Separations 12 00288 g011
Table 1. The experimental designs and results of Box–Behnken.
NO.FactorY (μg/g)
X1 (mL/g)X2 (min)X3 (W)
13025250193.71
23530150196.08
32535200191.54
43030200211.96
53030200213.29
63030200215.96
73030200217.29
83025150186.66
93035150187.62
103530250199.97
112530150189.47
123035250191.74
133525200198.29
143535200196.59
152530250196.82
162525200193.84
173030200215.96
Table 2. Results of ANOVA statistics analysis.
SourceSum of SquaresF-Valuep-Value
Model1767.44100.19<0.0001
X132.6816.670.0047
X223.2911.880.0107
X370.4535.940.0005
X1X23.741.910.2094
X1X30.05290.0270.8742
X2X30.250.12750.7315
X12364.11185.75<0.0001
X22305.95156.08<0.0001
X32804.96410.65<0.0001
Residual13.72
Lack of fit4.460.6430.6266
R20.9923
Adjusted-R20.9824
Table 3. The inhibition zone of extracts from different parts in A. theophrasti.
Diameter (mm)Concentration (mg/mL)
20010050251052.510.50.250
RootSt15.012.49.09.09.09.09.09.09.09.09.0
Es10.89.09.09.09.09.09.09.09.09.09.0
Bs12.29.09.09.09.09.09.09.09.09.09.0
Ca11.89.09.09.09.09.09.09.09.09.09.0
Pa12.39.09.09.09.09.09.09.09.09.09.0
StemSt13.69.09.09.09.09.09.09.09.09.09.0
Es10.99.09.09.09.09.09.09.09.09.09.0
Bs11.19.09.09.09.09.09.09.09.09.09.0
Ca11.09.09.09.09.09.09.09.09.09.09.0
Pa10.09.09.09.09.09.09.09.09.09.09.0
LeafSt16.814.611.29.09.09.09.09.09.09.09.0
Es12.310.89.09.09.09.09.09.09.09.09.0
Bs15.89.09.09.09.09.09.09.09.09.09.0
Ca14.111.29.09.09.09.09.09.09.09.09.0
Pa14.711.09.09.09.09.09.09.09.09.09.0
Note. St: Staphylococcus aureus; Es: Escherichia coli; Bs: Bacillus subtilis; Ca: Candida albicans; and Pa: Pseudomonas aeruginosa.
Table 4. The inhibition zone of extracts from six phenolic acids in A. theophrasti.
Diameter (mm)Concentration (mg/mL)
1005025105
GASt25.014.59.29.09.0
Es13.311.49.09.09.0
Bs20.513.511.29.49.0
Ca22.819.615.210.19.0
Pa19.912.99.09.09.0
PASt23.213.39.09.09.0
Es16.913.510.59.09.0
Bs21.012.79.99.09.0
Ca22.120.29.09.09.0
Pa17.515.69.09.09.0
CASt12.510.29.09.09.0
Es10.29.99.09.09.0
Bs18.813.39.09.09.0
Ca17.712.09.09.09.0
Pa12.710.29.09.09.0
VASt17.616.015.414.511.6
Es12.011.210.79.69.0
Bs13.312.111.410.59.0
Ca16.615.914.89.09.0
Pa15.614.213.912.19.0
SASt16.815.113.511.29.0
Es10.89.79.09.09.0
Bs9.09.09.09.09.0
Ca9.09.09.09.09.0
Pa11.29.79.09.09.0
PHCASt14.612.39.09.09.0
Es9.09.09.09.09.0
Bs15.314.011.49.09.0
Ca11.110.510.39.09.0
Pa15.913.211.29.09.0
Note. St: S. aureus; Es: E. coli; Bs: B. subtilis; Ca: C. albicans; and Pa: P. aeruginosa; GA: gallic acid; PA: protocatechuic acid; CA: chlorogenic acid; VA: vanillic acid; SA: syringic acid; and PHCA: p-hydroxybenzoic acid.
Table 5. The relative inhibitory activities of the six phenolic acids against the five bacterial strains in A. theophrasti.
SampleDsample (mm)Dcontrol (mm)Ddisk (mm)RIA (%)
GASt14.520.49.048.2
Es11.424.89.015.2
Bs13.530.69.020.8
Ca19.626.59.060.6
Pa12.926.49.022.4
PASt13.320.49.037.7
Es13.524.89.028.5
Bs12.730.69.017.4
Ca20.226.59.064.0
Pa15.626.49.038.0
CASt10.220.49.010.5
Es9.924.89.05.7
Bs13.330.69.019.9
Ca12.026.59.017.1
Pa10.226.49.06.9
VASt16.020.49.061.4
Es11.224.89.013.9
Bs12.130.69.014.9
Ca15.926.59.039.4
Pa14.226.49.029.9
SASt15.120.49.053.3
Es9.724.89.04.4
Bs9.030.69.00.0
Ca9.026.59.00.0
Pa9.726.49.04.0
PHCASt12.320.49.029.5
Es9.024.89.00.0
Bs14.030.69.023.2
Ca10.526.59.08.6
Pa13.226.49.024.1
Note. St: Staphylococcus aureus; Es: Escherichia coli; Bs: Bacillus subtilis; Ca: Candida albicans; and Pa: Pseudomonas aeruginosa; GA: gallic acid; PA: protocatechuic acid; CA: chlorogenic acid; VA: vanillic acid; SA: syringic acid; and PHCA: p-hydroxybenzoic acid; RIAs: relative inhibitory activities.
Table 6. The MIC of selected bacteria for six phenolic acids.
MIC (mg/mL)
S. aureusC. albicansP. aeruginosaB. subtilisE. coli
GA1512.5307.535
PA3030352015
CA4545354545
VA2.512.57.57.57.5
SA7.5-45-45
PHCA40351520-
PC0.1250.1250.50.250.5
Note. GA: gallic acid; PA: protocatechuic acid; CA: chlorogenic acid; VA: vanillic acid; SA: syringic acid; and PHCA: p-hydroxybenzoic acid, PC: positive control.
Disclaimer/Publisher’s Note: The statements, opinions and data contained in all publications are solely those of the individual author(s) and contributor(s) and not of MDPI and/or the editor(s). MDPI and/or the editor(s) disclaim responsibility for any injury to people or property resulting from any ideas, methods, instructions or products referred to in the content.