Article

Process Design and Optimisation Analysis for the Production of Ultra-High-Purity Phosphine

1
School of Chemical Engineering, Hebei University of Technology, Tianjin 300130, China
2
Key Laboratory of Pollution Processes and Environmental Criteria, Ministry of Education, Tianjin 300350, China
3
Tianjin Key Laboratory of Environmental Remediation and Pollution Control, Tianjin 300350, China
4
Tianjin Engineering Center of Environmental Diagnosis and Contamination Remediation, Tianjin 300350, China
5
College of Environmental Science and Engineering, Nankai University, Tianjin 300350, China
*
Author to whom correspondence should be addressed.
Separations 2025, 12(10), 274; https://doi.org/10.3390/separations12100274
Submission received: 4 August 2025 / Revised: 14 September 2025 / Accepted: 18 September 2025 / Published: 9 October 2025

Abstract

With the increasing demand to scale the chip industry, attention is turning to the vital role that phosphanes and silanes play in semiconductor manufacturing processes such as chemical vapor deposition, plasma etching, and impurity doping. High-performance semiconductors often require a supply of ultra-pure gaseous phosphine (≥99.999%) to ensure the formation of defect-free thin-film structures with high integrity and strong functionality. In recent years, research on high-purity PH3 synthesis methods has mainly focused on two pathways: the acidic route with fewer side reactions, high by-product economics, and higher exergy of high-purity PH3, and the alkaline alternative with greater potential for practical application through lower reaction temperatures and a simpler reaction process. This paper presents the first comparative study and analysis on the preparation of ultra-high-purity PH3 and its process energy consumption. Using Aspen and its related software, the energy consumption and cost issues are discussed, and the process heat exchange network is established and optimised. By combining Aspen Plus V14 with MATLAB 2023, an artificial neural network (ANN) prediction model is established, and the parameters of the distillation section equipment are optimised through the NSGA-II model to solve problems such as low product yield and large equipment exergy loss. After optimisation, it can be found that in terms of energy consumption and cost indicators, the acidic process has greater advantages in large-scale production of high-purity PH3. The total energy consumption of the acidic process is 1.6 × 10⁸ kJ/h, which is only one-third that of the alkaline process, while the cost of the heat exchange equipment is approximately three-quarters that of the alkaline process. Through dual-objective optimisation, the exergy loss of the acidic distillation part can be reduced by 1714.1 kW, and the economic cost can be reduced by USD 3673. Therefore, from the perspective of energy usage and equipment manufacturing, the comprehensive analysis of the acidic process has more advantages than that of the alkaline process.

1. Introduction

As a colourless, highly toxic, and flammable gas, phosphine (PH3) has become one of the important directions of industrial gas research in recent years as its application in chemical, semiconductor, and environmental protection fields has gradually expanded. In the semiconductor field, the research and application of high-purity PH3 are quite extensive. High-purity PH3 is the main phosphorus source for N-type doping, and after high-temperature decomposition, phosphorus atoms can be doped and diffused into the silicon lattice [1] to regulate the electrical conductivity of silicon. The high purity of PH3 can also be used for the synthesis of phosphorus-based thin films via chemical vapor deposition (CVD) and atomic layer deposition (ALD) [2,3,4], as an alternative to the traditional POCl3 for reducing pollution. As semiconductor nodes micronise to below 7 nm, trace impurities in PH3 are likely to lead to threshold voltage drift, resulting in junction leakage, and thus the demand for PH3 purity (typically ≥99.9999%) is increasing [5,6]. High-purity PH3 has gradually become an indispensable material in semiconductor fabrication, and its purity directly affects device performance and exergy.
Currently, PH3 is mainly produced using chemical synthesis and hydrolysis of metal phosphides. In traditional processes, PH3 is prepared by the reaction of calcium phosphate with water [7], but the reaction process produces excessive impure gases, which lead to the difficulty of purification in the subsequent production of high-purity PH3. Hydrolysis of metal phosphides mainly uses aluminium phosphide or zinc phosphide and water reaction to obtain pure PH3, which can only be used in the production of small-scale high-purity PH3 due to the high cost of raw materials and as they are difficult to obtain. Furthermore, it is difficult to put into practical application. Accordingly, our research focus is on the preparation of PH3 by the simpler acidic and alkali methods. For the acidic method, phosphoric acid is used as a catalyst and a reusable reaction solution, while red phosphorus is used as the sole raw material to produce highly effective and high-purity phosphine, which is beneficial for subsequent high-purity processing. The alkaline method uses long-chain alcohols as dispersants to react P4 with NaOH to obtain PH3. Due to the simple reaction conditions and mild reaction process, this method has been applied in practical production for more than 50 years.
As a core foundational material in high-end manufacturing sectors (semiconductors, artificial intelligence, photovoltaics, etc.), the efficiency and energy consumption of specialty gas purification processes directly determine the technological upper limits of downstream industries [8,9]. The primary methods for purifying specialty gas include adsorption, distillation, and membrane separation [10,11]. In order to meet the demand of the semiconductor industry for electronic-grade, high-purity acetylene [7], it is necessary to purify industrial acetylene through adsorption and desorption experiments, which are relatively simple to operate and low cost. But the adsorbent has a limited adsorption capacity and needs to be replaced or regenerated periodically. The current main research focus is thus concentrated on the design and study of adsorption catalysts. Xia et al. developed a Zr-PMA framework that achieved a purity of over 5N for C3H8 at room temperature through a “pore size–electrostatic potential matching” design [12]. Cai et al. [13] reported a flexible metal–organic framework (Ca-TCPb) with a temperature-controlled gating mechanism, which was able to effectively separate C3F8 and C3F6, and which could directly separate C3F8 with a purity of over 99.999%, which is of great significance for the electronics industry [14,15]. For phosphorus-containing specialty gases (e.g., PH3), the challenge lies in separating impurities (such as AsH3, H2, N2) that share similar physicochemical properties with PH3, are highly toxic, and present greater separation difficulties. Existing technologies lack highly selective adsorbents specifically designed for the PH3 molecular structure, and traditional purification processes (e.g., cryogenic adsorption, chemical absorption) struggle to simultaneously meet 6N-grade purity requirements and industrial energy consumption standards. Membrane separation technology is constrained by material selectivity and corrosion resistance [16]. Prolonged use may lead to performance degradation of the separation membrane due to erosion by the separated substances. Distillation is a process that separates different components in a mixture by taking advantage of the differences in boiling points of various substances. It involves multiple evaporation and condensation steps to enhance the purity of the gas. Choosing an appropriate purification method can effectively improve the purity and exergy efficiency of ultra-high-purity special gases. When dealing with the separation of large amounts of gases, distillation, with its low cost and high efficiency, can better meet practical applications. Also, considering that PH3 is a toxic flammable gas, when obtaining high-purity PH3 with a purity greater than 6N, low-temperature distillation for separation and purification is recommended.
In the context of sustainable development and green manufacturing, the design of the separation process needs to take into account product quality, energy consumption control, and environmental impact. The traditional design methods that rely on experience or simplified models are no longer sufficient to meet the requirements of precise optimisation, and gradient algorithms are prone to becoming stuck in local optima [17]. Therefore, an integrated simulation and intelligent optimisation hybrid platform has become a breakthrough direction. Song et al. [18] built an ActiveX interface between Aspen HYSYS and MATLAB, and they used the genetic algorithm (GA) and NSGA-II to achieve single-objective and multi-objective optimisation, respectively, reducing the energy consumption of the nitrogen expansion liquefaction process by 15.2% and increasing the liquefaction rate to 0.81. Similarly, Nishiyama et al. [19] used the MEIGO plugin of Aspen Plus and MATLAB to optimise the glycerol ketalisation process, reducing the reactor volume to 24.17 m3 at a 80% conversion rate. In the study of the separation process, algorithms can also demonstrate unique advantages: the GA is good at global optimisation of single objectives, while NSGA-II achieves coordinated optimisation of energy consumption and yield through Pareto sorting [20]; meanwhile, MEIGO can efficiently handle constrained optimisation problems of black-box models [19]. Economic analysis shows that multi-objective optimisation results have more advantages in analysing energy and investment payback periods [16,21]. By optimising energy losses in the separation process through exergy analysis, the application value of simulation–optimisation integration technology in complex chemical systems can be clearly illustrated, providing methodological support for energy-efficient utilisation and a resource circular economy. However, in the field of gas purification, there is currently no research on the purification of high-purity phosphine by analysing algorithms. Therefore, the two processes of producing high-purity PH3 using acidic and alkali methods will be simulated separately, and a comprehensive comparison will be made from the perspective of exergy efficiency. Aspen Plus is a widely used chemical process simulation software. For gas/liquid systems, Aspen Plus includes mixers, separators, flash modules, heat exchangers, reactors, pumps, and compressors for various types of multi-stage gas–liquid separation operations [22]. It can directly simulate core separation units in purification processes and output key metrics such as energy consumption and component recovery rates through its results analysis module [18,23]. Therefore, in this paper, we used the Aspen Plus V14 software to analyse and optimise the costs and energy required in the process flow, and we utilised the MATLAB 2023 software to conduct an optimisation study on various equipment parameters that affect the exergy efficiency of the process emissions. We obtained the optimal solution for the entire process. Our research provide new ideas for the field of high-purity gas production and offer a reference for subsequent high-purity gas production work. The work in this paper has guiding significance for the exergy efficiency and process optimisation of high-purity gases.

2. Feed Parameters and Process Assumptions

In the acidic process, we used phosphoric acid as a catalyst to generate PH3 by disproportionation reaction between yellow phosphorus and water at 280 °C, and we carried out subsequent distillation to obtain high-purity phosphine; the specific feed parameters are shown in Table 1. The alkaline process uses sodium hydroxide to react with molten P4, and the by-product method obtains PH3, followed by distillation and purification operations. The feed parameters are shown in Table 2. However, the alkaline process will produce the by-product H2 to affect the purity of the overall PH3, so it should be treated in the subsequent purification. The specific reactions are as follows:
Acidic process primary reaction:
2 P 4 + 12 H 2 O 5 PH 3 + 3 H 3 PO 4
Alkaline process primary reaction:
P 4 + 3 NaOH + 3 H 2 O 3 NaH 2 PO 2 + PH 3
NaH 2 PO 2 + NaOH H 2 + Na 2 H PO 3
Since the alkaline process produces a large amount of NaH2PO2 and Na2HPO3 with low commercial value, it is difficult to subsequently recycle them. Due to the low-valence phosphorus forms of NaH2PO2 and Na2HPO3, we consider producing PH3 through secondary utilisation. After separating NaH2PO2 and Na2HPO3 by adding phosphoric acid to the distillate, NaH2PO2 and Na2HPO3 can be added to the distillate. Then, PH3 is produced by thermal decomposition of NaH2PO2 and Na2HPO3 in the temperature range of 190–310 °C and then distilled into a purification distillation tower to obtain high-purity PH3. The secondary pyrolysis of by-products can greatly improve the overall exergy and utilisation of PH3 in the alkaline process. The specific reactions are as follows:
2 NaH 2 PO 2 H 2 O + H 3 PO 4 PH 3 + 2 NaH 2 PO 4 + 2 H 2 O
4 Na 2 HPO 3 5 H 2 O + 5 H 3 PO 4 PH 3 + 8 NaH 2 PO 4 + 20 H 2 O
Based on a typical high-purity PH3 production device, the initial reaction pressure is set to 0.1 MPa, the temperature is set to 25 °C, and the impure gas content is within the normal production range. Before simulating the entire reaction process, the following assumptions should be made: (1) simplify the analysis process and ignore the product compression, drying, and transportation processes; and (2) the system operates in a steady state, ignoring the pressure drop in the tower and pipeline. The heat transfer process remains adiabatic, without considering the heat dissipation of the equipment. The pressure and heat losses of the pump, pressure-reducing valve, and heat exchanger are ignored. This paper employs the Electrolyte-NRTL (ELECNRTL) model to describe the aforementioned process system. The Aspen Plus V14 software is used to simulate the thermodynamics and kinetics of acidic and alkaline processes, as well as to conduct utility simulation and energy/cost analysis. Additionally, the Aspen Energy Analysis V14 software within Aspen Plus V14 is utilised to describe the complex chemical and thermodynamic characteristics of acidic and alkaline processes, and to conduct subsequent heat exchange network simulation and optimisation processes.

3. Exergy Consumption Estimation and Analysis Methods

According to the second law of thermodynamics, we consider the overall effective exergy efficiency of the reaction as an important criterion for evaluation. The total exergy can be divided into four parts, and since the changes in velocity and height in the model can be ignored, only the calculation of physical and chemical exergy is considered here [6]. Before carrying out the calculation of the value of the exergy, the baseline environmental state should be determined firstly, and the more commonly applied models are the Japanese Kameyama–Yoshida model and the Polish Szargut model [5], which is adopted for the baseline environmental model in this paper due to the wider application of the Kameyama–Yoshida environmental model in Japan [23]. The ambient temperature was set to 298.15 K and the ambient pressure was set to 101.3 kPa. The standard molar chemical hydrazones are shown in Tables S1 and S2. The equations for physical and chemical exergy are as follows:
E PHY = F [ ( h h 0 ) T 0 ( s s 0 ) ]
E CHEM = F mol [ x i E i , CH + R T 0 x i ln ( x i ) ]
where EPHY is the physical exergy, kW; h0 is the enthalpy of the stream in the reference state (T0, P0), kJ; s0 is the entropy in the reference state, kJ/K; h is the enthalpy of the stream strand, kJ; s is the entropy of the stream strand, kJ/K; and F is the flow rate of the stream strand, kg/s. ECHEM is the chemical heat, kW, and Ei,CH is the standard mole fraction of the stream strand for component i, kJ/kmol. R is the gas constant, R = 8.314 J/(mol·K). xi is the molar fraction of component i in the stream strand. T is the temperature, K, and Fmol represents the molar flow rate, kmol/s. The calculation of the equilibrium equations of the exergy balance and the calculation of the exergy efficiencies involved in an acidic process and an alkaline process are shown below:
E in = E out + I r + W
η gen = E out E in × 100 % = 1 I int E in × 100 %
where Ein denotes the exergy entering the system, kJ; Eout denotes the exergy leaving the system, kJ; Ir denotes the exergy loss and also the exergy degradation caused by process dissipation, kJ; W is the net output work of the system or equipment, kJ; and ηgen denotes the exergy efficiency. Therefore, based on the simulation results, two processes for the production of high-purity PH3 are analysed in terms of exergy and are compared and discussed in detail.

4. Process Simulation

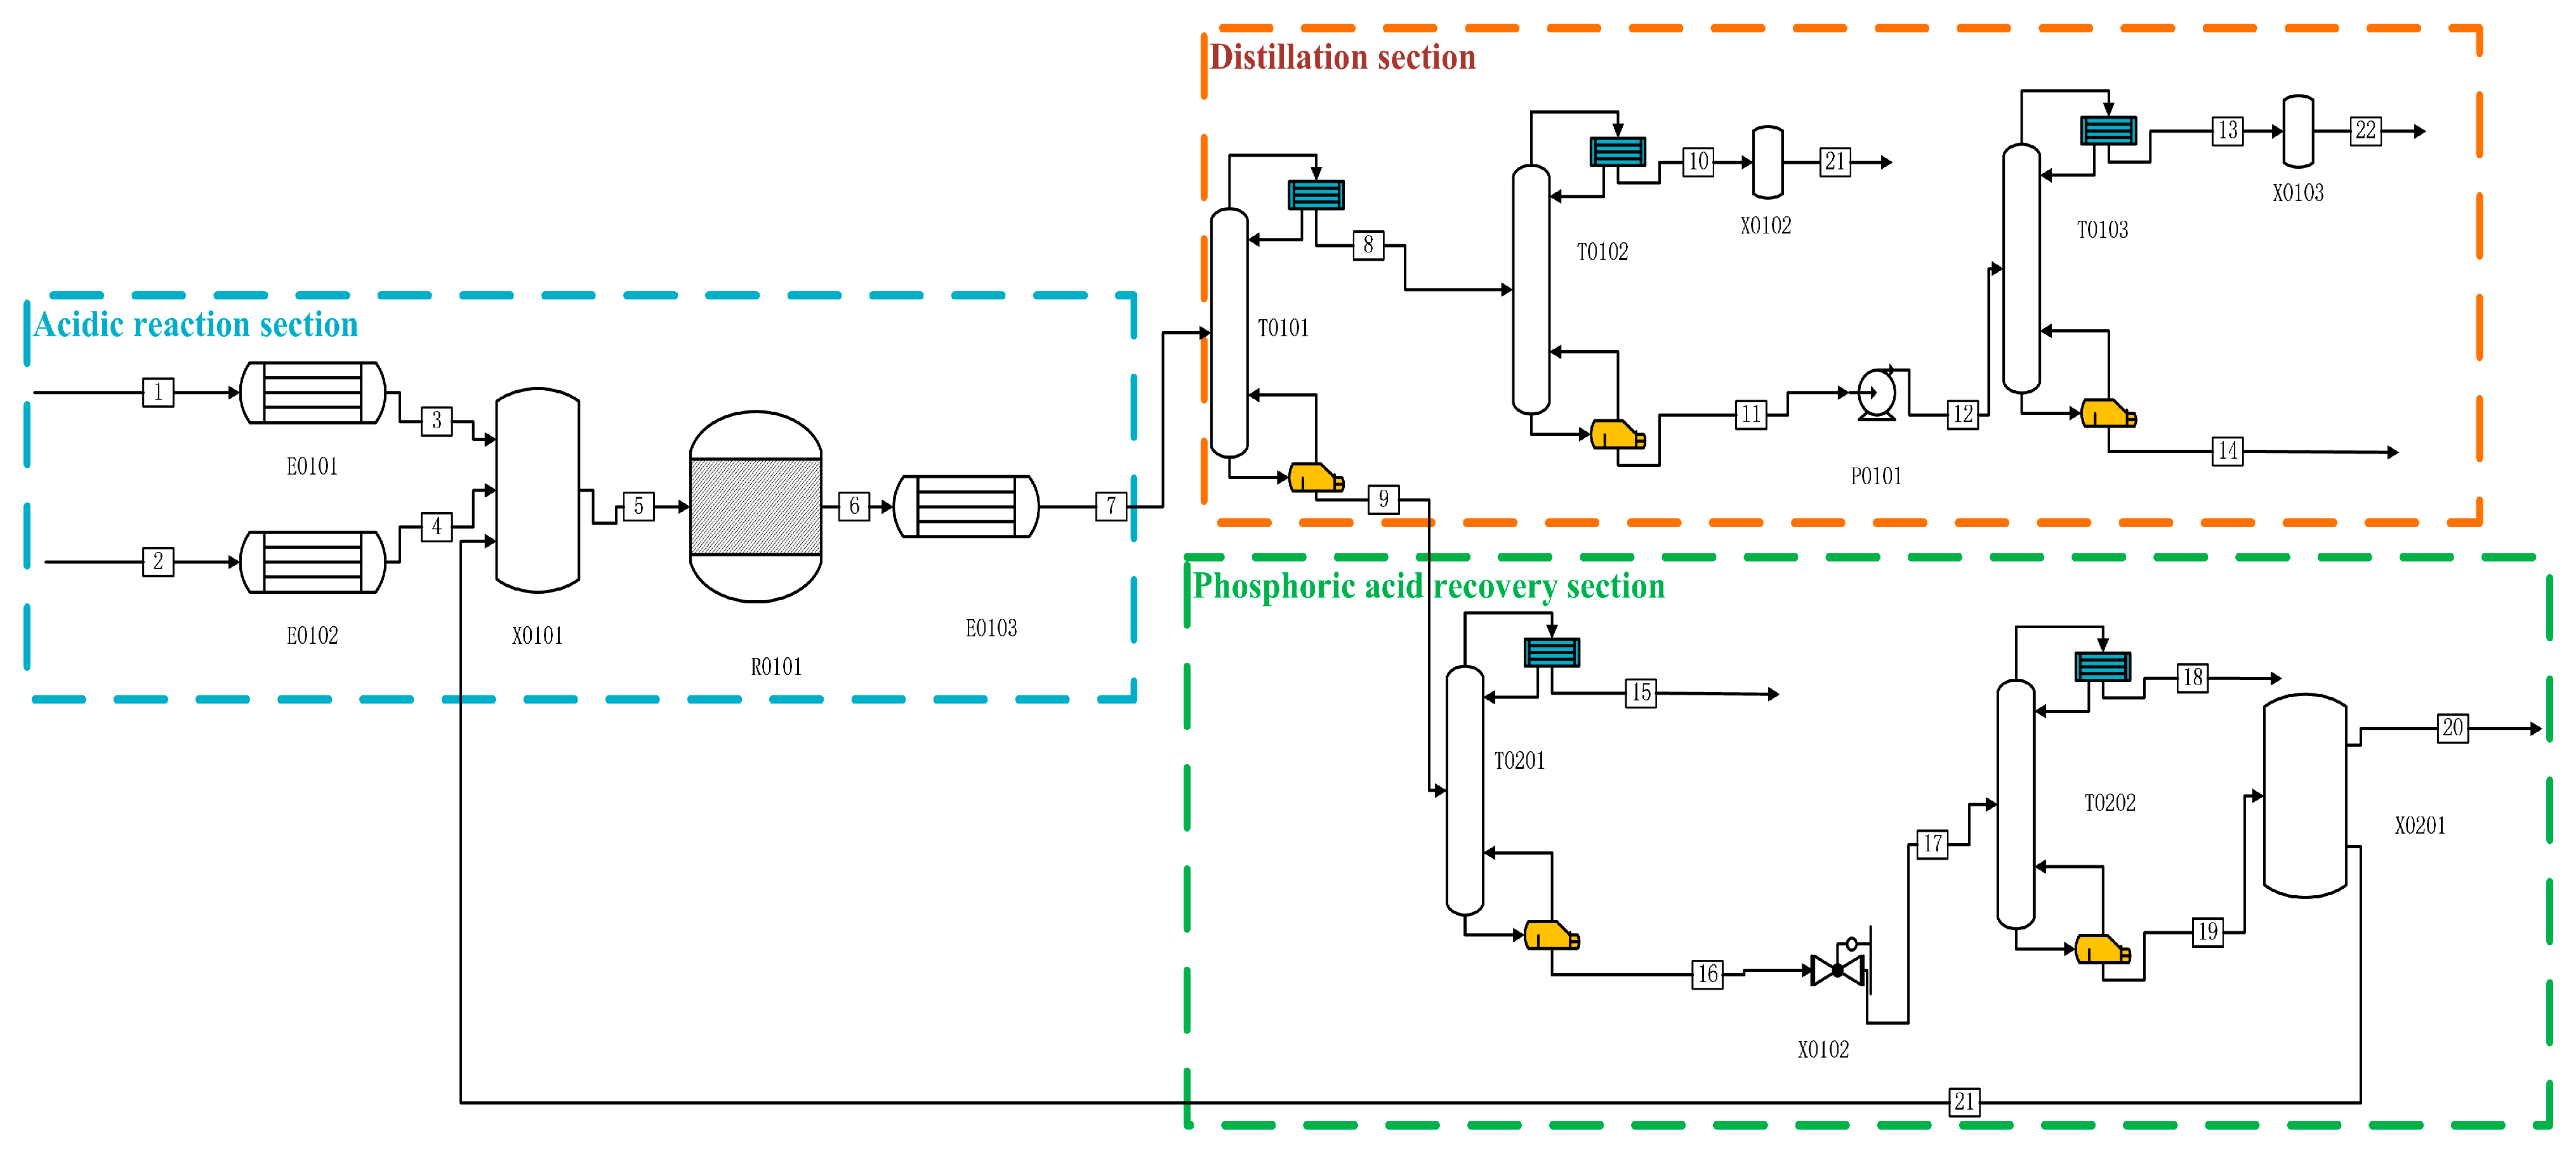
The Aspen simulations in both production processes are shown in Figure 1 and Figure 2. In the acidic process in Figure 1, P is fed from the one-flow stream and preheated to 280 °C by E0101, and H2O, as well as catalyst H3PO4 and other impure gases, are fed from the two-flow stream, which is heated to 280 °C by the heat exchanger E0102, and then mixed into the reactor R0101 for reaction. After the reaction is complete, the product first enters into E0103 for preheating to 70 °C. After that, it enters into the primary distillation column T0101 for heating. After entering the primary distillation tower T0101, the reaction production of PH3 and other impure gases, entering the T0102 for the second distillation, distillation of the kettle liquid through P0101 into the final purification tower for the deep-cooled distillation, and distillation of the top of the tower (mass fraction ≥ 99.9999%) of high-purity phosphine, the exergy was 87.84%. After the reaction, the remaining P, H2O, H3PO4, etc., are distilled from the tower kettle liquid of T0101 and enter T0201 for separation. Other impure gases are separated from the top of the tower. The tower kettle distillate flows into the final phosphoric acid separation tower T0202 through a pressure-reducing valve, where P and most of the water are distilled from the top of the tower. The ultra-high-purity H3PO4 distilled from the tower kettle is partially refluxed to the initial mixer X0101 for circulation, and most of the H3PO4 is distilled as a by-product.
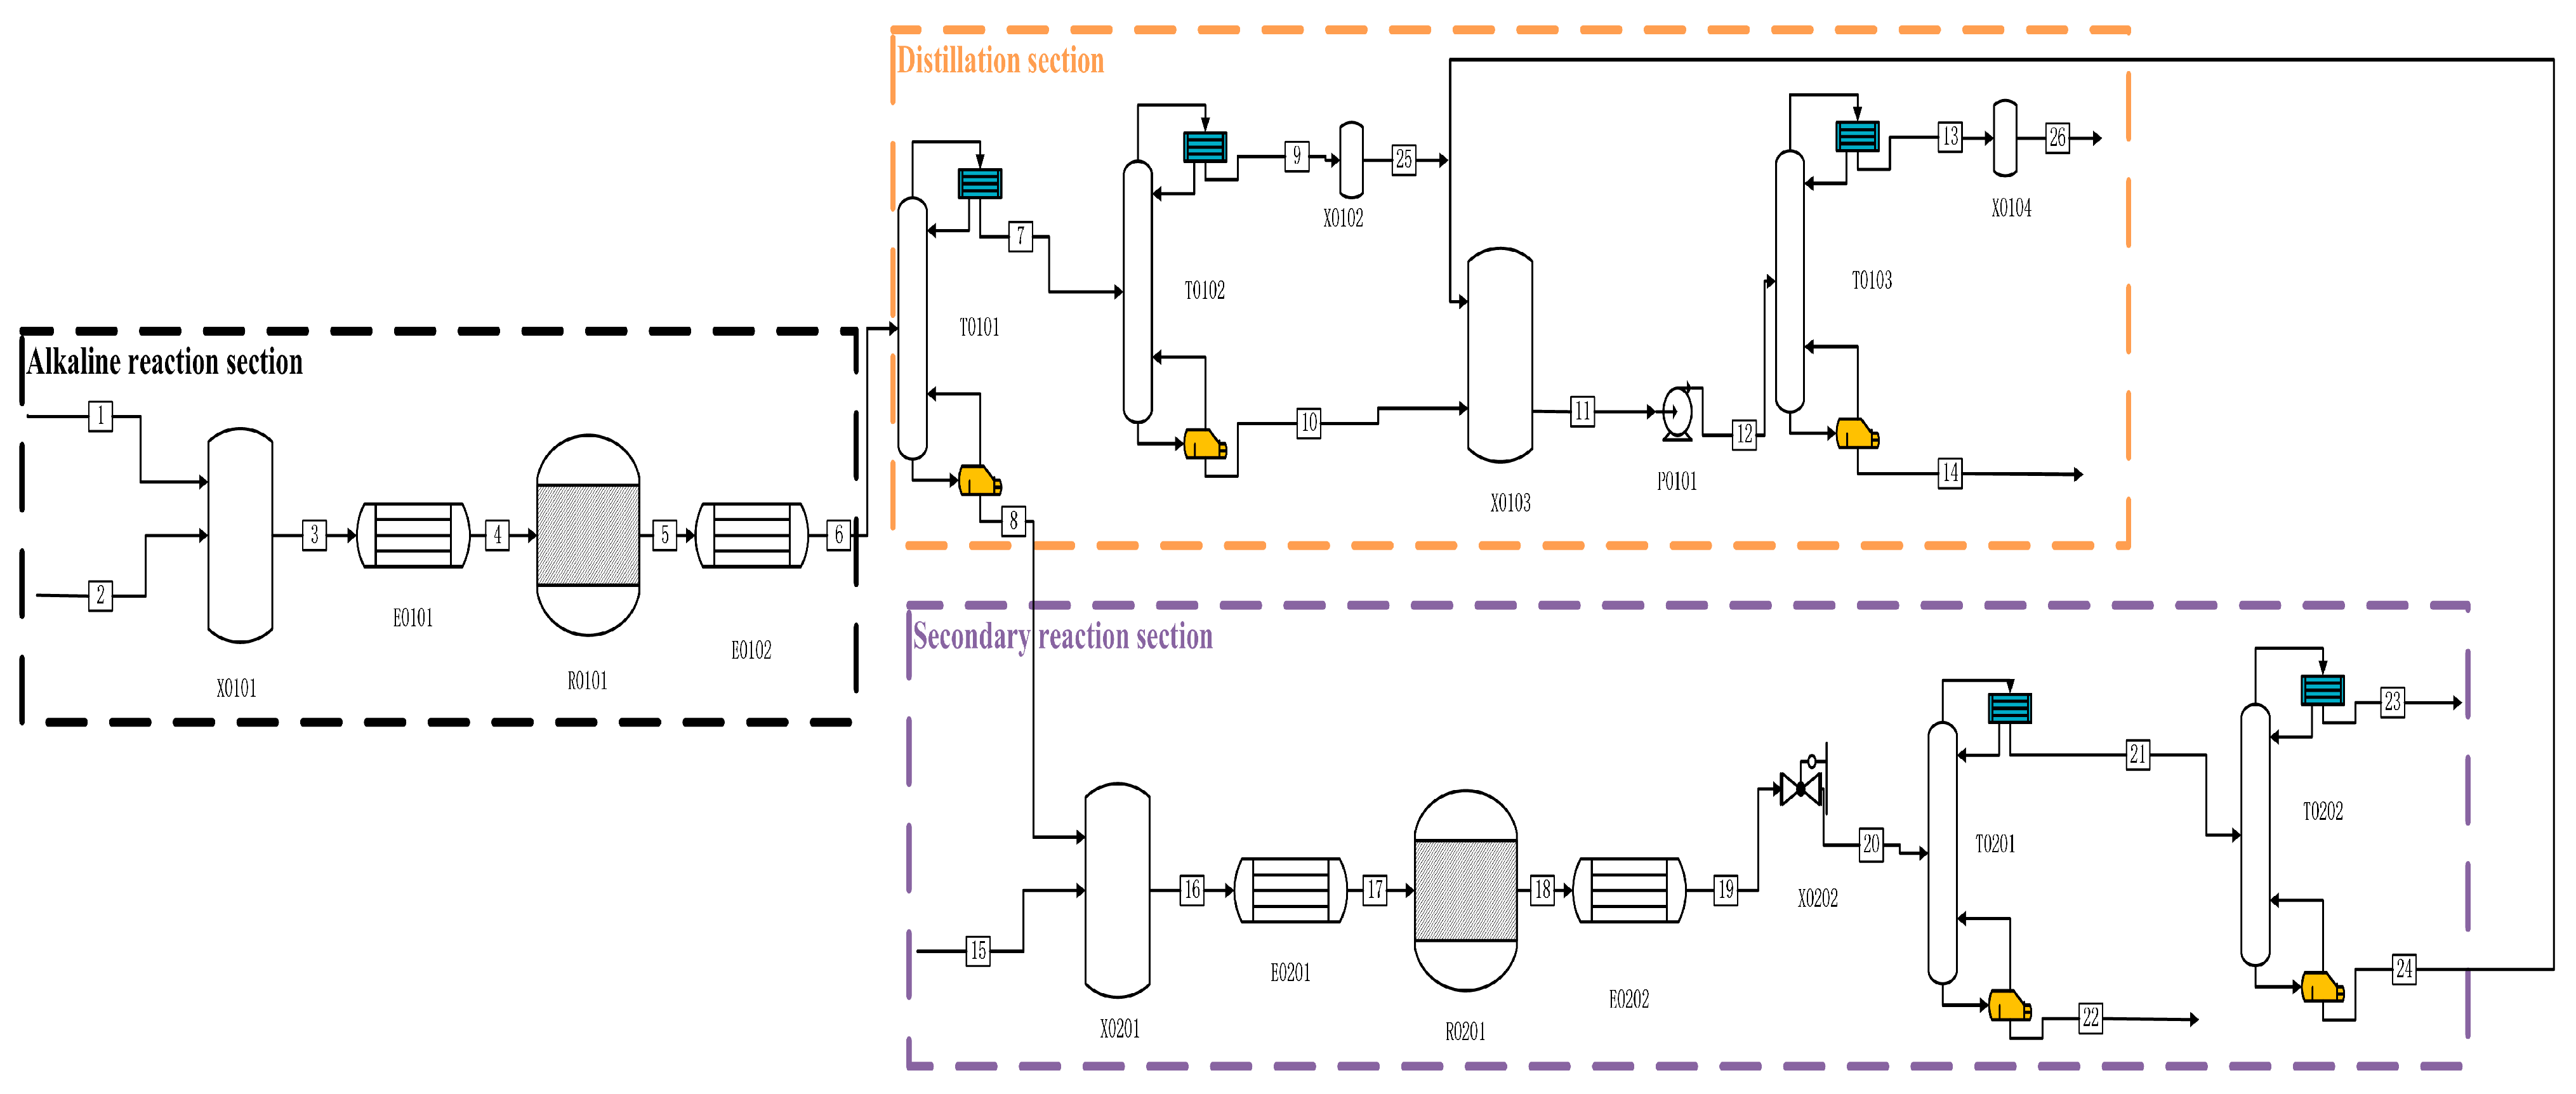
In the alkaline process shown in Figure 2, P and C2H5OH enter from one stream, while NaOH aqueous solution and other impure gases enter the mixer X0101 together from two streams and one stream. Firstly, they are preheated to 60 °C by E0101 and then enter the reactor R0101 for reaction. After the reaction is complete, we preheat them to 25 °C using E0102. The whole solution enters the T0101 primary distillation tower from flow chain 6 for separation, PH3 and other impurities enter T0102 for secondary distillation, and the kettle distillate is pressurised through P0101 and enters T0103 for final purification distillation. A high-purity PH3 mass fraction of ≥99.9999% is distilled at the top of the tower. In the T0101 tower kettle liquid, the aqueous solution of NaOH and the resulting NaH2PO2 and Na2HPO3, as well as ethanol and H3PO4, are mixed and preheat exchanged to 250 °C through E0201 before entering reactor R0201 for pyrolysis. After completion, they enter E0202 for heat exchange to room temperature, and then they pass through the initial distillation tower to distil the produced PH3 from the top of the tower. After that, they enter T0202 for pre-purification to about 99.8%, and then they flow into mixer X0102 to follow the final purification work of the tower kettle distillate from T0102, to obtain ultra-high-purity PH3 with a yield of 93.62%.
The thermodynamic and kinetic modelling of the acidic and alkaline processes was carried out using Aspen Plus V14 software, and the Electrolyte-NRTL model was applied to describe the above process systems, with utility simulations and exergy and cost analyses also carried out in the software. In addition, the Aspen Energy Analyzer V14 software in Aspen Plus was used to describe the complex chemical and thermodynamic properties of the acidic and alkaline processes, and also for the subsequent simulation of the heat transfer network and optimisation process.

5. Results and Discussion

5.1. Heat Transfer Network Optimisation

After simulating the acidic process flowsheet and the alkaline process flowsheet in Aspen Plus V14, the energy and cost were analysed and optimised as shown in Table S3. In the original process flowsheet, the heat exchanger is considered for direct utility exchange, which leads to high heat loss in each piece of equipment on the basis of higher cost. In the acidic process flowsheet, 80.91% of the heat is wasted and nearly 40% of the cold is lost. From the environmental protection point of view, reducing the waste of exergy also makes a big contribution to the reduction in carbon emission. In terms of cost, the saved exergy will also greatly reduce the production cost, and it is expected that the total utility cost can be reduced by about 39.2% through the effective utilisation of waste heat. In the alkaline process flowsheet, there is also an underutilisation of energy, as shown in Table S4, where the overall utility optimisation is expected to be reduced by 42.3%. However, due to the high heat requirements of the alkaline process, the optimised heating cost increased by 27.48% from the original, which indicates that there may be unreasonable heat exchangers that should be considered for avoidance in the subsequent design process. Still, due to the significant savings in cooling costs, the total cost was reduced from the previous one, from the original USD 32,620 million/y to USD 10,930 million/y. However, this is only a preliminary simulation by the software, and the specific design requires further optimisation and analysis of the heat exchanger network using the Aspen Exergy Analyzer V14 software.
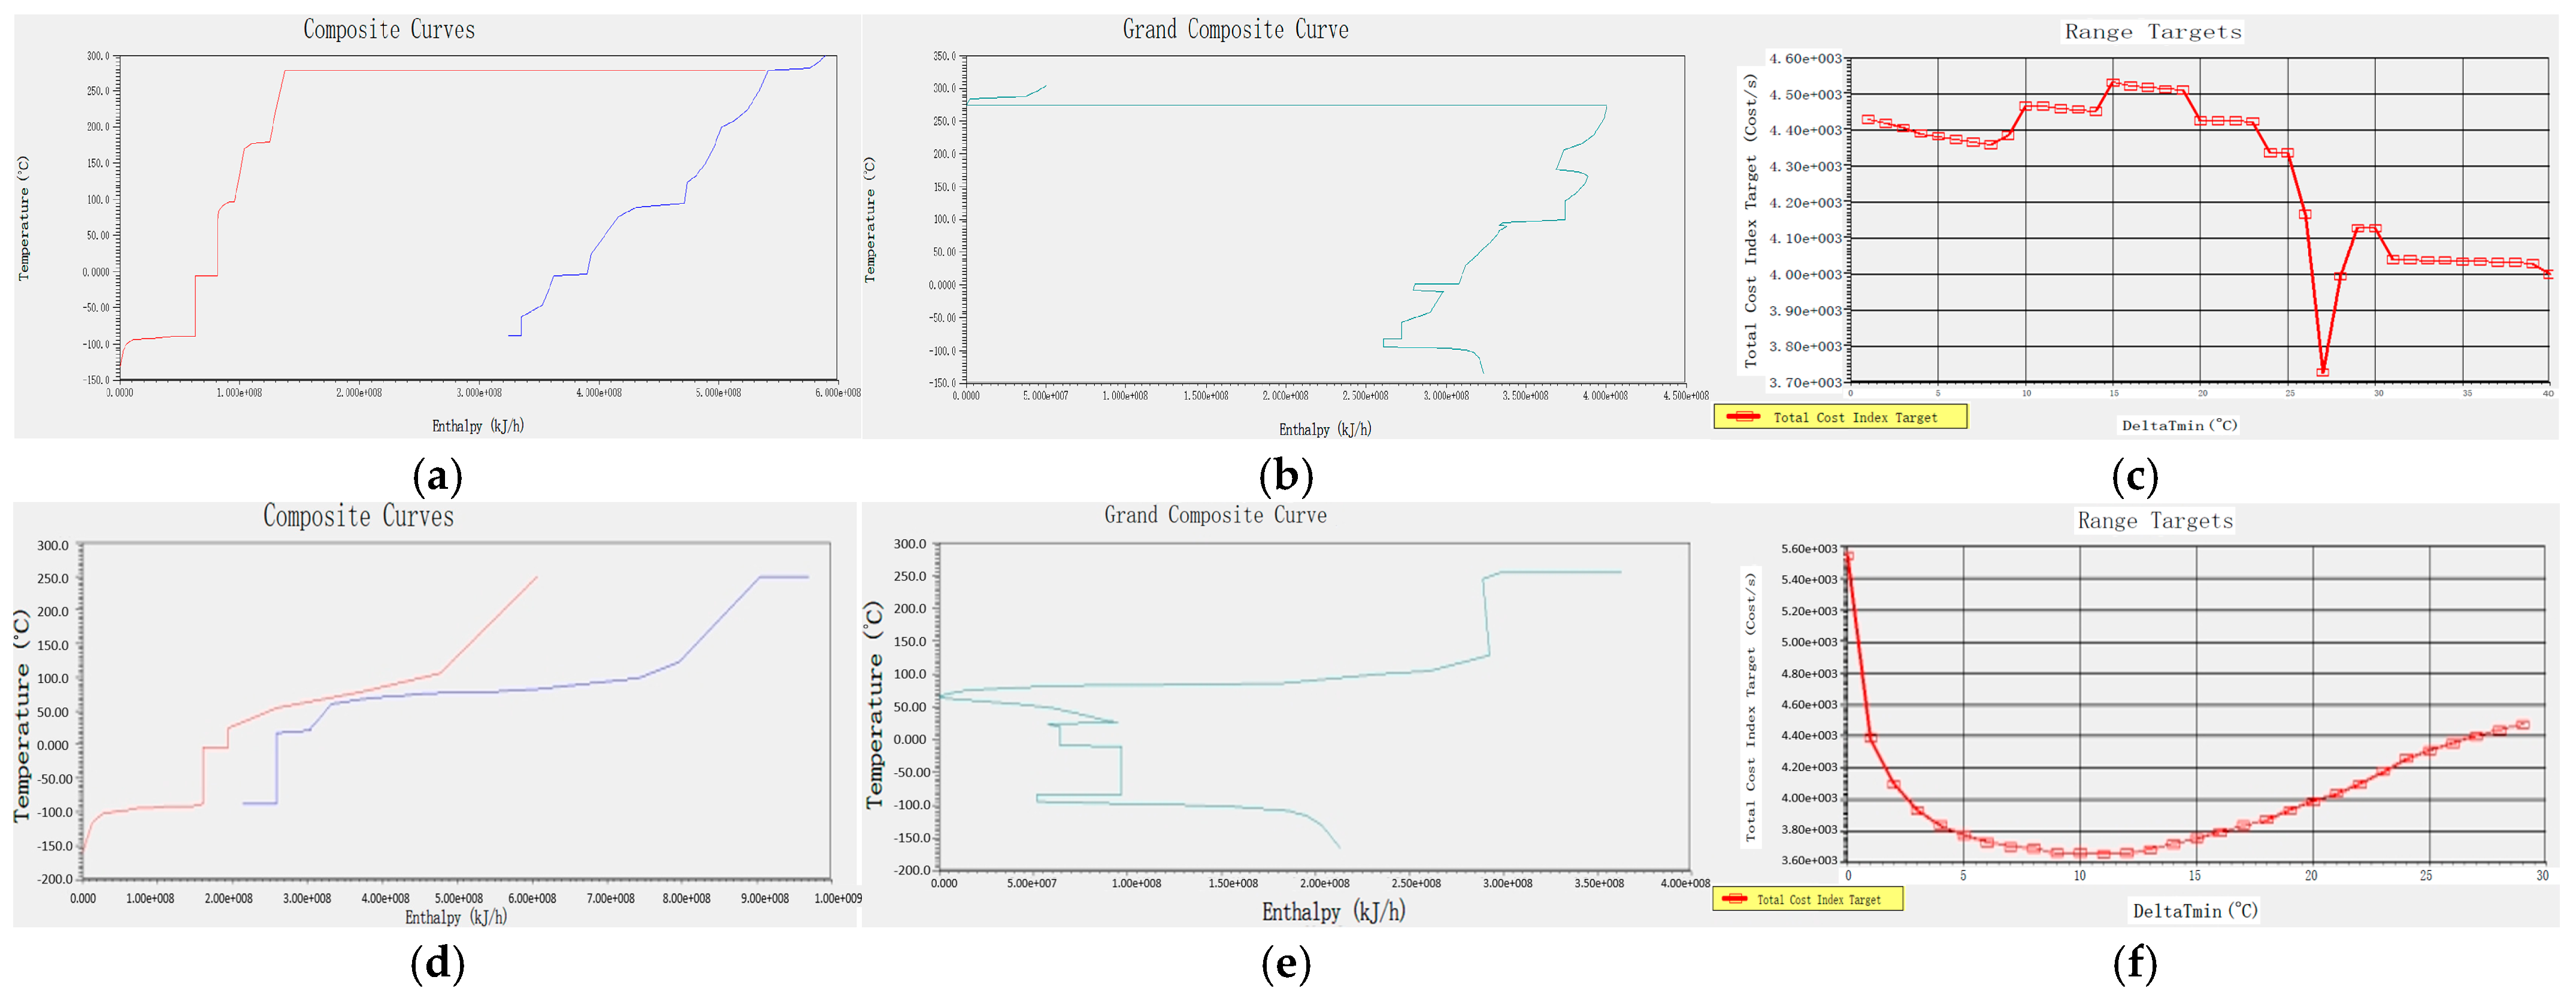
In Aspen Energy Analyzer V14, the temperature and enthalpy diagrams of the hot and cold streams and the total combination of the hot and cold streams in the whole process can be calculated by using the flow strand data of the acidic process simulated by Aspen Plus V14, as shown in Figure 3a,b. In the temperature–enthalpy diagram, a large number of plateaus can be found in the heat transfer curves of the hot and cold flow strands, which indicates that the process can apply heat transfer between the flow strands to reduce the appearance of plateaus. The overall combination curve graph displays the energy distribution within different temperature ranges, which can determine the temperature range for recovering excess energy and maximise exergy recovery efficiency. The temperature difference between the pinch points shown in Figure 3c is about 270 °C. When the pinch-point temperature is smaller, the overall operating cost is higher, and when the pinch-point temperature is larger, the cost of the equipment used increases. So, it is necessary to find an optimal pinch-point temperature for the subsequent optimisation of the heat transfer network. By calculating the correlation curve between the system energy recovery cost and the pinch-point temperature difference, as shown in the Figure 3, we found that when the minimum heat transfer temperature difference is at 27 °C, the minimum economic cost is required, so 27 °C is selected for the subsequent optimisation of the heat transfer network.
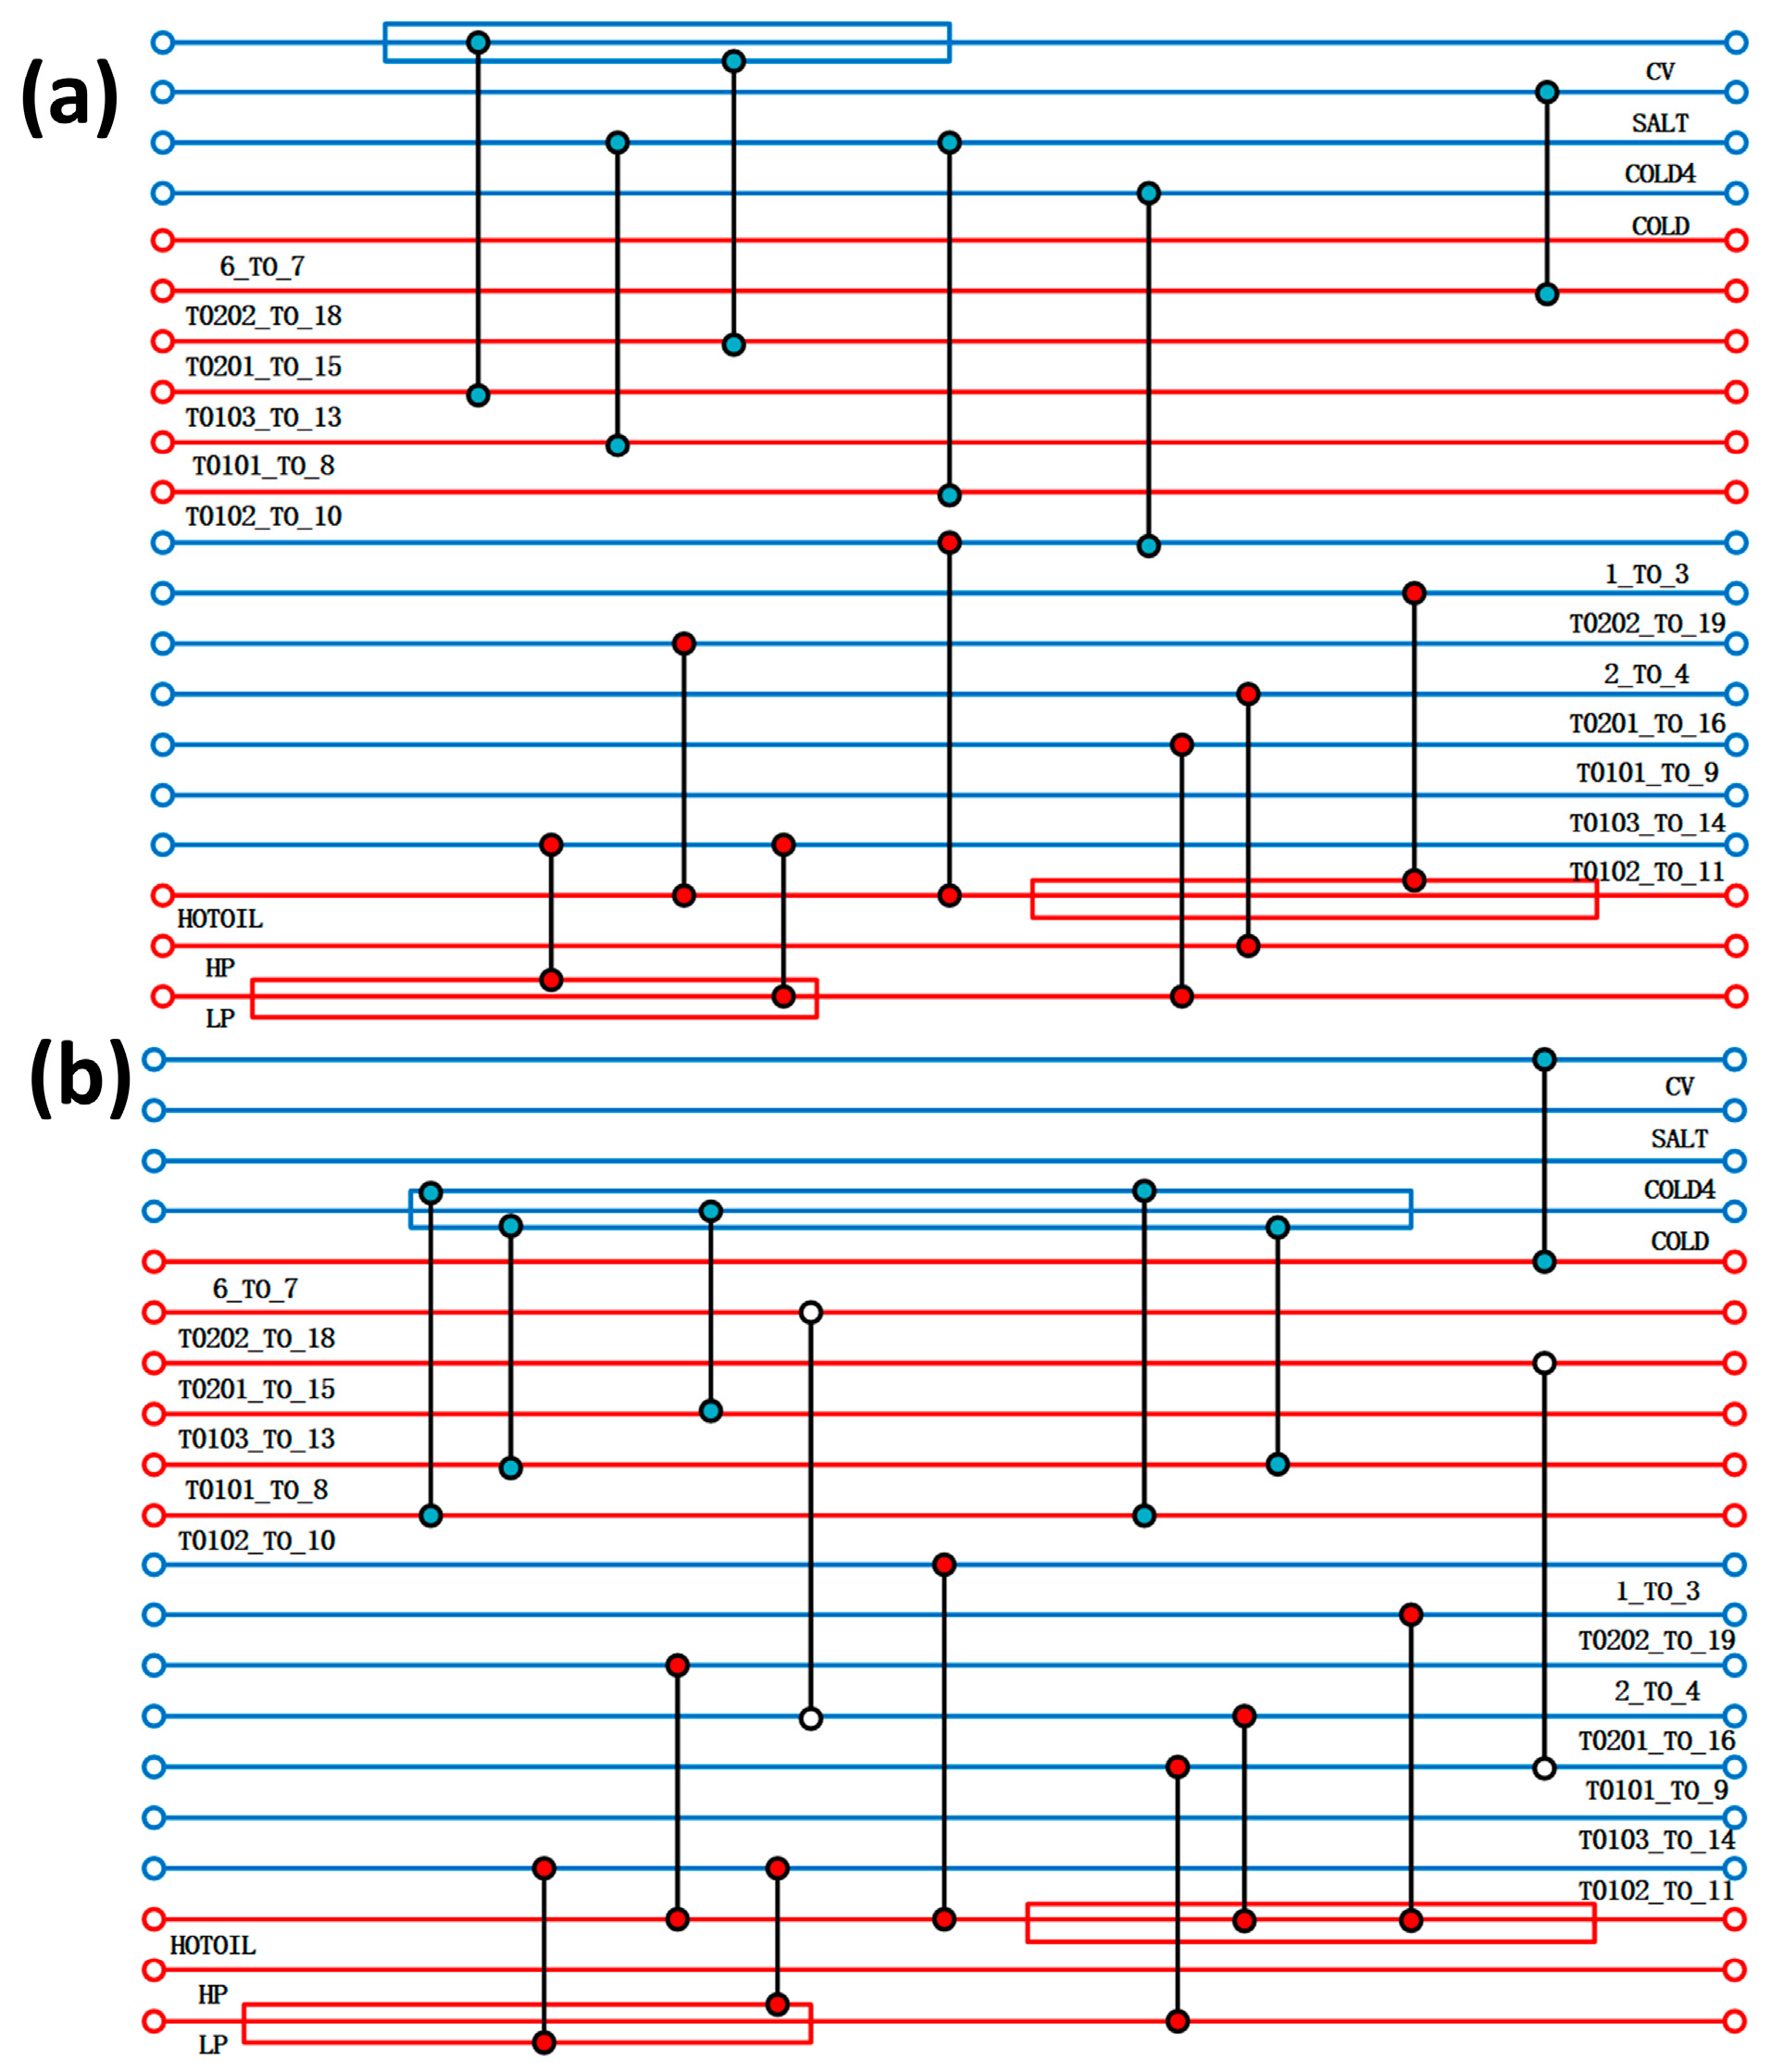
The heat exchanger network was optimised by Aspen Energy Analyzer V14, taking into account the rationality of the design, the capital utilisation, and other factors, and two new heat exchangers were added between the flow strands. The comparison of the heat exchanger network before and after optimisation is shown in Figure 4. The results of the optimisation of the heat exchanger network are shown in Table 3, with a reduction of 90.62% and 84.34% of the original heat-use engineering and cold-use engineering, respectively, compared to the pre-optimisation period. This shows that after the optimisation of the heat exchanger network, the overall process is more reasonable, and the heat exchange between the flow strands can greatly save exergy costs. The heat exchange area of the heat exchanger is also reduced after optimisation, from the original 4522.17 m2 to 2380.59 m2, which in turn leads to a reduction in the cost of equipment, and more large-area heat exchangers are replaced by more reasonable ones with a small heat exchange area, so that the total cost of the overall process has been reduced.
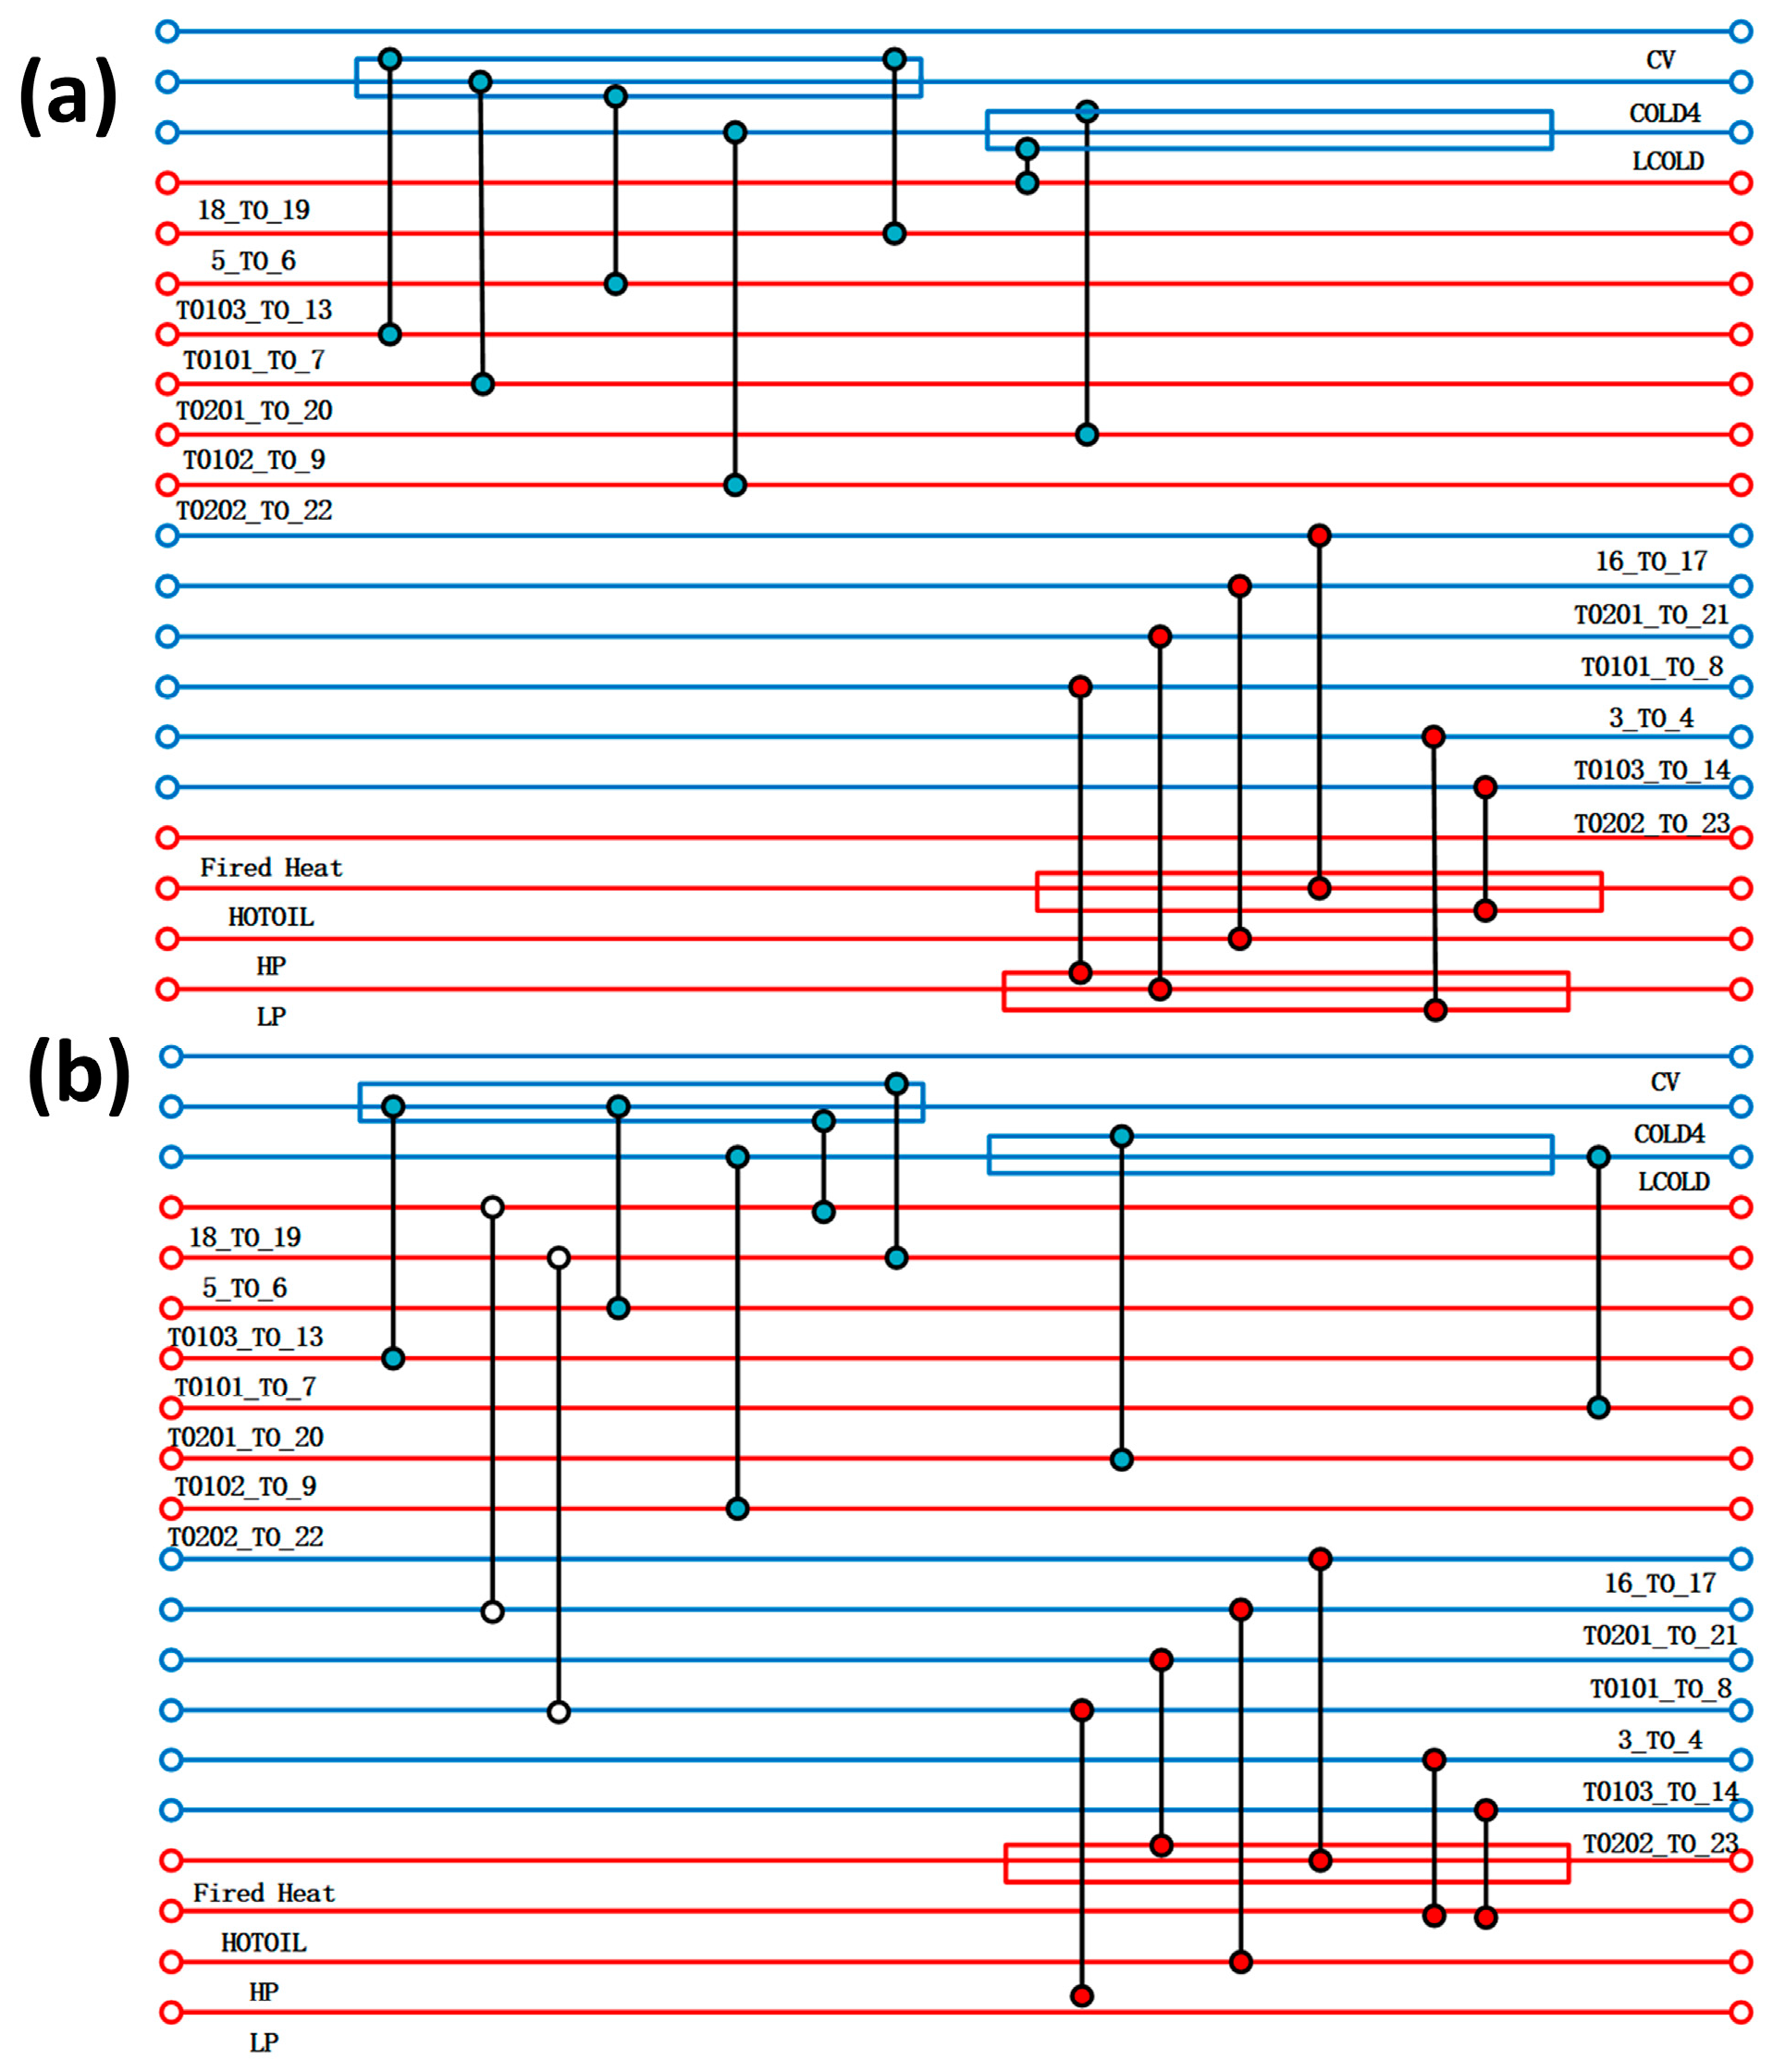
In the alkaline process, by analysing the temperature enthalpy diagram of the cold and hot streams in Figure 3d, it can be found that there is still a larger platform area compared to the acidic process, which can optimise the heat transfer network. Cold and hot flow stocks are closer to a higher degree of matching, indicating greater heat transfer space, but the overall cost of the equipment may be higher. Through the overall combination of Figure 3e, it can be observed that the pinch temperature is approximately 70 °C, which seems very low compared to the acidic process. This indicates that the waste heat recovery range of the alkaline process is large, but the heat transfer area may increase as a result, leading to an increase in the total production cost of the heat exchanger. Therefore, the cost relationship of pinch temperature in the alkaline process is particularly important. The correlation curve between the effective cost recovery of the system and the pinch temperature difference is shown in Figure 3f. It can be observed that when the pinch temperature is 10 °C, the system cost is the lowest. Therefore, a diagram before and after optimising the equipment is shown in Figure 5, and 10 °C was selected as the reference standard for optimising the heat exchanger network. By designing a heat transfer network, two sets of heat exchangers were added between the streams, indicating that the heat transfer between the streams effectively reduces the use of thermal utilities. Table 4 shows specific hot and cold usage, hot and cold utility costs, and equipment costs. As shown in the table, when compared with themselves, both hot and cold utilities have reduced by about 22%, the total heat exchange area has decreased by about 2000 square meters, and the overall equipment cost has significantly decreased from the original 6,384,709.115 USD to 824,393.0725 USD. Although two heat exchangers have been added, the optimised heat transfer network has reduced a large amount of heat transfer area, saving equipment selection and construction costs. However, compared with the acidic process, it can be clearly observed that the overall cost coefficient is about 2.8 times that of the acidic process, because the alkaline process requires a large amount of heat exchange. Therefore, it is necessary to improve the application of the alkaline process to increase the utilisation rate of waste heat, and to reduce costs and increase productivity through energy-saving optimisation technology.

5.2. Exergy Analysis

In the simulated acidic and alkaline processes, a base environmental temperature of 25 °C and a base environmental pressure of 0.1 MPa were specified, and the process effective energy changes in these two processes were calculated accordingly. The energy loss of acidic process equipment is shown in Table S5. The distillation section mainly includes equipment such as T0101, T0102, P0101, and T0103, with a total yield loss of 50,711.57 kW, which is 11,168.79 kW higher than the H3PO4 recovery section. The production loss of tower T0101 is the highest, reaching 28,737.52 kW, while the other towers T0102 and T0103 also suffer losses, respectively. The loss of reactor R0101 is 7075.85 kW, which is mainly the result of the combined effect of physical and chemical reaction losses. The PH3 distillation section is the core process for preparing ultra-high-purity PH3, and the overall high heat loss is not conducive to the healthy operation of the equipment. Therefore, it is necessary to determine reasonable parameters through analytical methods to reduce the loss of effective energy in the entire process and improve the efficiency of effective energy.
Alkaline devices also have similar modes, as shown in Table S6. The sum of losses of PH3 distillation tower equipment (T0101, T0102, and T0103) in the alkaline process is 81,625.04 kW, which is 37,552.06 kW higher than the sum of losses of the secondary reaction tower equipment (T0201 and T0202). This also reflects that as the main process of the alkaline process, the losses of tower equipment in the distillation stage need to be further optimised. To achieve reduction, the heat exchangers E0202 and E0201 in the secondary reaction section also have high losses, consuming more than 70,000 kW of exergy. The main reason is that high temperature is needed in the secondary reaction, but there are a lot of alcohols as protective solvents in the middle to participate in the reaction, so a lot of heat is wasted and the exergy utilisation efficiency is low. Therefore, it is necessary to consider a reasonable phosphorus–alcohol ratio in order to reduce the heat exchange of useless products in addition to the heat exchange, but also through cogeneration and other measures, to improve the efficiency of heat exchange energy utilisation. From the overall process analysis, it was found that the exergy loss of the optimised alkaline process is relatively high. Considering the energy consumption and the sustainable development of the environment, the advantages of the acidic process are superior to those of the alkaline process. However, after adopting efficient and energy-saving measures in the alkaline process, the overall commissioning advantage may be superior to that of the acidic process.
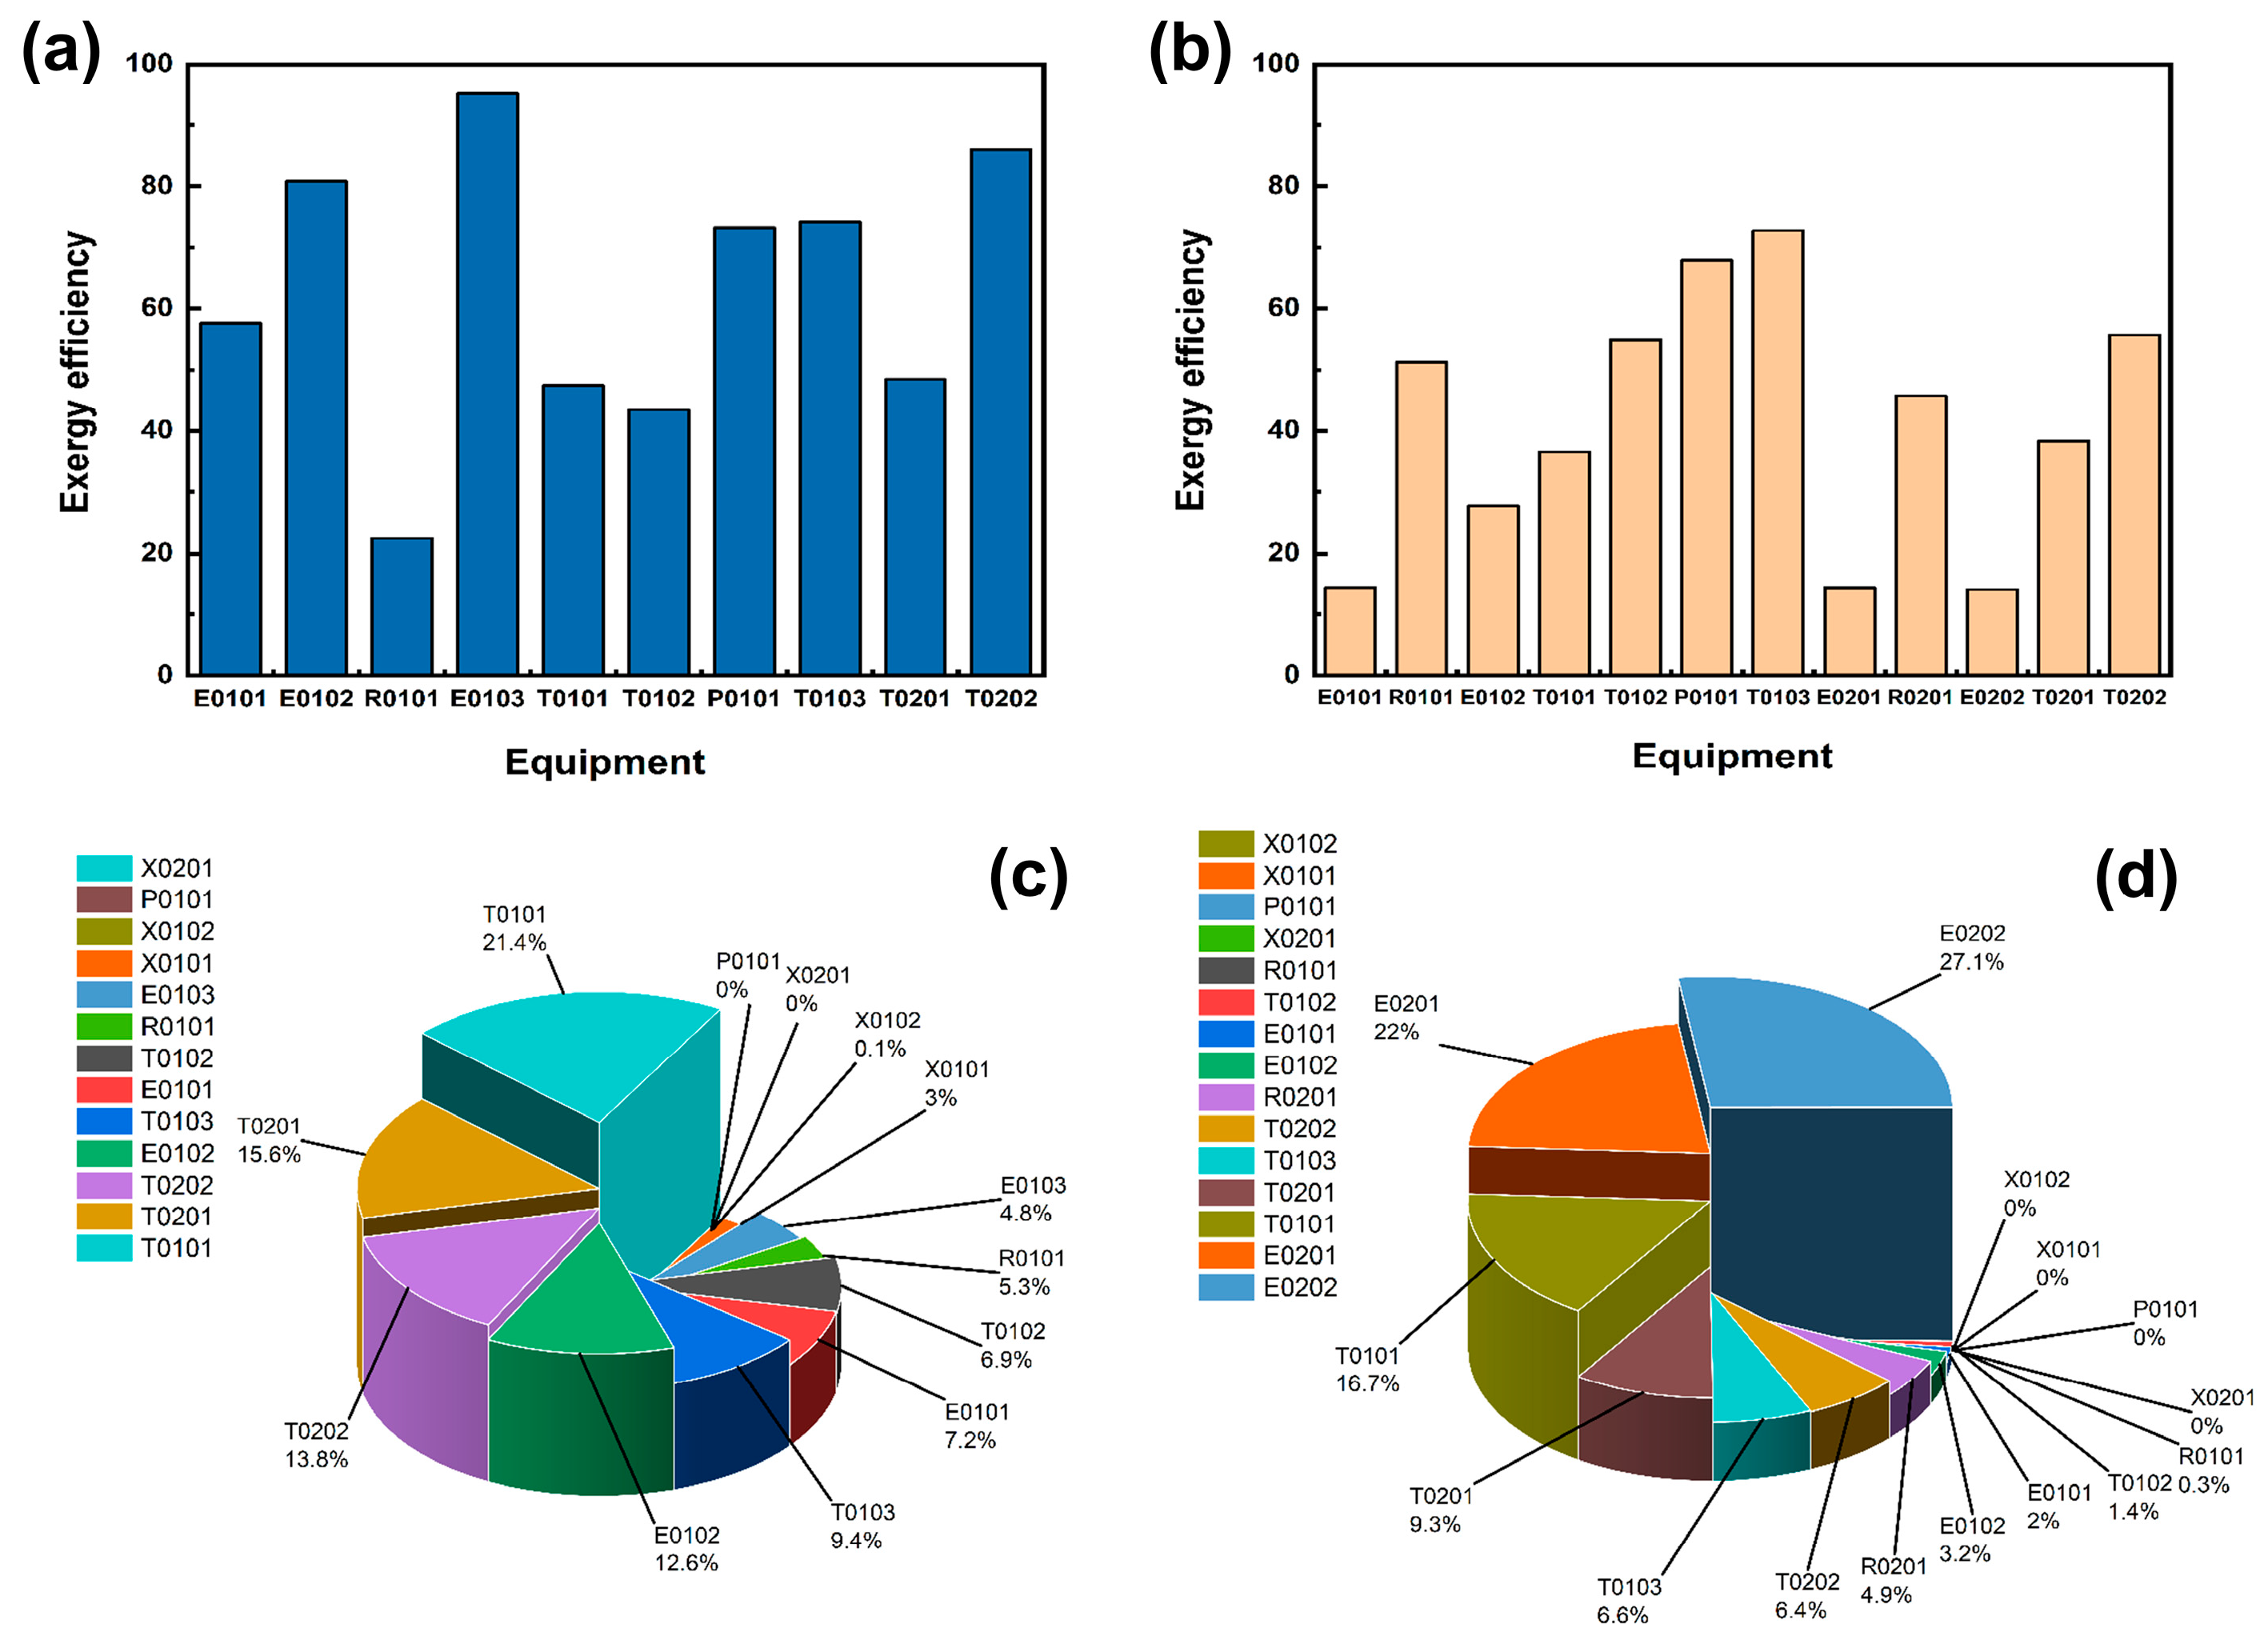
The mechanical efficiencies of the equipment in the acidic process and the alkaline process are shown in Figure 6a,b, and the percentage of mechanical losses of the equipment is shown in Figure 6c,d. A side-by-side comparison of the equipment efficiency diagrams of the two processes reveals that the exergy efficiency of the equipment in the acidic process is significantly higher than that of the equipment in the alkaline process, which indicates that the equipment in the acidic process is generally better than that in the alkaline process in terms of its comprehensive capacity. In the acidic process flow, although the total exergy loss of the heat exchanger is relatively high, the exergy efficiencies of E0102 and E0103 both exceed 80%, indicating that the heat exchanger has been effectively utilised. Moreover, since the essence of exergy loss is an irreversible process of calculating energy conversion, even if the exergy loss is large, it will not affect the effective utilisation of the equipment. The yield efficiencies of the initial distillation tower T0101, crude purification tower T0102, and crude extraction tower T0201 H3PO4 are all around 45%. Subsequently, they can be analysed to find reasonable design parameters to improve their yield efficiencies. Although the overall efficiency of the alkaline process is not high, the efficiency of T0101 may be due to an increase in heat exchange caused by an increase in raw material quantity. Therefore, in the future, a series of heat exchangers will be considered to enhance the heat exchange effect and improve efficiency. By analysing the loss percentages of each device, it can be found that acidic processes T0101, T0102, and T0103 account for 21.4%, 6.9%, and 9.4%, respectively, with a total loss percentage exceeding 37.7%. In addition to the two heat exchangers that require a large amount of heat exchange in alkaline equipment, the total loss of the distillation sections of T0101, T0102, and T0103 accounts for more than 25%. This is mainly due to the use of cryogenic distillation in the design of this article, which results in a large temperature difference between the top and bottom of the tower, causing a large amount of cold and heat exchange between the condenser and reboiler, resulting in a large amount of energy dissipation. The distillation sections of T0101, T0102, and T0103 are designed comprehensively, with a total percentage of over 37.7%. We consider that there is a need to optimise parameter design in the future and minimise losses during the heat transfer process, in order to achieve the important goal of improving the efficiency of tower equipment.

5.3. Optimisation of Process Parameters

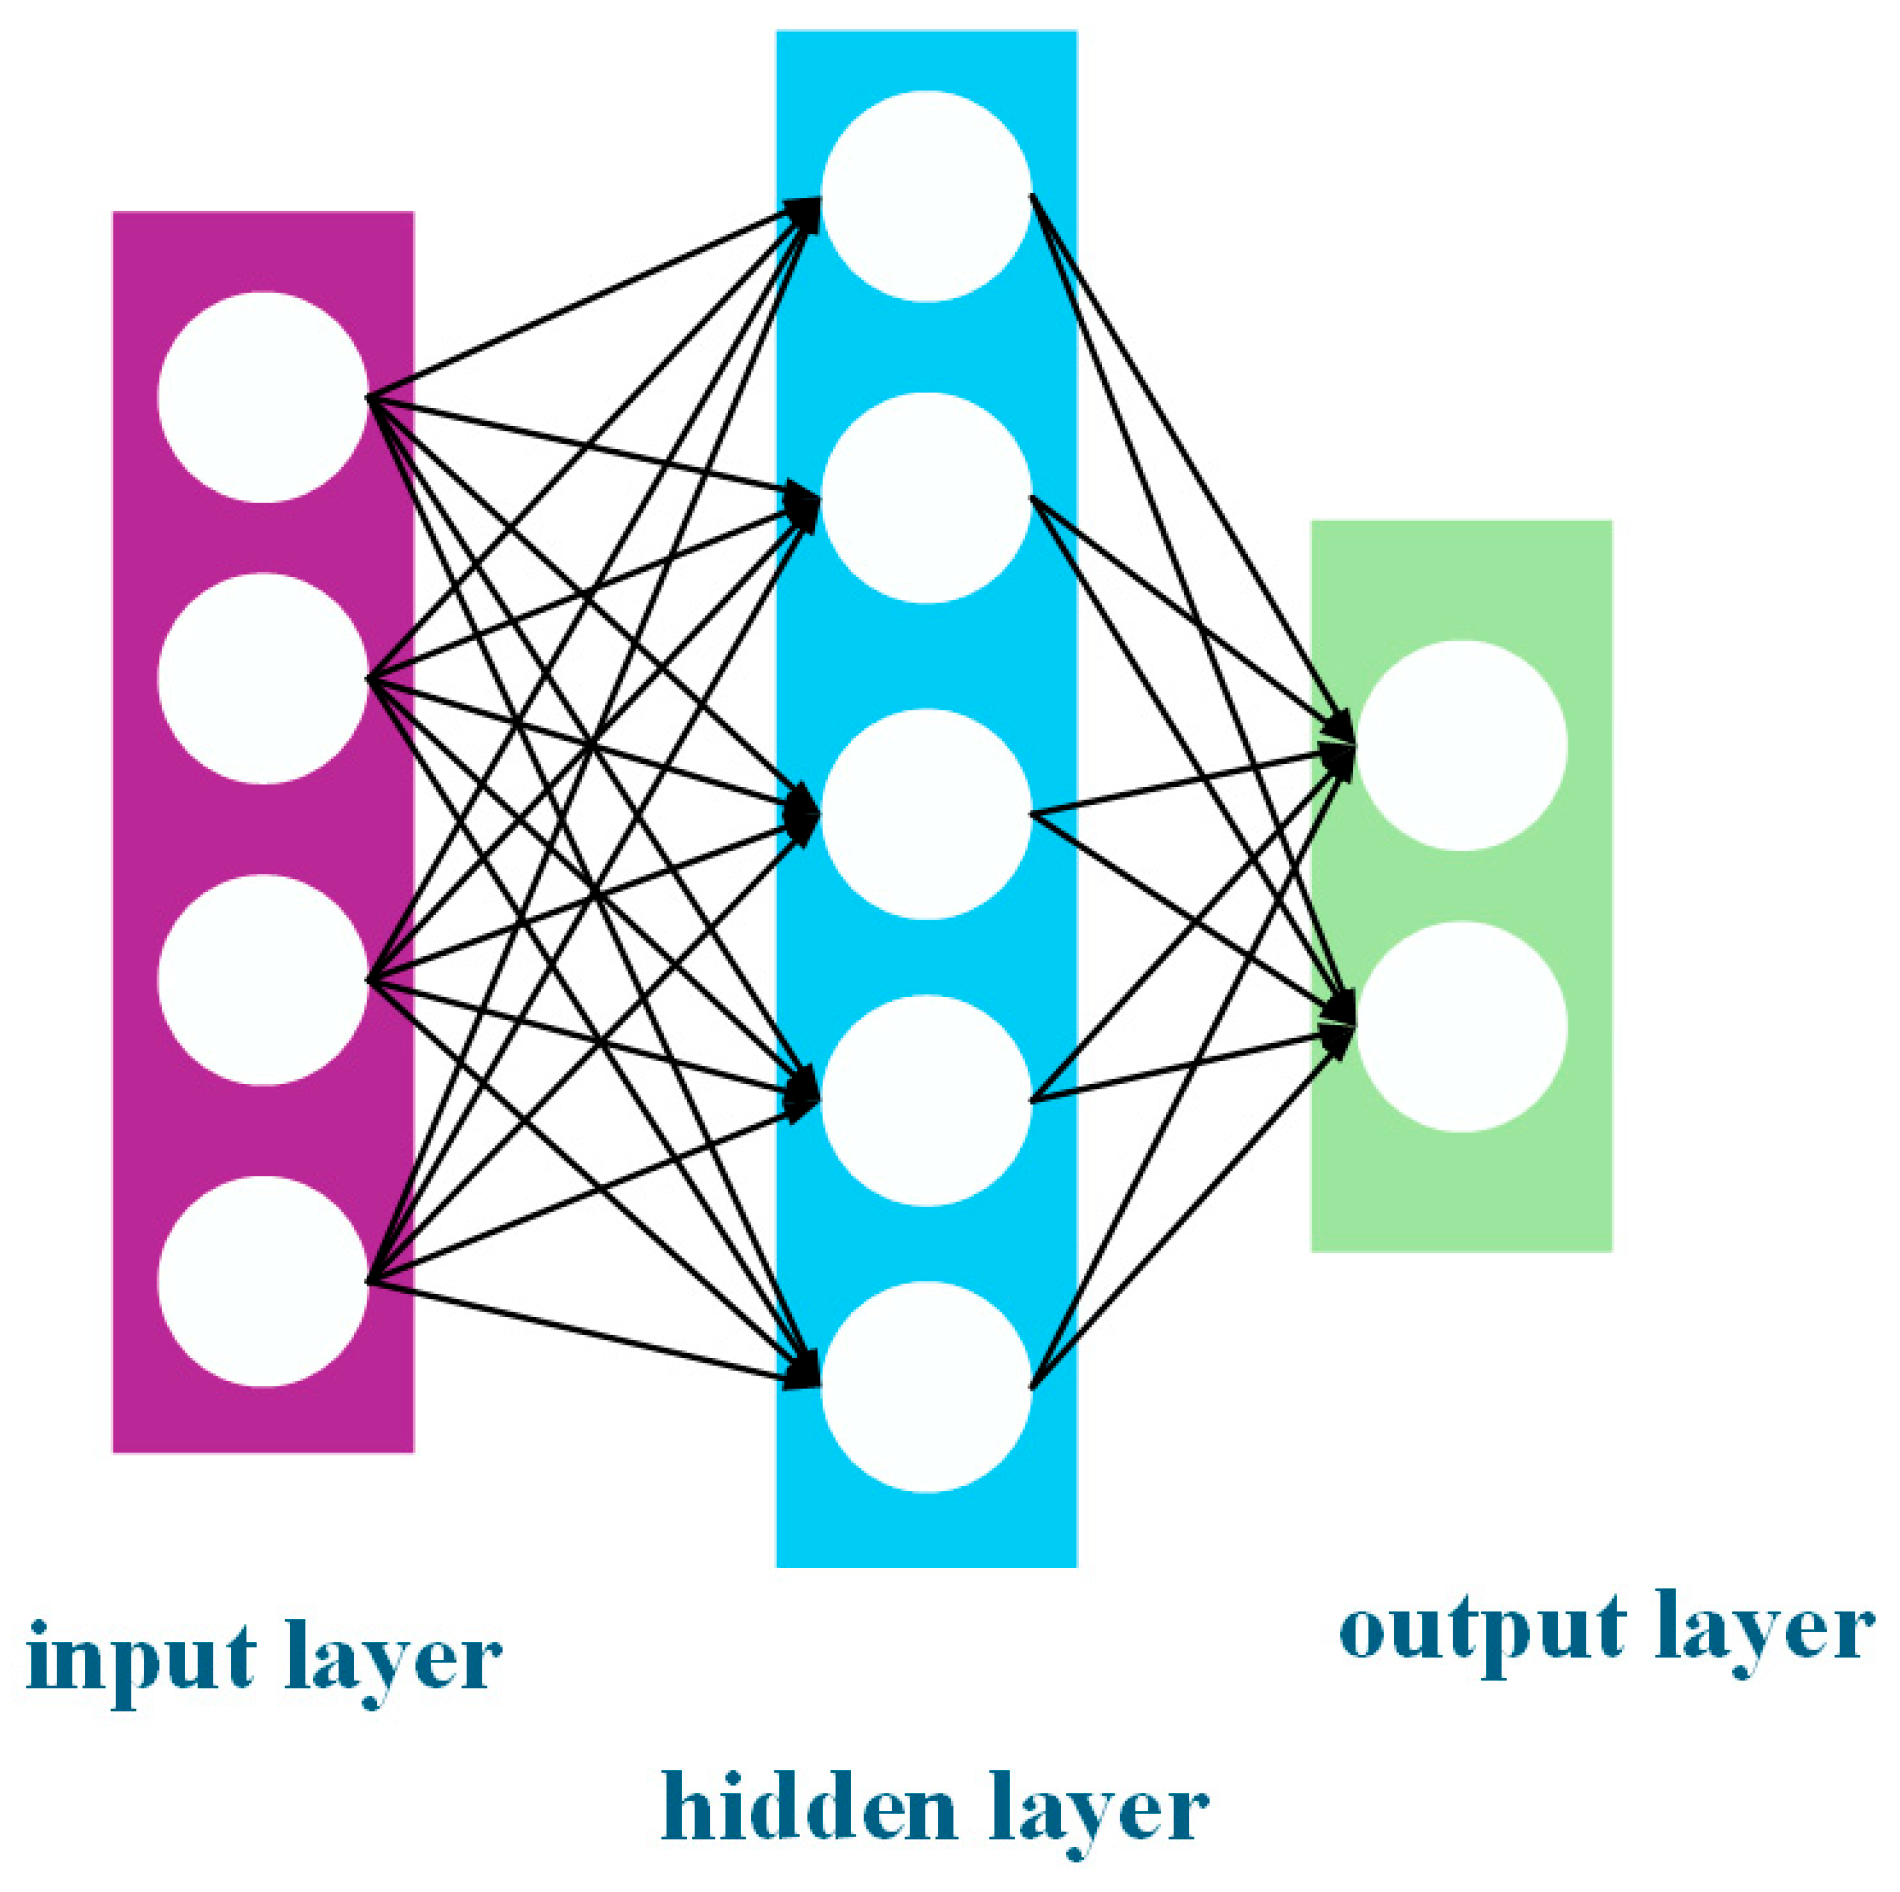
Using Aspen software in conjunction with MATLAB software, it is possible to determine the optimal solution for multiple equipment parameters in the distillation section with respect to process losses and product cost. As shown in Figure 7, the ANN model acts as a ‘black box’ compared to the traditional polynomial regression model, dealing with the relationship between inputs and outputs in a non-intuitive manner. In this section, the ANN model is used to optimise the above-mentioned losses and product costs and the corresponding equipment parameters. For the acidic process, the input variables are selected as reference variables for the T0101 feed plate (FT0101), the bottom flow rate of the tower at T0102 (MT0102), the pump pressure (PP0101), and the top flow rate of the tower at T0103 (MT0103), and the output variables are selected as the corresponding exergy loss (ElPH3) saved by share diversion and the corresponding exergy economic cost (EePH3) saved by share diversion. For the alkaline process, the input variables were chosen as the total number of plates T0101 (TT0101), the bottom flow rate of the tower for T0102 (MT0102), the pump pressure (PP0101), and the top flow rate of the tower for T0103 (MT0103) as the reference variables, and the output variables were still chosen to be the loss of exergy in the corresponding flow strand (ElPH3) as well as the economic cost of exergy in the corresponding flow strand (EePH3). The ANN model was trained using 81 Aspen process simulation datasets for the sample neural network, and the specific boundary condition values are shown in Table 5.
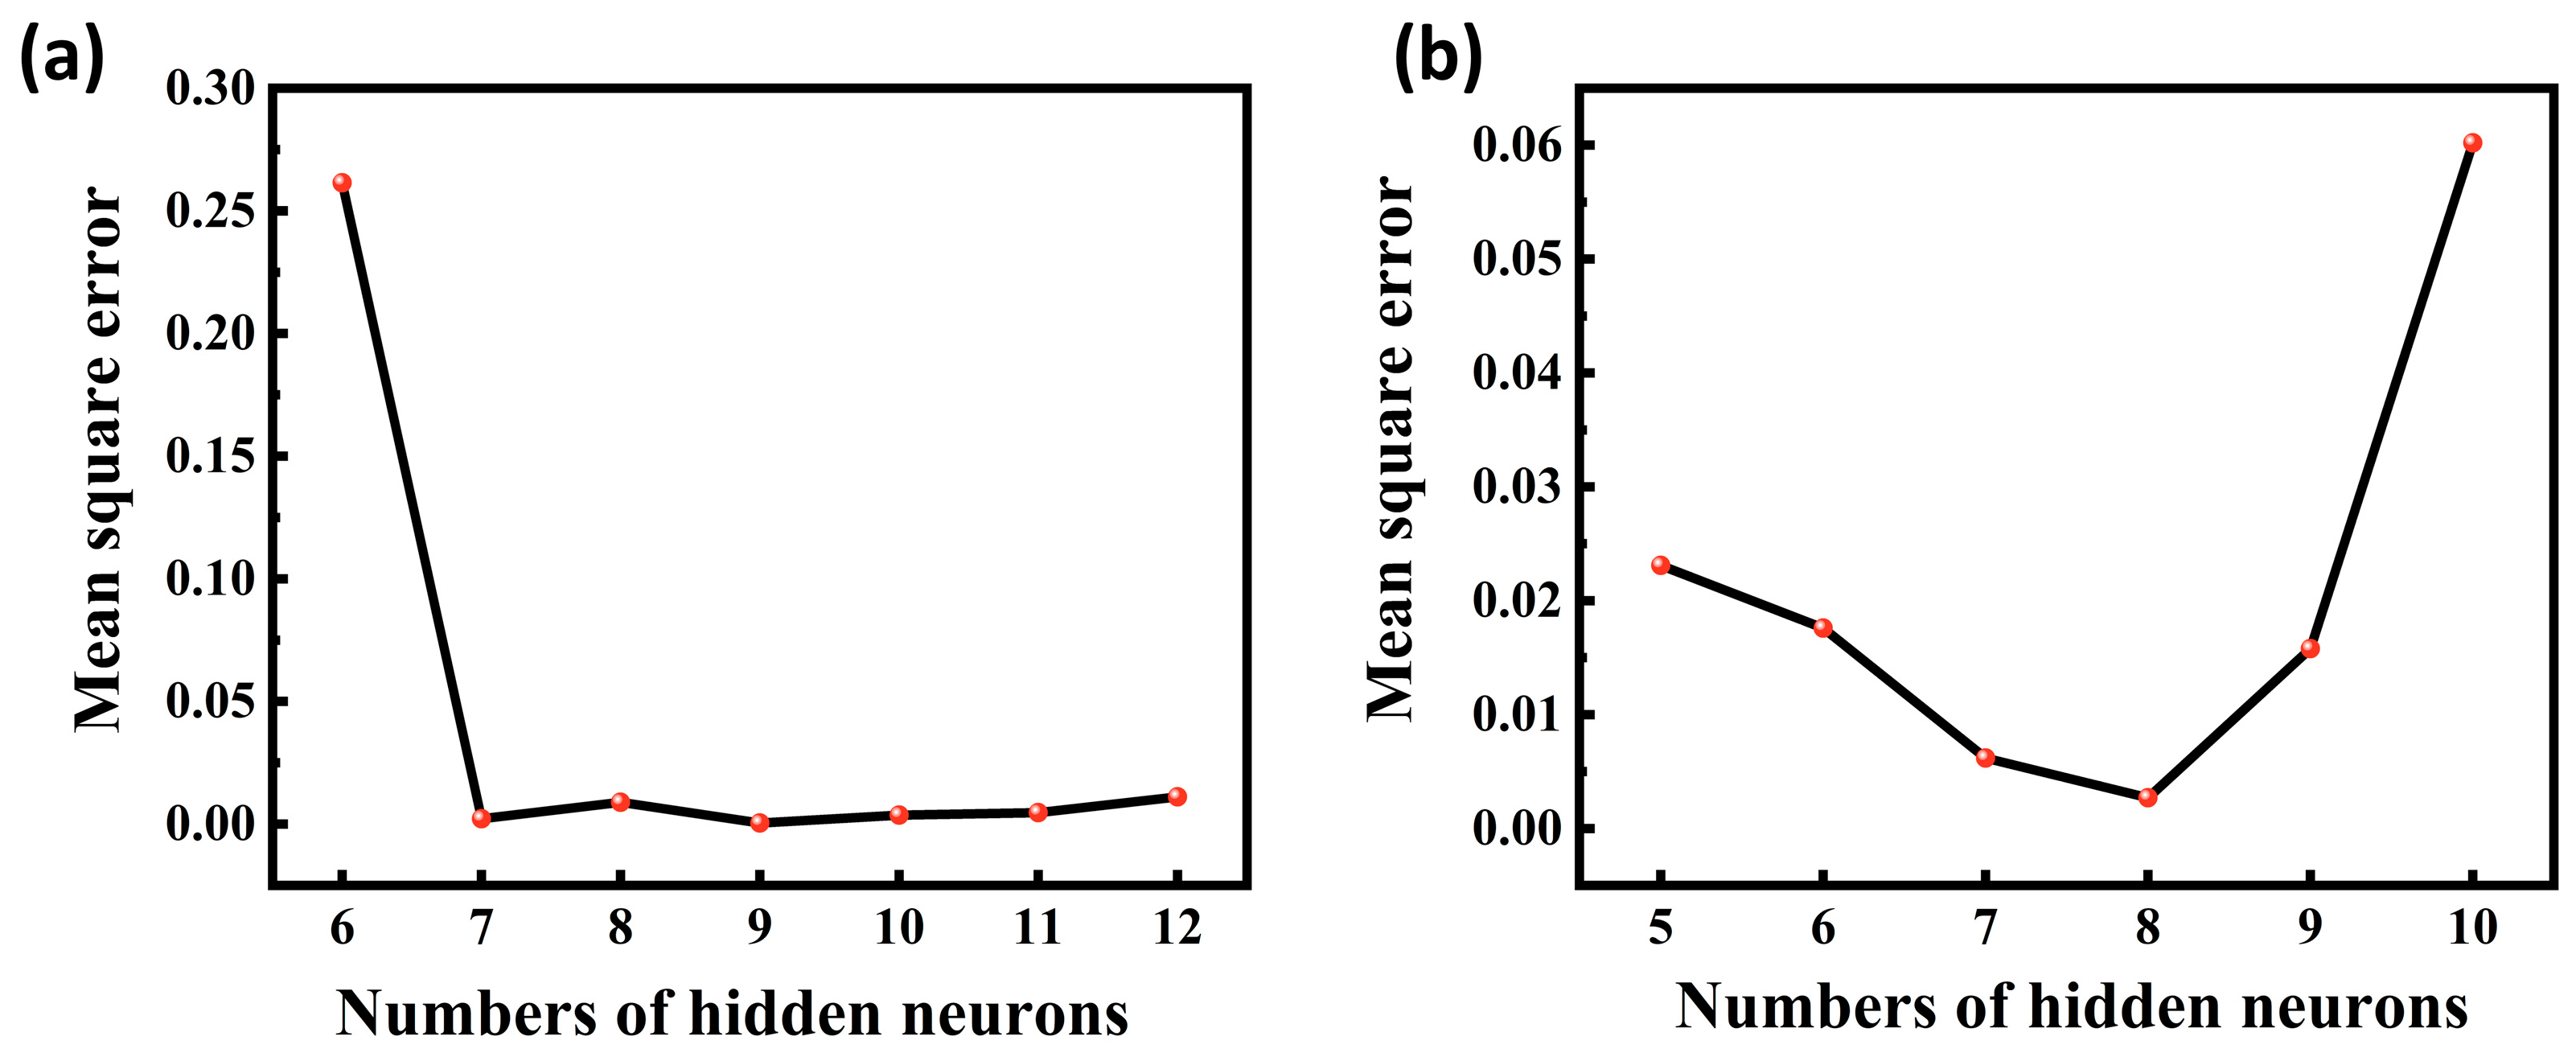
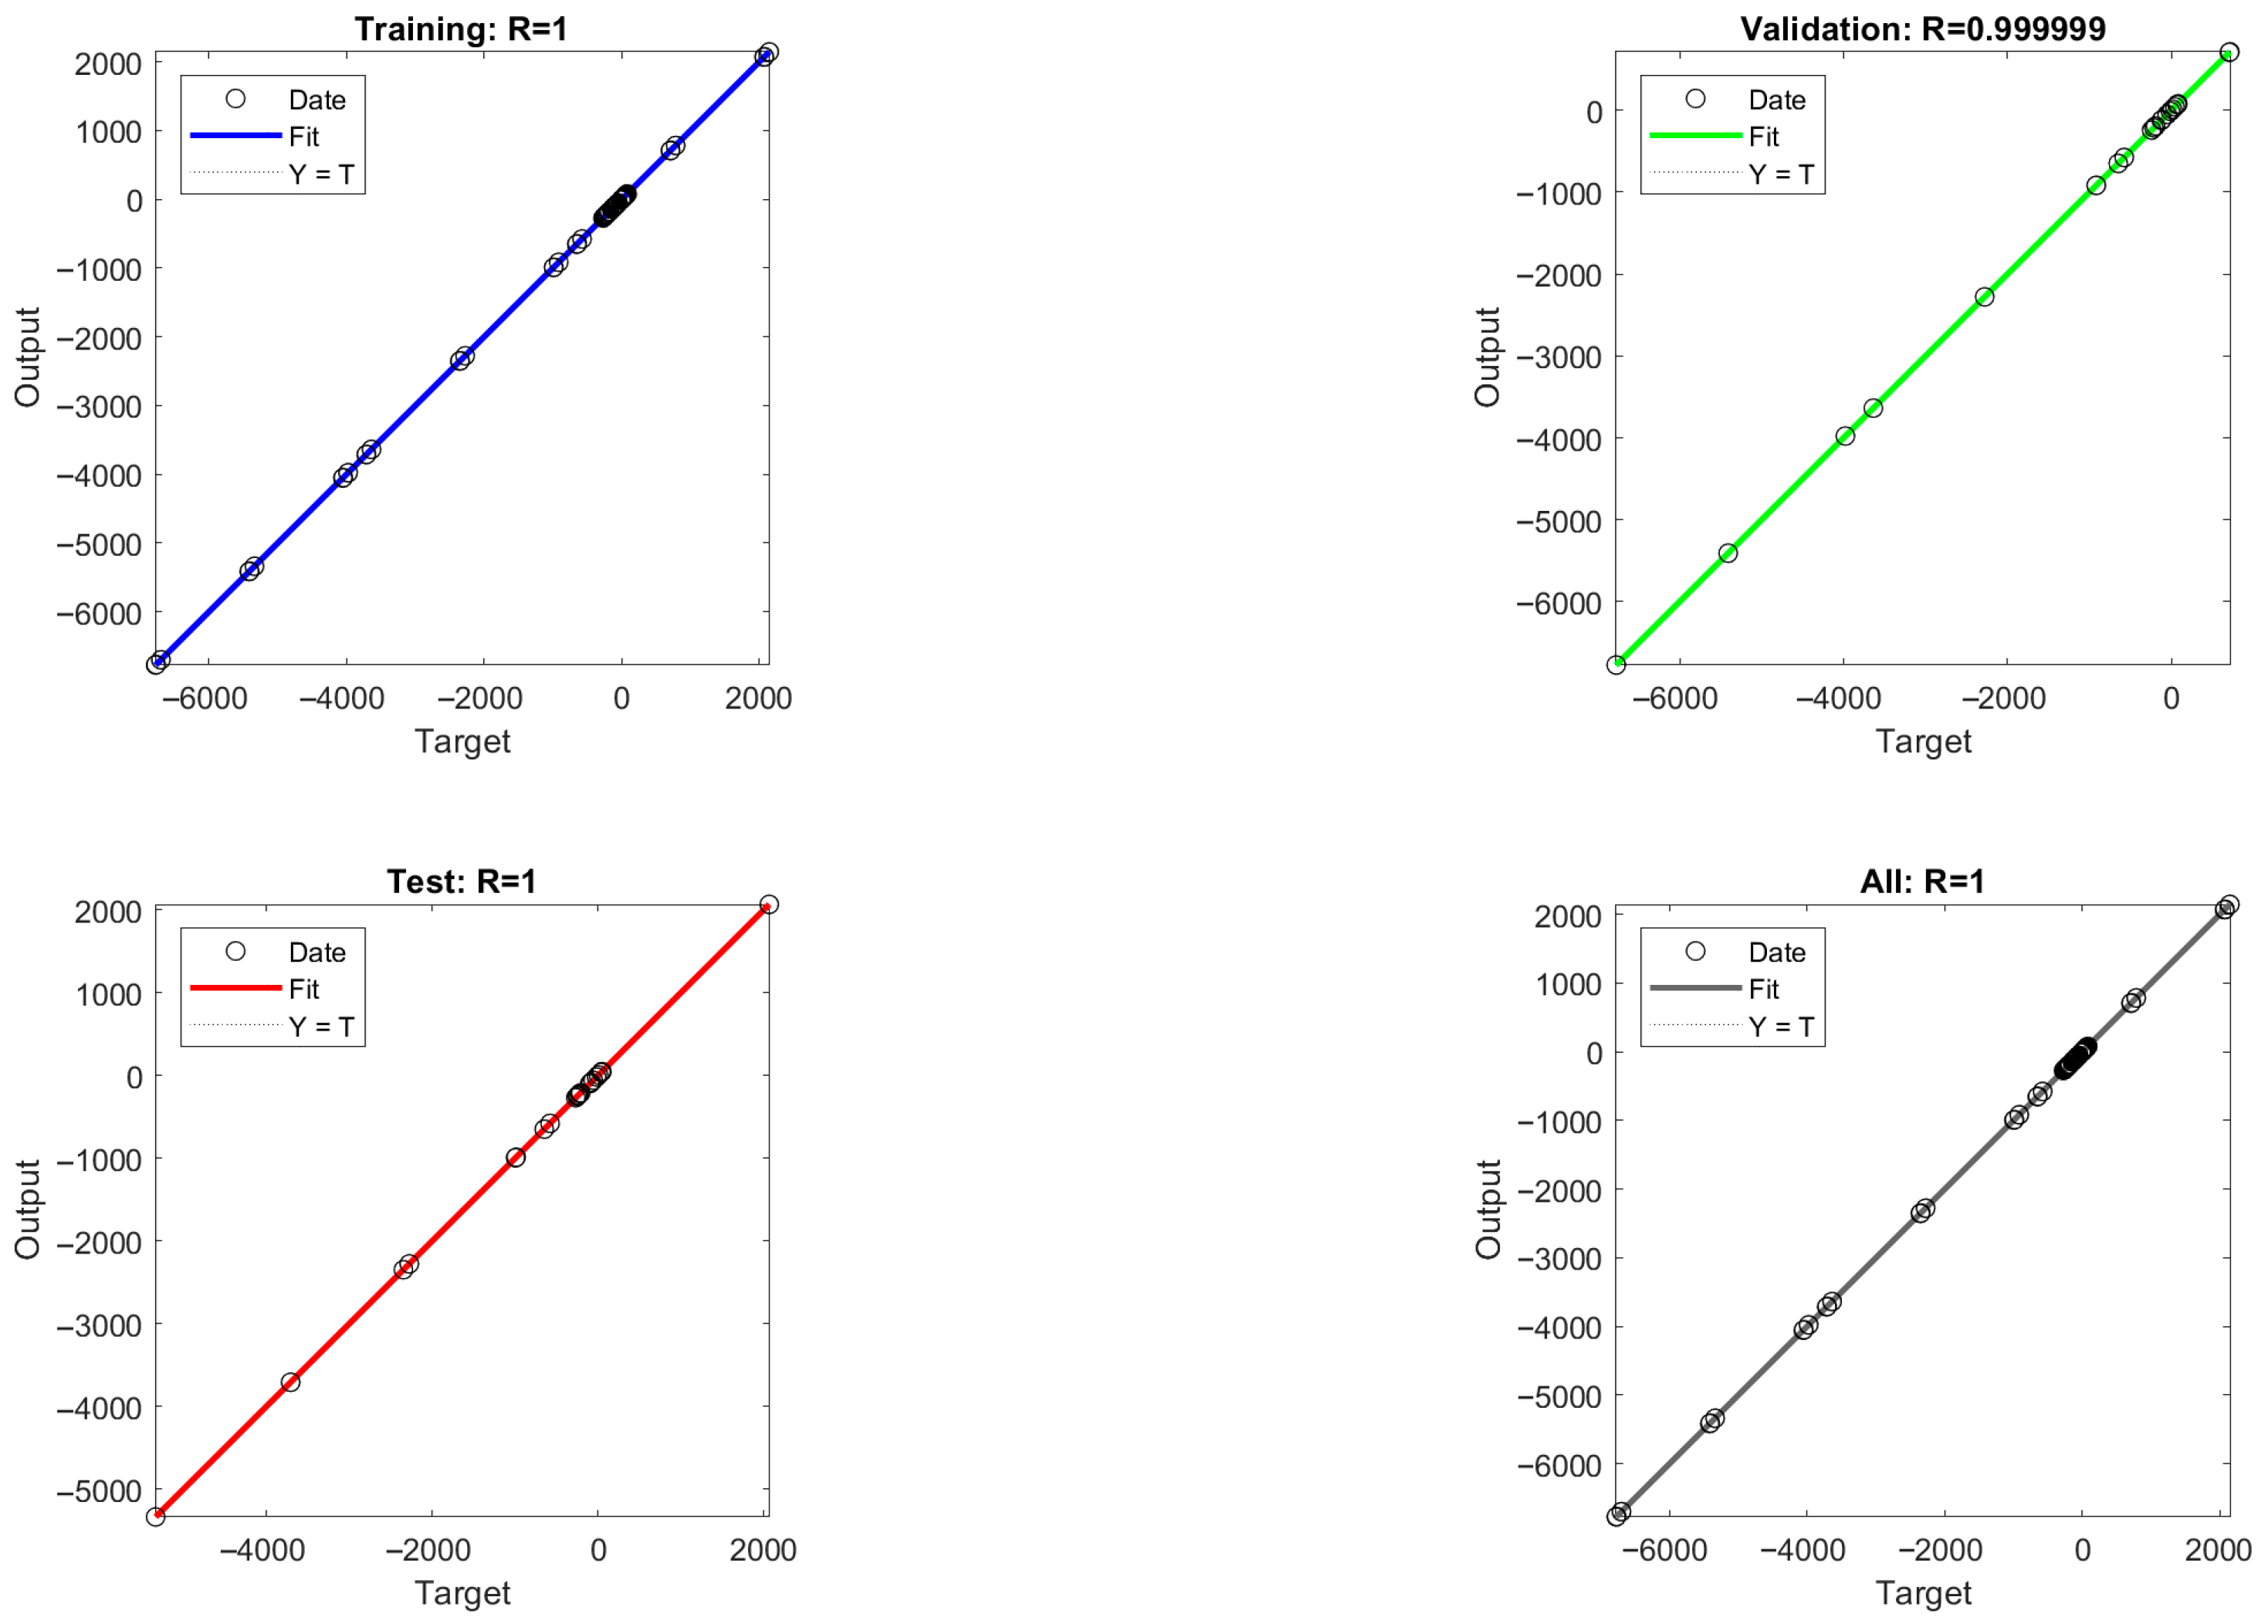
The mean square error (MSE) values between the model output values and the target values were calculated for different numbers of hidden layer neurons, and the MSE values are able to reflect the error between the predicted output values and the target values of the ANN model. As shown in Figure 8, it is found that the acidic process is predicted with nine neurons and the alkaline process is predicted with eight neurons, which is closer to the simulated value, so the optimal number of hidden layer neurons for the ANN-1 model for the acidic process and the ANN-2 model for the alkaline process are determined to be nine and eight, respectively. The structure and parameters of the ANN-1 and ANN-2 models are shown in Table S7. After data training the regression results of ANN-1 and ANN-2 model training, validation as well as testing can be obtained, as shown in Figure 9 and Figure 10. Here, the model correlation coefficient R can be used to reflect the correlation between the predicted output and the target value, and the closer the R value is to 1, the stronger the correlation. The R value of 0.999999 or 1 in the figure indicates a high degree of linear correlation, and all the output values and target values are linear and close to each other, which means that the trained Acidic ANN-1 model and Alkaline ANN-2 model are able to accurately predict the changes in the input variables and output variables, and they can be used as alternative models for subsequent optimisation.
This paper explores the analysis and optimisation of exergy loss and exergy economy of the equipment on the basis of ensuring the purity of 6N. The established ANN model is used as an alternative model, and the NSGA-II genetic algorithm is employed for dual-objective optimisation and prediction [24]. The optimisation process involves four decision variables Xi = [FT0101, MT0102, PP0101, MT0103] and two objective variables Yi = [ElPH3, EePH3]. The optimisation problem can be formulated as follows:
Y i = f A N N 1 ( X i )
l b < X i < u b
El PH 3 < v 1 ,   Ee PH 3 < v 2
where ElPH3 and EePH3 denote the loss of exergy and the economic cost of exergy of PH3, respectively, lb and ub are the boundary conditions of the input variables, and v1 and v2 are the upper bounds of the loss of exergy and the economy of exergy, respectively. In order to minimise the objective function with appropriate parameters, the population size optimised using NSGA-II was set to 100, the crossover rate was set to 0.8, the variability was set to 0.01, the Pareto distribution was set to 0.22, the migration interval was set to 60, the maximum number of stagnant generations was set to 100, and the longest time was set to 3600 s. The well-optimised parameters of the acidic process flow are shown in Table 6 and Table 7. There are nine results in total. It can be found that exergy loss and exergy economic cost cannot reach the optimal value at the same time, so it is necessary to comprehensively compare the reductions in each scheme, and finally, it can be determined that the No. 3 scheme is better, as it is able to reduce the exergy loss of 1714.1 kW and exergy economic cost of USD 3673, playing a very good role in exergy-saving and cost-saving effects. At this point in time, the feed position of T0101 is 9.57, the bottom molar flow rate of T0102 is 550 kmol/h, the pressure of P0101 is 18.38 bar, and the top molar flow rate of T0103 is 410.17 kmol/h. Plan 1 has the largest reduction in hydrogen hydrate and the smallest total hydrogen hydrate loss. Compared with Plan 3, this indicates that the reduction in T0102 distillate and the increase in pump P0101 pressure are beneficial for effectively utilising the total available energy. The above nine resultant scenarios were also subsequently brought into the original Aspen process for simulation; as the T0101 feed plate had to be an integer, rounding was used in the simulation to replace the optimisation calculations with integers. It can be found that the overall prediction results are extremely close to the simulated results, indicating that the prediction model established by ANN and optimised by the NSGA-II algorithm has a better overall predictability and generalisation ability, and the relative errors are all less than 1%, which is within the acceptable range. The predictability of this model is better for the loss of exergy, and the relative error is generally lower than that of the prediction of the exergy economy, which can be followed up by adding a separate model correction for the exergy economic cost to increase the accuracy of the prediction.
The well-optimised parameters of the alkaline process flow are shown in Table 8 and Table 9. Again, there are nine results. It can be observed that both the loss of available energy and the economic cost of available energy cannot reach their optimal values simultaneously. Therefore, it is necessary to comprehensively compare the reduction amount of each option, and we ultimately determine that option 1 is more desirable, which can reduce the loss of available energy by 150 kilowatts, with an economic cost of 1419.06 USD. It can play a good role in saving available energy and cost. At this time, the feed position of T0101 is 21.44, the bottom molar flow rate of T0102 is 138.5 kmol/h, the pressure of P0101 is 41.95 bar, and the top molar flow rate of T0103 is 788.53 kmol/h. Overall, there is not much difference between Plan 2 and Plan 9. At this point, the maximum reduction in hydrazone was achieved, and the overall loss of hydrazone was minimised. This indicates how the increase in the number of T0101 and T0103 boards can save energy and costs compared to Plan 1. The increase in the total number of plates in T0101 and the decrease in the distillate at the bottom of the tower in T0102 favour the efficient use of the overall energy. The above nine result scenarios were then also brought into the original Aspen process for simulation; since the total number of plates in T0101 must be an integer, rounding was used in the simulation to replace the optimisation calculations with integers. It can be found that the overall prediction results are extremely close to the simulated results, indicating that the prediction model established by ANN and optimised by the NSGA-II algorithm has a better overall predictability and generalisation ability, with the relative errors being below 1%, which is within the acceptable range. The predictability of this model is better for the loss, and the relative error is generally lower than that of the economy, but compared with the acidic process, the error is larger, mainly due to the fact that the alkaline process loss and economy are generally small, so the subsequent optimisation of the prediction can be carried out by a smaller MSE value, and more accurate prediction data have been obtained.
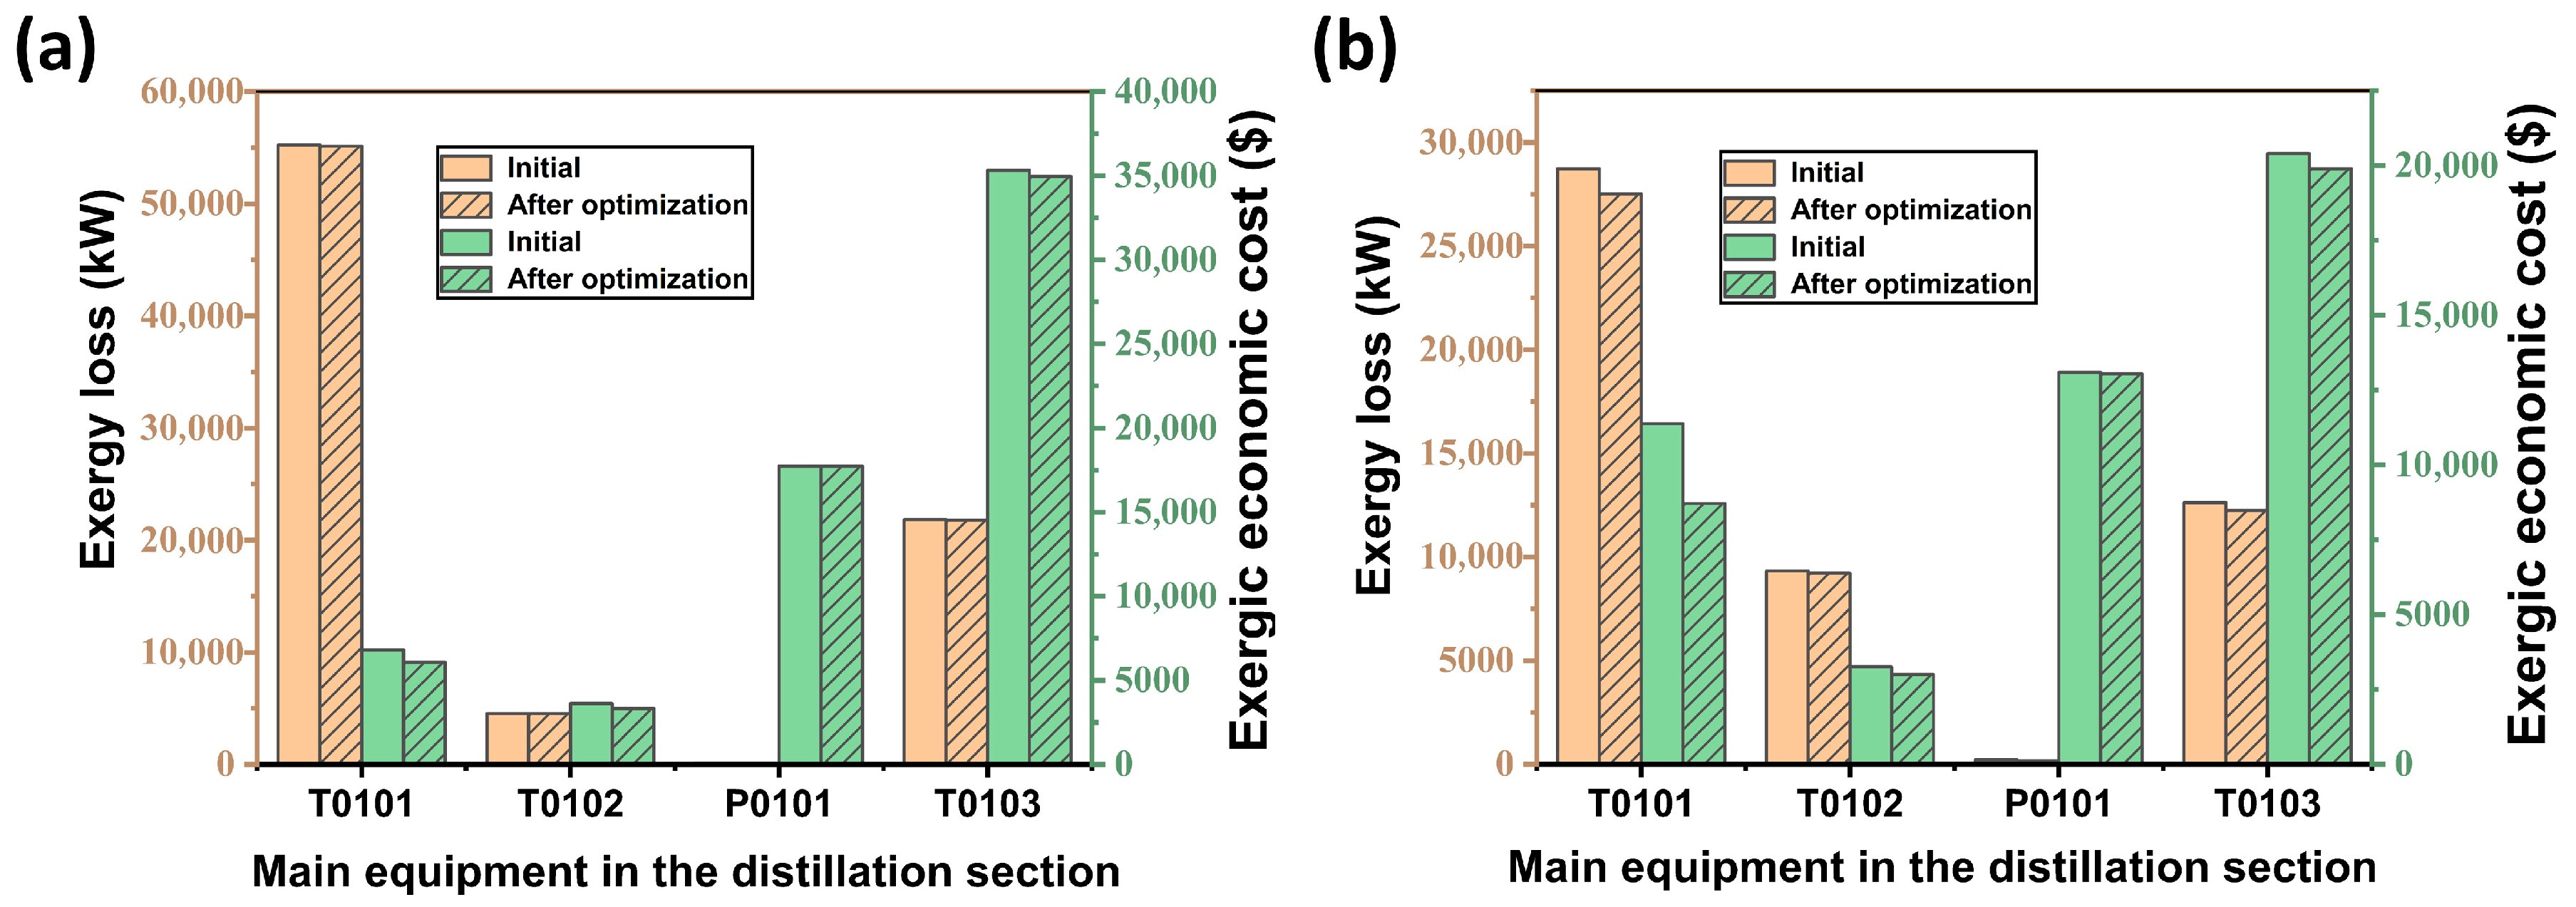
The respective losses and economic costs of T0101, T0102, P0101, and T0103 in the distillation section of the acidic and alkaline processes are analysed and compared, as shown in Figure 11a,b. It can be found that in the acidic process, T0101 achieves a reduction of 1214.65 kW in terms of loss, which corresponds to a reduction of USD 2673.53 in terms of economic cost of energy, and T0103 achieves a reduction of 3.08% and 2.45% in terms of loss and cost, respectively, compared to the previous one. The economic cost of energy of T0102 and the loss of energy of P0101 have decreased compared to the previous one, and the rest of the equipment has little change in the loss and cost. As for the alkaline process, only T0101 has a more significant decrease in the economic cost of the exergy, which is about 10.81% lower than the previous cost. Generally speaking, the optimised parameter scheme reduces the losses and economic costs of each device differently. T0101 and T0103 have a larger reduction, but the changes in other devices are smaller. It is possible to analyse the addition of other parameters of the devices and continue to build a more complete model to achieve a reduction in gas losses and economic costs.

6. Conclusions

To the best of our knowledge, no prior study has conducted a comprehensive comparison of acidic and alkaline routes for ultra-high-purity PH3 production, integrating Aspen Plus V14 simulation with exergy-based multi-objective optimisation. Therefore, process flow models were established for the two routes, respectively, for simulation analysis, and the exergy losses and efficiency generated by these models were studied in combination with the NSGA-II algorithm. By establishing acidic and alkaline processes, it was found that acidic processes have greater advantages in heat transfer optimisation. They can produce high-purity PH3 with efficient equipment and recover phosphoric acid as a high-purity by-product, resulting in higher total effective energy. The NaH2PO2 and Na2HPO4 produced by the alkaline process are difficult to recycle, but by increasing phosphoric acid, the effective energy is improved to a certain extent. However, the overall increase in feed volume will still affect the overall cost. From the perspective of heat exchange, alkaline processes require higher heat exchange than acidic processes, but alkaline processes have more advantages in equipment manufacturing costs. In terms of energy loss, the equipment efficiency of acidic processes is usually higher than that of alkaline processes, but the energy loss of both processes needs to be reduced through subsequent sensitivity analysis and design to achieve optimal utilisation. Furthermore, from the perspectives of environment and safety, the use of the distillation method is simple and feasible, which is conducive to achieving large-scale production operations. Moreover, after energy is optimised through heat exchange, it can be fully utilised, providing a strong guarantee for actual production. Therefore, in the production of high-purity PH3, acidic processes have significant advantages, while alkaline processes can be considered a better choice when large quantities of PH3 production are required and corrosion-resistant equipment is available.
Supplementary Materials

The following supporting information can be downloaded at: https://www.mdpi.com/article/10.3390/separations12100274/s1, Table S1: Standard chemical exergy for components of the acid process; Table S2: Standard chemical exergy for components in alkaline processes; Table S3: Acid process section thermal potential analysis; Table S4: Thermal potential analysis of alkaline process sections; Table S5: Exergy losses and exergy efficiency of equipment in the acid process; Table S6: Exergy losses and exergy efficiency of equipment in alkaline processes; Table S7: The structure and parameters of ANN-1 model for acidic process and ANN-2 model for alkaline process.

Author Contributions

Conceptualization, X.T. and J.W.; methodology, J.W.; software, Y.D.; validation, Y.L., J.G. and S.Z.; formal analysis, J.G.; investigation, S.Z.; resources, X.T.; data curation, Y.D.; writing—original draft preparation, Y.L.; writing—review and editing, X.T.; visualization, S.Z.; supervision, X.T.; project administration, J.W. All authors have read and agreed to the published version of the manuscript.

Funding

This research received no external funding.

Data Availability Statement

The original contributions presented in this study are included in the article/Supplementary Material. Further inquiries can be directed to the corresponding author(s).

Acknowledgments

The authors gratefully acknowledge financial support by the National Natural Science Foundation of China (51308306), Tianjin Natural Science Foundation (18JCTPJC54100), Tianjin Research Program of Application Foundation and Advanced Technology (14JCQNJC08400), and 111 Program, Ministry of Education, China (T2017002).

Conflicts of Interest

The authors declare no conflict of interest.

References

  1. Harris, T.M.; Dang, Q.D. The Mechanism of Phosphorus Incorporation during the Electrodeposition of Nickel-Phosphorus Alloys. J. Electrochem. Soc. 1993, 140, 81. [Google Scholar] [CrossRef]
  2. Tutuc, E.; Chu, J.O.; Ott, J.A.; Guha, S. Doping of germanium nanowires grown in presence of PH3. Appl. Phys. Lett. 2006, 89, 263101. [Google Scholar] [CrossRef]
  3. Szargut, J. Exergy Method Technical and Ecological Applications; WIT Press: Southampton, UK, 2005. [Google Scholar]
  4. Valero, A.; Valero, A.; Marti´nez, A. Exergy Evaluation of the Mineral Capital on Earth: Influence of the Reference Environment. In Proceedings of the ASME 2005 International Mechanical Engineering Congress and Exposition, Orlando, FL, USA, 5–11 November 2005; pp. 235–242. [Google Scholar]
  5. Alam, M.W.; Bhattacharyya, S.; Souayeh, B.; Dey, K.; Hammami, F.; Rahimi-Gorji, M.; Biswas, R. CPU heat sink cooling by triangular shape micro-pin-fin: Numerical study. Int. Commun. Heat Mass Transf. 2020, 112, 104455. [Google Scholar] [CrossRef]
  6. Allgood, C.C. Fluorinated gases for semiconductor manufacture: Process advances in chemical vapor deposition chamber cleaning. J. Fluor. Chem. 2003, 122, 105–112. [Google Scholar] [CrossRef]
  7. Li, L.; Protière, M.; Reiss, P. Economic Synthesis of High Quality InP Nanocrystals Using Calcium Phosphide as the Phosphorus Precursor. Chem. Mater. 2008, 20, 2621–2623. [Google Scholar] [CrossRef]
  8. He, T.; Lin, W. A novel propane pre-cooled mixed refrigerant process for coproduction of LNG and high purity ethane. Energy 2020, 202, 117784. [Google Scholar] [CrossRef]
  9. Xia, W.; Zhou, Z.; Sheng, L.; Chen, L.; Shen, F.; Zheng, F.; Zhang, Z.; Yang, Q.; Ren, Q.; Bao, Z. Bioinspired recognition in metal-organic frameworks enabling precise sieving separation of fluorinated propylene and propane mixtures. Nat. Commun. 2024, 15, 8716. [Google Scholar] [CrossRef]
  10. Vorotyntsev, A.V.; Petukhov, A.N.; Trubyanov, M.M.; Atlaskin, A.A.; Makarov, D.A.; Sergeeva, M.S.; Vorotyntsev, I.V.; Vorotyntsev, V.M. Progress and perspectives in high-purity substance production for semiconductor industry. Rev. Chem. Eng. 2021, 37, 125–161. [Google Scholar] [CrossRef]
  11. Xia, W.; Zhou, Z.; Sheng, L.; Chen, L.; Zheng, F.; Zhang, Z.; Yang, Q.; Ren, Q.; Bao, Z. Deep purification of perfluorinated electronic specialty gas with a scalable metal–organic framework featuring tailored positive potential traps. Sci. Bull. 2025, 70, 232–240. [Google Scholar] [CrossRef]
  12. Xia, W.; Zhou, Z.; Xia, C.; Chen, L.; Sheng, L.; Zheng, F.; Zhang, Z.; Yang, Q.; Ren, Q.; Bao, Z. Hopping Diffusion in Wiggling Nanopore Architecture of MOF Enabling Synergistic Equilibrium-Kinetic Separation of Fluorinated Propylene and Propane. Angew. Chem. Int. Ed. 2025, 64, e202503505. [Google Scholar] [CrossRef] [PubMed]
  13. Cai, L.; Ye, Y. A flexible-robust MOF for efficient purification of perfluoropropane. Chin. J. Struct. Chem. 2024, 43, 100368. [Google Scholar] [CrossRef]
  14. Ji, Z.; Zhou, Y.; Krishna, R.; Hong, M.; Wu, M. Scalable Synthesis of Stable Hydrogen-Bonded Organic Framework for Efficient Hexafluoroethane Purification. Angew. Chem. Int. Ed. 2025, 64, e202513398. [Google Scholar] [CrossRef]
  15. Fu, Y.; Sheng, L.; Xia, W.; Hai, G.; Yan, J.; Chen, L.; Yang, Q.; Zhang, Z.; Ren, Q.; Bao, Z. Fine-tuned ultramicroporous carbon materials via CO2 activation for molecular sieving of fluorinated propylene and propane. Ind. Chem. Mater. 2025, 3, 567–577. [Google Scholar] [CrossRef]
  16. Luo, M.; Yi, Y.; Wang, C.; Liu, K.; Pan, J.; Wang, Q. Energy and Exergy Analysis of Power Generation Systems with Chemical Looping Combustion of Coal. Chem. Eng. Technol. 2018, 41, 776–787. [Google Scholar] [CrossRef]
  17. Zhao, Z.; Su, W.; Wang, M.; Yang, W.; Hao, Q.; Yu, X.; Wang, H. Simulation of Azelaic Acid Crystallization Process Based on MATLAB and Aspen Plus. Chem. Eng. Technol. 2025, 48, e70079. [Google Scholar] [CrossRef]
  18. Ramírez, A.; Gutiérrez-Antonio, C. Multiobjective Optimization of Chemical Processes with Complete Models using MATLAB and Aspen Plus. Comput. Y Sist. 2018, 22, 1157–1170. [Google Scholar] [CrossRef]
  19. Nishiyama, F.E.; Machado, G.D.; Cordeiro, P.H.Y.; Fernandes, R.P.; Bonfim-Rocha, L.; Costa, C.B.B. Optimizing the production of solketal from glycerol: A case study integrating Aspen Plus and a MATLAB subroutine. Chem. Eng. Commun. 2025, 212, 713–727. [Google Scholar] [CrossRef]
  20. Song, R.; Cui, M.; Liu, J. Single and multiple objective optimization of a natural gas liquefaction process. Energy 2017, 124, 19–28. [Google Scholar] [CrossRef]
  21. Cui, Z.; Tian, W.; Zhang, H.; Guo, Q. Multi-scale modeling and control of chemical looping gasification coupled coal pyrolysis system for cleaner production of synthesis gas. J. Clean. Prod. 2021, 299, 126903. [Google Scholar] [CrossRef]
  22. Yang, L.; Chen, Y.; Wang, J.; Luo, Y.; Zhou, P.; Zhang, X. The Simulation and Optimization of the Tetrafluoroethylene Rectification Process. Separations 2024, 11, 37. [Google Scholar] [CrossRef]
  23. Kameyama, H.; Yoshida, K.; Yamauchi, S.; Fueki, K. Evaluation of reference exergies for the elements. Appl. Energy 1982, 11, 69–83. [Google Scholar] [CrossRef]
  24. Lotfan, S.; Ghiasi, R.A.; Fallah, M.; Sadeghi, M.H. ANN-based modeling and reducing dual-fuel engine’s challenging emissions by multi-objective evolutionary algorithm NSGA-II. Appl. Energy 2016, 175, 91–99. [Google Scholar] [CrossRef]
Figure 1. Process flow diagram for the preparation of high-purity PH3 by acidic process.
Separations 12 00274 g001
Figure 2. Process flow diagram for the preparation of high-purity PH3 by alkaline process.
Separations 12 00274 g002
Figure 3. Temperature and enthalpy diagrams of cold and heat flow for acidic processes, total combination diagrams, and pinch-point temperature–cost correlation curves: (a), (b), and (c), respectively; temperature and enthalpy diagrams of cold and heat flow for alkaline processes, total combination diagrams, and pinch-point temperature–cost correlation curves: (d), (e), and (f), respectively.
Separations 12 00274 g003
Figure 4. (a) Design of acidic process heat transfer network; (b) optimised design of acidic process heat transfer network.
Separations 12 00274 g004
Figure 5. (a) Design of heat transfer network for alkaline process; (b) optimised design of heat transfer network for alkaline process.
Separations 12 00274 g005
Figure 6. (a) Acidic process main equipment exergy efficiency. (b) Alkaline process main equipment exergy efficiency. (c) Acidic process exergy loss share of each equipment. (d) Alkaline process exergy loss share of each equipment.
Separations 12 00274 g006
Figure 7. ANN model.
Separations 12 00274 g007
Figure 8. (a) MSE values for different numbers of hidden layers for acidic processes; (b) MSE values for different numbers of hidden layers for alkaline process flow.
Separations 12 00274 g008
Figure 9. Acidic process flow: ANN-1 model training, validation, and regression results from testing.
Separations 12 00274 g009
Figure 10. Alkaline process flow: ANN-1 model training, validation, and regression results from testing.
Separations 12 00274 g010
Figure 11. Losses of equipment in the distillation section and changes in economic costs: (a) acidic process; (b) alkaline process.
Separations 12 00274 g011
Table 1. Acidic feed parameters.
ComponentMole Flow (kmol/h)Mole FractionFeed Rate (t/h)Quality Fraction
H2O280.535504.430.313
H3PO440.008391.980.244
P200.382619.480.385
CO20.120.0025.280.003
N21.20.02333.620.021
H21.20.0232.420.002
H2S0.120.0024.090.003
O21.20.02338.400.024
ASH30.120.0029.350.006
Table 2. Parameters of alkaline feed.
ComponentMole Flow (kmol/h)Mole FractionFeed Rate (t/h)Quality Fraction
H2O140.093252.210.042
P200.133619.480.102
NaOH140.093559.960.092
CO20.120.0015.280.001
H2S0.120.0014.090.001
ASH30.120.0019.350.002
O21.20.0086.400.001
N21.20.0085.600.001
C2H6O1000.6634606.900.759
H3PO46 587.97
Table 3. Comparison of optimisation results for acidic process heat transfer network.
ItemsPre-OptimisationPost-Optimisation
Heating [kJ/h] 111,639,447.9101,167,451.3
Cooling [kJ/h]66,858,487.556,386,491
Total Area [m2]4522.1716432380.591404
Heating [Cost/s]0.0925415740.082935551
Cooling [Cost/s]0.103401150.106513049
Operating [Cost/s]0.1959427230.1894486
Capital [Cost]1,104,160.057614,144.9135
Total Cost [Cost/s]0.2051789810.194585899
Table 4. Comparison of optimisation results of heat transfer networks for alkaline processes.
ItemsPre-OptimisationPost-Optimisation
Heating [kJ/h]303,572,659.5239,346,952.2
Cooling [kJ/h]303,775,794.6239,550,087.4
Total Area [m2]27,659.4927125,626.26993
Heating [Cost/s]0.2708671220.327619856
Cooling [Cost/s]0.472320680.341142271
Operating [Cost/s]0.4994073920.341175033
Capital [Cost]6,384,709.115824,393.0725
Total Cost [Cost/s]0.5528152490.411757221
Table 5. Boundary conditions for decision variables.
Acidic ProcessAlkaline Process
Device VariableLower LimitUpper LimitDevice VariableLower LimitUpper Limit
FT0101119TT01011630
MT0102/(kmol/h)450550MT0102/(kmol/h)100200
PP0101/bar550PP0101/bar550
MT0103/(kmol/h)400500MT0103/(kmol/h)700850
Table 6. Acidic process equipment optimisation scheme.
Optimisation PlanFT0101MT0102/(kmol/h)PP0101/BarMT0103/(kmol/h)
19.77494.9335.30414.61
29.75498.2328.95412.40
39.57550.0018.38410.17
49.66543.7229.92413.69
59.65513.8633.53414.05
69.73517.7632.16414.61
79.70534.3833.13412.33
89.64538.7134.74413.67
99.77495.6033.33413.43
Table 7. Acidic process optimisation results.
Optimisation PlanElPH3/kWEePH3/USD
Prediction ResultSimulation ResultRelative ErrorPrediction ResultSimulation ResultRelative Error
11879.30 1875.24 0.22%2000.00 1986.73 0.66%
21867.20 1864.01 0.17%2176.60 2166.53 0.46%
31714.10 1711.35 0.16%3673.00 3665.46 0.21%
41740.00 1738.79 0.07%3352.40 3350.98 0.04%
51828.10 1825.26 0.16%2524.10 2524.65 0.02%
61817.10 1814.57 0.14%2605.10 2607.67 0.10%
71769.10 1767.80 0.07%3147.40 3152.67 0.17%
81757.30 1756.14 0.07%3212.90 3215.62 0.08%
91876.30 1872.84 0.18%2065.50 2053.12 0.60%
Table 8. Alkaline process equipment optimisation scheme.
Optimisation PlanTT0101MT0102/(kmol/hr)PP0101/BarMT0103/(kmol/h)
121.44138.5041.95788.53
228.61118.9338.41785.22
321.71135.6128.29789.08
425.27124.6121.72787.95
521.91133.8323.97788.83
623.30126.6421.22787.42
725.61128.8722.08788.75
825.91123.7219.47788.27
928.61118.9338.41785.22
Table 9. Alkaline process optimisation results.
Optimisation PlanElPH3/kWEePH3/USD
Prediction ResultSimulation ResultRelative ErrorPrediction ResultSimulation ResultRelative Error
1150.00149.280.48%1419.601409.410.72%
2198.90194.500.22%1000.00994.660.53%
3150.00147.990.13%1307.701315.800.62%
4175.20171.000.24%1037.501045.110.73%
5152.20149.600.71%1263.701274.680.87%
6169.50165.250.51%1113.801123.360.86%
7164.50160.660.23%1126.101137.200.99%
8176.10171.670.25%1000.001003.970.40%
9198.90194.500.22%1000.00995.580.44%
Disclaimer/Publisher’s Note: The statements, opinions and data contained in all publications are solely those of the individual author(s) and contributor(s) and not of MDPI and/or the editor(s). MDPI and/or the editor(s) disclaim responsibility for any injury to people or property resulting from any ideas, methods, instructions or products referred to in the content.