Abstract
Bone density is considered one of the many factors influencing bone structure and DNA preservation. For this reason, it is of interest in fields such as anthropology, palaeontology, and genetics. This study describes a method for bone density assessment by gradient centrifugation in Sodium Poly-Tungstate (SPT) solutions (from 2.1 to 2.6 g/cm3). Fifty milligrams of bone powder (size range of 20–50 µm) were used, with an average recovery of 89.9 (IC = 3.3% at 95% of probability). In the first phase of the experiment, the protocol was applied to ten femurs: three exhumed from the WWII mass grave of Ossero, three aged (43–50 years old) femurs from a museum collection and four fresh controls. In the subsequent phase, the analysis was extended to three petrous bones, three metacarpals, and three metatarsals exhumed from the WWII mass grave. The SPT density gradient profiles revealed marked differences among the three femur sample sets: more than 80% of the powder from control femurs was recovered in fractions with a density ≤ 2.2 g/cm3, whereas approximately 45% of the femurs from the mass grave showed a density > 2.6 g/cm3. The remaining three aged femurs displayed peculiar density patterns. Among the other bone types, metatarsals showed the lowest density values, followed by petrous bones and metacarpals. To detect degradation signatures, all nineteen bone powders were also analysed by ATR-FTIR. The femurs from the mass grave exhibited spectral features consistent with mineral recrystallisation and degradation of the organic phase, whereas the other three aged femurs showed peculiar spectral profiles; metacarpals, petrous bones and metatarsals showed intermediate spectra. PCA was applied to SPT and ATR-FTIR data, revealing correlations that support the SPT method as a novel tool for bone quality assessment. Although based on a limited sample size, this preliminary work demonstrates that SPT gradient analysis is an effective, low-cost, rapid and reliable method for assessing bone density, with potential applications in different disciplines studying aged bone samples. Lastly, principal component analysis (PCA) revealed a correlation between bone density and the yield of DNA recovered from the ten femoral specimens.
1. Introduction
Bone density measures the amount of minerals (composed mainly of calcium in the form of Hydroxyapatite, Ca10(PO4)6(OH)2) contained in a certain volume of bone [1], which is commonly indicated as Bone Mineral Density (BMD) [2,3,4] and varies not only between individuals, being influenced by factors such as age [4], sex [5] and lifestyle [6], but also within the same bone, where the dense cortical layer contrasts with the more porous trabecular region [1]. Even cortical the bone, however, exhibits multi-scale porosity, which varies between different bones and across different regions of the same bone [1,7]. As a result, density assessment requires distinguishing between true density (mass per volume excluding pores) and bulk density (including pore space) [1]. Overall, according to Bell [8], the true density of the cortical bone typically ranges from 1.7 to 2.4 g/cm3 in humans.
In clinical practice, BMD (expressed in g/cm2) is commonly measured using radiological techniques to diagnose osteoporosis and assess fracture risk [9,10]. On the other hand, the true volumetric density (g/cm3) can be determined using physicochemical approaches such as gradient centrifugation [8,11,12]. Both techniques have proven to be useful mainly in anthropology and forensics, where bone remains represent a valuable source of information, providing clues about age at death [13], cause of death [2], and past lifestyles [8].
After death, bones undergo diagenesis which affect both organic (collagen and DNA) and inorganic (Hydroxyapatite) components [14]. This process is influenced by many factors such as microbial activity, pH, and soil moisture [15], which directly impact bone density. Denser bones are thought to offer greater resistance to diagenetic degradation, and several studies have explored the correlation between bone density and DNA preservation. For instance, Ibrahim et al. [16] highlighted the high osteocyte density of the petrous bone, suggesting a greater potential for ancient DNA recovery. Similarly, Geršak et al. [17] observed a positive correlation between bone density and DNA quantity in compact regions such as the calcaneus and talus. However, this association is not consistent across all bone types, indicating that bone density is likely just one of the multiple factors influencing DNA preservation.
To investigate the relationship between bone density and biomolecular preservation, Fernandes et al. [18] proposed the use of SPT (Sodium Poly-Tungstate) as a tool for gradient separation of the bone powder. This pivotal study demonstrated that the densest fractions (2.3–2.4 g/cm3) obtained from the inner part of 1.5–4.0 Ky of petrous bones yielded the highest DNA quantities, suggesting a link between DNA preservation and the chemical-physical properties of this bone [18]. The method proposed by Fernandes et al. [18] is low-cost, requires only a few days of lab work, and relies on routine laboratory equipment. In addition, its employment reduces the need for money and time-consuming DNA extraction procedures that can result in unsuitable samples. However, the Authors cautioned against generalising their findings because skeletal elements vary in their degree of mineralisation and, consequently, in density. In addition, petrous bones are not always available, while long bones, such as femurs, are more frequently recovered in archaeological and forensic contexts. Therefore, since the study of Fernandes et al. [18] strongly supports the need for further investigations into other types of bones, in the present work we used a modified SPT protocol to analyze decade-aged femurs buried under different conditions.
Collagen loss and increased porosity, leading to a decrease in mass/volume, usually occur in post-mortem [15,19], whereas Hydroxyapatite recrystallization can increase density, up to fossilisation, in later diagenetic stages [20,21]. Thus, bone density and crystallinity are two interrelated parameters that can be jointly used to assess post-mortem diagenetic alterations. Since one of the most established methods for studying diagenesis is the Fourier Transform InfraRed (FTIR) spectroscopy, we also applied this technology to the same decade-aged samples analysed by SPT gradient analysis.
FTIR provides insight into bone diagenesis through specific spectral indices that reflect molecular and structural integrity [14,22]. Among these, the amide-to-phosphate (Am/P) ratio [23] is a key marker of organic preservation, with the Amide I band serving as a proxy for collagen content. The carbonate-to-phosphate (C/P) ratio [24] indicates carbonate substitution within the mineral phase, while the B-type carbonate substitution index (BPI) [25] quantifies phosphate replacement by carbonate in the hydroxyapatite lattice. Lastly, the Infrared Splitting Factor (IRSF) [26] is widely used to assess the crystallinity and structural order of bioapatite, with higher values often associated with recrystallisation due to diagenesis [27].
The present study highlights the correlation between the data obtained by using the proposed SPT method and those which arise from the well-established FTIR spectroscopy. To further support this correlation, the results obtained from femurs will be discussed in comparison with those from petrous bones and other smaller skeletal elements such as metacarpals and metatarsals recovered in a WWII mass grave.
2. Materials and Methods
2.1. Sample Selection
For this preliminary study, we selected 19 samples, as listed in Table 1.

Table 1.
Samples included in the study.
In the first phase of the study, we focused on gradient separation on 10 femur samples, including three from different male subjects buried in distinct sites of the Italian Karst of the Trieste area for estimated periods ranging from 3 to 15 years, and three from male subjects buried in the WWII mass grave of Ossero for 74 years. A detailed description of the geo-climatic features of this mass grave is reported in ref. [28]. The Italian Karst of the Trieste area is located in northeastern Italy, near the border with Slovenia. It consists of a limestone plateau rising up 300 m above sea level, bounded by the Adriatic Sea. Geologically, the area is characterized by extensive karstification; the cost zone is muddy and marshy. After collection, all samples were stored at room temperature in cardboard boxes for 5 to 40 years.
The femur of a 41-year-old male, who died in a road accident, was used as a fresh control. Four sections of the sample, approximately 5 mm thick, were dehydrated with four different protocols, generating samples #23, #24, #25, and #26. Specifically, sample #23 was incubated in water at room temperature, with agitation, for 72 h, and then lyophilized using a LIO-5PDGT (5 Pascal, Milano, Italy) apparatus for 24 h; sample #24 was immediately lyophilized for 24 h; sample #25 was incubated in water at room temperature, with agitation, for 72 h, and then dried in a sand bath at 37 °C for 48 h; sample #26 was dried immediately in a sand bath at 37 °C for 48 h.
The outer, or cortical, part was used in all ten femur samples selecting the section corresponding to the “80% localisation” of Lyman [1] (i.e., the proximal part of the diaphysis; see Figure A1).
In the second phase of the study, gradient analysis was extended to other bone elements, including the inner part of three petrous bones (see Figure A2) and the epiphysis of three metacarpals and three metatarsals from the same WWII mass grave. Any trace of spongy bone was mechanically removed from all samples using burs (see Figure A3).
2.2. Bone Pulverization
The bone powder was prepared from each sample according to our previous work [28] with some modifications. Briefly, to remove soil, the surfaces of the bones were cleaned mechanically using brushes and rotary sanding tools. Bones were then pulverized at 30 Hz for 1–2 min using an MM 400 Planetary Ball Mills (Retsch, Haan, Germany) equipped with metal grinding vials of 25 mL and metal balls with a diameter of 16 mm (Verder, Castleford, UK). Liquid nitrogen was used to prevent the heating of the samples [29]. Importantly, since preliminary tests showed high intra-sample variability with respect to the powder granularity, all the experiments reported here were conducted with bone powder samples selected in the size range between 20 and 50 µm. To this aim, the samples were dry-filtered through Velo Nitex sieves (Sefar, Milano, Italy) of the above-mentioned mash. The resulting samples were stored in 50 mL Falcon tubes at room temperature in the dark until use.
2.3. Gradient Centrifugation with SPT
Sodium Poly-Tungstate (SPT) was purchased from Sigma (cat. n. 71913-100G, Aizu, Japan). SPT gradient analysis was performed according to Fernandes et al. [18] with modifications. Our protocol is based upon the use of six different SPT solutions: 2.1, 2.2, 2.3, 2.4, 2.5, and 2.6 g/cm3 (see Table S1 for solution compositions). Fifty milligrams of bone powder were vortexed with 400 µL of the 2.1 g/cm3 solution in an Eppendorf tube and centrifuged at 20.250 g for 4 min at 17 °C. The supernatant was carefully removed and transferred into an empty Eppendorf, whereas the pellet was redissolved in the 2.2 g/cm3 solution following the steps shown in Figure S1. Thus, at the end of the entire centrifugation procedure, each bone powder was separated into seven fractions (<2.1, 2.1–2.2, 2.2–2.3, 2.3–2.4, 2.4–2.5, 2.5–2.6, and >2.6 g/cm3). The samples were then washed twice with bi-distilled water and finally dried at 65 °C, with rotation, for 16 h using an Eppendorf 5301 concentrator apparatus (Sigma-Aldrich, St. Louis, MI, USA). The Eppendorf tubes (containing the dried samples) were weighed using an Eu 500 Gibertini (Milan, Italy) balance with a precision of ±0.001 g. The net weight of each sample was calculated from the gross weight, which was subtracted from one of the empty tubes.
To assess the intra-day and inter-day variability of the developed method, two bone powder samples (namely samples #17 and #26) were analyzed by six independent tests (three tests on two different working days for each sample).
2.4. ATR-FTIR
Attenuated Total Reflectance–Fourier Transformed Infrared spectroscopy (ATR-FTIR) measurements were performed at the SISSI-Bio Beamline of Elettra Sincrotrone Trieste, Italy [30] on the bone samples reported in Table 1 using a Bruker VERTEX 70 spectrophotometer (Bruker Optik GmbH, Ettlingen, Germany) equipped with a single-reflection diamond ATR crystal. All the spectra were acquired in the spectral range 4000–500 cm−1, averaging 128 scans at 4 cm−1 spectral resolution, zero filling factor 2. About 3 mg of the same bone powder used for SPT centrifugation (20–50 μm particle size) were used for each measurement, and after each measurement, the crystal plate and the anvil of the pressure applicator were thoroughly cleaned using isopropyl alcohol. Samples were run in triplicate, and data analysis was performed using Quasar v1.10.1 open-source software [31,32]. A baseline correction was applied to all spectra within the spectral range of 3800–500 cm−1 (rubberband), followed by vector normalization.
ATR-FTIR preservation indices were selected based on Kontopoulos et al. [27], including the infrared splitting factor (IRSF) [26], the carbonate-to-phosphate (C/P) ratio [24], the type B carbonate substitutions relative to phosphate (BPI) [25], and the amide-to-phosphate ratio (Am/P) [23]. Averaged data from the triplicate runs were used for the calculations. Table S2 provides detailed information on the spectral ranges, baseline definitions, and calculation methods for each index.
In addition, to investigate the burial environment and its potential impact on bone diagenesis, ATR-FTIR analysis was performed on soil particles recovered from the surface of two metatarsals collected from the mass grave, as well as from two bone elements belonging to one Italian Karst burial site.
2.5. DNA Analyses
DNA extraction and quantification were performed on the ten femur samples. In detail, 0.5 g of the same bone powders used for SPT and ATR-FTIR were employed for DNA extraction as described in ref. [28]. Negative extraction control was processed.
Quantification was performed using the PowerQuant™ System kit (Promega, Madison, WI, USA) on a 7500 Real-Time PCR System for Human Identification (Applied Biosystems, Foster City, CA, USA), employing HID Real-Time PCR analysis software. One microliter of each sample was run in duplicate. Negative controls were run as well [28].
2.6. Data Analysis
Calculations were carried out both on the net weight of the bone powders recovered after centrifugation and by normalizing the weight of each fraction to the total weight of the seven fractions. Experimental data were recorded in Microsoft Excel files and processed using open-source software [33], based on R [34].
The data from the SPT centrifugation analysis and the ATR-FTIR were used for Principal Component Analysis (PCA) after autoscaling. DNA quantification data of the ten femur samples were used for PCA as well.
3. Results and Discussion
The results of our study are presented as follows.
3.1. Assessment of the Gradient Centrifugation Method with SPT
As shown in Table 2, six independent tests were performed on two representative bone powders: a 79-year-old femur (#17) and a fresh control (#26). After SPT gradient centrifugation of 50 mg of bone powder, 49 mg of sample (on average) was recovered (I.C. = 2 at 0.95). Overall, the recovery of the two bone powders showed no difference at t-test (p-value = 0.220).

Table 2.
Intra and inter-day assessment of the recovery. n.
Lower RSD % values on day 2 are likely due to the improvement of the operator manual skill. In addition, we believe that the employment of an analytical balance with higher sensitivity could reduce the variability as well.
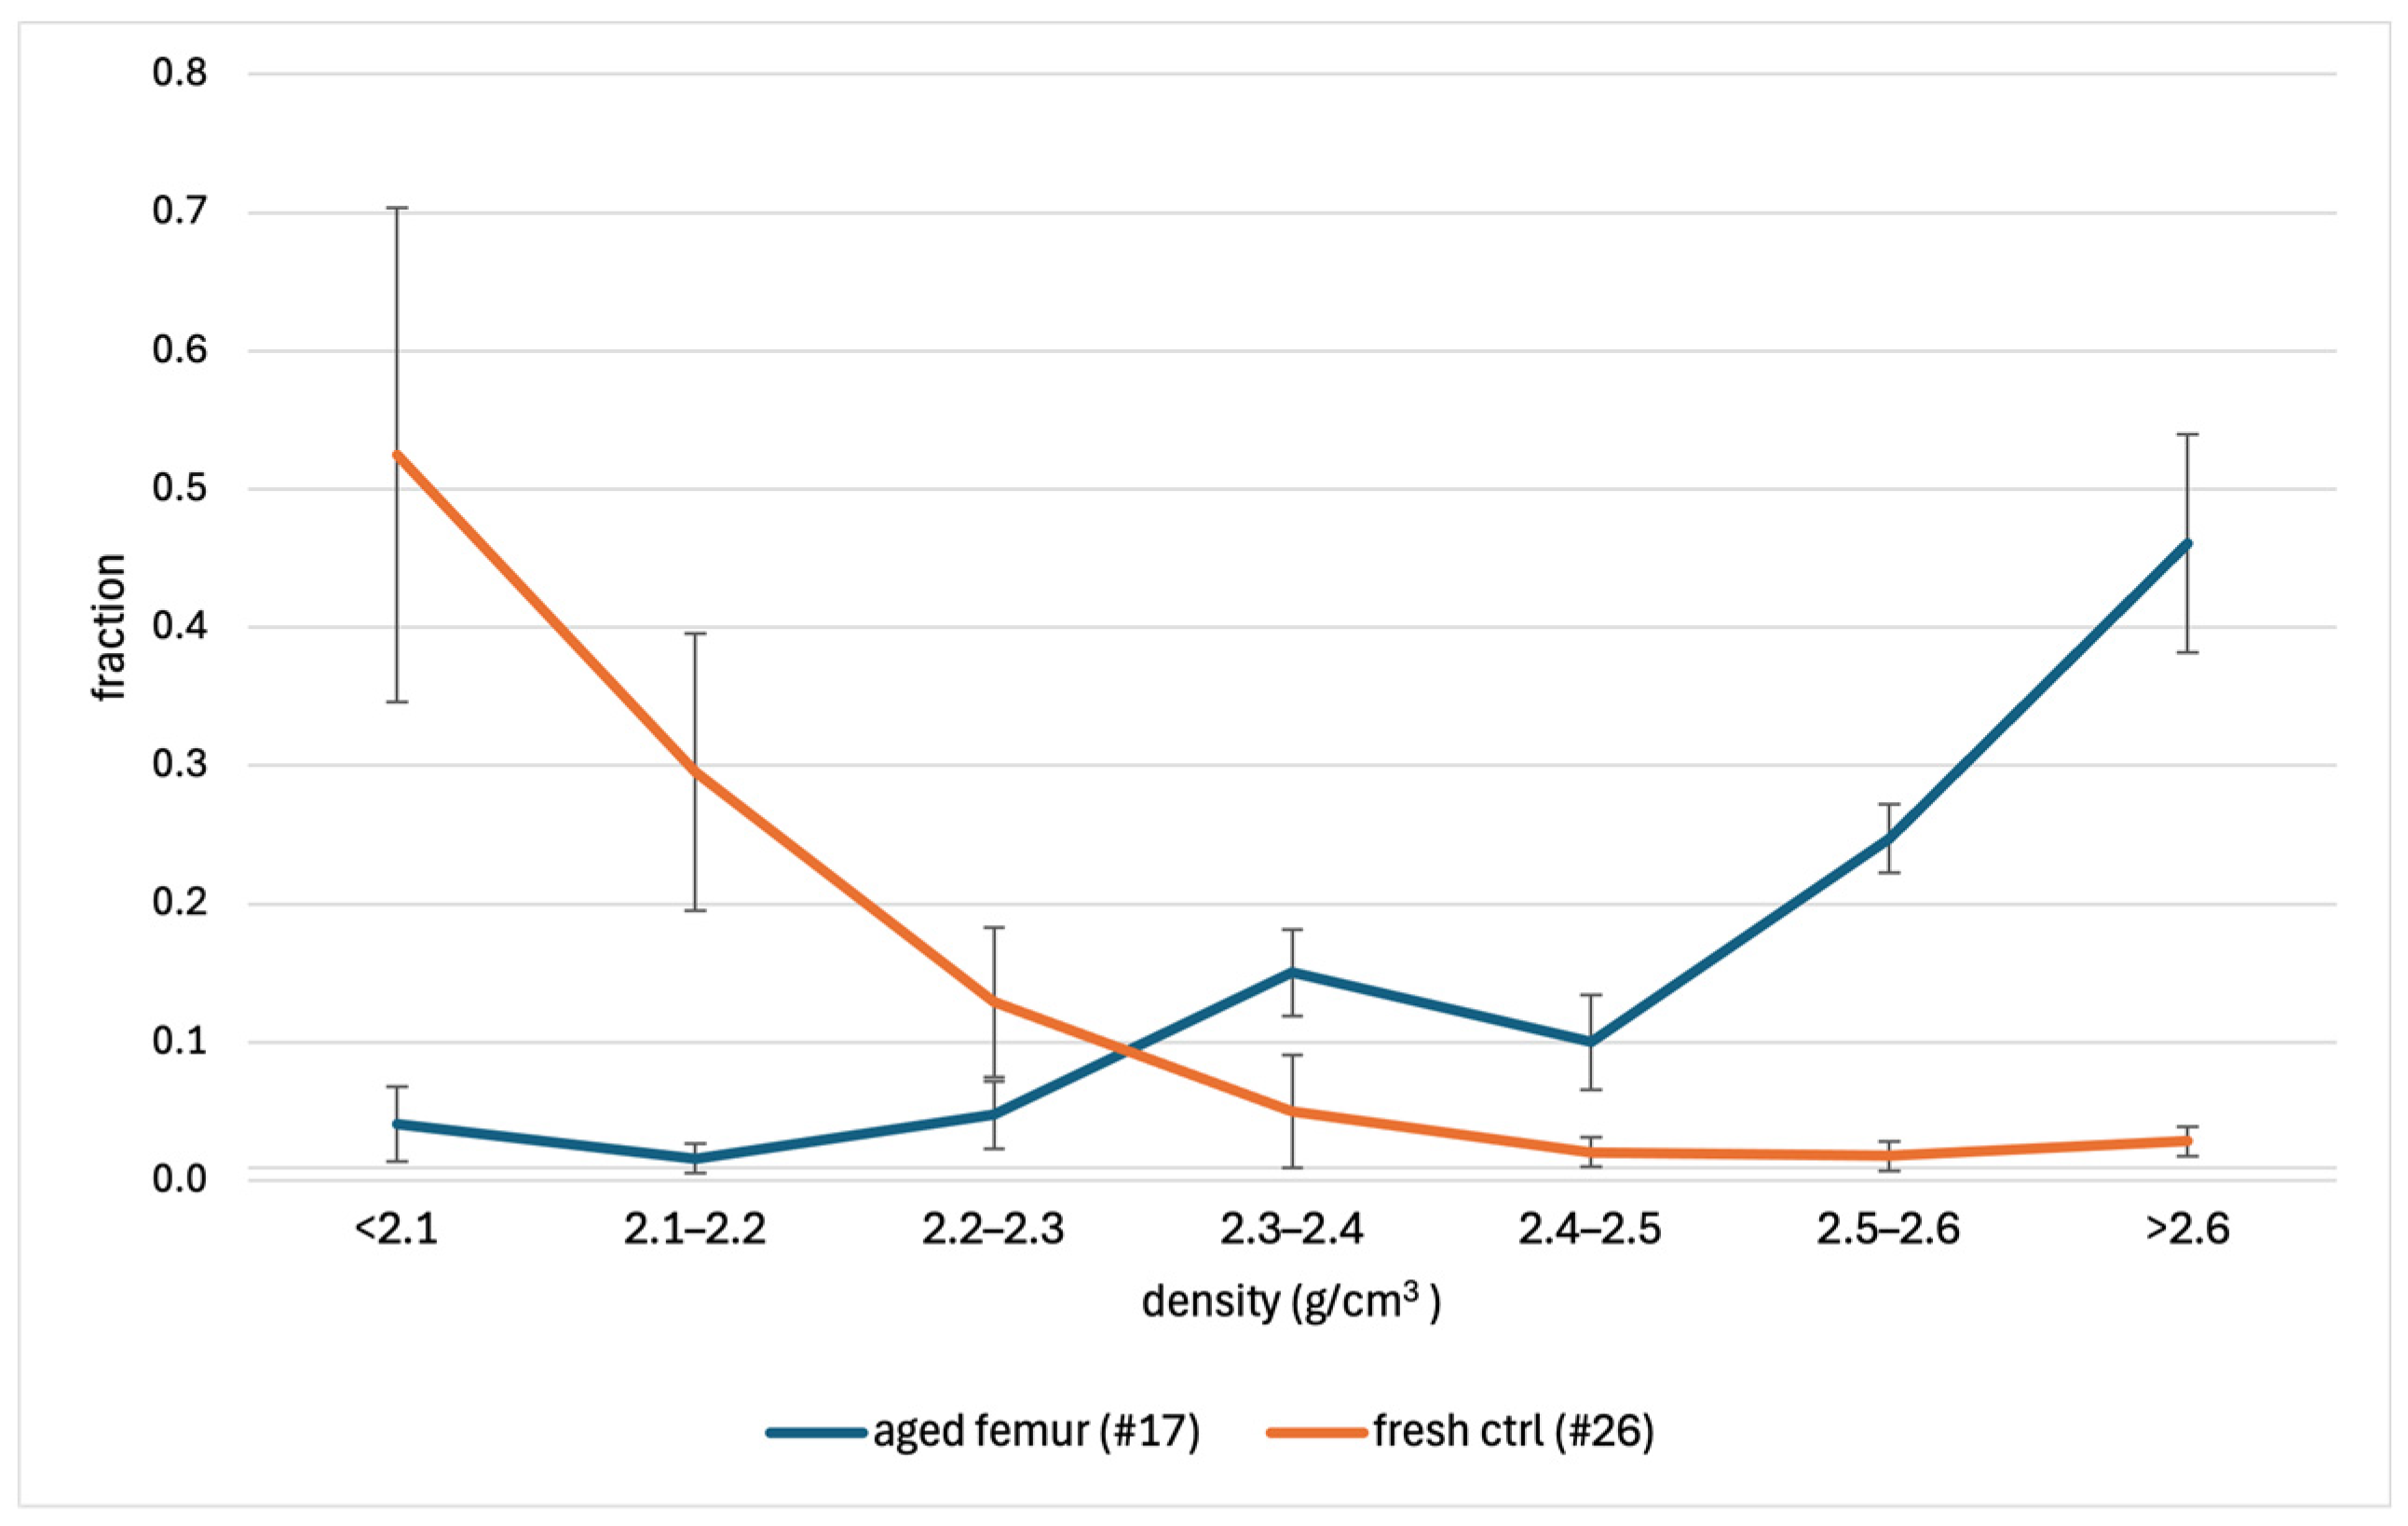
Figure 1 shows the results of the six replicates for both samples. More than 80% of the fresh control exhibited a density ≤ 2.2 g/cm3, a value in agreement with those reported by Bell [8] and Hengfeldt and Hjerpe [12]. Oppositely, the powder from the aged femur had higher densities, with 45.2% of the powder with a density > 2.6 g/cm3. The t-test showed differences (p-value ≤ 0.002) between each fraction of the two bone samples (see Table S3).
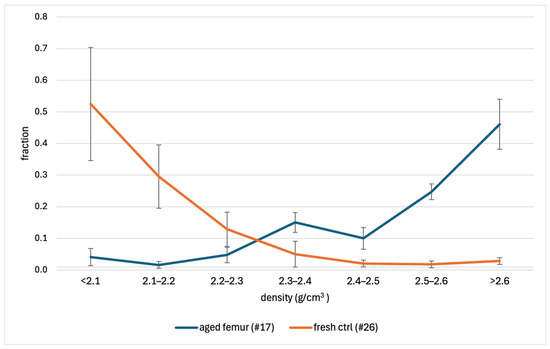
Figure 1.
Density fractions of the 74-year-old femur (#17) and the fresh control (#26). The vertical bars represent the ± standard deviation of each group of measurements.
Table S3 shows the RSD % of each of the seven fractions recovered from the two samples. As expected, the RSD % was lower for those fractions representing higher sample percentages. For instance, the 2.5–2.6 g/cm3 density range, which represents 23.8% of the aged sample and 0.7% of the fresh sample, showed an inter-day precision of 10% and 156%, respectively. Overall, the RSD % was no different between the fractions of sample #17 and sample #26 (p-value = 0.179).
3.2. Bone Powder Recovery Across Bone Types
As shown in Table S4, the average recovery ranged from 88.6% (petrous bone) to 92.5% (metatarsal). In total, the recovery was 89.9% (IC = 3.3% at 95% of probability). The One-way ANOVA test showed no difference among the six groups (p-value = 0.994), the three femur sets (p-value = 0.998) and the four types of bones found in the mass grave (p-value = 0.916). The uniformity of these results across different bone types highlights the reliability of the proposed method and its suitability for comparative density assessment.
3.3. Density Assessment
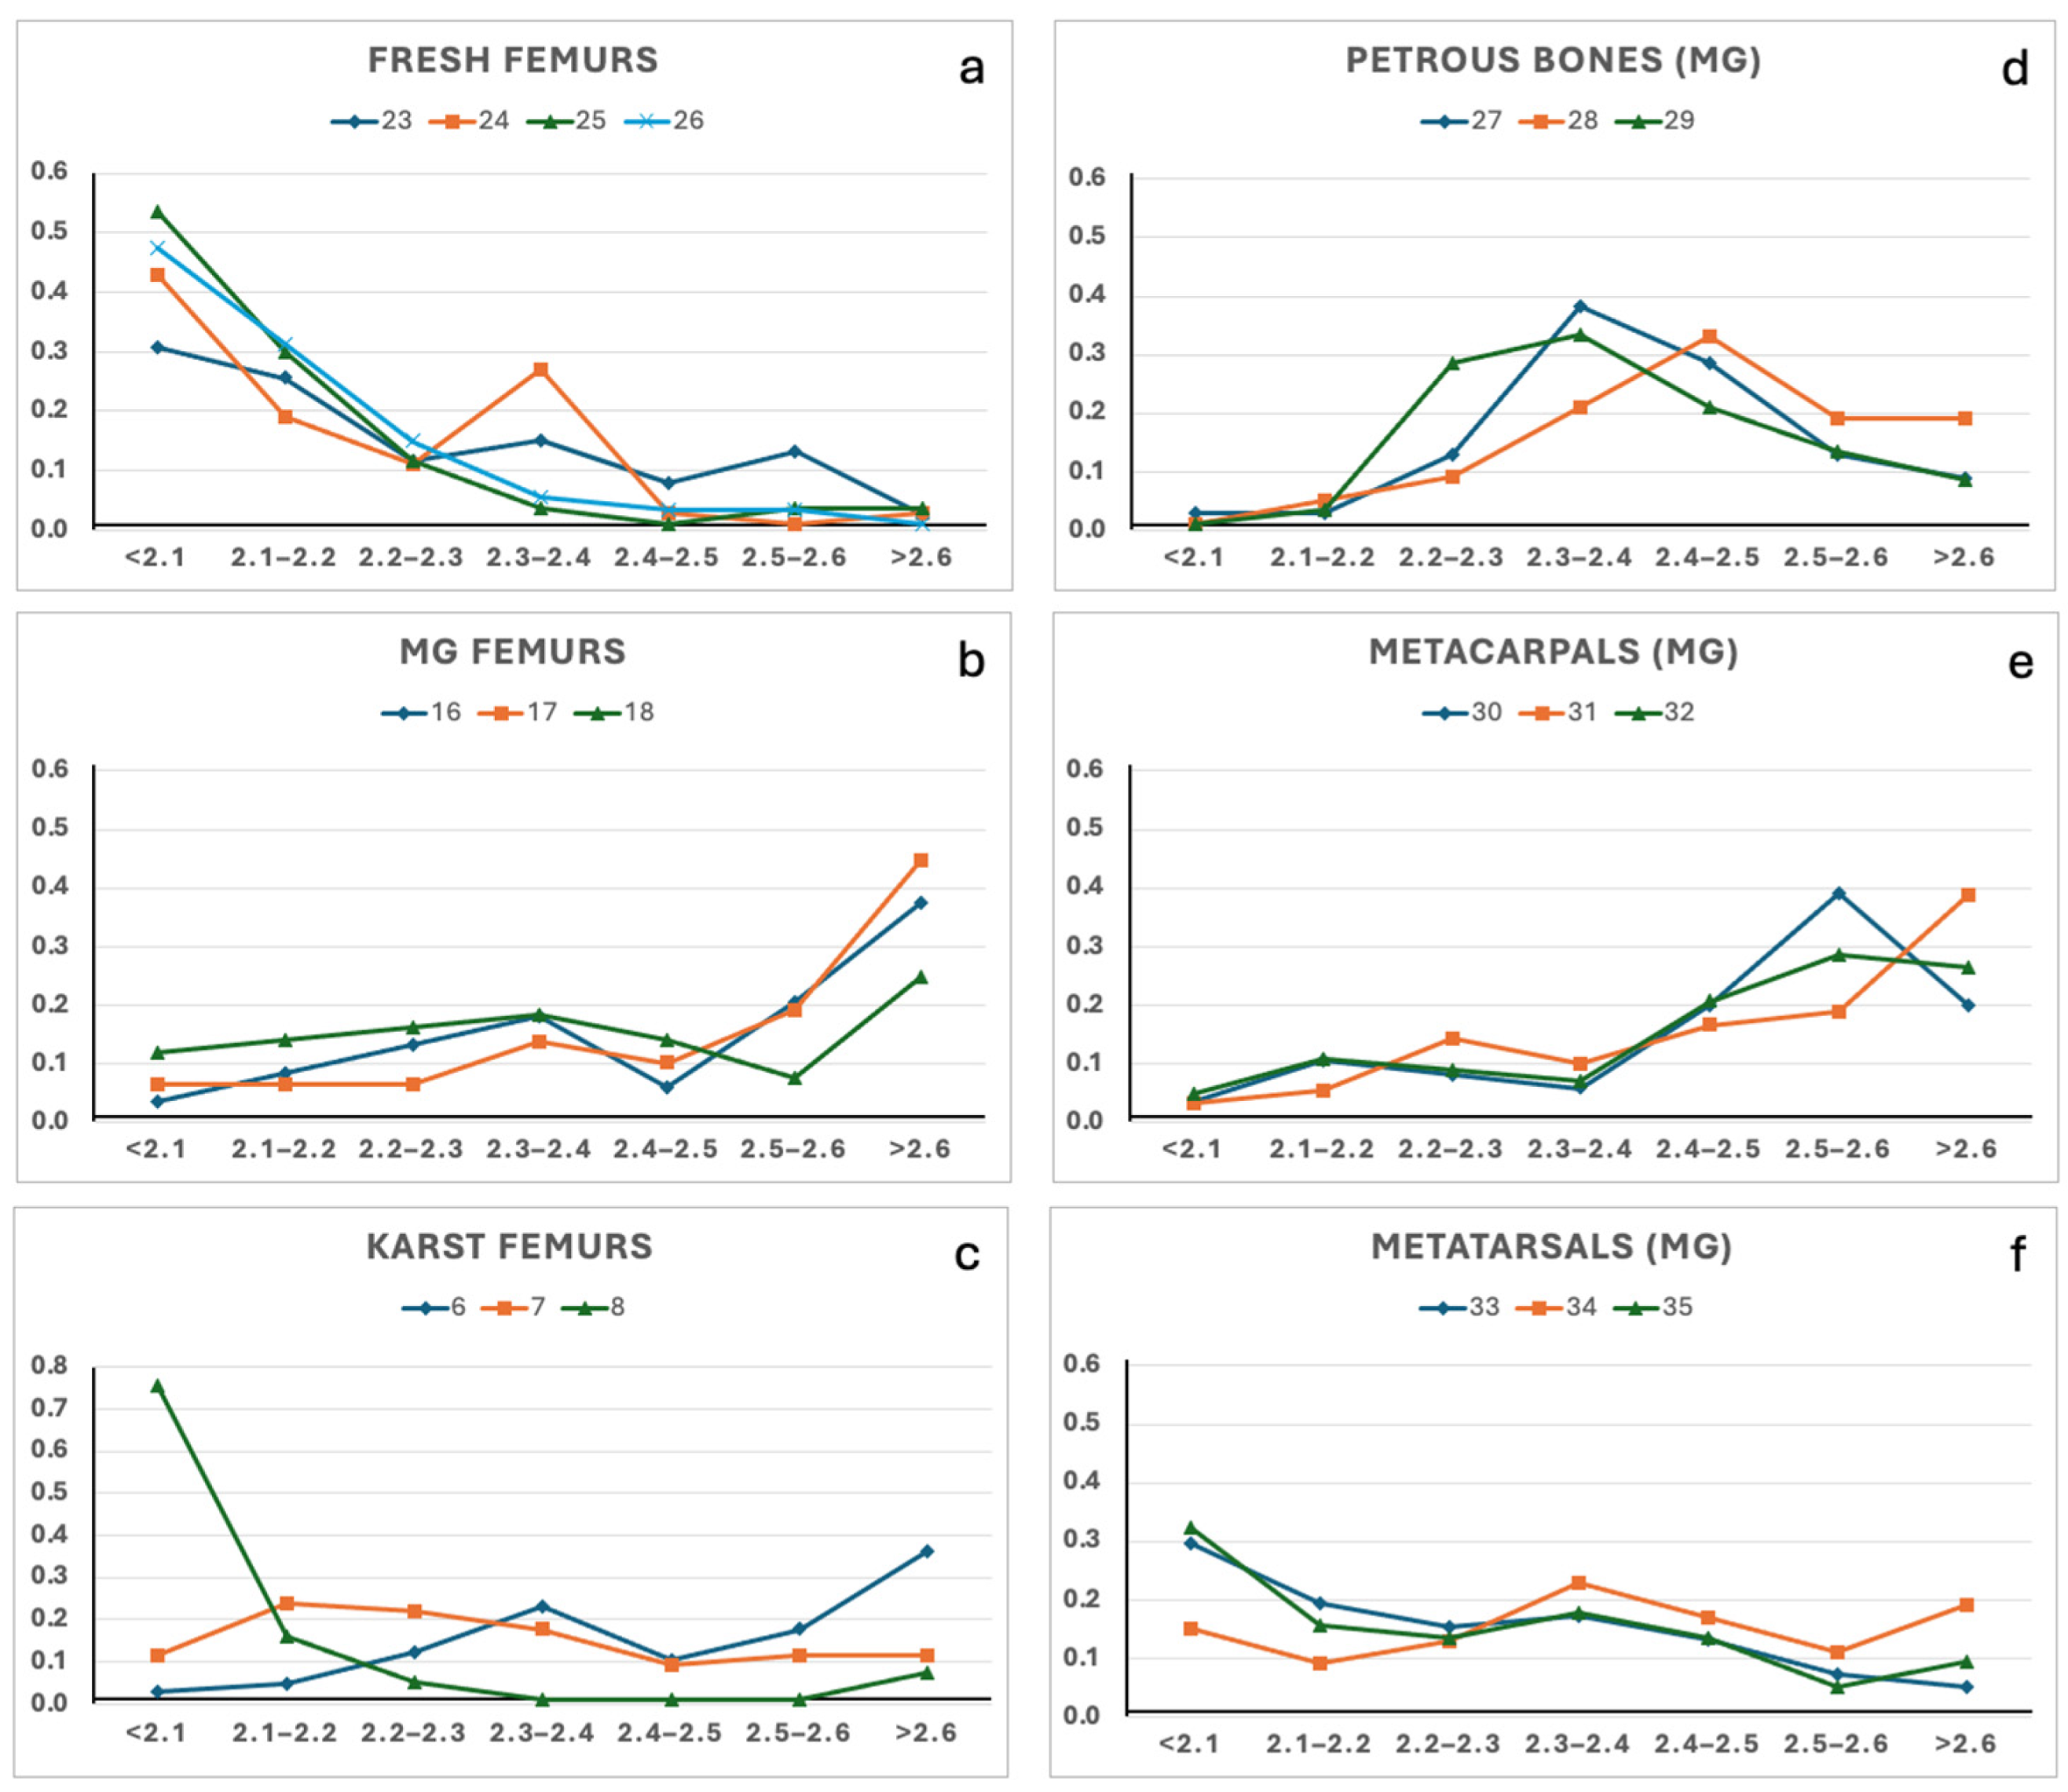
The density profiles obtained through SPT gradient centrifugation from the nineteen samples are illustrated in Figure 2. Among the ten femurs, the four fresh controls exhibited similar density gradient distributions (Figure 2a), with more than 75% of the material showing a density ≤ 2.2 g/cm3. This value is in agreement with the available data on the density of the cortical part of the femur, even though those data were acquired using different analytical methods [1,2,8,22]. Interestingly, the three femurs found in the mass grave also exhibited similar density gradient profiles, with more than 45% of each sample with a density > 2.5 g/cm3 (Figure 2b). The other three aged femurs, each buried in their peculiar environment in the Italian Karst, showed more heterogeneous density distributions (Figure 2c). Notably, sample #8 showed approximately 90% of the material with a density ≤ 2.2 g/cm3, revealing a profile similar to the fresh control, whereas sample #6 more closely matched the density pattern observed in the mass grave femurs. Although the sample size in this study is limited, all bone specimens were collected from the same anatomical region (e.g., at the “80%” of the femur length, following Lyman [1]), to minimise the variability due to the intrinsic bone density. Altogether, the results suggest that differences in the density gradient profile are more likely attributable to burial environments and diagenetic alterations in bone tissue, rather than to sample ageing. This hypothesis is further supported by the FTIR analysis, discussed in the following section (see Section 3.4), which highlights chemical signatures consistent with distinct diagenetic pathways.
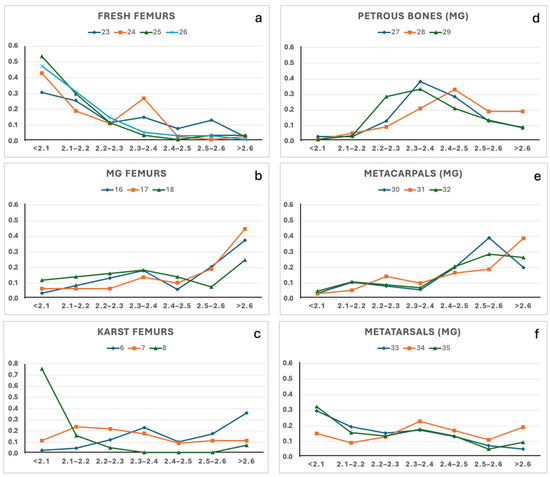
Figure 2.
Density gradients distributions of the bone samples. (a) fresh femurs; (b) mass grave femurs; (c) Karst femurs; (d) petrous bones; (e) metacarpals; (f) metatarsals. Panels (b,d–f) refer to bones recovered from the WWII mass grave (MG) of Ossero.
Since the results from femur samples seemed interesting, SPT gradient centrifugation was extended to petrous bones, metacarpals, and metatarsals of the mass grave of Ossero. The results are illustrated in Figure 2d–f. Approximately 50% of the material recovered from the three petrous bones showed a density gradient within the range 2.3–2.5 g/cm3, while the metatarsal showed the highest percentage at a density gradient of 2.3–2.4 and ≤2.1 g/cm3. Thus, each bone type recovered from the same burial context exhibited a distinct yet internally consistent density signature: femurs showed the highest densities, followed by metacarpals, petrous bones, and metatarsals. Regrettably, no appropriate reference data are currently available on the density of fresh petrous bones, metacarpals, and metatarsals, and it was not possible to recover fresh bone reference samples for this study. Therefore, only speculative considerations can be made: assuming stable environmental conditions across the mass grave during the 74 years of burial, the resulting density gradients likely reflect a combination between the intrinsic bone structure and the post-mortem diagenetic alteration.
To further evaluate whether bone density, as measured by the SPT method, can serve as a reliable proxy for both bone tissue preservation and biomolecular survival, the results were compared with FTIR-based indices reflecting diagenetic alteration.
3.4. ATR-FTIR Data
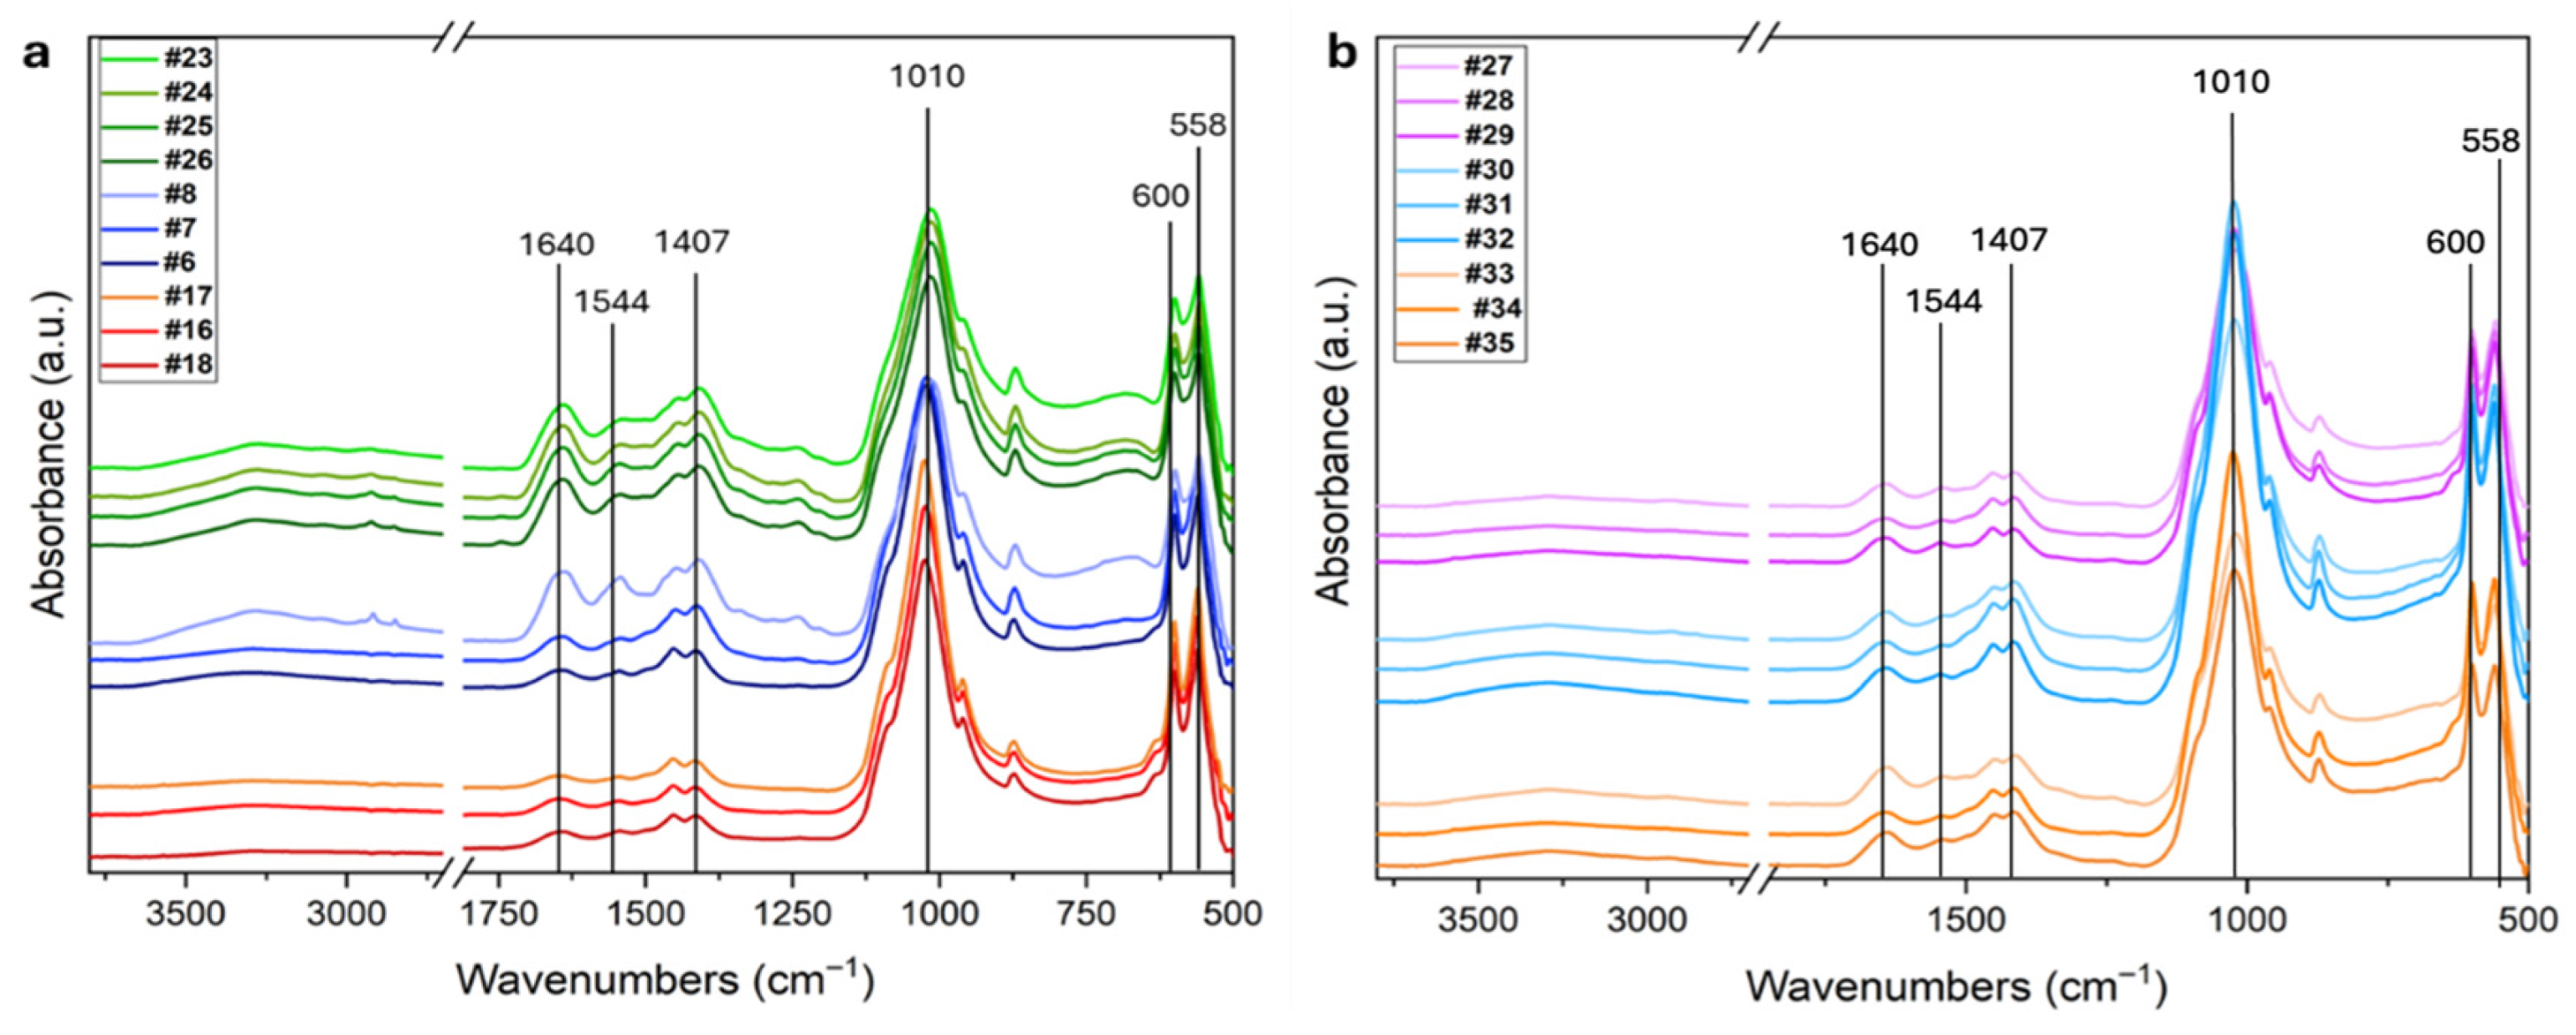
Figure 3 shows the ATR-FTIR spectra of the ten femur samples analyzed (panel a) and of the petrous bones, metacarpals and metatarsals (panel b) from the mass grave of Ossero.
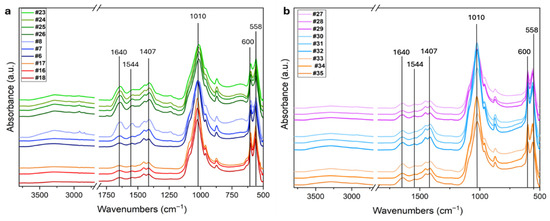
Figure 3.
(a) FTIR spectra of the ten femur samples analyzed in this study. The fresh control group (#23, #24, #25, #26) is shown in green, samples from the Italian Karst (#6, #7, #8) in blue, and mass grave samples (#17, #18, #19) in red. (b) FTIR spectra of additional skeletal elements from the mass grave. Petrous bones (#27, #28, #29) are shown in pink, metacarpals (#30, #31, #32) in light blue, and metatarsals (#33, #34, #35) in orange. The main peaks are highlighted.
The most characteristic infrared features related to bone tissue are marked as black lines. The Amide I and II bands at 1640 and 1544 cm−1, respectively, are mainly due to C=O stretching mode, and C-N stretching and N-H bending modes in proteins. They are indicative of the presence of the collagen matrix. The doublet in the spectral range 1500–1350 cm−1 (Figure 3) is due to ν3 stretching mode of CO32− group in carbonate HAP, while the intense band in the range 1150–900 cm−1 and the doublet in the range 630–520 cm−1 are due to ν1–ν3 stretching and ν4 bending mode of PO43− groups, respectively [35]. Slight differences in the relative proportions of the main bands can be observed between the fresh femurs, the aged ones (panel a), and the other bone types (petrous bones, metacarpals and metatarsals) shown in panel b.
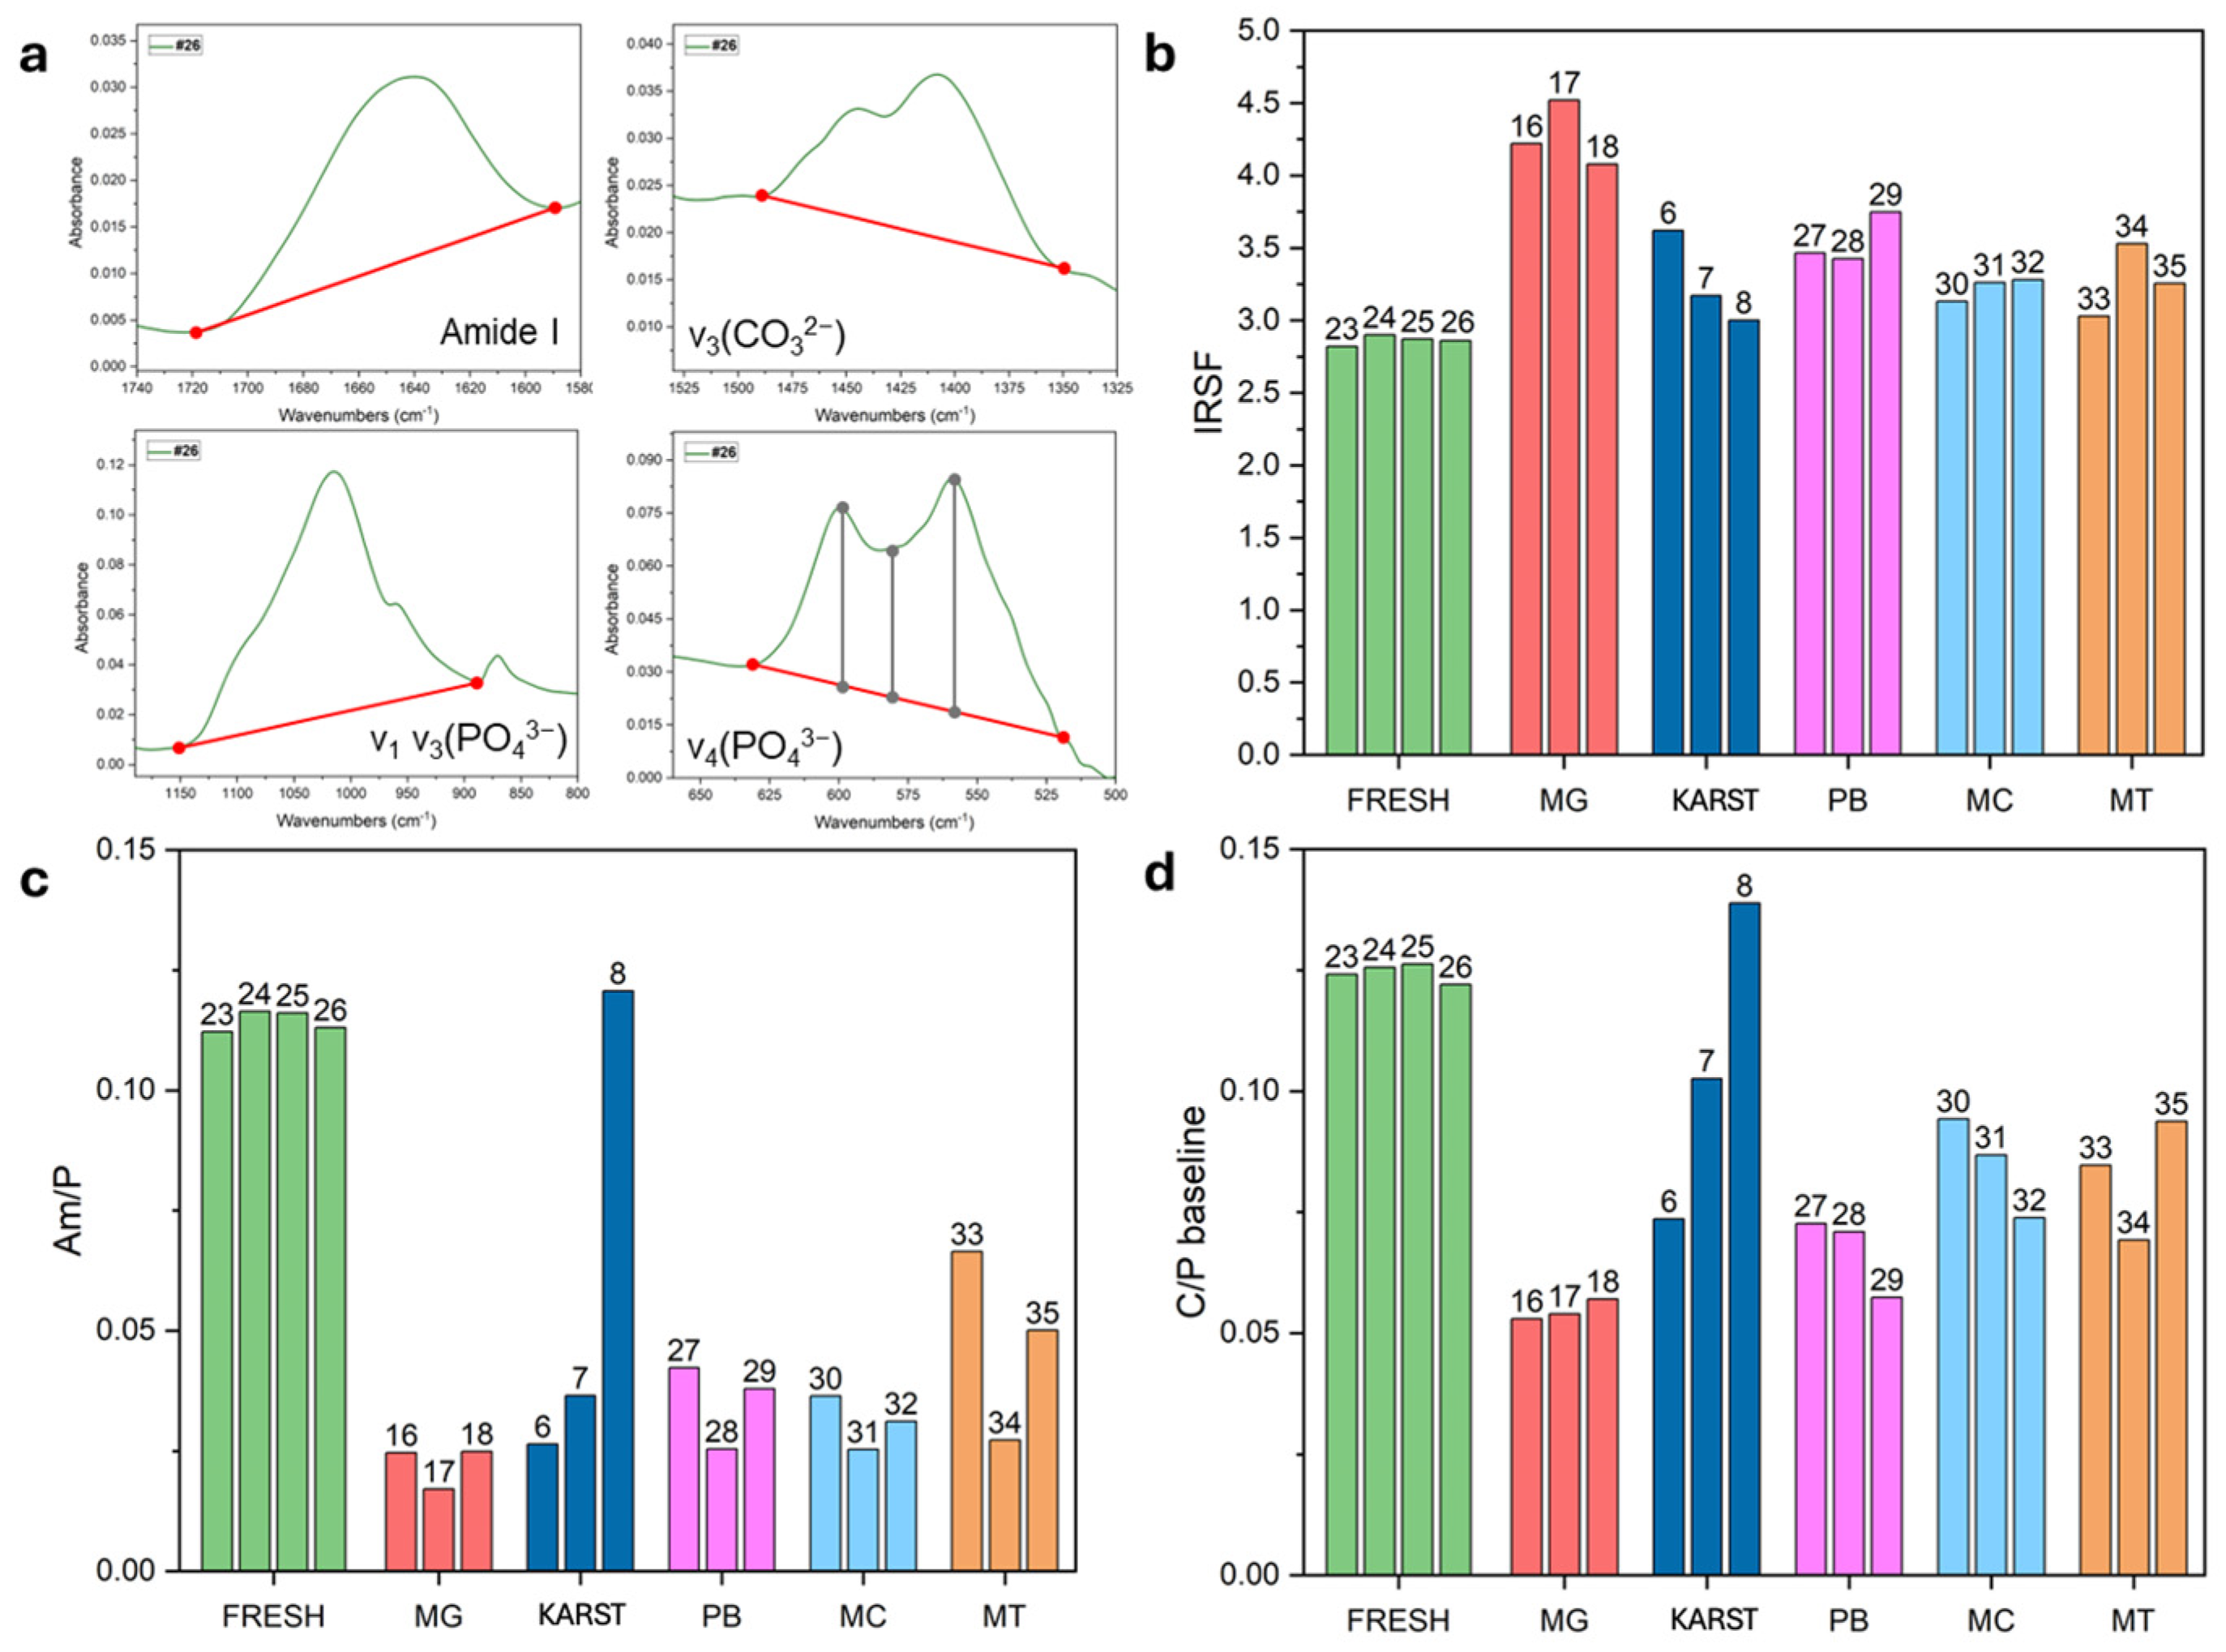
Figure 4a highlights the main spectral ranges used for calculating the IR indices (for more details refer to Table S2).
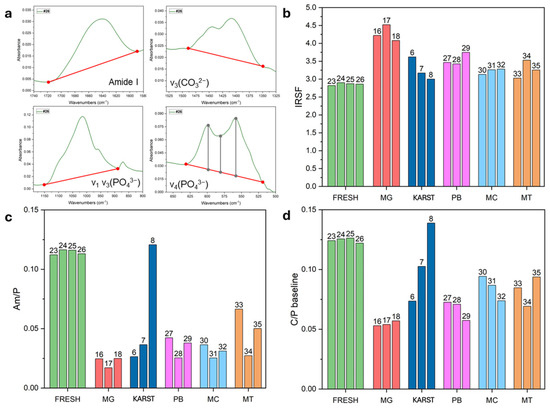
Figure 4.
(a) Illustrations of the calculation methods used for index extrapolation, with details provided in Table S2. (b–d) IRSF, Am/P, and C/P baseline values measured in individual samples. FRESH: control femurs; MG: femurs from the mass grave of Ossero; KARST: femurs from three different sites of the Italian Karst; PB: petrous bone, MC: metacarpals, MT: metatarsals from the mass grave of Ossero.
The femurs from the mass grave (#16, #17, and #18) displayed significant recrystallization of the mineral component, as evidenced by elevated values for the IRSF index (see Figure 4b and Table S5), associated with a strong decrease in the Am/P index (Figure 4c and Table S5), which indicates a substantial degradation of collagen matrix [23]. Both the BPI and C/P indices (Table S5 and Figure 4d) showed a marked reduction in the carbonate (CO32−) component, potentially promoting the formation of more stable and structurally ordered bioapatite [36].
As already indicated by the SPT density assessment, ATR-FTIR analysis confirmed a consistent diagenetic pattern among the mass grave femur samples compared to the fresh controls. Samples #6, #7, and #8 displayed distinct spectral patterns. Notably, sample #8 showed better preservation of both organic and inorganic components, as already highlighted by a density profile similar to the fresh control. These results strongly suggest a different diagenetic trajectory followed by this sample compared to the other two samples excavated from different sites of the Italian Karst.
Interestingly, the additional bones from the mass grave (petrous bones, metacarpals and metatarsals) showed intermediate values for the IR indexes, falling between those of the fresh femurs and the old femurs from the same site. This data could suggest that these skeletal elements may have undergone less intensive diagenetic processes.
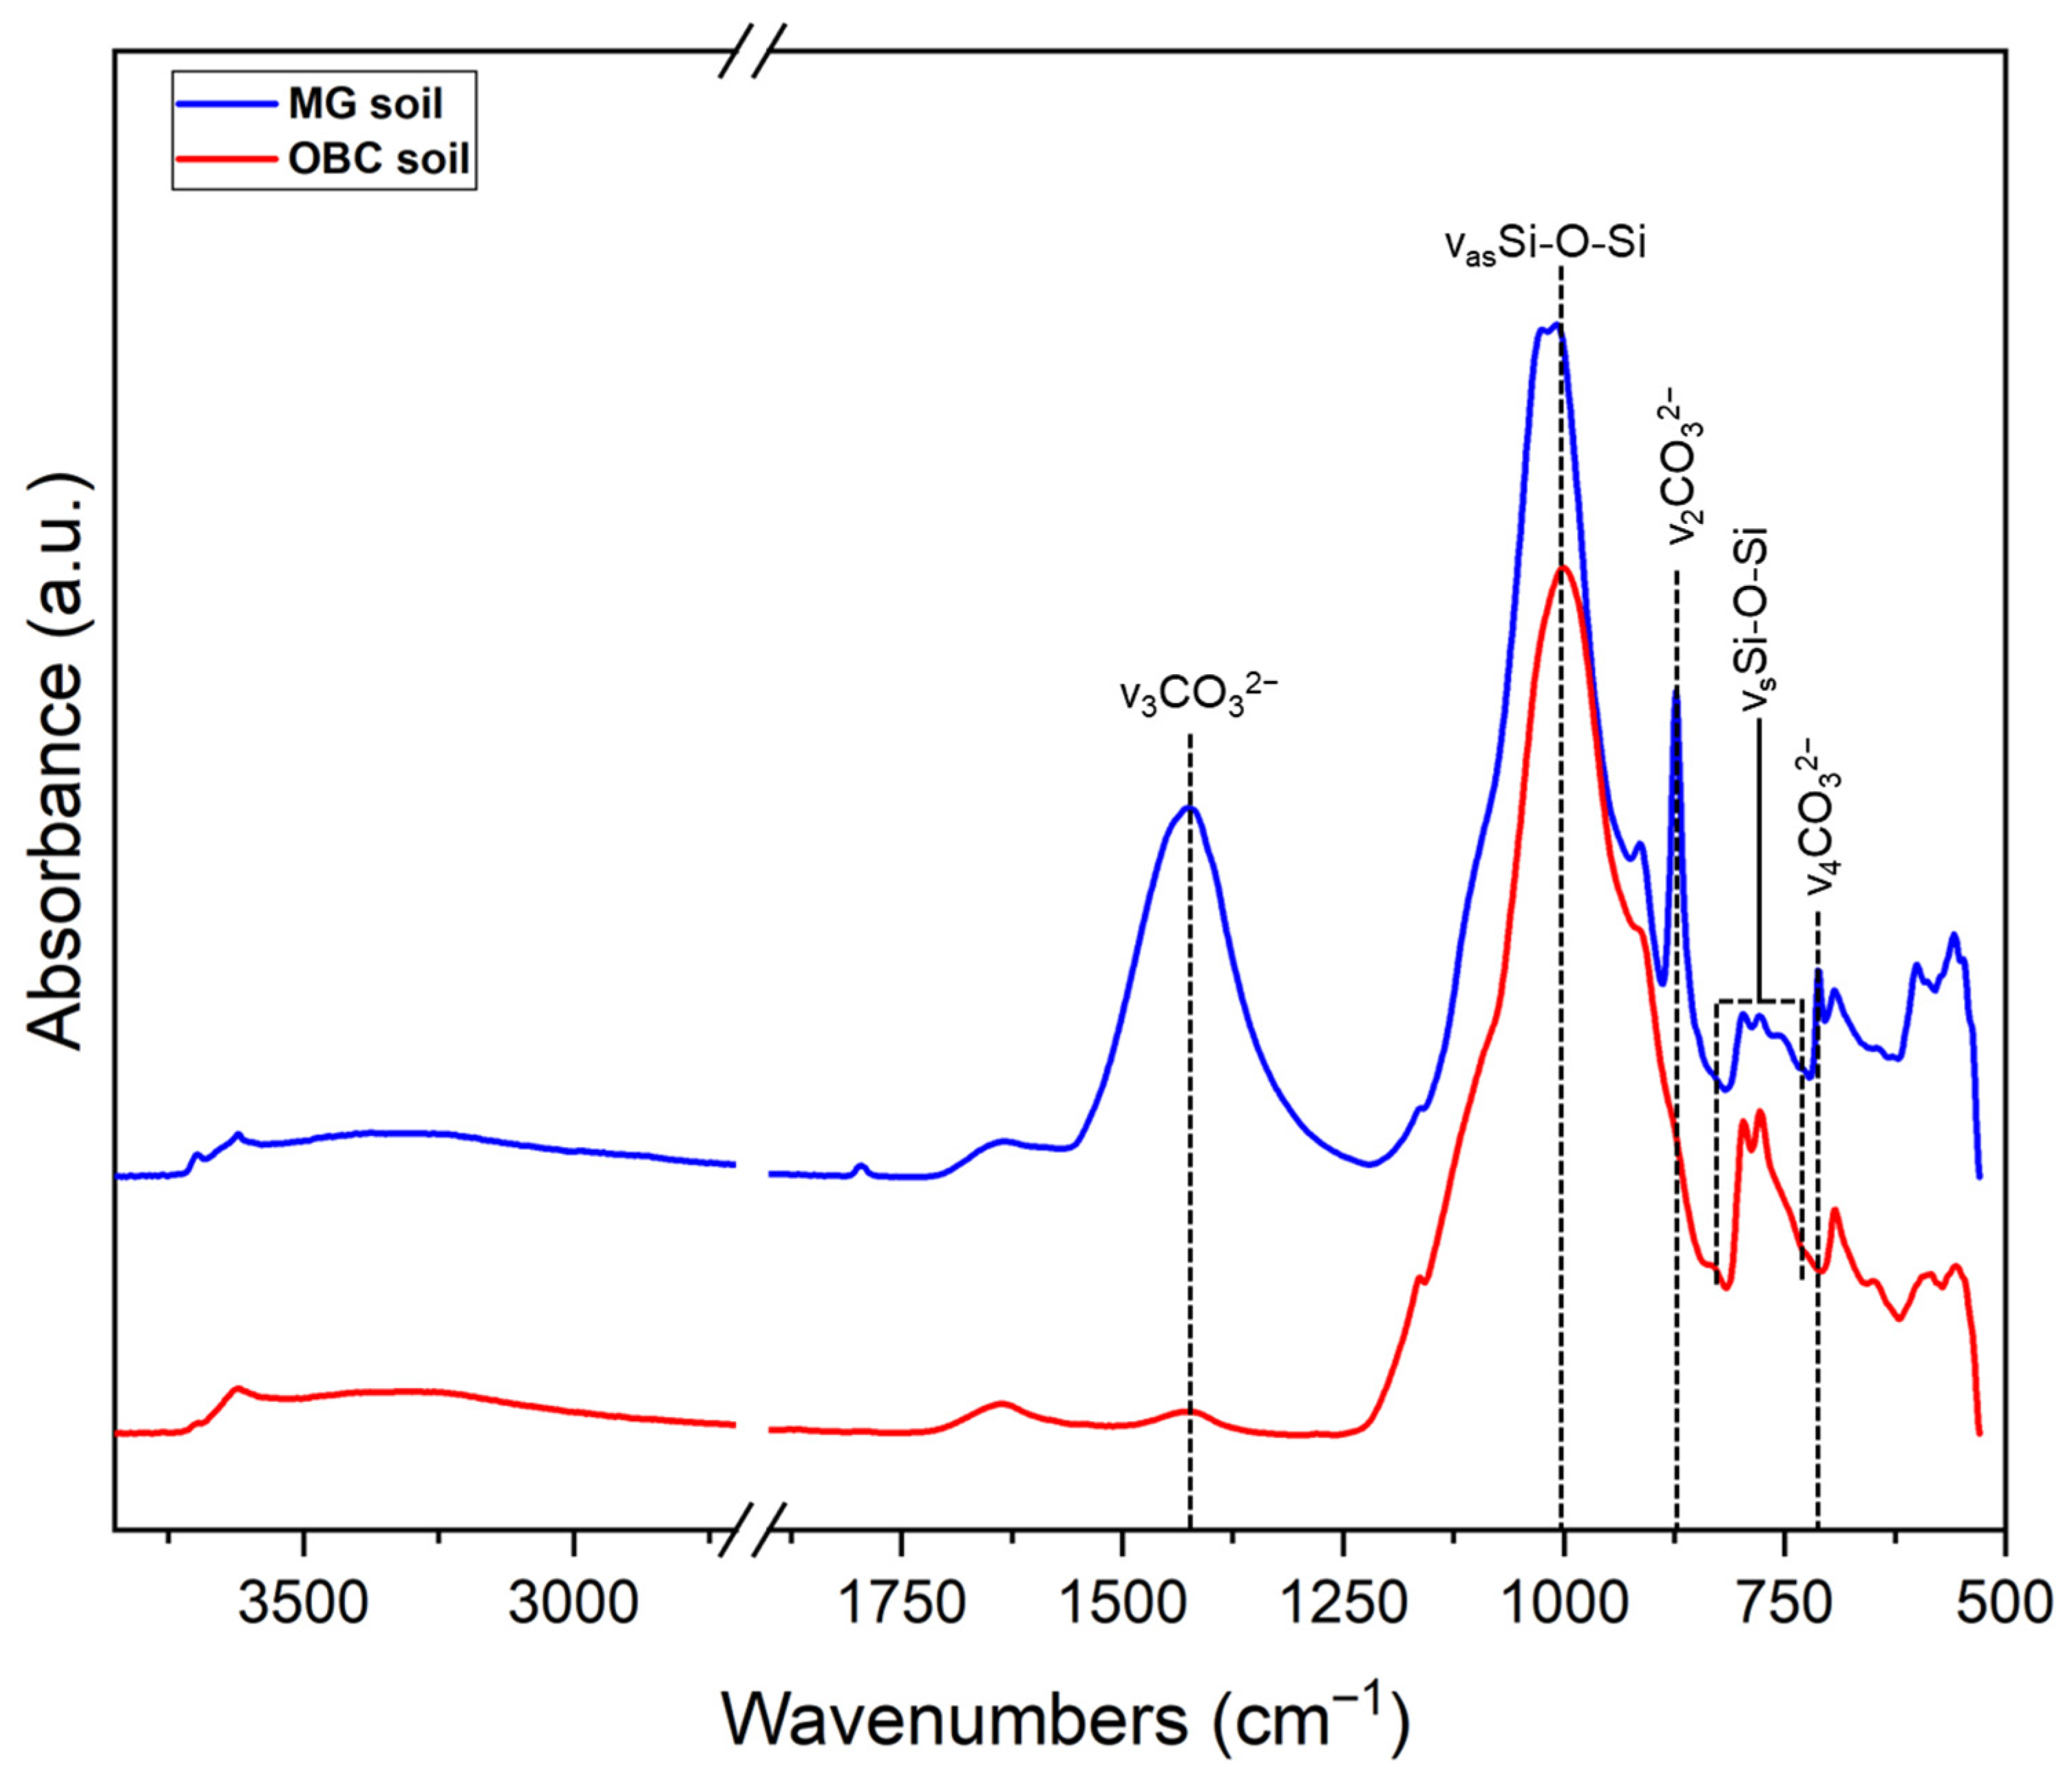
FTIR spectra of soil particles adhering to the bones are shown in Figure A4. Soils from the mass grave displayed a marked abundance of carbonate peaks, indicative of high CO32− content. This enrichment is typically associated with acidic conditions, which are known to accelerate diagenetic processes by promoting mineral dissolution and collagen degradation [37,38]. In contrast, soils from the Italian Karst showed a different composition, potentially contributing to a better preservation of sample #8.
3.5. DNA Analyses Data
Only the ten femur powders underwent DNA extraction and quantification. The results are shown in Table 1 where the average yields of DNA (as assessed by the 84 bp long Auto probe) for gram of bone powder are reported. The fresh controls exhibited values at least one–two orders of magnitude higher than the aged femurs. No amplification signal was detected in the negative controls. No qPCR inhibition was observed.
3.6. Principal Component Analysis (PCA)
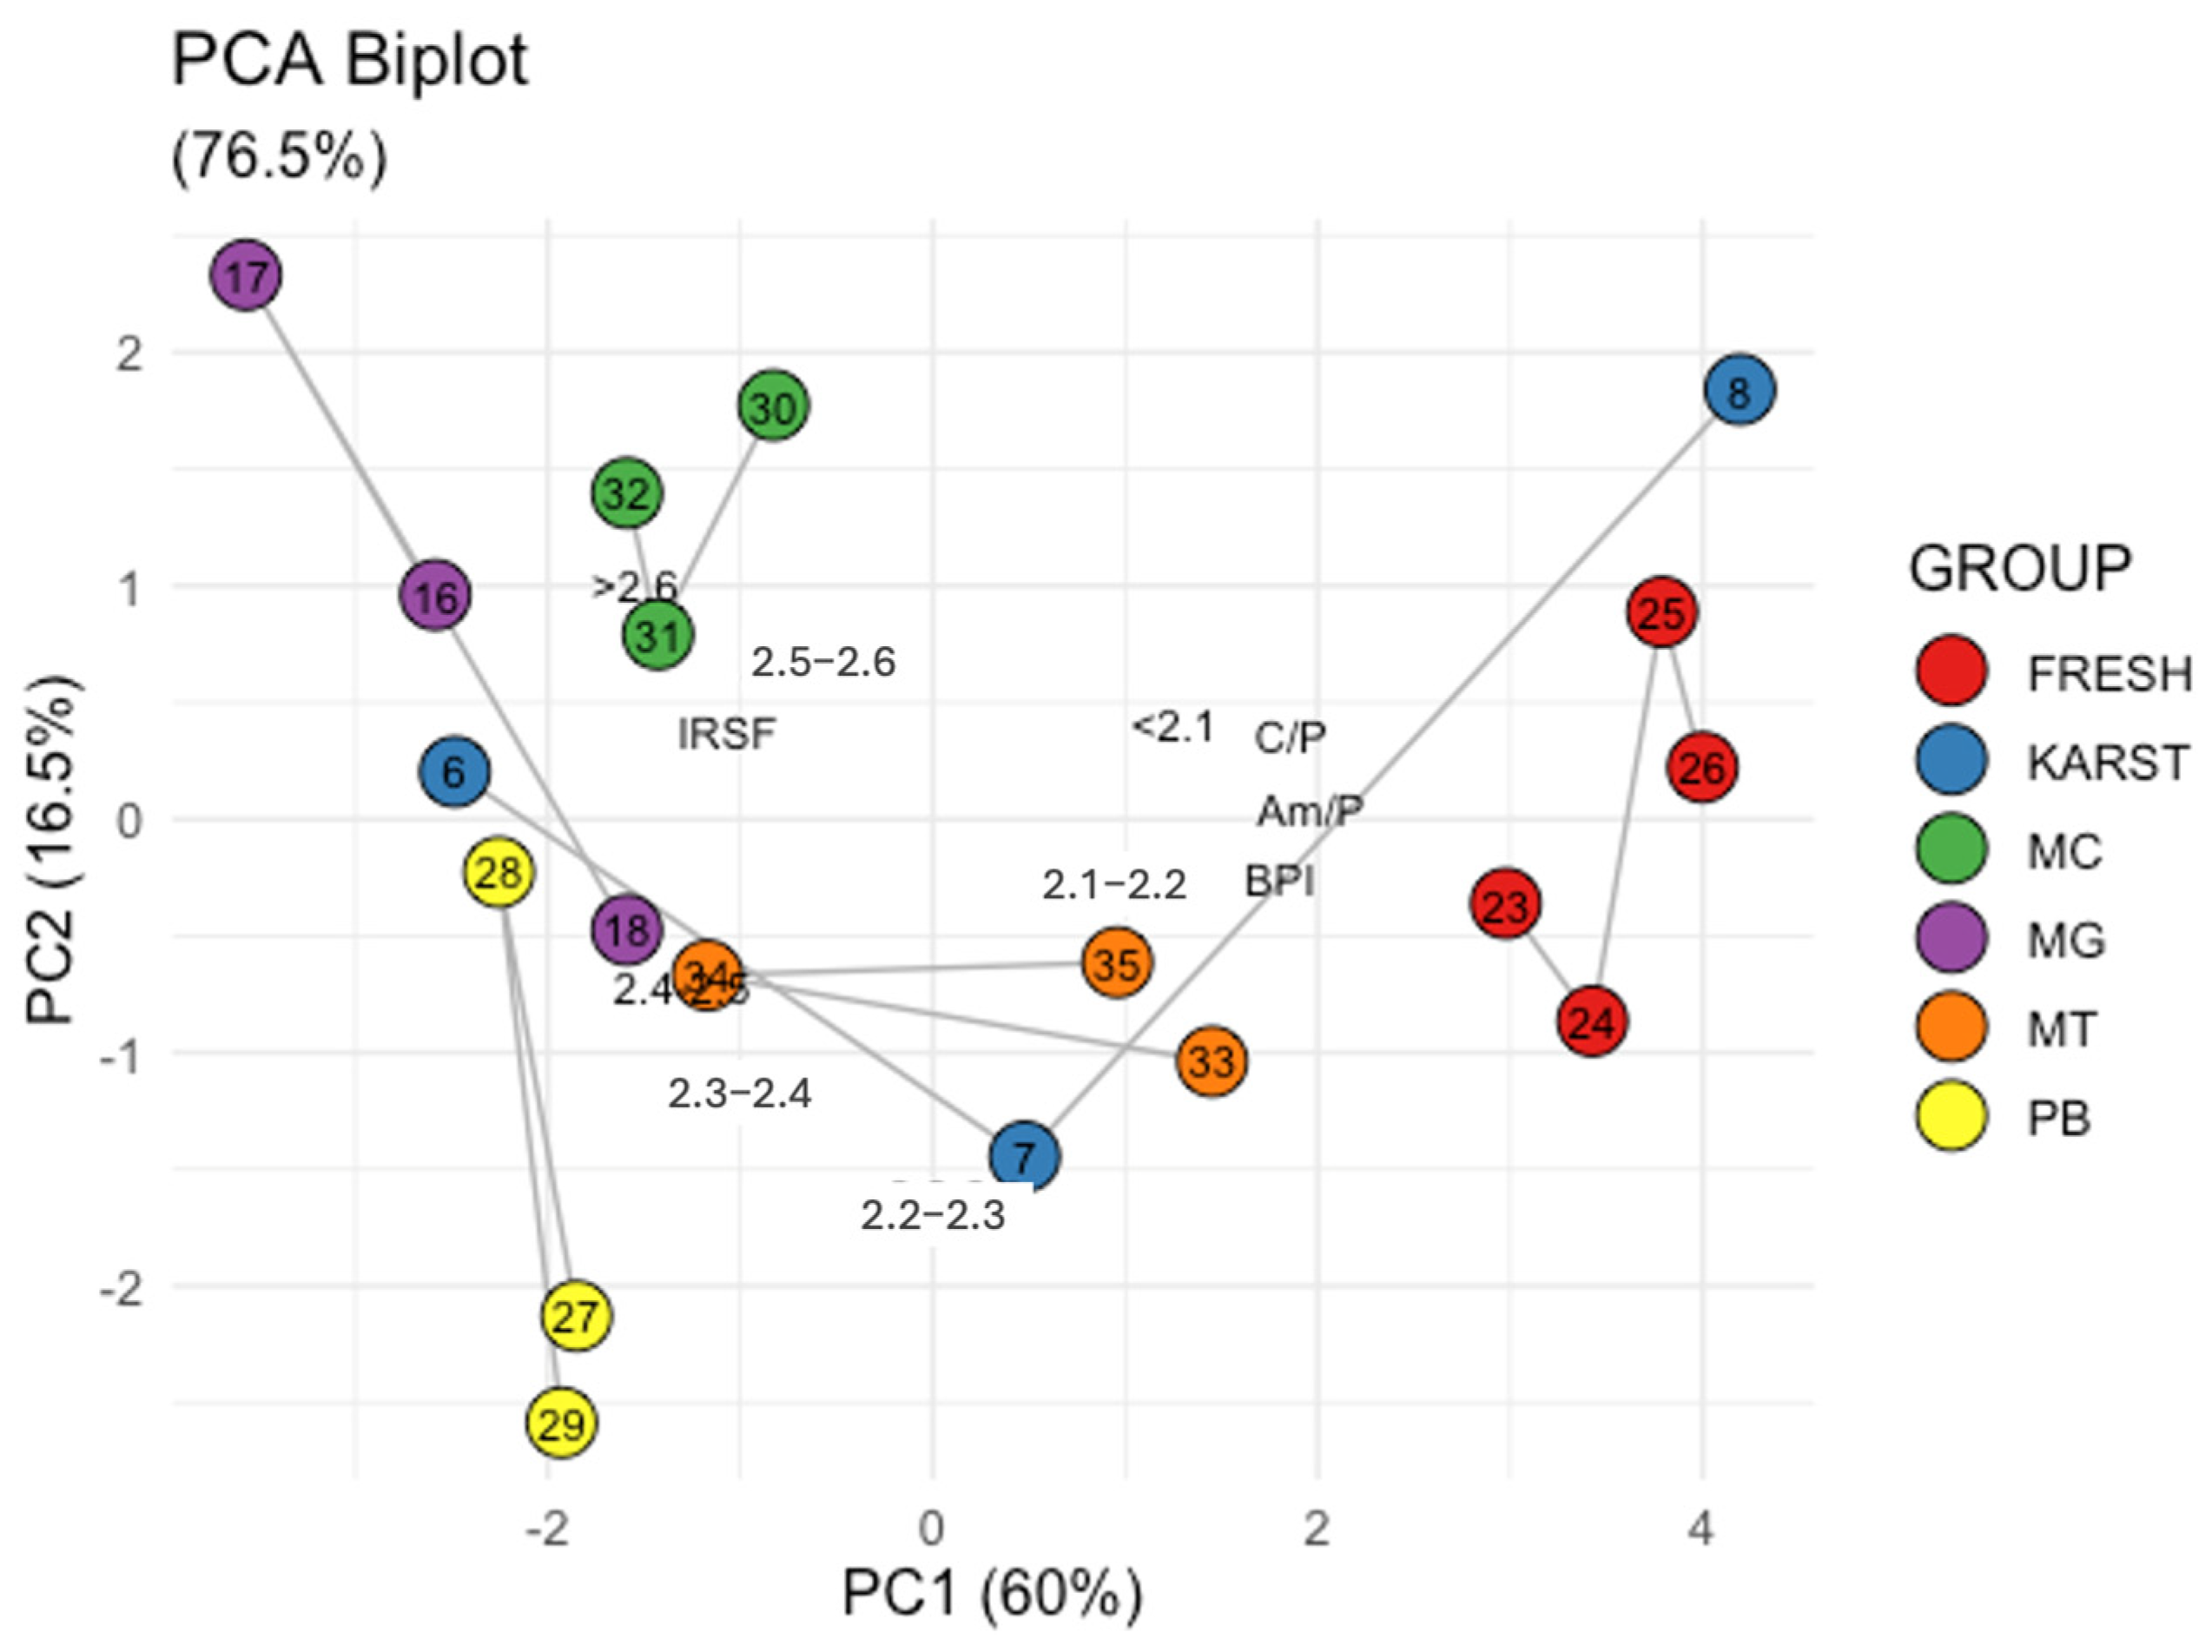
To further strengthen the complementarity between SPT gradient centrifugation and FTIR spectroscopy in the analysis of bone samples, PCA of the data obtained from the two techniques was performed. Figure 5 shows the relationship between high IRSF values and high bone density (>2.5 g/cm3) values (correlation = 0.7). Conversely, low BPI, C/P, and Am/P values are associated with fractions having lower bone densities and lower IRSF (data correlation ranging from −0.7 to −0.9). The Biplot (Figure 5) illustrates the distribution of the samples, with the fresh controls clustered on the left and the femurs from the mass grave clustered on the right. Interestingly, the better-preserved sample #8 clusters together with the fresh samples, while sample #7 occupies an intermediate position and sample #6 shifts towards the mass grave femurs. Additionally, petrous bones (#27, #28 and #29), metacarpals (#30, #31 and #32), and metatarsals (#33, #34 and #35) are positioned in the central region of the plot, indicating intermediate characteristics between the fresh and degraded femoral samples. Therefore, within the limitation of our sample set size, the results of the SPT gradient centrifugation method are consistent, and their interpretation complements that of the ATR-FTIR data.
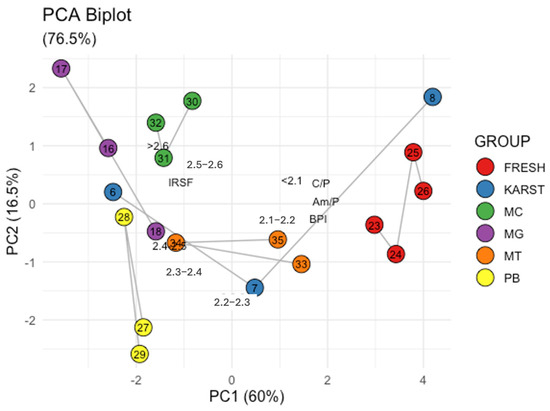
Figure 5.
Principal Component Analysis: Loading and Score Plot of the sample data. FRESH: control femurs; MG: femurs from the mass grave of Ossero; KARST: femurs from three different sites of the Italian Karst; PB: petrous bone, MC: metacarpals, MT: metatarsals from the mass grave of Ossero.
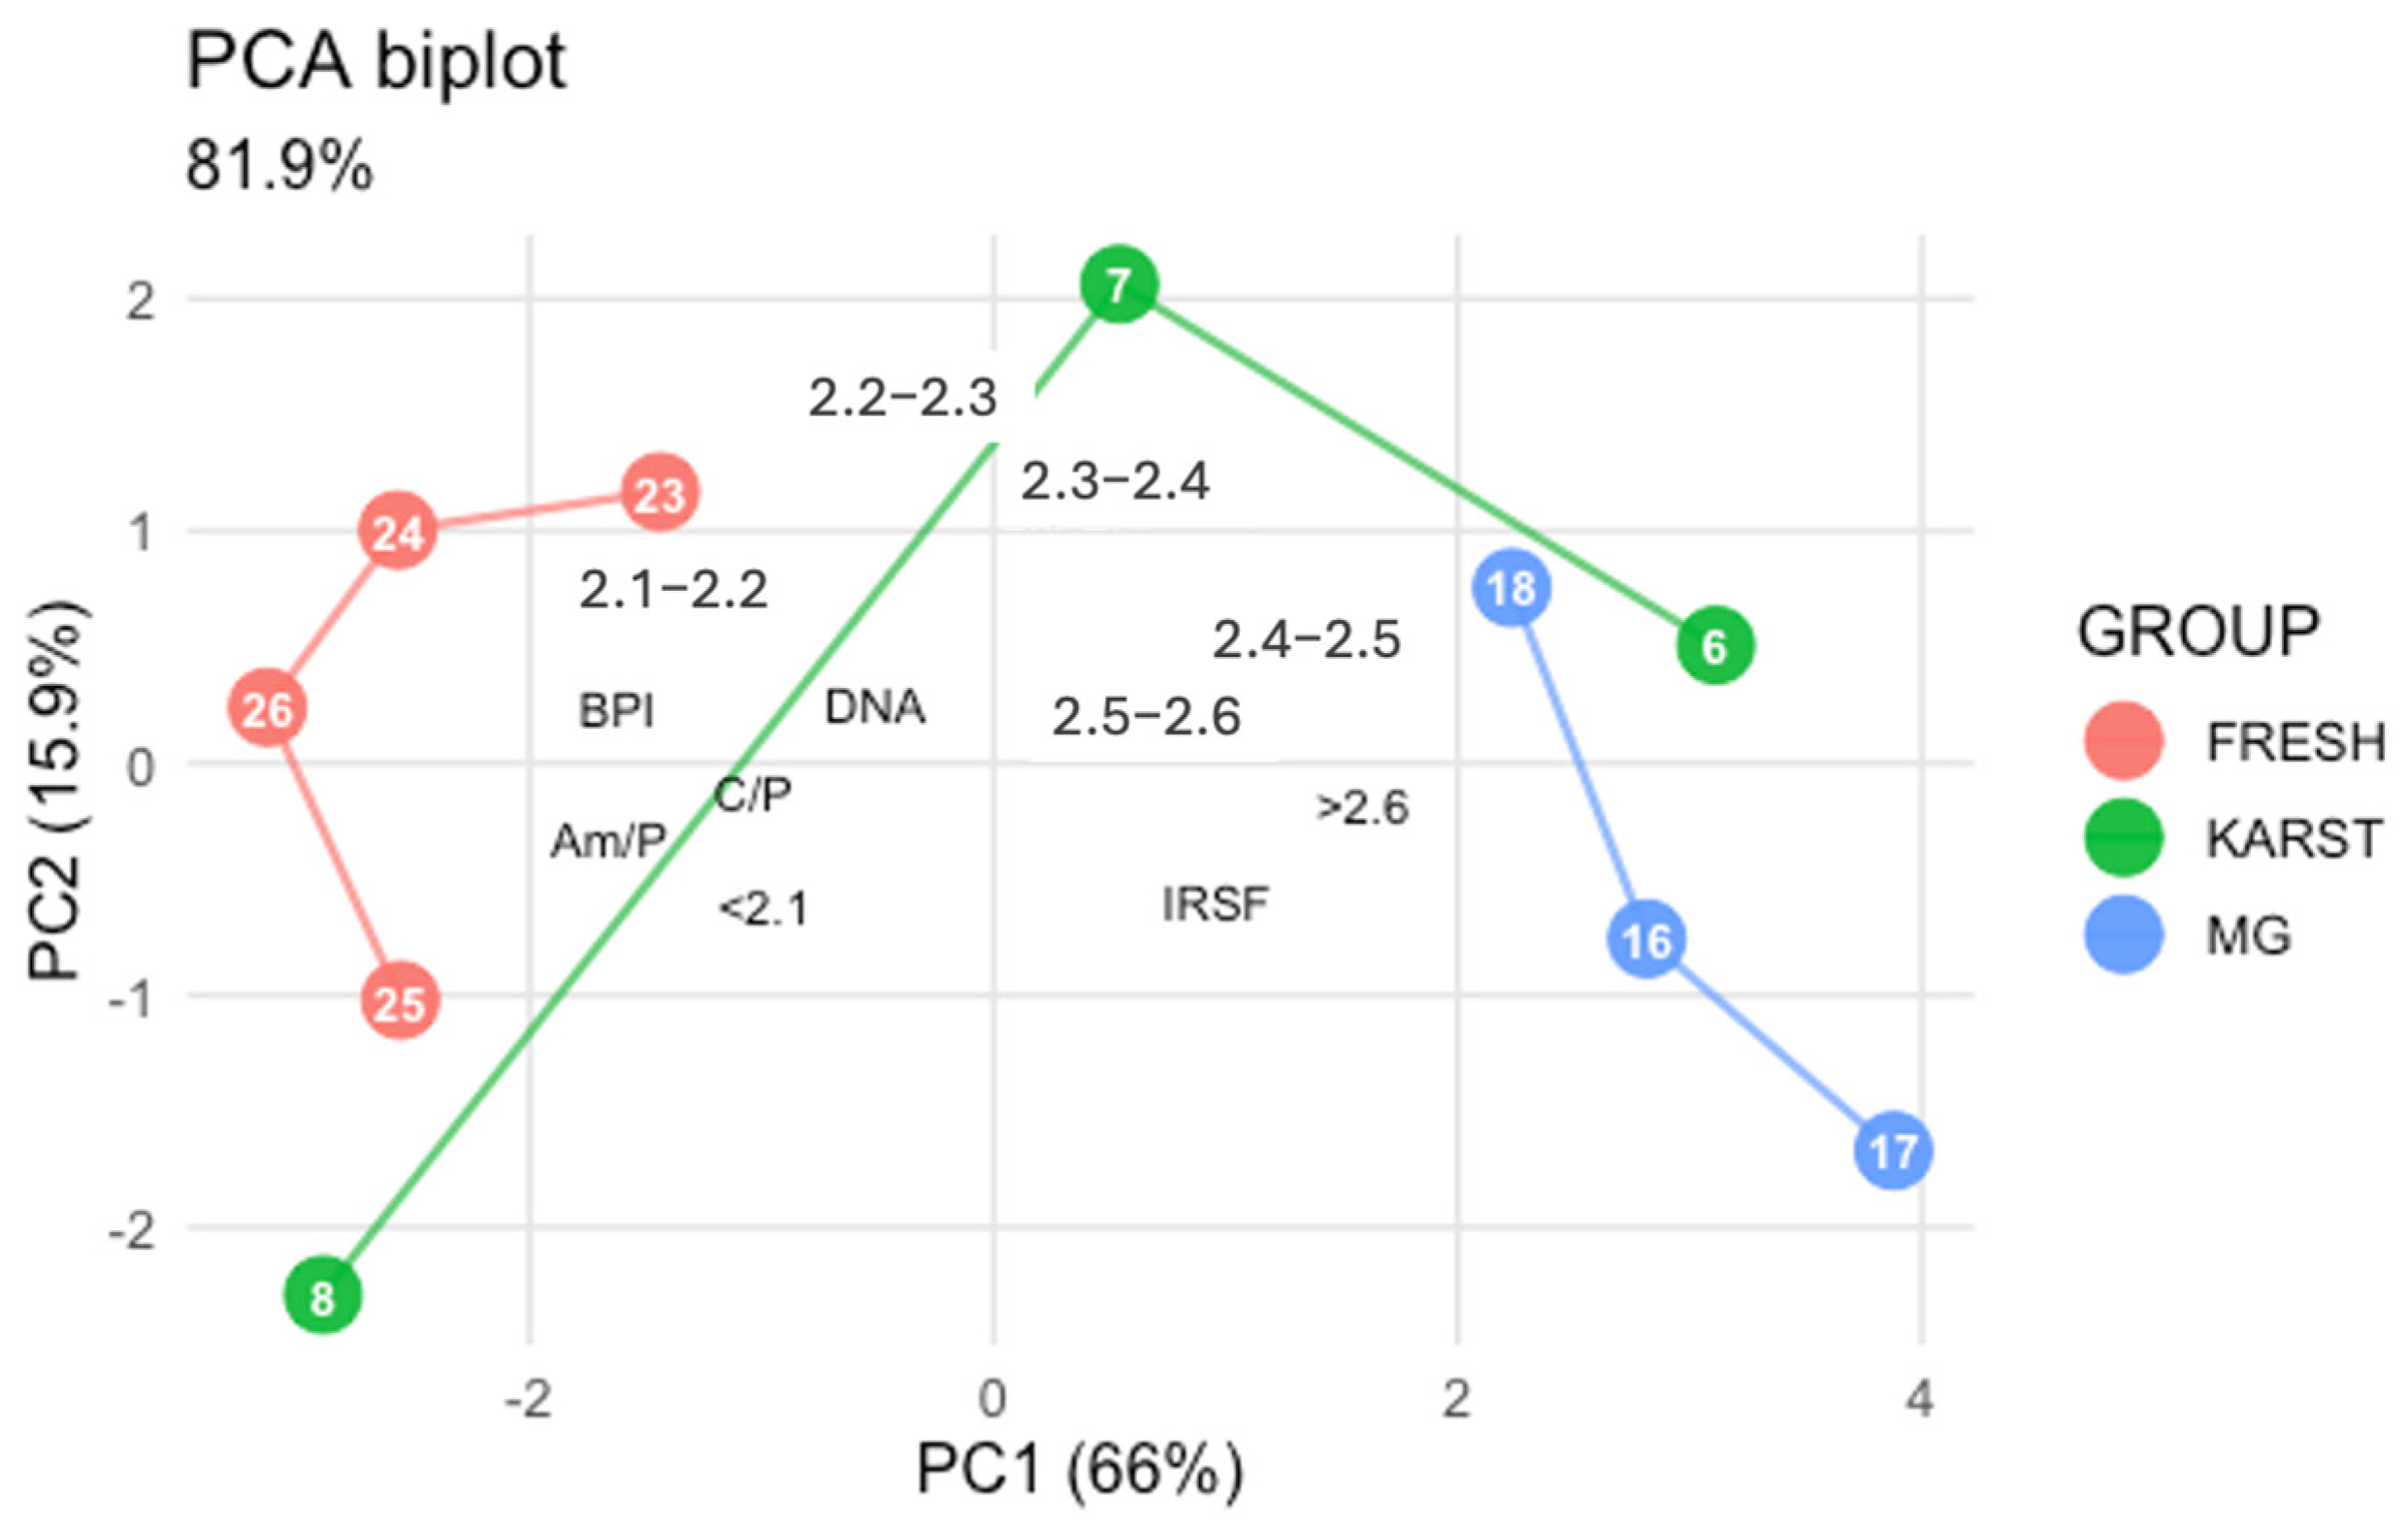
When DNA quantification results were included in the PCA (see Figure 6), the overall distribution of samples remained consistent with the analysis based solely on FTIR indices and SPT fractions. DNA recovery showed positive associations with C/P (r = 0.46), BPI (r = 0.58), Am/P (r = 0.56) and with the lower density fractions (<2.3: r range 0.47–0.49), whereas it was negatively associated with IRSF (r = −0.50) and with the densest fractions > 2.4 (r range −0.44 to −0.53). Within le limit of the size sample (n = 10), these findings indicate that the yields of DNA recovered from femur samples are linked to bone density.
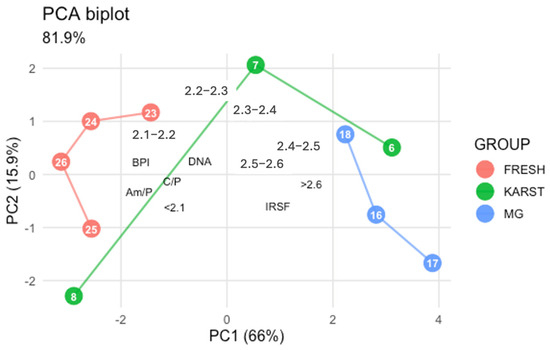
Figure 6.
Principal Component Analysis: biplot of the ten femur sample data including DNA quantification data. FRESH: control femurs; MG: femurs from the mass grave of Ossero; KARST: femurs from three different sites of the Italian Karst.
4. Conclusions
The assessment of the density of aged skeletal remains is of interest in various fields, including anthropology [2,13,39], palaeontology [8] and genetics [18,40].
In ancient and forensic DNA studies, factors protecting DNA within the bone matrix are widely investigated, with high bone density representing one candidate for better DNA preservation [16,41,42]; however, no definitive answer has been achieved yet. Therefore, new methods to assess bone density should be welcomed both in ancient and forensic DNA studies.
In this work, we assessed the use of an SPT gradient centrifugation method on size-selected (20–50 µm) bone powders. Fifty milligrams of bone powder obtained from different sets of bone types was used, with an average recovery of 89.9%. In addition, the method enables us to efficiently separate the gradient intervals in all the bone types we tested (femurs, petrous bones, metacarpal, and metatarsals), leading to a sort of bone-type-specific gradient profile in the samples of the WWII mass grave of Ossero (see Figure 2). It is clear, however, that our results do not allow for any generalization. Further work is needed to assess whether the proposed method can be applied to other bone types, such as vertebrae, radius, and so on.
Differences between the femurs found in the mass grave and the control were in some ways expected. The lack of reference data on the density of fresh femurs was the major obstacle at the beginning of this study; however, this issue was circumvented by the easy protocols we set up, which allowed the preparation of suitable controls in 3 to 5 days of work. Thus, within the limit of the small size of the sample analyzed here, the results clearly show that the proposed SPT method is able to highlight increased true density in the femur samples excavated from the WWII mass grave of Ossero. Of great relevance, extended levels of diagenesis were demonstrated in the same bone powders even by ATR-FTIR. Finally, PCA revealed a negative correlation between higher bone densities and the yield of DNA recovered from the samples.
It is well established that the petrous bone represents the best source of genetic material for forensic and ancient DNA studies [37,42,43] because it is generally accepted that the intrinsic high density of this bone type likely protects the sample from environmental attacks [16]. The data of our study do not allow us to establish whether the petrous bones we analyzed changed their density over 74 years of burial in the mass grave of Ossero. It is true, however, that the genetic data we collected from those bone powders [43] showed that petrous bones outperform other bone types. Therefore, it is likely that the true density values found in such petrous bones (see Figure 2) could represent density values that are in some way linked to acceptable DNA preservation levels. Fernandes et al. showed that the most performing fractions of 1.5–4.0 Ky petrous bones had a density of 2.3–2.4 g/cm3 [18], i.e., the same most represented fractions of the 74-year-old petrous bones studied here. However, it is clear that only the use of specific reference samples (i.e., fresh petrous bones) can prove the density modification that occurred in the aged ones analysed herein.
The data of this preliminary work indicate that the SPT centrifugation method can be applied to bone types usually employed in aged and forensic DNA studies. Although further studies are needed on the bone types not included here, we believe that the method proposed could be used for bone density assessment in several scientific contexts.
The main future perspective of this project is to study a possible correlation between bone density, diagenetic patterns and DNA preservation. At the time of this report, a large set of femoral specimens from various burial sites is under investigation. For these samples, DNA preservation will be assessed not only through quantitative PCR but also via short tandem repeat (STR) profiling. We hope that the SPT method described herein could serve as a predictive tool for evaluating the likelihood of successful DNA profiling, thereby offering rational support for genetic typing procedures. Lastly, the potential advantages of using this method over radiological and other chemical approaches [8,10,15,21,22,23,24,25,26,27] as a predictive tool will also be evaluated.
Supplementary Materials
The following supporting information can be downloaded at https://www.mdpi.com/article/10.3390/separations12100263/s1, Table S1: Composition of the seven SPT solutions; Table S2: Details of the spectral indices calculated from ATR-FTIR data; Table S3: Intra and inter-day precision assessment of the seven fractions recovered after gradient centrifugation; Table S4: Average recovery from each set of samples; Table S5: ATR-FTIR indexes of the bone samples; Figure S1: Description of the SPT gradient centrifugation protocol.
Author Contributions
Conceptualization, B.D.S., C.S. and P.F.; methodology, S.S.C.; software, S.B.; validation, G.M., formal analysis, B.D.S. and B.B.; investigation, G.B.; resources, P.F. and G.B.; data curation, S.S.C. and C.P.; writing—original draft preparation, P.F., C.S. and G.M.; writing—review and editing, P.F., G.M. and C.P.; funding acquisition, P.F. All authors have read and agreed to the published version of the manuscript.
Funding
This research received no external funding.
Institutional Review Board Statement
All methods were performed following the guidelines and regulations of the Ethics Committee (EC) of the University of Trieste, Italy. The study was approved by the EC with prot. n. 129/29 March 2023.
Data Availability Statement
Data are contained within the article or Supplementary Materials. Other data presented in this study are available upon reasonable request from the corresponding author.
Acknowledgments
The authors wish to thank CERIC for providing access to the SISSI-BIO beamline at Elettra Sincrotone Trieste (Trieste, Italy) for ATR-FTIR analyses (CERIC proposal ID: 20242127 and 20247141; Title: Attenuated total reflection Fourier transform infrared (ATR-FTIR) spectroscopy: a tool for predicting the outcome of genetic typing of decades-old bones?). Special thanks to Susanna Gerolami for the English revision of the manuscript.
Conflicts of Interest
The authors declare no conflicts of interest.
Abbreviations
The following abbreviations are used in this manuscript:
| SPT | Sodium Poly-Tungstate |
| CI | Confidence Interval |
| WWII | Second World War |
| ATR-FTIR | Attenuated Total Reflectance–Fourier Transformed Infrared spectroscopy |
| BMD | Bone Mineral Density |
| RSD | Relative Standard Deviation |
| Am/P | Amide-to-phosphate ratio |
| C/P | Carbonate-to-phosphate ratio |
| BPI | B-type carbonate substitution index (BPI) |
| IRSF | Infrared Splitting Factor (IRSF) |
| PCA | Principal Component Analysis |
Appendix A
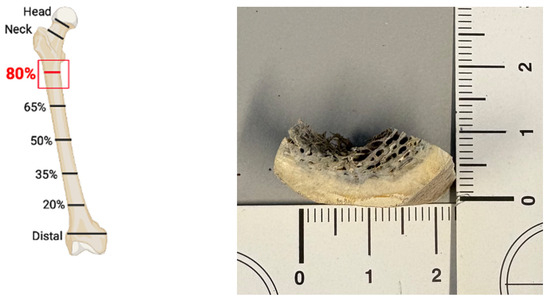
Figure A1.
“80% localisation” according to Lyman [1] (on the (left)), and cortical sample collected from aged femur #17 (on the (right)).
Figure A1.
“80% localisation” according to Lyman [1] (on the (left)), and cortical sample collected from aged femur #17 (on the (right)).
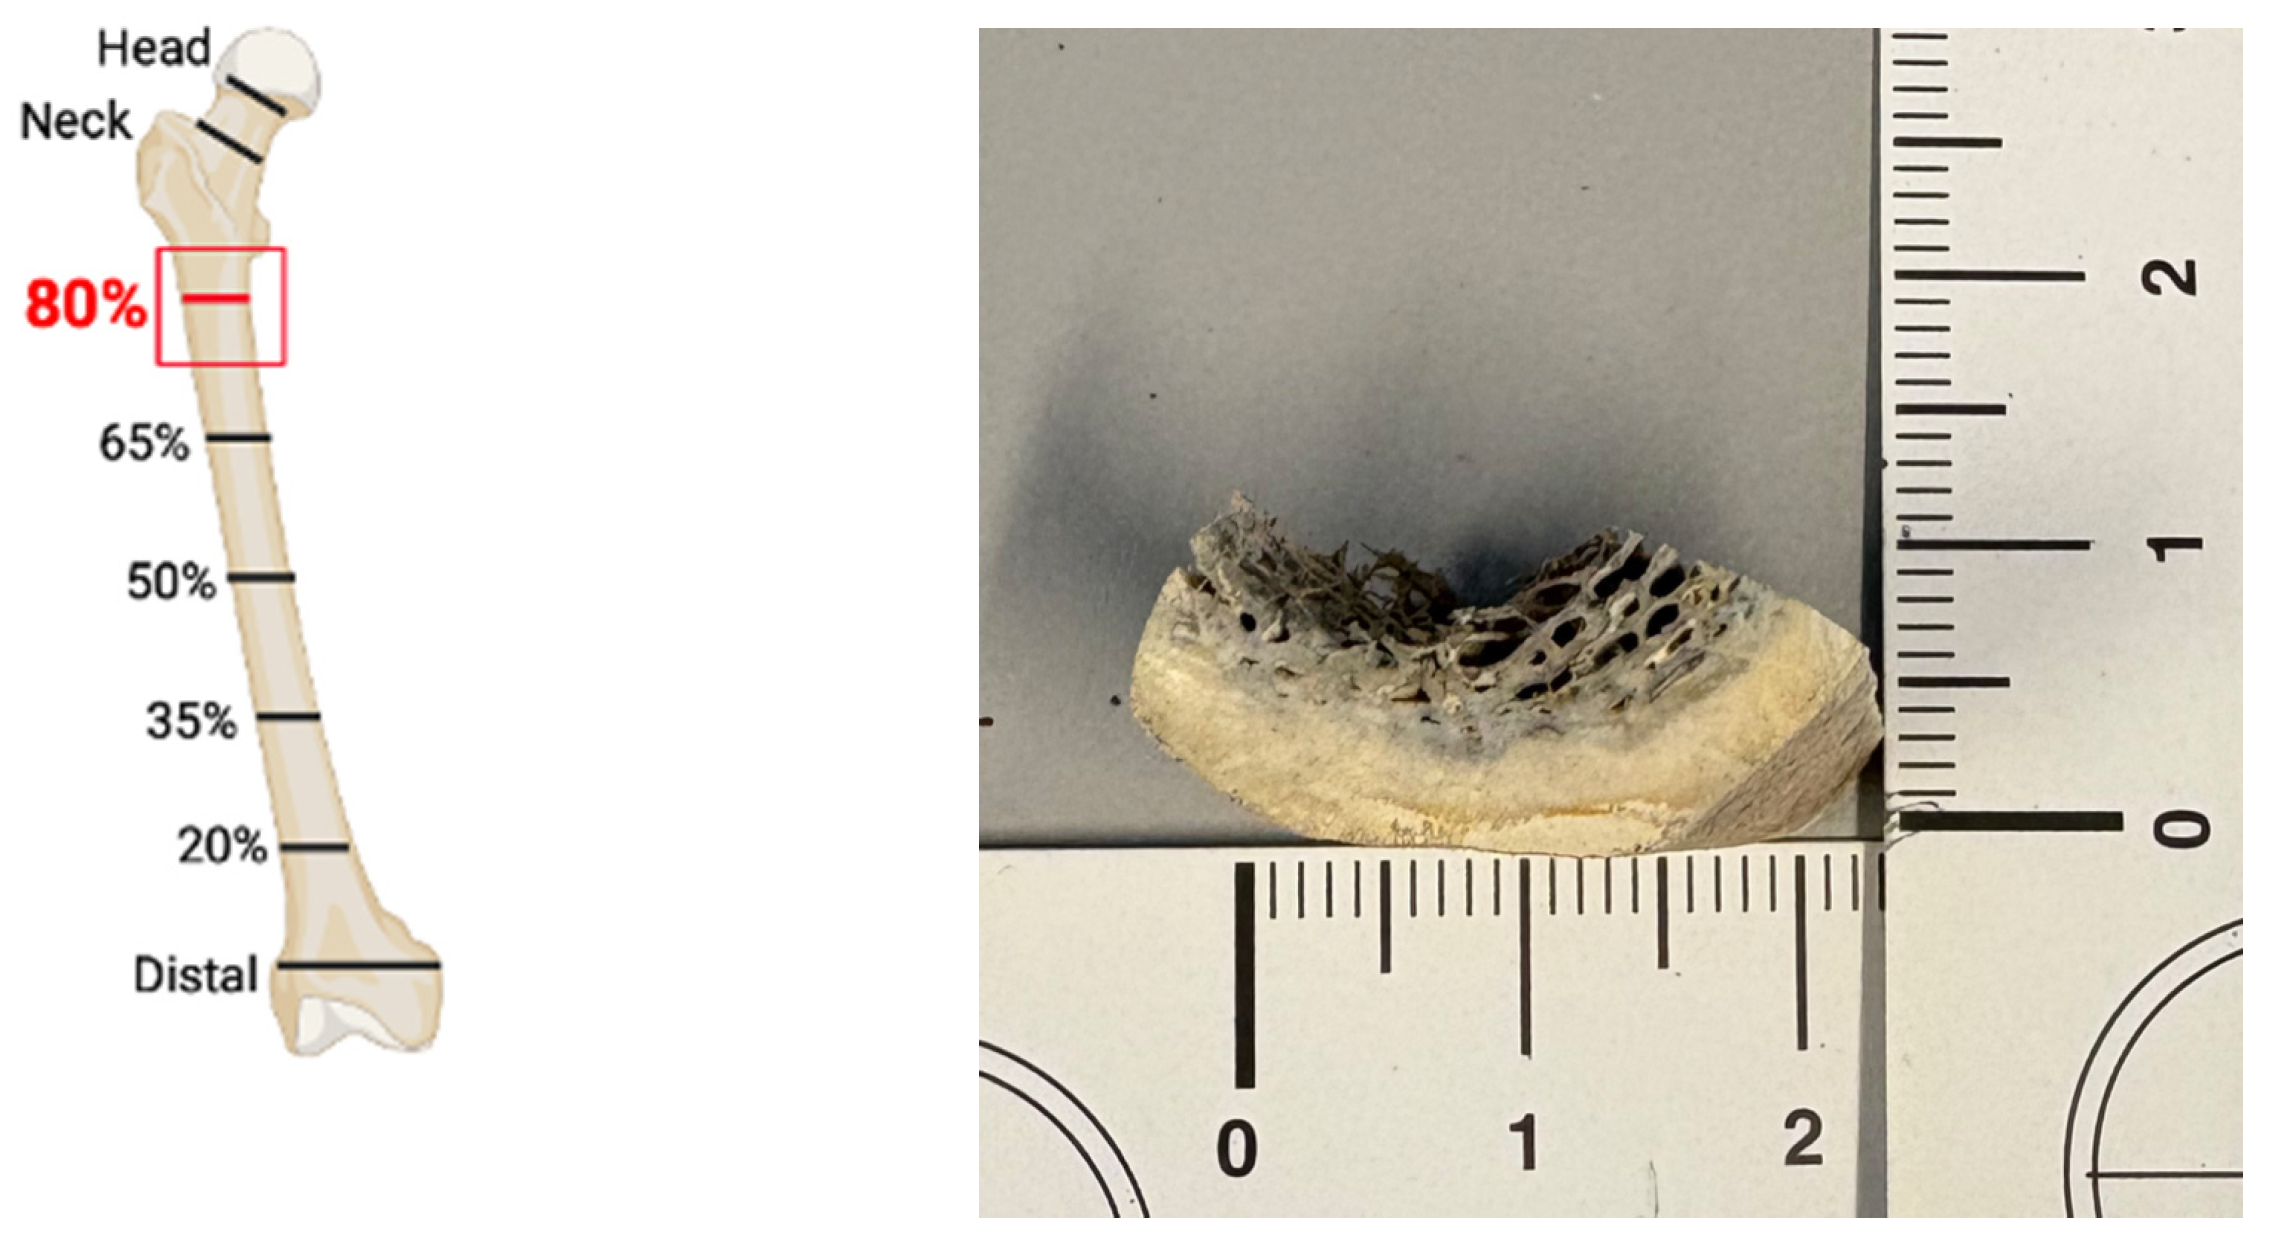
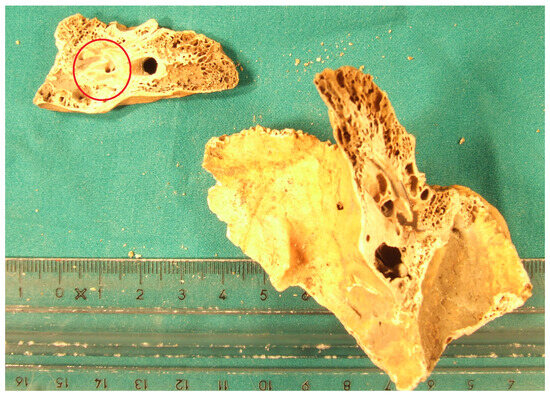
Figure A2.
Left temporal bone following longitudinal sectioning. The inner part is demarcated within the red circle. Only the inner (densest) part was used for powder preparation.
Figure A2.
Left temporal bone following longitudinal sectioning. The inner part is demarcated within the red circle. Only the inner (densest) part was used for powder preparation.
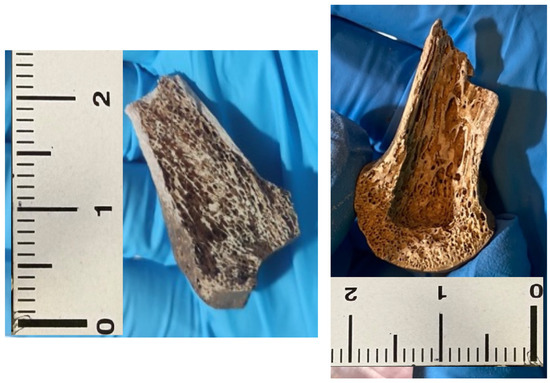
Figure A3.
Epiphysis of metacarpal bone # 30 (left). On the (right), the same specimen following mechanical removal of the cancellous bone.
Figure A3.
Epiphysis of metacarpal bone # 30 (left). On the (right), the same specimen following mechanical removal of the cancellous bone.
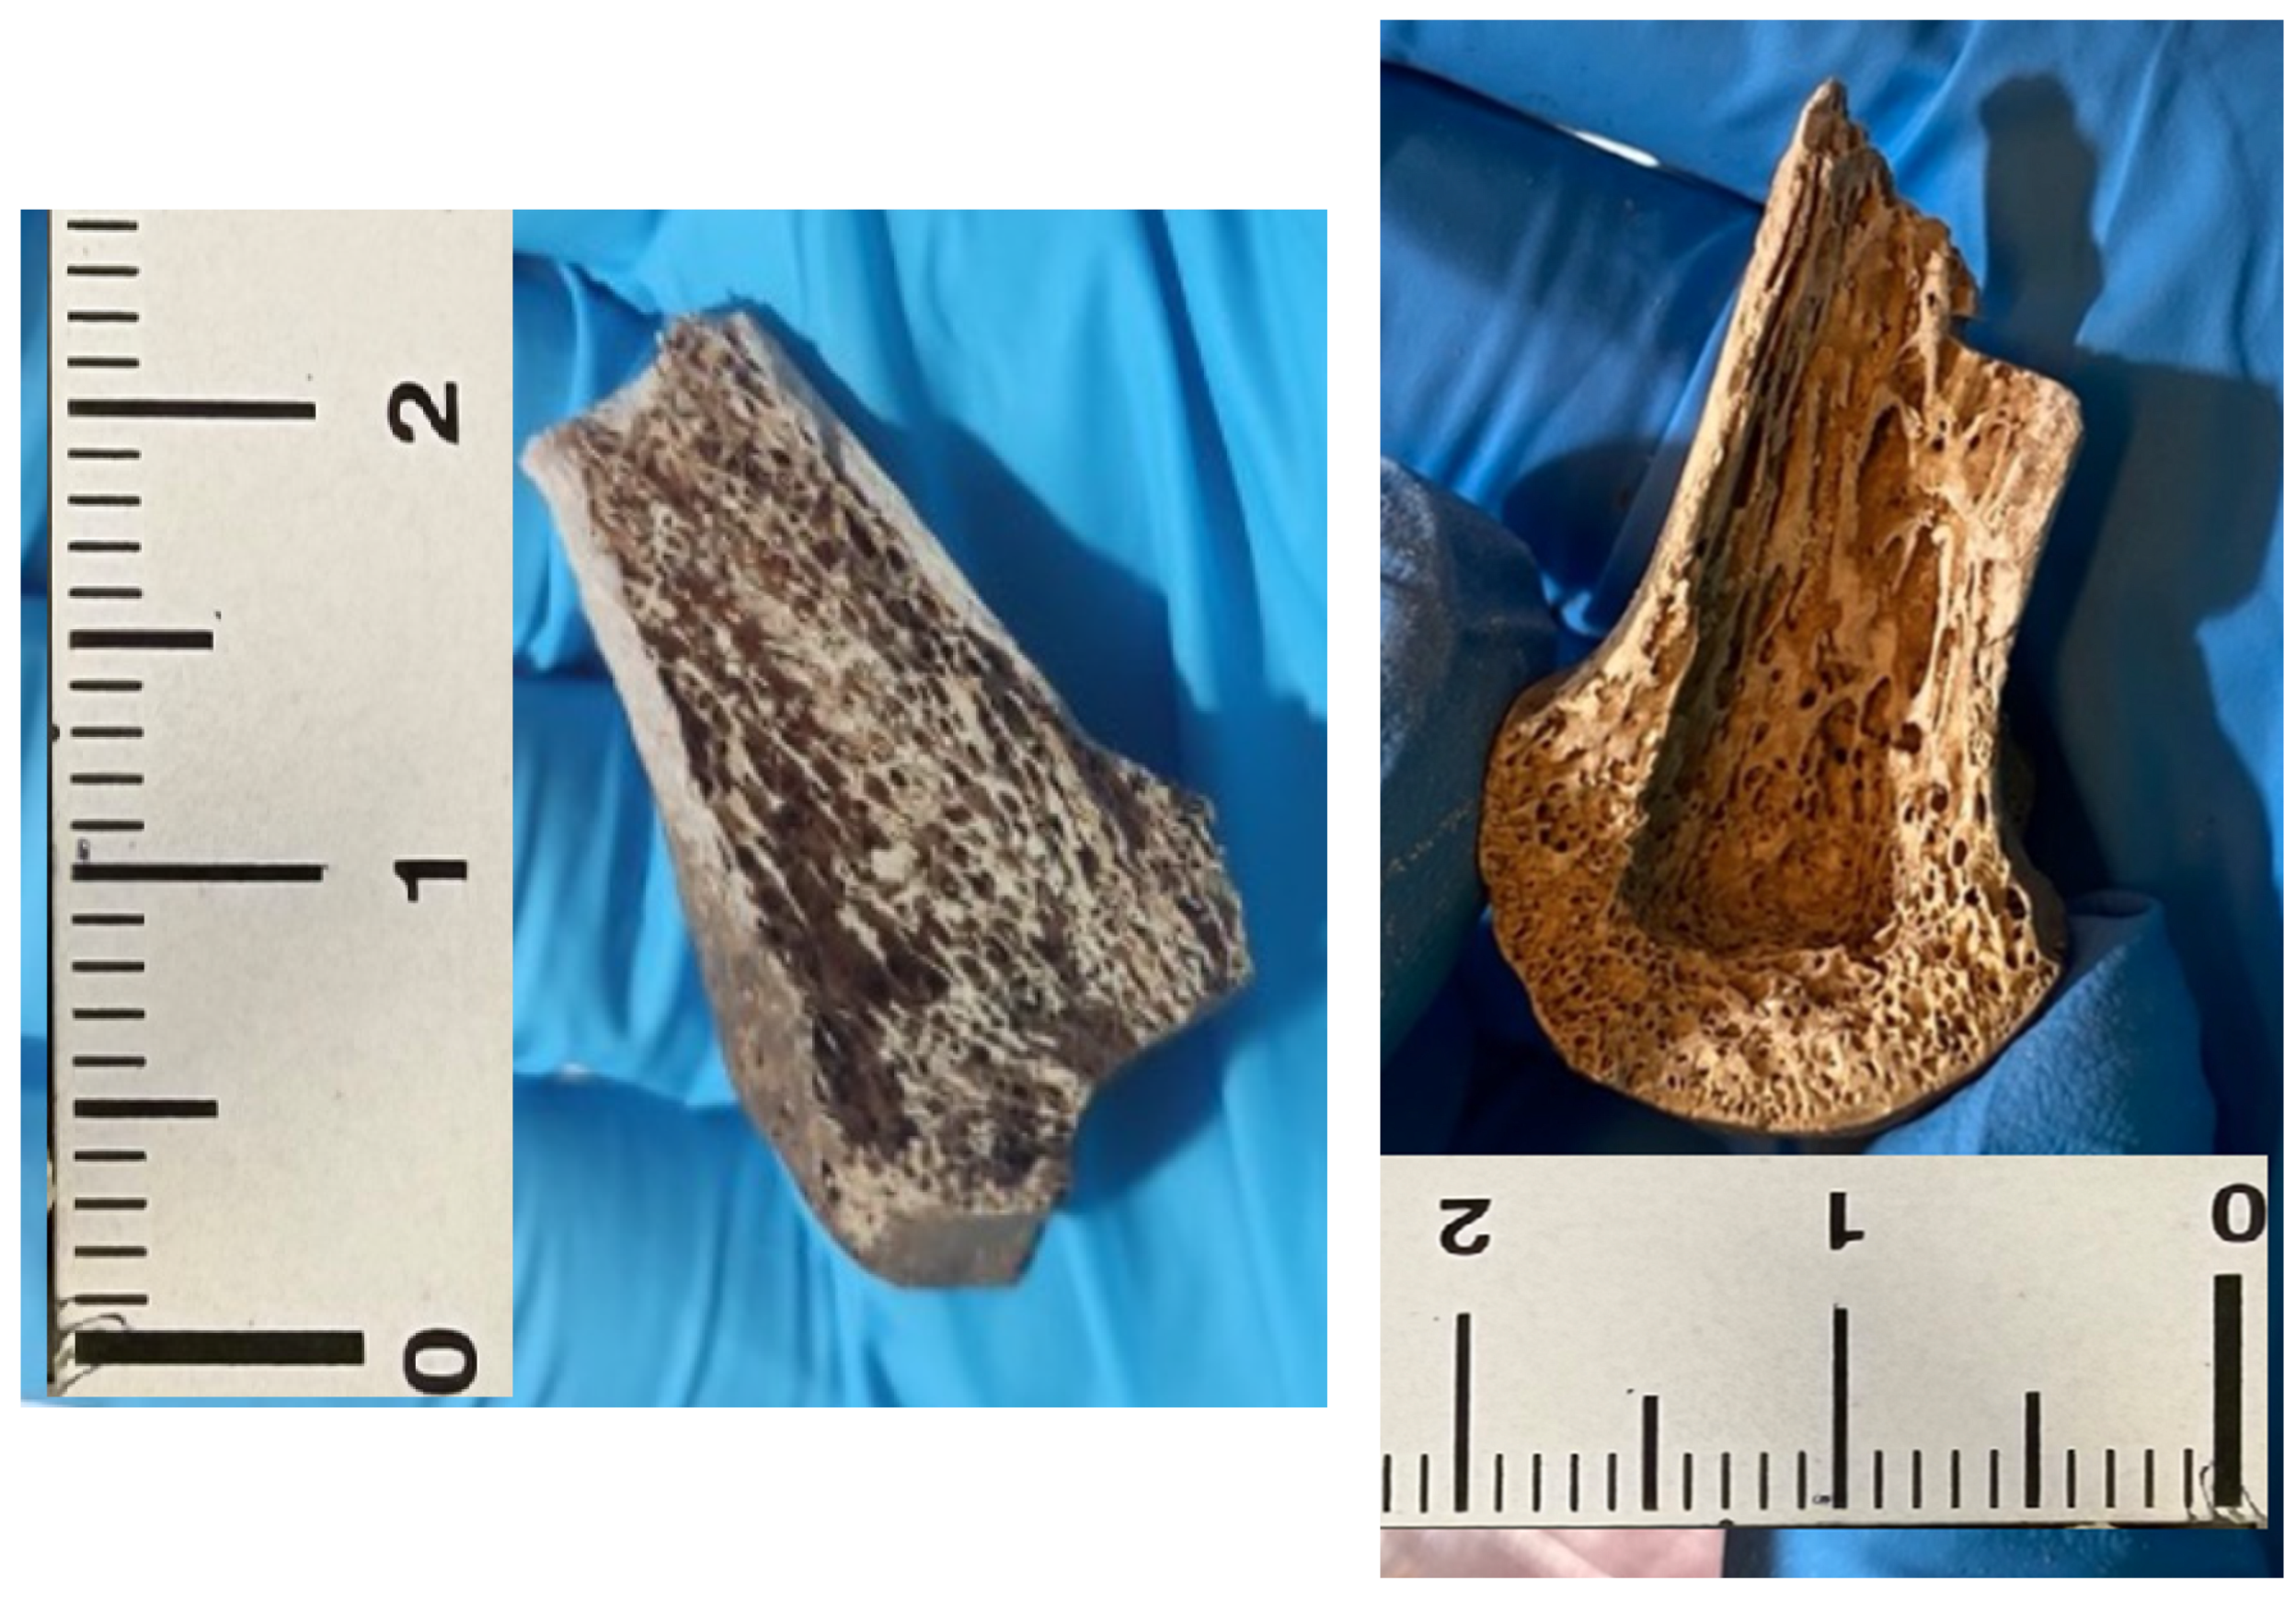
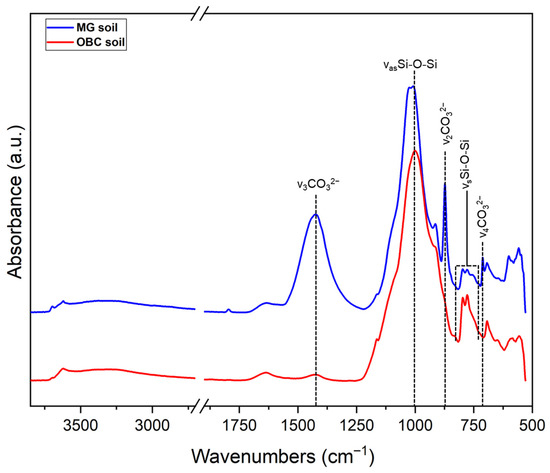
Figure A4.
ATR-FTIR spectra of soil samples recovered from the WWII mass grave of Ossero (Croatia) (in blue) and one burial site of the Italian Karst (in red).
Figure A4.
ATR-FTIR spectra of soil samples recovered from the WWII mass grave of Ossero (Croatia) (in blue) and one burial site of the Italian Karst (in red).
References
- Lyman, R. Bone density and differential survivorship of fossil classes. J. Anthr. Archaeol. 1984, 3, 259–299. [Google Scholar] [CrossRef]
- Hale, A.R.; Ross, A.H. Scanning Skeletal Remains for Bone Mineral Density in Forensic Contexts. J. Vis. Exp. 2018, 131, 56713. [Google Scholar] [CrossRef]
- Al-Akhras, M.-A.H.; Alebrahim, M.; Rajjash, A.S.B.; Al Jarrah, K.; Hammouri, H.; Mousa, M.; AlZoubi, T.; Makhadmeh, G.N.; Tavares, C.J. Ancient and modern bone diagnosis: Towards a better understanding of chemical and structural feature alterations. Spectrochim. Acta Part A Mol. Biomol. Spectrosc. 2024, 326, 125259. [Google Scholar] [CrossRef]
- Henyš, P.; Vořechovský, M.; Kuchař, M.; Heinemann, A.; Kopal, J.; Ondruschka, B.; Hammer, N. Bone mineral density modeling via random field: Normality, stationarity, sex and age dependence. Comput. Methods Programs Biomed. 2021, 210, 106353. [Google Scholar] [CrossRef]
- Kelly, P.J.; Twomey, L.; Sambrook, P.N.; Eisman, J.A.D. Sex differences in peak adult bone mineral density. J. Bone Miner. Res. 1990, 5, 1169–1175. [Google Scholar] [CrossRef]
- Ettinger, B.; Sidney, S.; Cummings, S.R.; Libanati, C.; Bikle, D.D.; Tekawa, I.S.; Tolan, K.; Steiger, P. Racial Differences in Bone Density between Young Adult Black and White Subjects Persist after Adjustment for Anthropometric, Lifestyle, and Biochemical Differences. J. Clin. Endocrinol. Metab. 1997, 82, 429–434. [Google Scholar] [CrossRef] [PubMed]
- Carter, Y.; Suchorab, J.L.; Thomas, C.D.L.; Clement, J.G.; Cooper, D.M.L. Normal variation in cortical osteocyte lacunar parameters in healthy young males. Am. J. Anat. 2014, 225, 328–336. [Google Scholar] [CrossRef] [PubMed]
- Bell, L.S.; Cox, G.; Sealy, J. Determining isotopic life history trajectories using bone density fractionation and stable isotope measurements: A new approach. Am. J. Phys. Anthr. 2001, 116, 66–79. [Google Scholar] [CrossRef]
- Shevroja, E.; Cafarelli, F.P.; Guglielmi, G.; Hans, D. DXA parameters, Trabecular Bone Score (TBS) and Bone Mineral Density (BMD), in fracture risk prediction in endocrine-mediated secondary osteoporosis. Endocrine 2021, 74, 20–28. [Google Scholar] [CrossRef] [PubMed]
- Blake, G.M.; Fogelman, I. The clinical role of dual energy X-ray absorptiometry. Eur. J. Radiol. 2009, 71, 406–414. [Google Scholar] [CrossRef]
- Simmons, E.D.; Pritzker, K.P.H.; Grynpas, M.D. Age-related changes in the human femoral cortex. J. Orthop. Res. 1991, 9, 155–167. [Google Scholar] [CrossRef]
- Engfeldt, B.; Hjerpe, A. Density gradient fractionation of dentine and bone powder. Calcif. Tissue Int. 1974, 16, 261–275. [Google Scholar] [CrossRef]
- Bethard, J.D.; Berger, J.M.; Maiers, J.; Ross, A.H. Bone Mineral Density Adult Age Estimation in Forensic Anthropology: A Test of the DXAGE Application. J. Forensic Sci. 2018, 64, 1125–1128. [Google Scholar] [CrossRef] [PubMed]
- Scaggion, C.; Sasso, G.D.; Nodari, L.; Pagani, L.; Carrara, N.; Zotti, A.; Banzato, T.; Usai, D.; Pasqualetto, L.; Gadioli, G.; et al. An FTIR-based model for the diagenetic alteration of archaeological bones. J. Archaeol. Sci. 2023, 161, 105900. [Google Scholar] [CrossRef]
- Hedges, R.E.M. Bone diagenesis: An overview of processes. Archaeometry 2002, 44, 319–328. [Google Scholar] [CrossRef]
- Ibrahim, J.; Brumfeld, V.; Addadi, Y.; Rubin, S.; Weiner, S.; Boaretto, E. The petrous bone contains high concentrations of osteocytes: One possible reason why ancient DNA is better preserved in this bone. PLoS ONE 2022, 17, e0269348. [Google Scholar] [CrossRef]
- Geršak, Ž.M.; Salapura, V.; Podovšovnik, E.; Zupanič-Pajnič, I. Targeting Optimal Bone Regions: Correlations Between Bone Density and DNA Quality in Small Skeletal Elements. Genes 2025, 16, 291. [Google Scholar] [CrossRef]
- Fernandes, D.M.; Sirak, K.A.; Cheronet, O.; Novak, M.; Brück, F.; Zelger, E.; Llanos-Lizcano, A.; Wagner, A.; Zettl, A.; Mandl, K.; et al. Density separation of petrous bone powders for optimized ancient DNA yields. Genome Res. 2023, 33, 622–631. [Google Scholar] [CrossRef]
- Kendall, C.; Eriksen, A.M.H.; Kontopoulos, I.; Collins, M.J.; Turner-Walker, G. Diagenesis of archaeological bone and tooth. Palaeogeogr. Palaeoclim. Palaeoecol. 2018, 491, 21–37. [Google Scholar] [CrossRef]
- de Sousa, D.V.; Eltink, E.; Oliveira, R.A.P.; Félix, J.F.; Guimarães, L.d.M. Diagenetic processes in Quaternary fossil bones from tropical limestone caves. Sci. Rep. 2020, 10, 21425. [Google Scholar] [CrossRef]
- Shin, J.Y.; Hedges, R.E. Diagenesis in bone and enamel apatite carbonate; the potential of density separation to assess the original composition. J. Archaeol. Sci. 2012, 39, 1123–1130. [Google Scholar] [CrossRef]
- Smith, D.R.; Martin, E.K.; Kaufman, B.L.; Callaghan, M.; Cardona, K.; Kovacevich, B.; Toyne, J.M. The bottom line: Exploring analytical methods for assessing bioapatite preservation in archaeological bone using FTIR-ATR. J. Archaeol. Sci. Rep. 2023, 50, 104014. [Google Scholar] [CrossRef]
- Trueman, C.N.; Behrensmeyer, A.K.; Tuross, N.; Weiner, S. Mineralogical and compositional changes in bones exposed on soil surfaces in Amboseli National Park, Kenya: Diagenetic mechanisms and the role of sediment pore fluids. J. Archaeol. Sci. 2004, 31, 721–739. [Google Scholar] [CrossRef]
- Wright, L.E.; Schwarcz, H.P. Infrared and Isotopic Evidence for Diagenesis of Bone Apatite at Dos Pilas, Guatemala: Palaeodietary Implications. J. Archaeol. Sci. 1996, 23, 933–944. [Google Scholar] [CrossRef]
- Sponheimer, M.; Lee-Thorp, J.A. Isotopic Evidence for the Diet of an Early Hominid, Australopithecus africanus. Science 1999, 283, 368–370. [Google Scholar] [CrossRef]
- Weiner, S.; Bar-Yosef, O. States of preservation of bones from prehistoric sites in the Near East: A survey. J. Archaeol. Sci. 1990, 17, 187–196. [Google Scholar] [CrossRef]
- Kontopoulos, I.; Penkman, K.; Mullin, V.E.; Winkelbach, L.; Unterländer, M.; Scheu, A.; Kreutzer, S.; Hansen, H.B.; Margaryan, A.; Teasdale, M.D.; et al. Screening archaeological bone for palaeogenetic and palaeoproteomic studies. PLoS ONE 2020, 15, e0235146. [Google Scholar] [CrossRef]
- Di Stefano, B.; Pajnič, I.Z.; Concato, M.; Bertoglio, B.; Calvano, M.G.; Ciglieri, S.S.; Bosetti, A.; Grignani, P.; Addoum, Y.; Vetrini, R.; et al. Evaluation of a New DNA Extraction Method on Challenging Bone Samples Recovered from a WWII Mass Grave. Genes 2024, 15, 672. [Google Scholar] [CrossRef] [PubMed]
- Pajnič, I.Z. Extraction of DNA from Human Skeletal Material. Methods Mol. Biol. 2016, 1420, 89–108. [Google Scholar] [CrossRef]
- Birarda, G.; Bedolla, D.; Piccirilli, F.; Stani, C.; Vondracek, H.; Vaccari, L. Chemical analyses at micro and nano scale at SISSI-Bio beamline at Elettra-Sincrotrone Trieste. In Proceedings of the Biomedical Vibrational Spectroscopy 2022: Advances in Research and Industry, Virtual, 20–24 February 2022; Volume 11957, p. 1195707. [Google Scholar] [CrossRef]
- Toplak, M.; Birarda, G.; Read, S.; Sandt, C.; Rosendahl, S.M.; Vaccari, L.; Demšar, J.; Borondics, F. Infrared Orange: Connecting Hyperspectral Data with Machine Learning. Synchrotron Radiat. News 2017, 30, 40–45. [Google Scholar] [CrossRef]
- Toplak, M.; Read, S.T.; Sandt, C.; Borondics, F. Quasar: Easy Machine Learning for Biospectroscopy. Cells 2021, 10, 2300. [Google Scholar] [CrossRef]
- Leardi, R.; Melzi, C.; Polotti, G. CAT (Chemometric Agile Tool). Available online: http://gruppochemiometria.it/index.php/software (accessed on 17 August 2025).
- R Core Team, R: A Language and Environment for Statistical Computing; R Foundation for Statistical Computing: Vienna, Austria, 2024; Available online: https://www.r-project.org (accessed on 17 August 2025).
- Pedrosa, M.; Curate, F.; de Carvalho, L.A.E.B.; Marques, M.P.M.; Ferreira, M.T. Beyond metrics and morphology: The potential of FTIR-ATR and chemometrics to estimate age-at-death in human bone. Int. J. Leg. Med. 2020, 134, 1905–1914. [Google Scholar] [CrossRef]
- Kontopoulos, I.; Penkman, K.; McAllister, G.D.; Lynnerup, N.; Damgaard, P.B.; Hansen, H.B.; Allentoft, M.E.; Collins, M.J. Petrous bone diagenesis: A multi-analytical approach. Palaeogeogr. Palaeoclim. Palaeoecol. 2019, 518, 143–154. [Google Scholar] [CrossRef]
- Hedges, R.E.; Millard, A.R. Bones and Groundwater: Towards the Modelling of Diagenetic Processes. J. Archaeol. Sci. 1995, 22, 155–164. [Google Scholar] [CrossRef]
- Turner-Walker, G. The Chemical and Microbial Degradation of Bones and Teeth. Adv. Hum. Palaeopathol. 2008, 592, 3–29. [Google Scholar] [CrossRef]
- Carretero, J.; Rodríguez, L.; García-González, R.; Quam, R.; Arsuaga, J. Exploring bone volume and skeletal weight in the Middle Pleistocene humans from the Sima de los Huesos site (Sierra de Atapuerca, Spain). Am. J. Anat. 2018, 233, 740–754. [Google Scholar] [CrossRef] [PubMed]
- Andronowski, J.M.; Mundorff, A.Z.; Pratt, I.V.; Davoren, J.M.; Cooper, D.M. Evaluating differential nuclear DNA yield rates and osteocyte numbers among human bone tissue types: A synchrotron radiation micro-CT approach. Forensic Sci. Int. Genet. 2017, 28, 211–218. [Google Scholar] [CrossRef]
- Hansen, H.B.; Damgaard, P.B.; Margaryan, A.; Stenderup, J.; Lynnerup, N.; Willerslev, E.; E Allentoft, M. Comparing Ancient DNA Preservation in Petrous Bone and Tooth Cementum. PLoS ONE 2017, 12, e0170940. [Google Scholar] [CrossRef] [PubMed]
- Hollund, H.I.; Teasdale, M.D.; Mattiangeli, V.; Sverrisdóttir, O.Ó.; Bradley, D.G.; O’COnnor, T. Pick the Right Pocket. Sub-sampling of Bone Sections to Investigate Diagenesis and DNA Preservation. Int. J. Osteoarchaeol. 2017, 27, 365–374. [Google Scholar] [CrossRef]
- Di Stefano, B.; Bertoglio, B.; Melchionda, F.; Concato, M.; Ciglieri, S.S.; Bosetti, A.; Grignani, P.; Azzalini, E.; Addoum, Y.; Vetrini, R.; et al. Molecular Identification of the Italian Soldiers Found in the Second World War Mass Grave of Ossero. Genes 2025, 16, 326. [Google Scholar] [CrossRef]
Disclaimer/Publisher’s Note: The statements, opinions and data contained in all publications are solely those of the individual author(s) and contributor(s) and not of MDPI and/or the editor(s). MDPI and/or the editor(s) disclaim responsibility for any injury to people or property resulting from any ideas, methods, instructions or products referred to in the content. |
© 2025 by the authors. Licensee MDPI, Basel, Switzerland. This article is an open access article distributed under the terms and conditions of the Creative Commons Attribution (CC BY) license (https://creativecommons.org/licenses/by/4.0/).

