Article

Separation Process for Methanol–Methylal–Methyl Formate Multicomponent System in Polyformaldehyde Production Waste Liquid: Modeling and Techno-Economic Analysis

1
School of Materials and Chemical Engineering, Hunan Institute of Engineering, Xiangtan 411105, China
2
School of Chemical Engineering, Xiangtan University, Xiangtan 411105, China
3
School of Chemistry, Xiangtan University, Xiangtan 411105, China
*
Author to whom correspondence should be addressed.
Separations 2025, 12(1), 12; https://doi.org/10.3390/separations12010012
Submission received: 6 December 2024 / Revised: 31 December 2024 / Accepted: 5 January 2025 / Published: 10 January 2025

Abstract

:
The vapor–liquid equilibrium (VLE) data of the ternary system methanol–methyl formate–methylal was measured at atmospheric pressure using a modified Rose equilibrium kettle with vapor–liquid double circulation method. The experiment data were correlated with the NRTL, UNIQUAC, and Wilson activity coefficient model equations. The results shown that the root mean square deviation (RMSD) between the calculated and simulated values of the three models followed the order: UNIQUAC ≈ NRTL < Wilson, and except for the RMSD (T) in the range of 0.4–0.5, the others are less than 0.01. In addition, the NRTL model was selected to link with Aspen Plus software to simulate the separation process of polyformaldehyde (POM) waste liquid. The simulation results show that the methyl formate in POM waste stream can be purified by simple distillation, while the methylal separated from the POM waste liquid, which was affected by factors like the azeotropic behavior of binary components, necessitates a complex distillation process. Under optimal operating conditions, the recovery yield of methyl formate through direct distillation can reach 99.7%, with an economic benefit of 6960.1 CNY per ton of waste liquid. Although the economic benefit of the multi-component distillation reach 7281.2 CNY, the increase in the number of equipment and the complexity of the process have negative impacts.

1. Introduction

Methyl formate [1] and methylal are important organic synthesis intermediates, widely used in the synthesis of pharmaceuticals, fumigants, insecticides, and fungicides, offering high economic value [2,3,4]. In the industrial production process where formaldehyde solution is used as a raw material to synthesize trioxane [5] (TOX) and TOX is copolymerized to produce polyoxymethylene (POM), by-products, such as formic acid, methanol, methylal, and methyl formate, are inevitably produced due to the negative effect of side reactions like TOX depolymerization and formaldehyde disproportionation [6,7,8]. Moreover, the organic waste liquid with these by-products is directly incinerated, which leads to resource wastage and environmental pollution [9]. Thus, recovering high-value by-products such as methyl formate from POM production waste liquid in an economical and rational manner to achieve resource recycling has significant economic and social benefits.
Phase equilibrium [10,11,12] is the focus of research on component separation and resource recovery. Researchers have reported the phase equilibrium data and correlated models for systems related to formaldehyde–water–methanol–methylal and trioxane–formaldehyde–water–methanol, as well as their associated binary and ternary systems. For example, Maurer [13,14], Brandani [15,16,17], and Pohorecki [18] have successively measured the vapor–liquid equilibrium (VLE) data for the trioxane–formaldehyde–water ternary system and its binary subsystems, refining the binary interaction parameters for these systems. Hasse [19,20,21] measured the VLE data for formaldehyde–water binary system and trioxane–water–methanol ternary system and correlated the UNIQUAC model to simulate the unit operation process of these systems [22]. However, the VLE data and correlation model for key by-products in the TOX production process, such as methyl formate, have not yet been reported. To recover the by-products like methyl formate from POM waste liquid, this study focuses on the methanol–methyl formate–methylal ternary system and measures the experiment data for the ternary system. Furthermore, the VLE data of the ternary systems are correlated with the NRTL, UNIQUAC, and Wilson activity coefficient model equations, and the binary interaction parameters were obtained by data regression. In addition, the correlation model was linked with Aspen Plus process simulation software (V14 version) to simulate and optimize the separation process for POM waste liquid, and a techno-economic analysis is conducted.

2. Materials and Methods

2.1. Reagents and Analytical Method
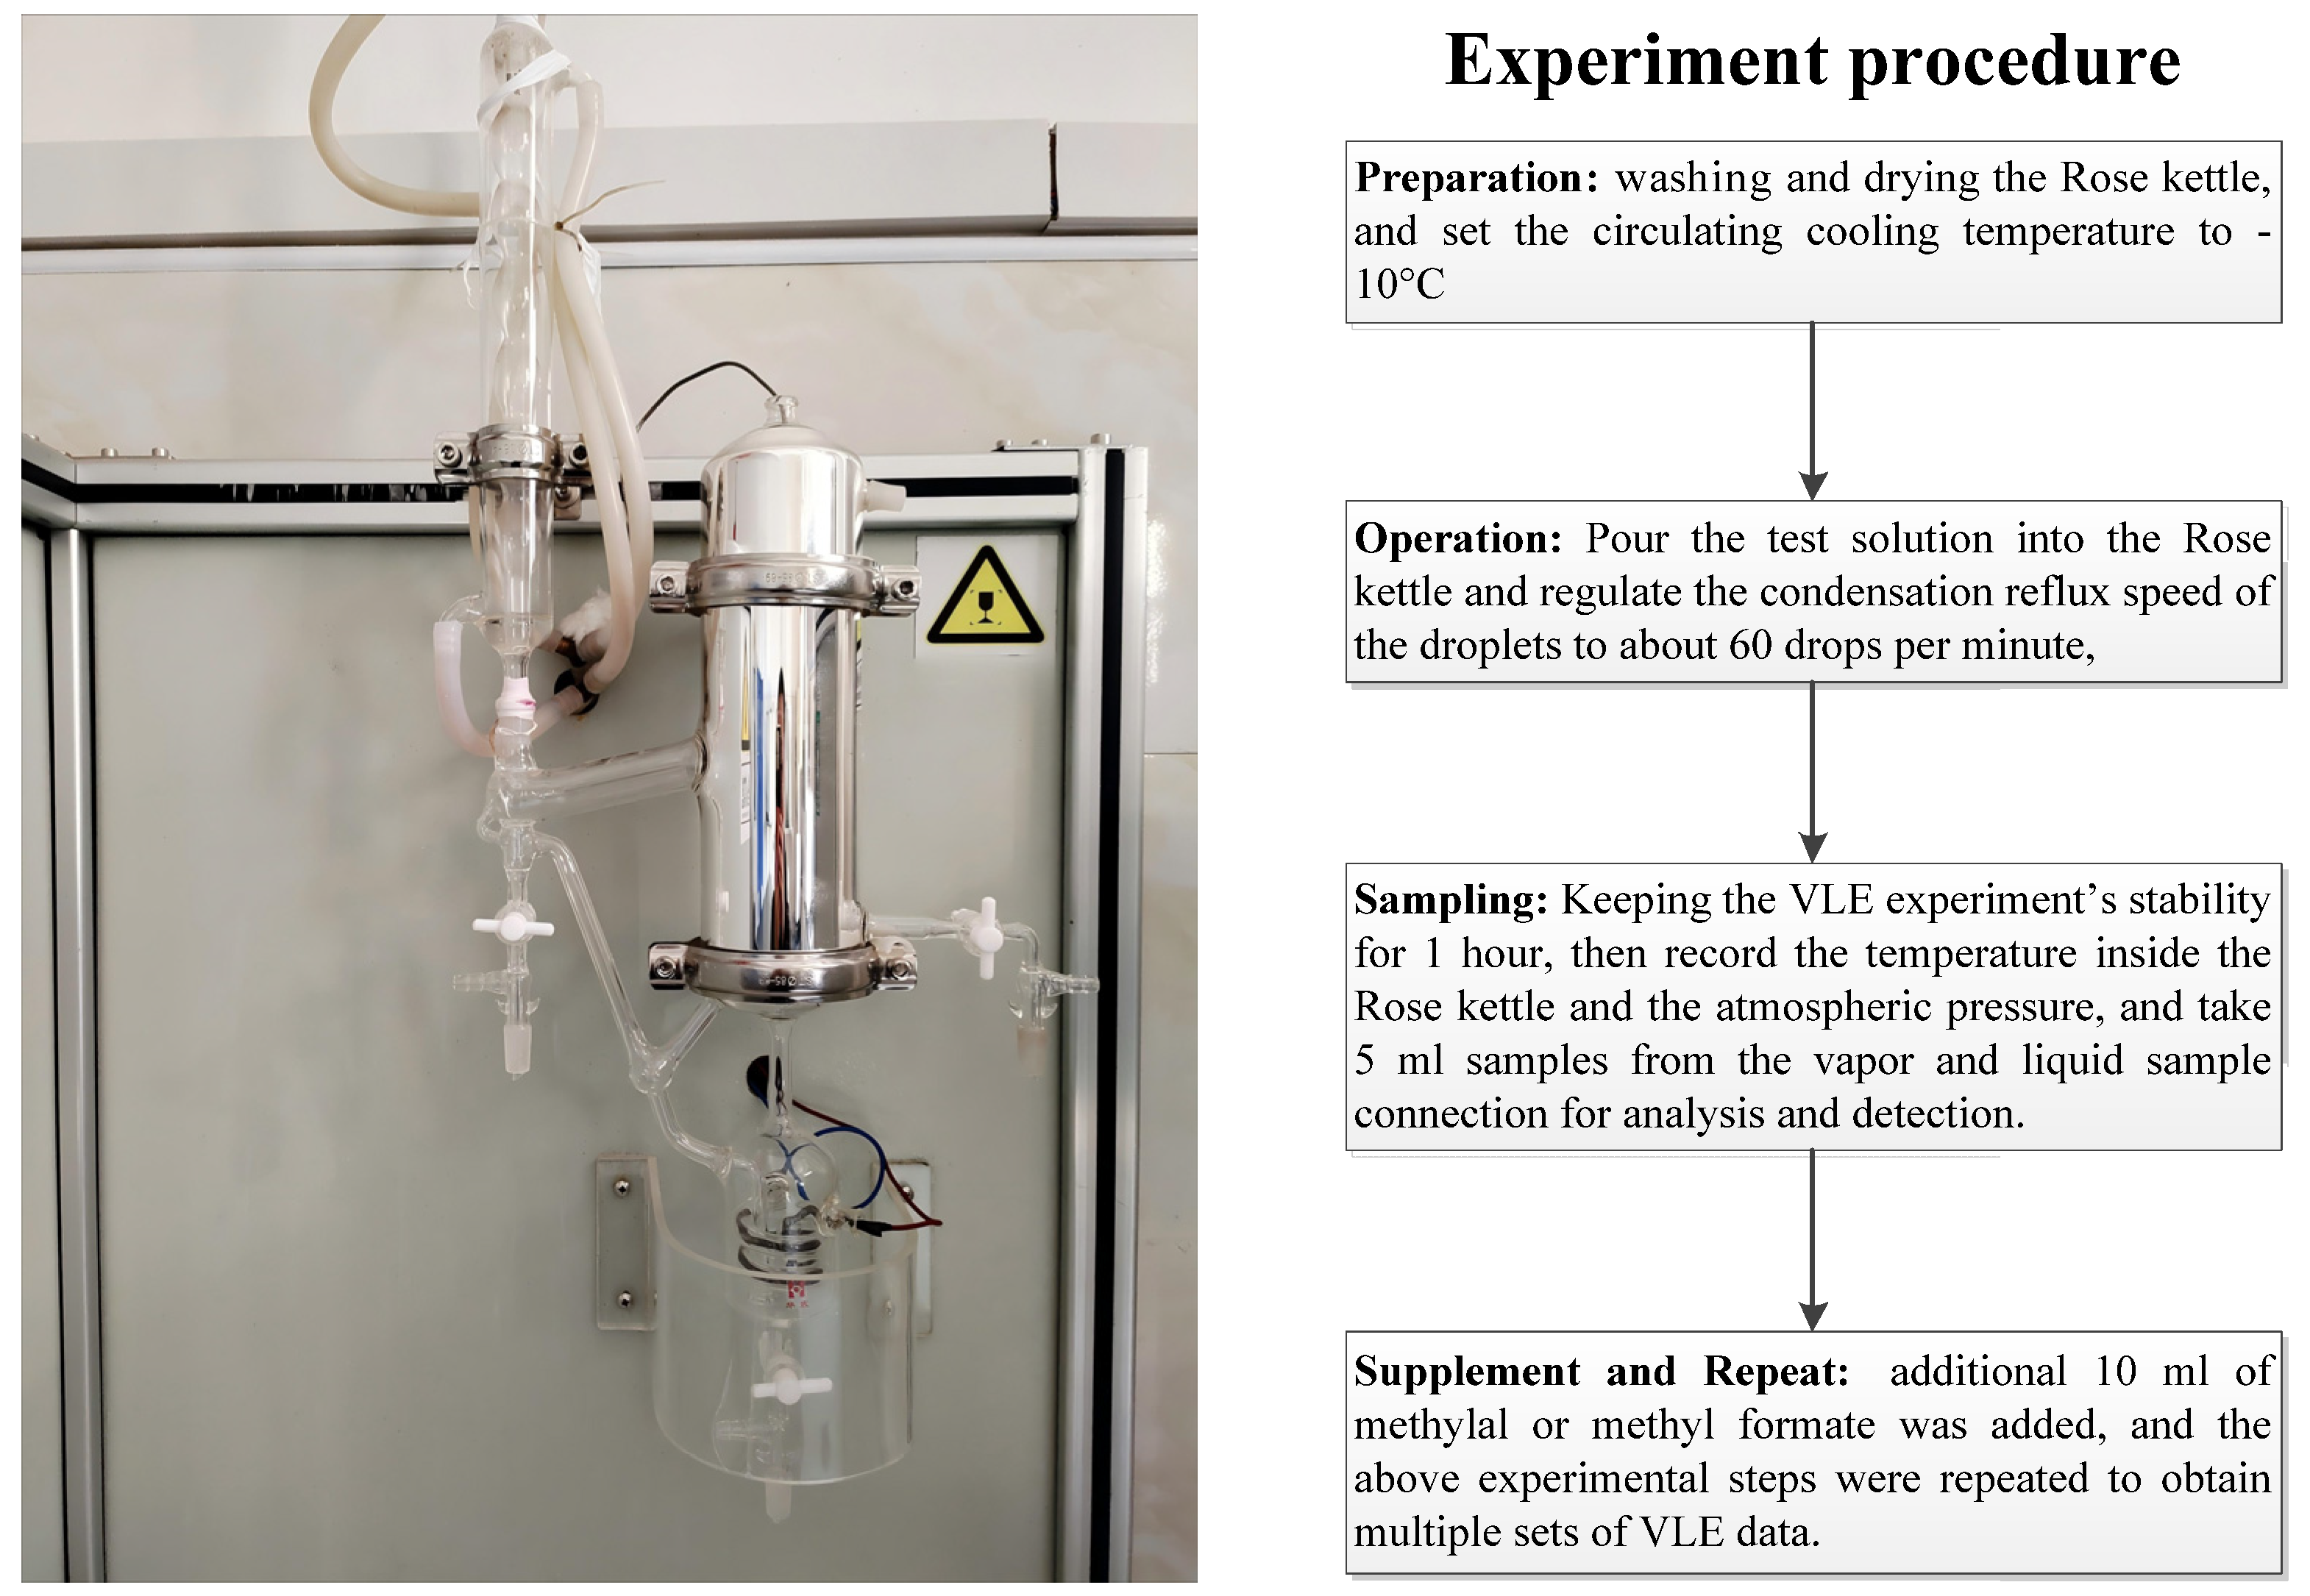
Methyl formate (GC, ≥99 wt%) and n-propanol (ACS, ≥99.5 wt%) were purchased from Beijing Bailingwei Technology Co., Ltd. (Beijing, China), methylal (GC, ≥99 wt%) was obtained from Shanghai Aladdin Biochemical Technology Co., Ltd. (Shanghai, China), methanol (GC, ≥99.9 wt%) was afforded by Tianjin Biaoshiqi Technology Co., Ltd. (Tianjin, China), and acetone (analytical reagent, 99.5 wt%) was purchased from Tianjin Fuyu Fine Chemical Company (Tianjin, China). The VLE data at atmospheric pressure were measured using a modified Rose’s equilibrium apparatus (Huabo Experimental Instrument Factory, Chuzhou city, China), where the equilibrium temperature was determined by a precision mercury thermometer with an accuracy of ±0.1 K. The quantitative analysis of methanol, methylal, and methyl formate in the vapor phase and liquid phase samples was performed on Agilent gas chromatography equipped with an HP-5 capillary Column (30 m × 0.320 mm × 0.25 um) and hydrogen ion flame detector, while n-propanol was chosen as the internal standard. The chromatographic conditions for the injector and detector were 260 °C. The temperature programmed was as follows: initial oven temperature was 120 °C and held for 4 min ramped at 25 °C/min to 260 °C.

2.2. Procedure

The improved Rose kettle was employed to the VLE experiment, and its pressure tightness was checked. The stability and reliability of the apparatus was verified by comparing the measured VLE data of the methanol–acetone binary system with the literature data [23]. The vapor–liquid phase double circulation method was used to determine the VLE experiment data, and the specific experimental procedure was similar to those described by Xu Dongmei et al. [24,25,26]. The specific experimental procedure and apparatus were shown in Figure 1.

3. Modeling

Methanol was a polar molecule, whereas methyl formate and methylal were weakly polar molecules. The intermolecular interactions had a significant impact on the properties of these liquid multi-component systems. To precisely describe the behavior of such systems, the local composition model [27,28] was regarded as a more effective approach. Therefore, this study selects the activity coefficient models of Wilson, NRTL, and UNIQUAC activity coefficient models to correlate and regress the VLE experimental data.

3.1. Wilson Model

The Wilson [29] equation was suitable for polar and associating systems, with the following expression:
ln γ i = 1 ln j = 1 N x j Λ i j k = 1 N x k Λ k i j = 1 N x j Λ k j
ln Λ i j = a i j + b i j T

3.2. NRTL Model

The NRTL model was a semi-empirical equation based on the concept of local composition, performed to liquid phase systems that exhibit both partial and complete miscibility. In 1968, Renon [30] introduced a third parameter, with the equation’s specific expression detailed as follows:
ln γ i = j = 1 N c τ j i G j i x j k = 1 N c G k i x k + j = 1 N c G j i x j k = 1 N c G k j x k τ i j i = 1 N c τ i j G i j x j k = 1 N c G k j x k
G i j = exp α i j τ i j
τ i j = a i j + b i j T ,   α i j = 0.2 ~ 0.47 ;
The third parameter was a characteristic parameter of the solution, which depends on the type of solution, and with a value range of 0.20–0.47. Non-polar liquids, non-polar liquids with non-associated polar components, and slight deviations from the ideal system the value was taken as 0.3. In this case, the value of aij was set to 0.3.

3.3. UNIQUAC Model

The UNIQUAC equation was proposed by Abrams et al. in 1975 [31]. It comprises merely two adjustable parameters, and these parameters exhibit low temperature sensitivity, rendering it suitable for narrow temperature ranges. The UNIQUAC equation was expression as follows:
ln γ i = ln φ i x i + z 2 q i ln θ i φ i + l i φ i x i j x j l j q i ln j θ j τ j i + q i q i j θ j τ i j k θ k τ k j
l i = z 2 r i q i r i 1
φ i = x i r i j x j r j
θ i = x i q i j x j q j
τ i j = exp a i j + b i j T

4. Results and Discussion

4.1. Measurement and Correlation of VLE Data for the Ternary System

The experimental data for the ternary system of methanol–methyl formate–methylal at atmospheric pressure were shown in the Supplemented Material of Table S1. The binary interaction parameters for the NRTL, UNIQUAC, and Wilson activity coefficient models correlated with the experimental data of this ternary system were regressed and shown in Table 1. The root mean square deviations (RMSD) between the experimental and simulated values for the ternary system at atmospheric pressure are given in Table 2. The results in Table 2 indicate that RMSD (y1), RMSD (y2), RMSD (y3), and RMSD (P) were all less than 0.01, and RMSD (T) was below 0.5, which demonstrated that the NRTL, UNIQUAC, and Wilson activity coefficient models and their associated parameters can all meet the requirements for simulating the VLE process of the methanol–methyl formate–methylal ternary system. Additionally, as can be seen from Table 2, the RMSD of the three activity coefficient models adhere to the sequence: UNIQUAC model ≈ NRTL model < Wilson model, indicating that the UNIQUAC and NRTL models and their associated parameters are more suitable for simulating the VLE process of this system than the Wilson model.

4.2. The Analysis of the Residual Curve Phase Diagram for POM Organic Waste Liquid

The POM organic waste liquid originated from the separation and purification process of the POM monomer and was primarily composed of methanol, methylal, methyl formate, and formic acid. Taking the POM organic waste liquid from a domestic enterprise as an example, its composition and their physical properties were shown in Table 3. It can be seen that the three components with higher content in the waste liquid were methyl formate, methylal, and methanol, among which methyl formate accounted for up to 76.46 wt% in the POM waste liquid.
To clearly illustrate the separation process, a ternary phase diagram of the methanol–methyl formate–methylal system was constructed based on the feed composition of POM waste liquid. Owing to the absence of average area and volume parameters for 1,3-dioxolane in the UNIQUAC model, the NRTL activity coefficient model and its associated parameters were chosen for the process simulation. The ternary system residue curve map was shown in Figure 2, from which it can be seen that methylal and methanol had a binary azeotropic point with an azeotropic temperature of 41.7 °C under atmospheric pressure. Moreover, the distillation boundary line formed by this azeotropic point divides the triangular phase diagram into two distillation regions, Zone 1 and Zone 2. From the data on POM waste composition in Table 3, it was known that the feed point is located in Zone 2, and the material balance line formed by the feed point and the methanol vertex cannot cross the distillation boundary, which illustrated that high-purity methylal production cannot be obtained by simple distillation methods. In addition, the formation of a binary azeotrope between methylal and methanol, the small boiling point differences between methyl formate and methylal, and methanol and dioxolane, had a significantly negatively effect on the separation and purification of methylal and methanol. Thus, POM waste liquid was preferably treated with distillation to recover methyl formate, while the residual waste liquid can then be subjected to extractive distillation to separate methanol and methylal, or it may be directly used as an organic fuel.

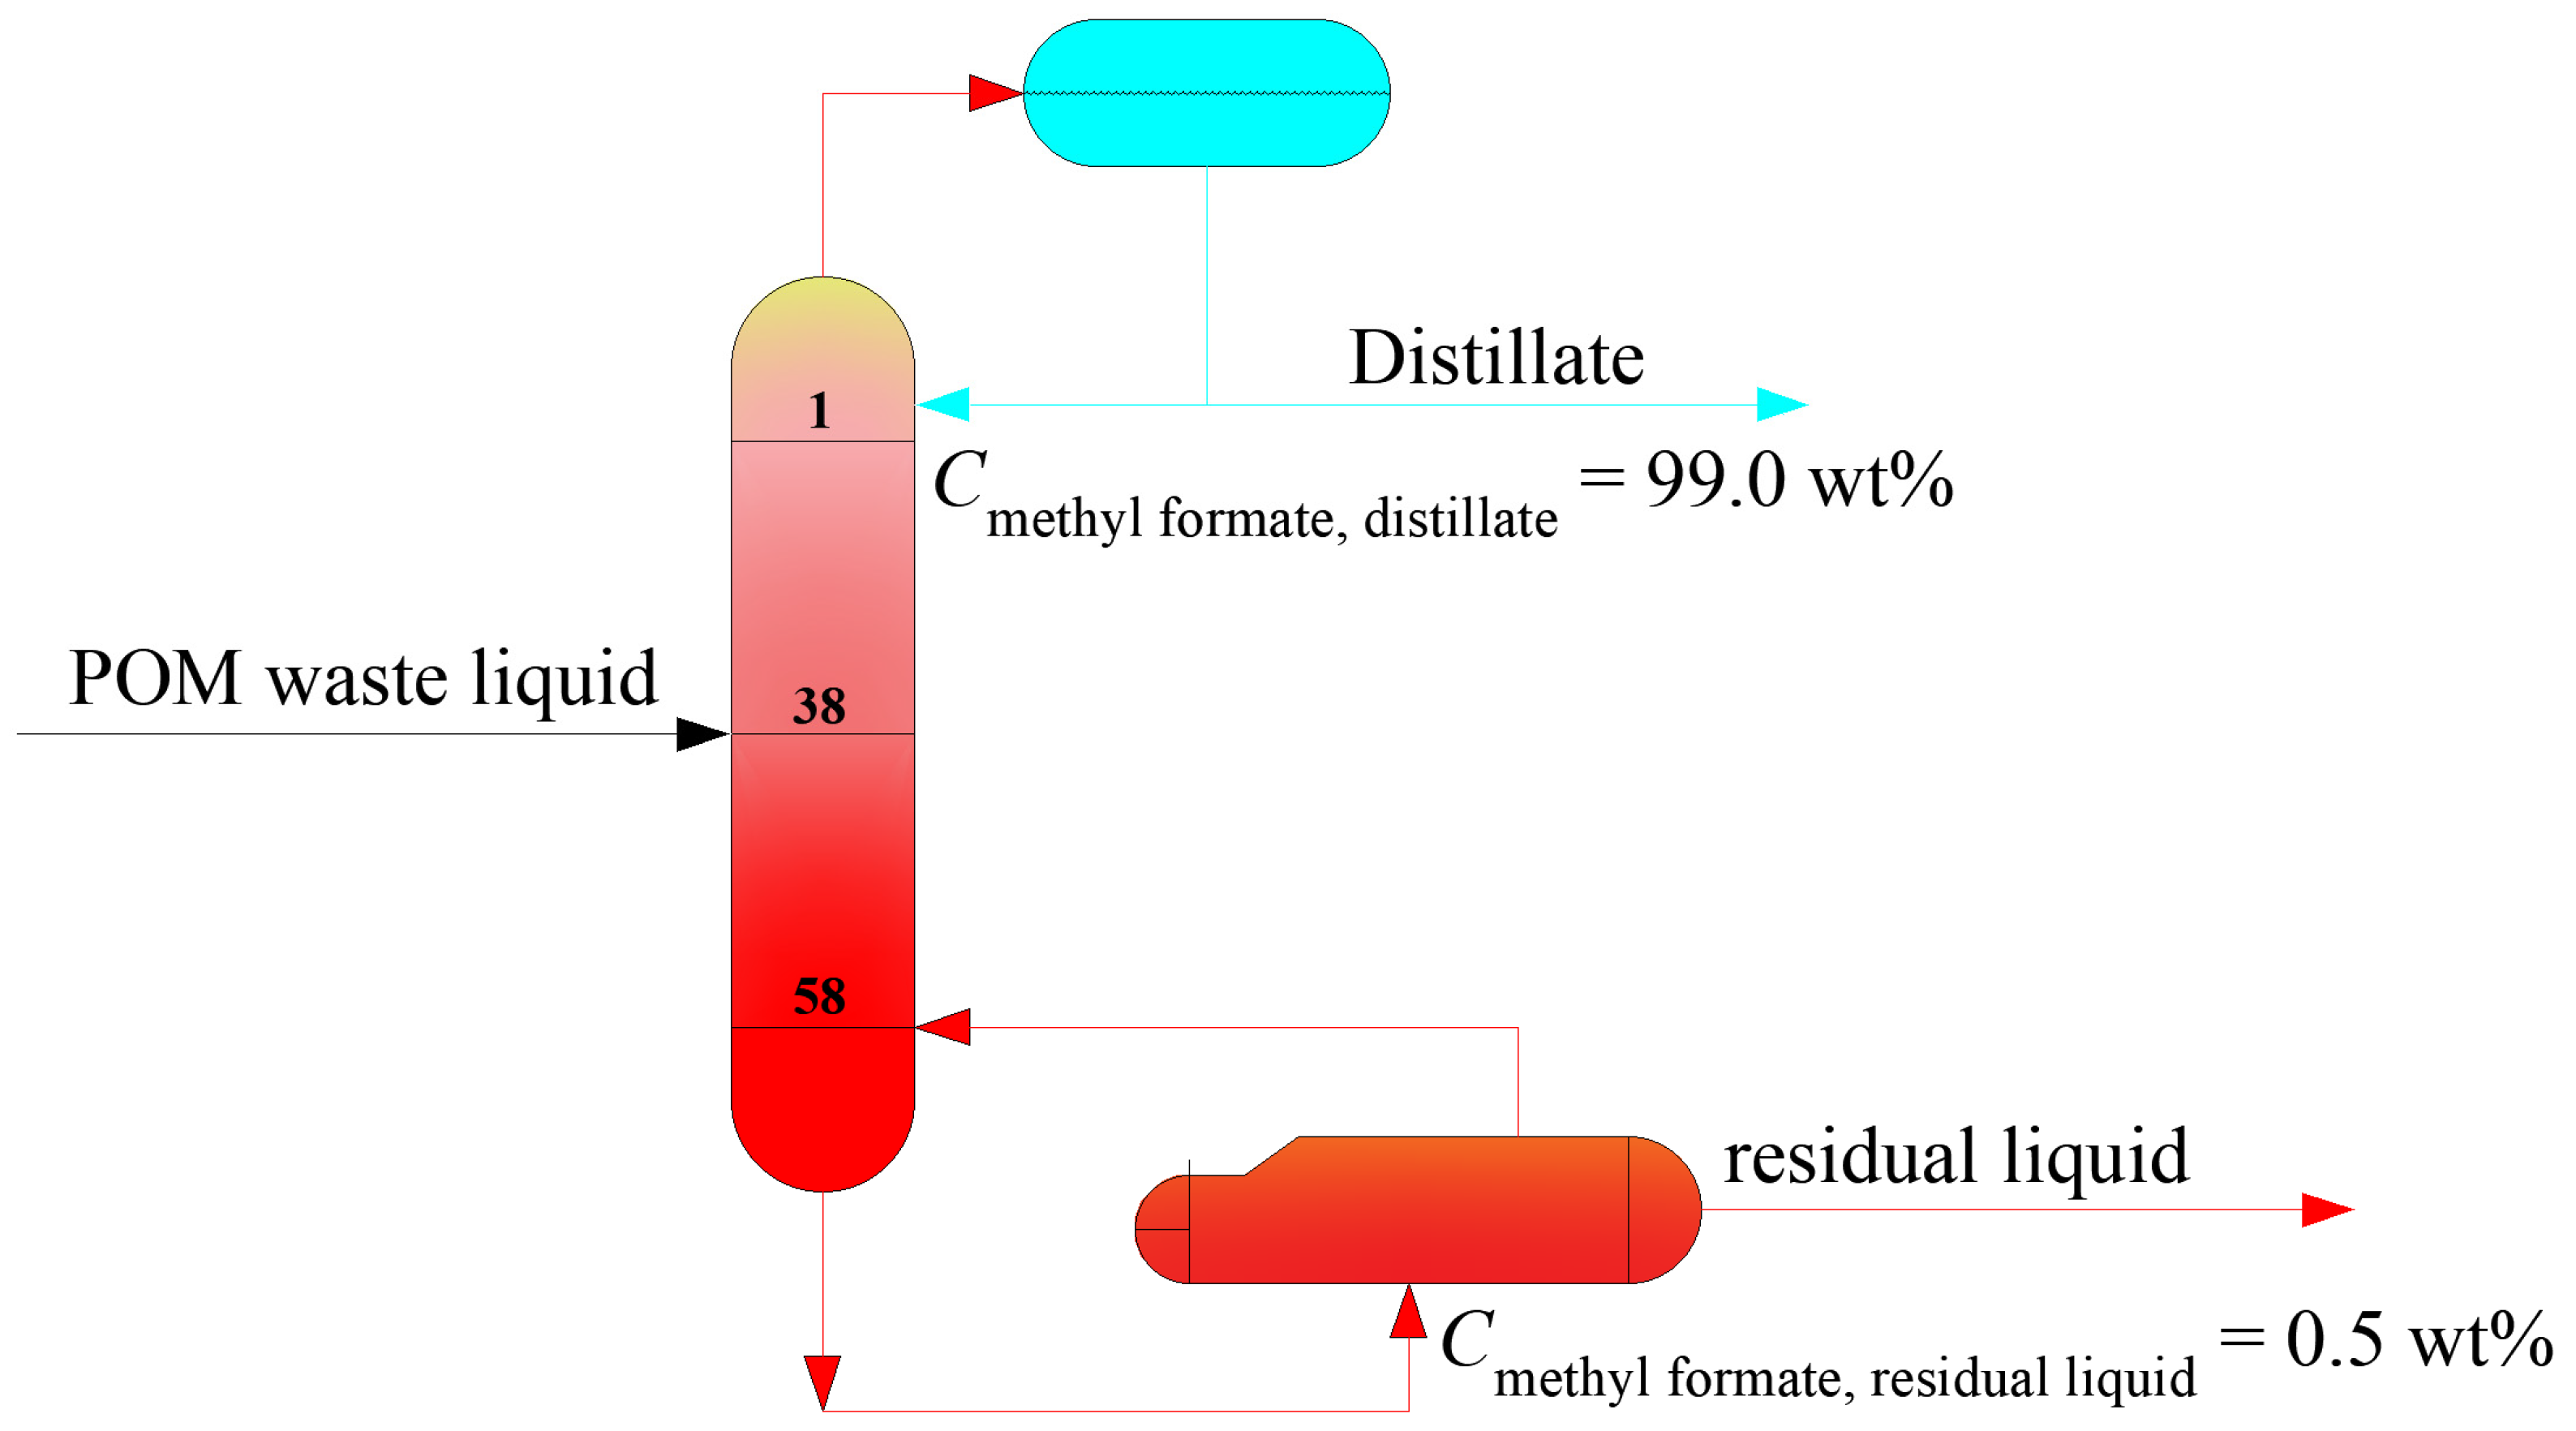
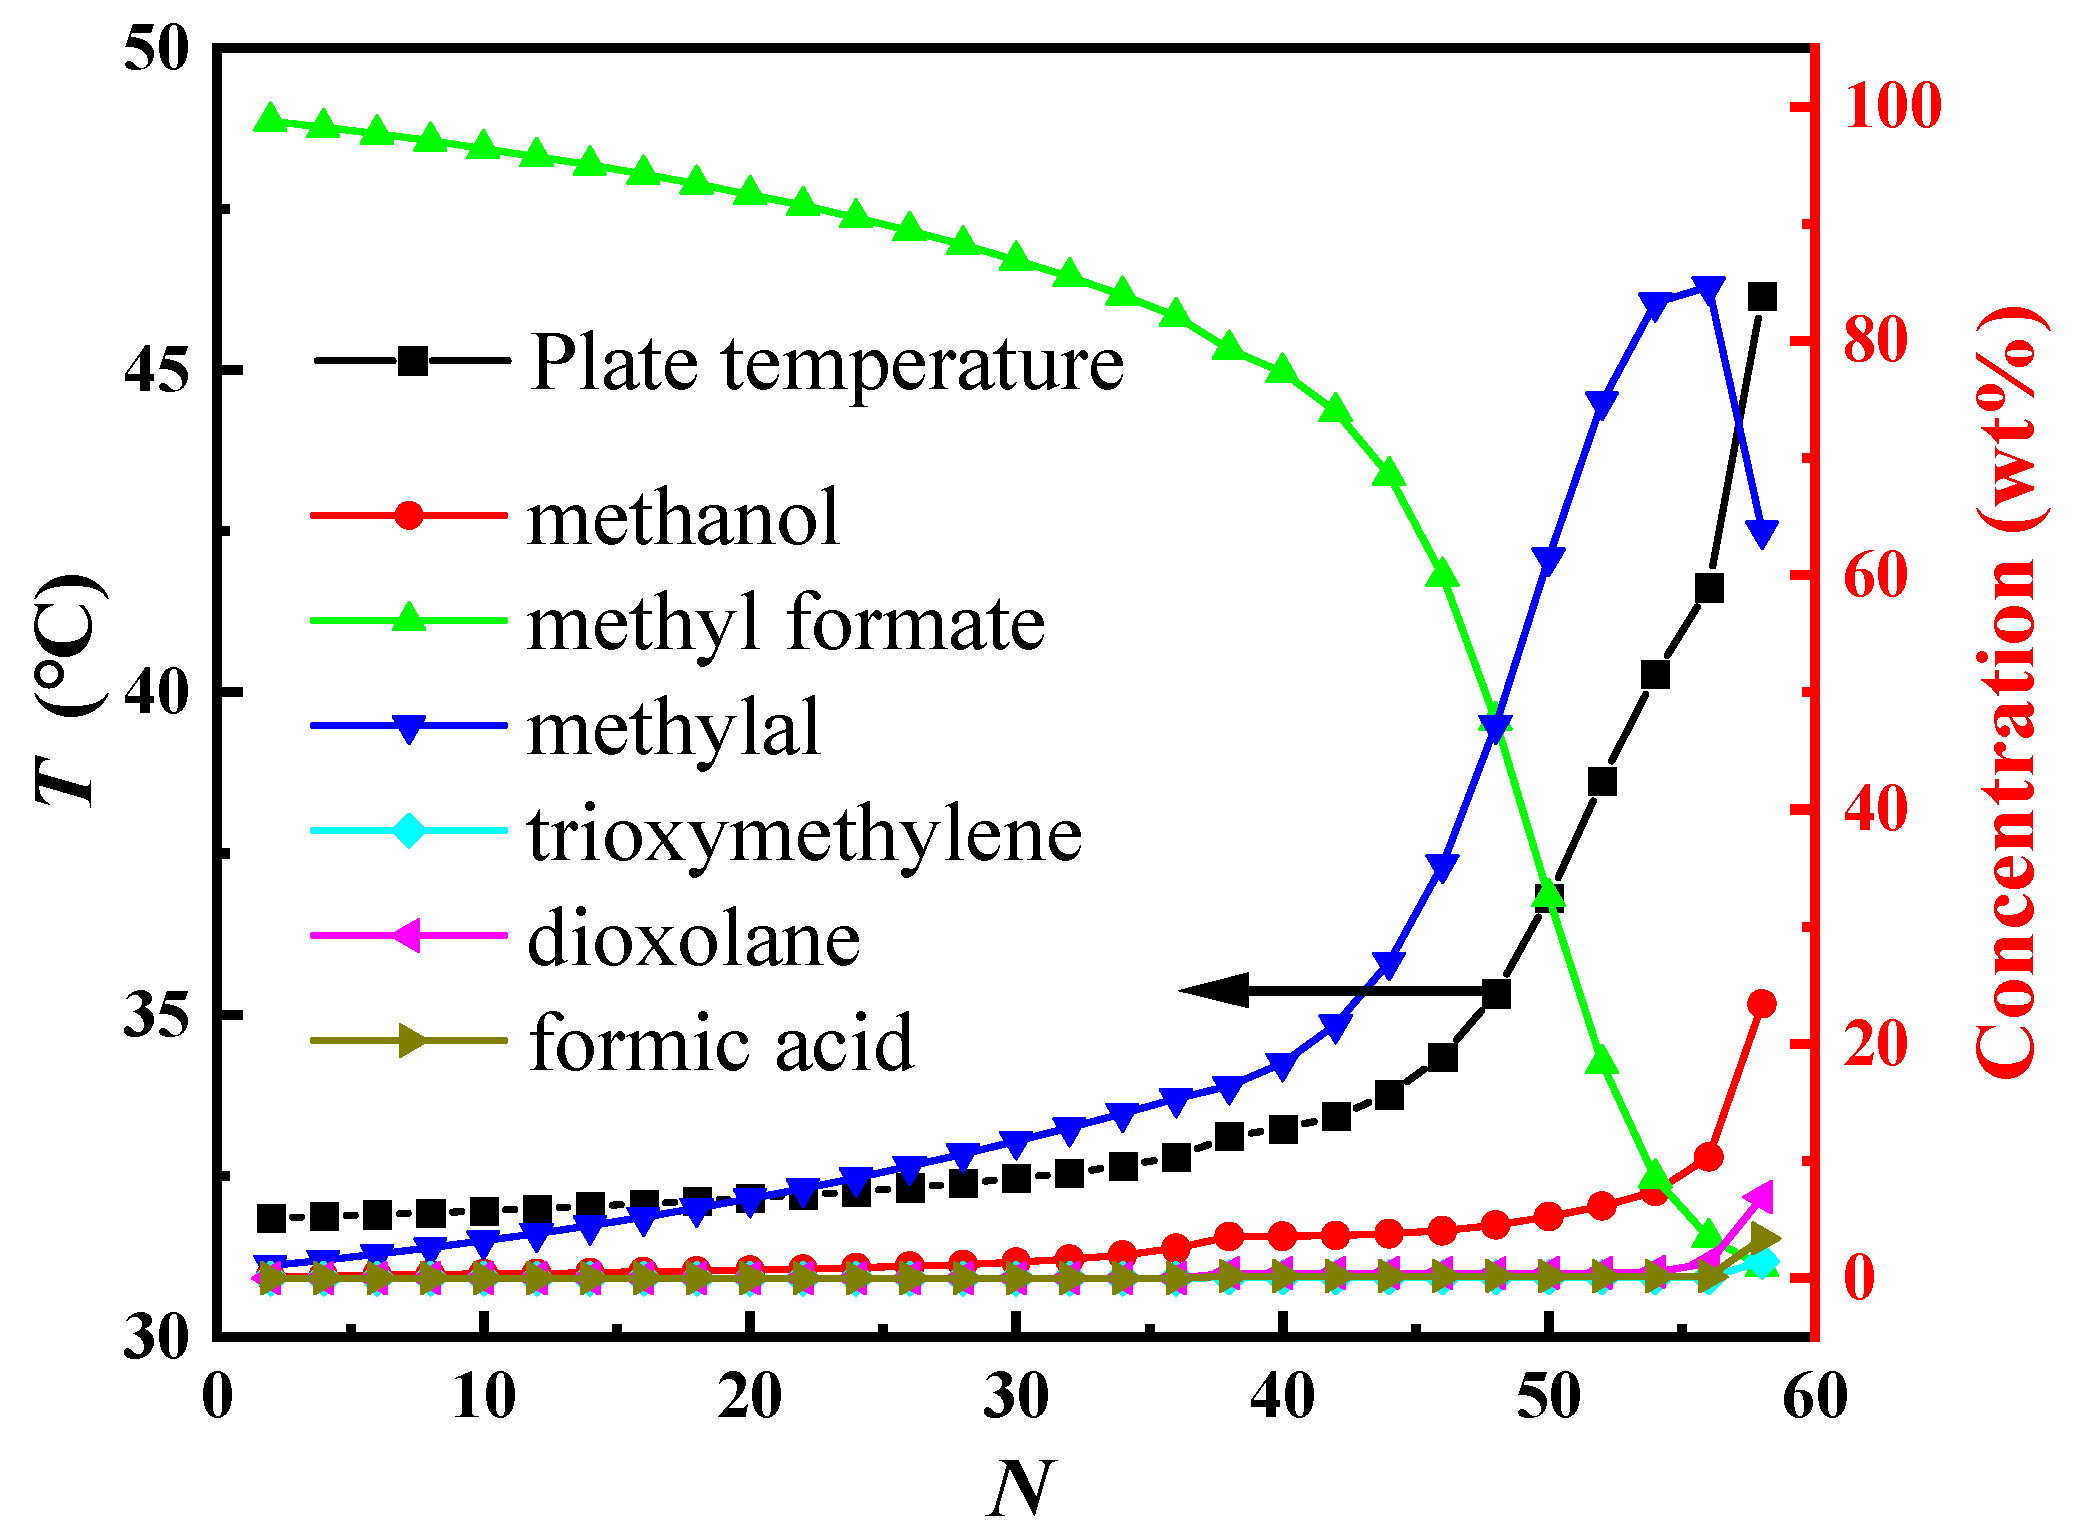
4.3. The Optimization for Methyl Formate Separation Process

According to the analysis results of the residual curve phase diagram, it was evident that methyl formate present in the polyformaldehyde waste liquid can be effectively separated and purified using a distillation column. As a result, industrial grade methyl formate can be obtained from the top of the distillation column with a purity beyond 99.0 wt%. The unit operation process was shown in Figure 3, in which there were four variables, including the total number of theoretical plates (Ns), the number of feed plates (Nf), the mass ratio of distillate to feed stream (DF), and the reflux ratio (RR). To achieve an industrial-grade methyl formate product, the Aspen Plus V14 software employs a stringent distillation module, utilizing the RR as a control variable.
The optimization of process variable were primarily focused on minimizing the energy consumption per unit of product (Q) and maximizing energy efficiency (η) under the design specification of Cmethyl formate, distillate = 99.0 wt% and Cmethyl formate, residual liquid = 0.05 wt%. The optimization sequence following the order of sensitivity from low to high for Q. The formulas for calculating Q and η were as follows:
Q = Q reb × 1000 V distillate
η = Q cond Q reb × 100 %
The variable optimization results of the methyl formate distillation column were shown in Figure 4; it can be seen from Figure 4A that as the number of Ns gradually increased from 26 to 80, the RR and Q of the distillation column show a significant decreasing trend and then tend to stabilize. After Ns > 50, the RR and Q gradually stabilize and reach an optimal values. This was mainly because that with the increase of NS, both the rectifying and stripping section of the distillation column were lengthened, which was beneficial for the separation of methyl formate from the POM waste liquid. Therefore, we preferentially select a theoretical number of 58 plates. The optimization result of Nf was shown in Figure 4B, with Nf gradually increasing from 6 to 56, and the RR and Q exhibit a parabolic trend, initially decreasing and subsequently increasing. Therefore, there was an optimal value, Nf = 38, which can minimize RR and Q. The effects of DF and RR on the methyl formate distillation process were shown in Figure 4C,D; it can be seen that as DF gradually increases from 0.11 to 0.77, and the recovery yield of methyl formate (Ymethyl formate) from POM waste liquid exhibits a linear increasing trend, rising from 14.2% to 99.7%. Meanwhile, the η of the distillation column shows a trend of gradually rising from 95.0% to 98.1% firstly, and then decreasing from 98.1% to 97.5%. Although the decrease in η undoubtedly leads to an increase in utility costs, given the high value-added production of methyl formate, choosing a larger DF was economical. Furthermore, with the gradual increase in DF, the concentration of methyl formate in the residual liquid (Cmethyl formate) exhibits a curvilinear decrease. As we all know, the less methyl formate remaining in the residual liquid, the more favorable it will be for the further separation of the remaining components in the residual liquid. However, under the design specification of Cspec = 99.0 wt%, DF = 0.77 was the maximum value required to achieve the separation goal, at which point, the concentration of methyl formate in the residual liquid was 1.0%. In summary, the optimal parameters in distillation column were Ns = 58, Nf = 38, DF = 0.77, and RR = 4.56. Under these conditions, the Q = 0.63 Gcal/t, Ymethyl formate = 99.7%, Cmethyl formate = 0.05 wt%, and η = 97.5%.
The temperature distribution and component concentration profile on the trays of the distillation column were shown in Figure 5. The results indicated that the temperature distribution range within the column was between 31.8 and 46.1 °C. Due to the low boiling point of methylal and the binary azeotrope formed between methanol and methylal, the concentration of methylal in the liquid phase on plates 56 to 58 shows a continuous decreasing trend, which had a certain negative impact on the separation of methyl formate.

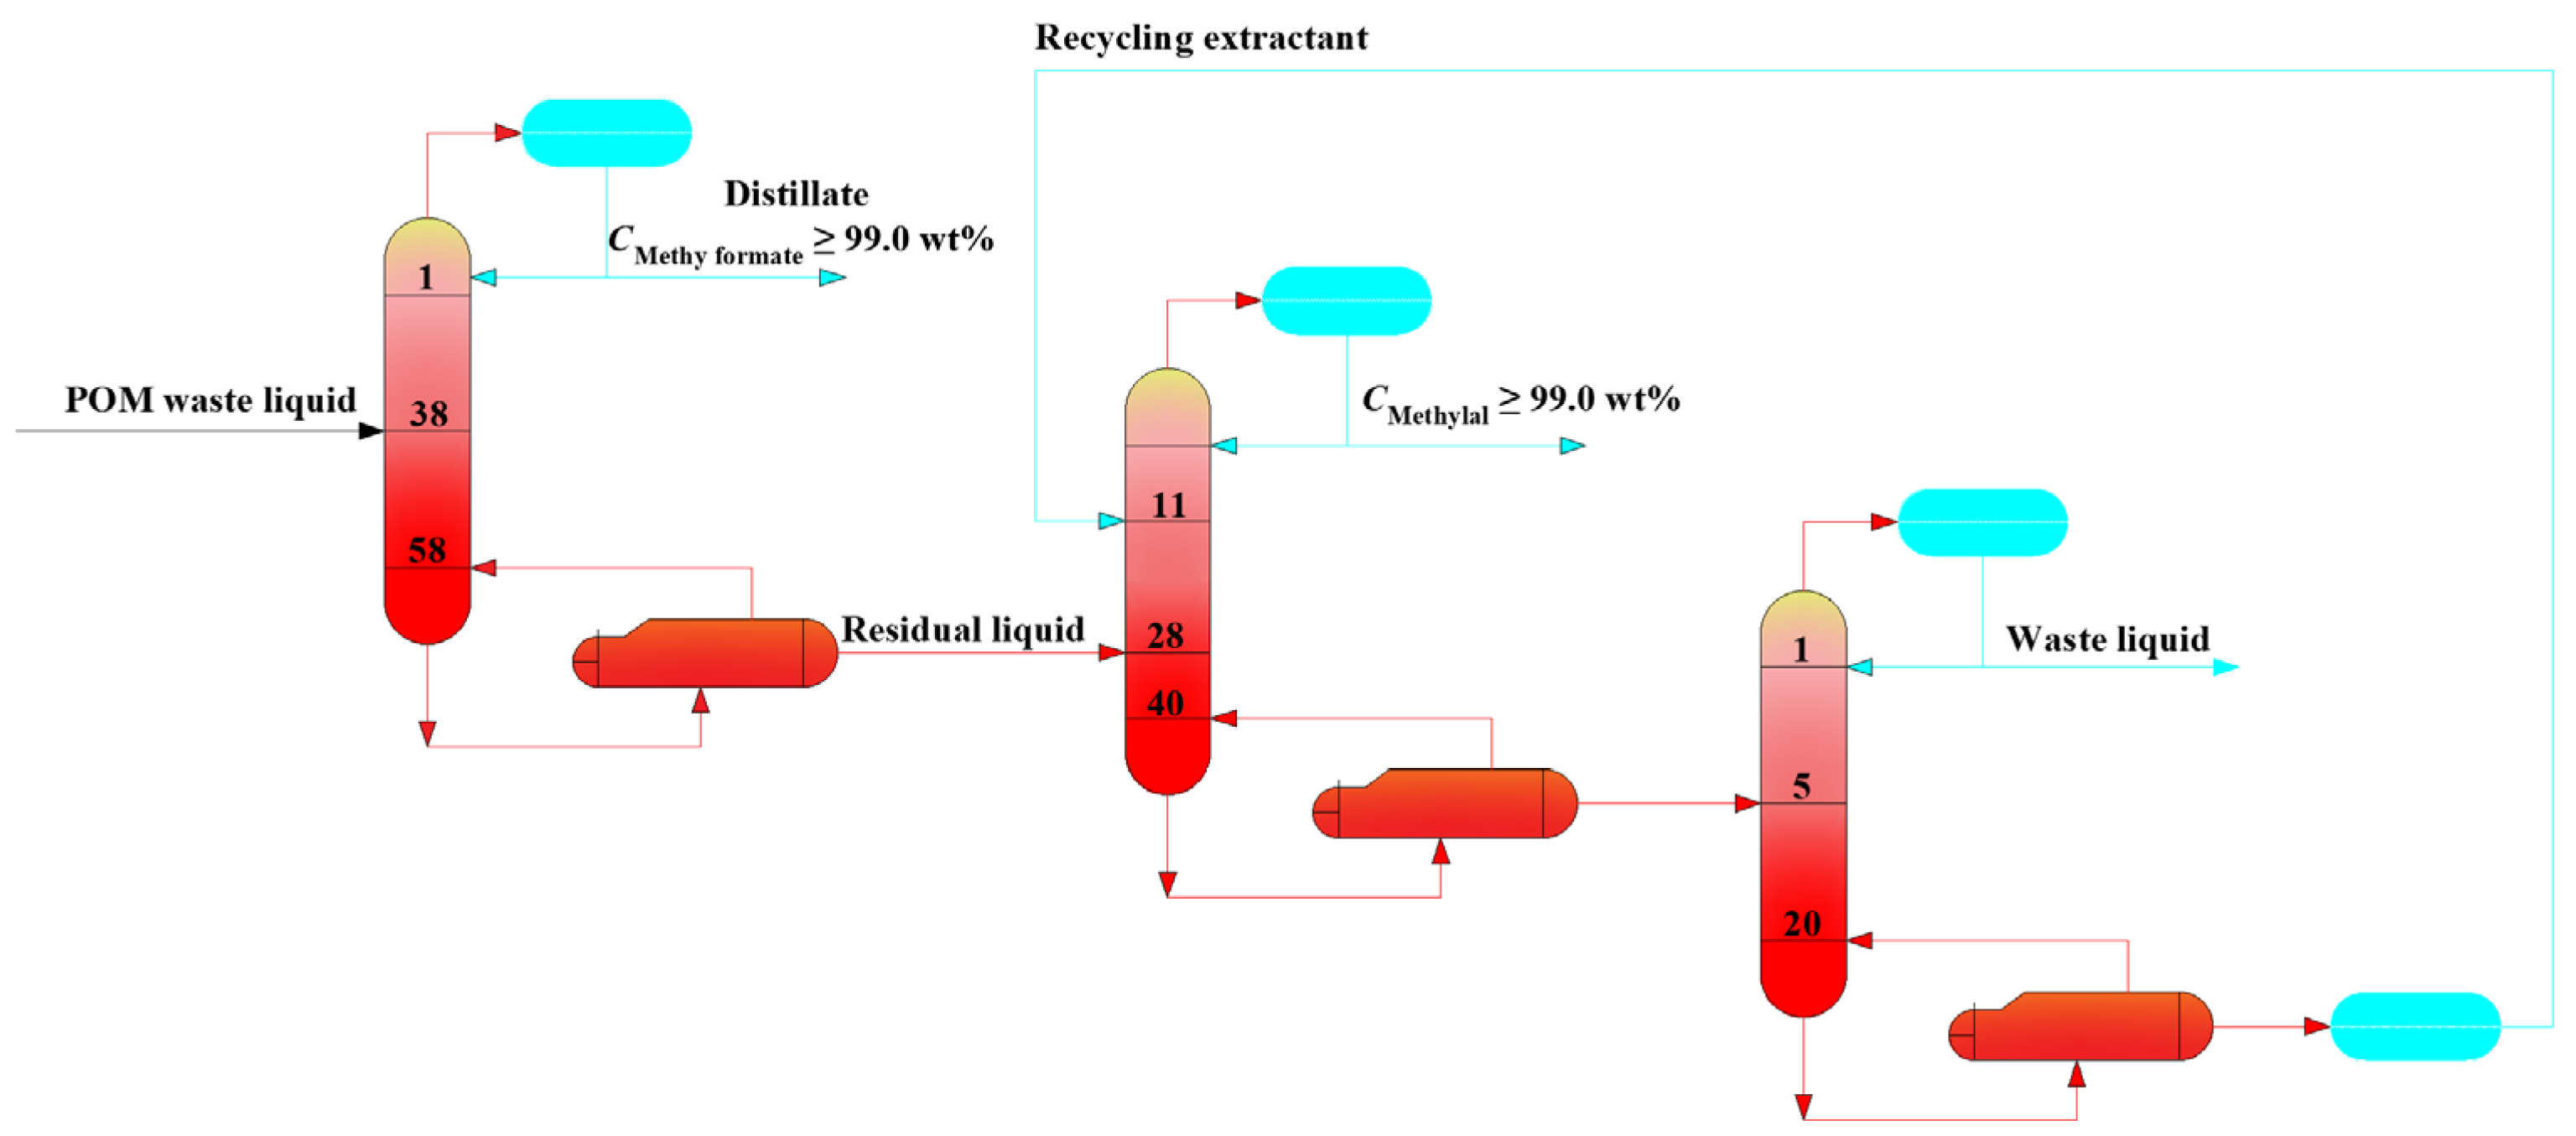
4.4. The Techno-Economic Comparison of Various Design Flowsheet for POM Waste Liquid

In addition to the direct distillation recovery process technology for methyl formate, further separation and purification of methanol and methylal can be achieved using extractive distillation technology after the separation and recovery of methyl formate. Lei Zhigang et al. demonstrated the formation of strong hydrogen bonds between ethylene glycol and methanol, which can increase the relative volatility of methylal to methanol, and they proved that the UNIFAC model can accurately predict the VLE of the methanol–methylal–ethylene glycol ternary system [32]. Therefore, we use ethylene glycol as an extractant for the separation of methanol and methylal in the residual liquid of the methyl formate distillation column, and the multi-component separation and recovery process was shown in Figure 6.
The simulation optimization results of the direct distillation process (Case 1), which only recovers methyl formate, and the multi-component recovery process (Case 2) were shown in Table 4. The results in Table 4 suggested that only considering the energy consumption and outputs, the case 2 was superior to case 1. Nevertheless, the design process of case 2 was more intricate, with two additional distillation columns, which will lead to a significantly increase in equipment costs and operational challenges during production.

5. Conclusions

The VLE data for the methanol–methyl formate–methylal ternary system was measured under atmospheric pressure using an improved ROSE dual-cycle kettle, and the experimental data were correlated to NRTL, Wilson, and UNIQUAC activity coefficient models to regress the binary interaction parameters. The RMSD of the experimental value and simulation value was used to evaluate the prediction errors of the correlation models, and it was found that the RMSD of the correlation models followed the order UNIQUAC ≈ NRTL < Wilson, which indicated that the NRTL model and UNIQUAC model were more suitable for this VLE system. Furthermore, the NRTL model and its binary interaction parameters were utilized to simulate the separation process of POM waste liquid. The simulation results showed that the production of methyl formate with a purity of ≥99 wt% could be obtained by simple distillation. Under the optimal conditions, the Ymethy formate of the POM waste liquid could reach 99.7%. Additionally, using ethylene glycol as an extractant can separate methylal from the residual waste liquid by extraction distillation, yielding a methylal product with a purity higher than 99 wt%. Although multi-component separation processes can increase the added value of POM waste liquid products, the increase in the number of equipment and the extension of the process flow will also have certain negative impacts on production and investment.

Supplementary Materials

The following supporting information can be downloaded at: https://www.mdpi.com/article/10.3390/separations12010012/s1, Table S1: The VLE data for methanol (1)—methyl formate (2)—methylal (3) at atmospheric pressure.

Author Contributions

Conceptualization, Y.L. and H.L.; methodology, Y.L.; software, Y.L., H.L. and Q.A.; validation, J.F. and Y.L.; formal analysis, W.L.; investigation, W.L. and J.F.; resources, Y.L., H.L. and Q.A.; data curation, W.L. and J.F.; writing—original draft preparation, H.L. and W.L.; writing—review and editing, Y.L.; visualization, W.L. and J.F.; supervision, Y.W.; project administration, Y.L. and Y.W.; funding acquisition, Y.W. All authors have read and agreed to the published version of the manuscript.

Funding

This research was funded by the Hu Xiang High-Level Talent Aggregation Project, grant number 2024RC4011.

Data Availability Statement

Data are contained within the article.

Conflicts of Interest

The authors declare no conflicts of interest.

Abbreviations

The following abbreviations are used in this manuscript:
VLEVapor–liquid equilibrium
RMSDRoot mean square deviation
POMPolyformaldehyde
TOXTrioxane
RRReflux ratio
DFDistillate to feed ratio
γActivity coefficient
TTemperature
CConcentration
YYield
QThe energy consumption of reboiler
ηEnergy efficiency
NsThe total number of theoretical numbers
NfThe number of feed plates
GGibbs free energy
θAverage area fraction
φVolume fraction
RVolume parameter
qSurface parameter
ZLattice coordination number
uInteraction energy

References

  1. Zhang, H.; Yang, X.; Gao, G.; Yan, J.; Zhao, M.; Su, H. An efficient catalyst of CuPt/TiO2 for photocatalytic direct dehydrogenation of methanol to methyl formate at ambient temperature. Catal. Sci. Technol. 2022, 12, 773–785. [Google Scholar] [CrossRef]
  2. Nikzad, A.; Iranshahi, D. Analysis of integrated system for ammonia synthesis and methyl formate production in the thermally coupled reactor. Chem. Eng. Process. 2021, 166, 108418. [Google Scholar] [CrossRef]
  3. Wang, N.; Quan, Y.; Zhao, J.; Li, H.; Ren, J. Highly active CuZn/SBA-15 catalyst for methanol dehydrogenation to methyl formate: Influence of ZnO promoter. Mol. Catal. 2021, 505, 111514. [Google Scholar] [CrossRef]
  4. Rong, L.; Xu, Z.; Sun, J.; Guo, G. New methyl formate synthesis method: Coal to methyl formate. J. Energy Chem. 2018, 27, 238–242. [Google Scholar] [CrossRef]
  5. Pei, X.; Li, H.; Zhang, Z.; Meng, Y.; Li, X.; Gao, X. Process intensification for energy efficient reactive distillation of trioxane production from aqueous formaldehyde. Chem. Eng. Process. 2022, 175, 108914. [Google Scholar] [CrossRef]
  6. Han, Z.; Ren, Y.; Li, H.; Li, X.; Gao, X. Simultaneous Extractive and Azeotropic Distillation Separation Process for Production of PODEn from Formaldehyde and Methylal. Ind. Eng. Chem. Res. 2019, 58, 5252–5260. [Google Scholar] [CrossRef]
  7. Qi, J.; Hu, Y.; Ma, W.; Wang, H.; Jiang, S.; Yin, L.; Zhang, X.; Yang, Z.; Wang, Y. The reactions that determine the yield and selectivity of 1,3,5-trioxane. Chem. Eng. J. 2018, 331, 311–316. [Google Scholar] [CrossRef]
  8. Grützner, T.; Hasse, H.; Lang, N.; Siegert, M.; Ströfer, E. Development of a new industrial process for trioxane production. Chem. Eng. Sci. 2007, 62, 5613–5620. [Google Scholar] [CrossRef]
  9. Walker, J. Formaldehyde, 2nd ed.; Reinhold Publishing Corporation: New York, NY, USA, 1953; pp. 45–52. [Google Scholar]
  10. Yu, Z.; Zeng, Y.; Li, X.; Sun, H.; Li, L.; He, W.; Chen, P.; Yu, X. Solid–Liquid Phase Equilibria of the Aqueous Quaternary System Rb+, Cs+, Mg2+//SO42−—H2O at T = 323.2 K. Separations 2024, 11, 309. [Google Scholar] [CrossRef]
  11. Yang, C.; Lin, X.F.; Zhang, J.F.; Chen, H.; Xiao, Y.; Wang, H.; Cheng, L.; Ouyang, X. Measurement and correlation of liquid-liquid equilibrium data for n-hexane isopropanol azeotropic system. CIESC J. 2020, 71, 3009–3017. [Google Scholar]
  12. Chen, X.C.; Yang, B.; Abdeltawab, A.A.; Al-Deyab, S.S.; Yu, G.; Yong, X. Isobaric Vapor-Liquid Equilibrium for Acetone + Methanol + Phosphate Ionic Liquids. J. Chem. Eng. Data 2015, 60, 612–620. [Google Scholar] [CrossRef]
  13. Maurer, G. Vapor-liquid equilibrium of formaldehyde and water containing multicomponent mixtures. AIChE J. 1986, 32, 932–948. [Google Scholar] [CrossRef]
  14. Liu, Y.; Hasse, H.; Maurer, G. Enthalpy change on vaporization of aqueous and methanolic formaldehyde solutions. AIChE J. 1992, 38, 1693–1702. [Google Scholar] [CrossRef]
  15. Brandani, S.; Brandani, V.; Flammini, D. Isothermal vapor-liquid equilibria for the water—1,3,5-trioxane system. J. Chem. Eng. Data 1994, 39, 184–185. [Google Scholar] [CrossRef]
  16. Brandani, S.; Brandani, V. Isothermal vapor-liquid equilibria and solubility in the system methanol + 1,3,5-trioxane. J. Chem. Eng. Data 1994, 39, 203–204. [Google Scholar] [CrossRef]
  17. Brandani, V.; Brandani, S.; Giacomo, G. The system formaldehyde-water-methanol thermodynamics of solvated and associated solutions. Ind. Eng. Chem. Res. 1992, 7, 1792–1798. [Google Scholar] [CrossRef]
  18. Pohorecki, R.; Moniuk, W.; Machniewski, P. Calculations of the vapour-liquid phase equilibrium for the formaldehyde-water-trioxane system. Chem. Process Eng. 2008, 29, 3–12. [Google Scholar]
  19. Grutzner, T.; Hasse, H. Solubility of formaldehyde and trioxane in aqueous solutions. J. Chem. Eng. Data 2004, 49, 642–646. [Google Scholar] [CrossRef]
  20. Hasse, H.; Hahnenstein, I.; Maurer, G. Revised vapor-liquid equilibrium model for multi-component formaldehyde mixtures. AIChE J. 1990, 36, 1807–1814. [Google Scholar] [CrossRef]
  21. Hasse, H.; Maurer, G. Vapor-liquid equilibrium of formaldehyde containing mixtures at temperatures below 320 K. Fluid Phase Equilibria 1991, 64, 185–199. [Google Scholar] [CrossRef]
  22. Berje, J.; Baldamus, J.; Burger, J.; Hasse, H. Vapor-liquid equilibrium of mixtures containing formaldehyde, water, and butynediol. Fluid Phase Equilibria 2019, 490, 101–106. [Google Scholar] [CrossRef]
  23. Wilsak, R.; Campbell, S.; Thodos, G. Vapor-liquid equilibrium measurements for the methanol-acetone system at 372.8, 397.7 and 422.6 K. Fluid Phase Equilibria 1986, 28, 13–37. [Google Scholar] [CrossRef]
  24. Zhang, Y.; Liu, K.; Wang, Z.; Gao, J.; Zhang, L.; Xu, D.; Wang, Y. Vapour-liquid equilibrium and extractive distillation for separation of azeotrope isopropyl alcohol and diisopropyl ether. J. Chem. Thermodyn. 2019, 131, 294–302. [Google Scholar] [CrossRef]
  25. Soujanya, J.; Satyavathi, B.; Sankarshana, T. Isobaric ternary vapour-liquid equilibrium of methanol(1) + diisopropyl ether(2) + isopropyl alcohol(3) along with methanol + isopropyl alcohol binary data at atmospheric and sub-atmospheric pressures. Fluid Phase Equilibria 2015, 405, 31–36. [Google Scholar]
  26. Hála, E.; Pick, J.; Fried, V. Vapour-Liquid Equilibrium, 2nd ed.; Pergamon Oxford: Oxford, UK, 1967; pp. 34–40. [Google Scholar]
  27. Zafarani-Moattar, M.; Majdan-Cegincara, R. New local composition model for modeling of thermodynamic and transport properties of binary aqueous electrolyte solutions. Calphad 2011, 35, 109–132. [Google Scholar] [CrossRef]
  28. Sadeghi, R. New local composition model for polymer solutions. Polymer 2005, 46, 11517–11526. [Google Scholar] [CrossRef]
  29. Wilson, G. Vapor-Liquid Equilibrium. XI. A New Expression for the Excess Free Energy of Mixing. Am. Chem. Soc. 1964, 86, 127–130. [Google Scholar] [CrossRef]
  30. Renon, H.; Prausnitz, J. Local compositions in thermodynamic excess functions for liquid mixtures. AIChE J. 1968, 14, 135–144. [Google Scholar] [CrossRef]
  31. Abrams, D.; Prausnitz, J. Statistical Thermodynamics of Liquid Mixtures:A New Expression for the Excess Gibbs Energy of Partly or Completely Miscible Systems. AIChE J. 1975, 21, 116–128. [Google Scholar] [CrossRef]
  32. Dong, Y.; Dai, C.; Lei, Z. Extractive distillation of methylal/methanol mixture using ethylene glycol as entrainer. Fluid Phase Equilibria 2018, 462, 172–180. [Google Scholar] [CrossRef]
Figure 1. The VLE experimental apparatus and experimental procedures.
Separations 12 00012 g001
Figure 2. The residue curve map of the methanol–methyl formate–methylal ternary system at atmospheric pressure.
Separations 12 00012 g002
Figure 3. The design process for methyl formate separation in POM waste liquid.
Separations 12 00012 g003
Figure 4. The effect of technology parameter in the distillation process of methyl formate in POM waste liquid. (A) The effect of Ns changes on RR and Q. (B) The effect of Nf changes on RR and Q. (C) The effect of DF changes on Ymethyl formate and η. (D) The effect of DF changes on Cmethyl formate and RR.
Separations 12 00012 g004
Figure 5. The temperature distribution and concentration distribution curves of methyl formate distillation column trays under optimal operating conditions.
Separations 12 00012 g005
Figure 6. The design process for multi-component separation in POM waste liquid.
Separations 12 00012 g006
Table 1. The binary interaction parameters for the NRTL, UNIQUAC, and Wilson models regressed by the VLE data of methanol–methyl formate–methylal ternary system.
Property
Method
Component IComponent Jaijajibijbjic
NRTLmethanolmethylal3.384−6.675−797.8712255.8100.3
methylalmethyl formate1.854−1.806−408.250460.6960.3
methyl formatemethanol−6.63114.8872472.880−4596.9700.3
UNIQUACmethanolmethylal−0.4983.355169.514−1360.960
methylalmethyl formate0.1840.331−224.3816.789
methyl formatemethanol4.137−7.087−1661.8702256.160
Wilsonmethanolmethylal1.8953.059−763.567−1265.430
methylalmethyl formate0.5350.709−62.422−406.588
methyl formatemethanol−6.749−4.8021926.9701196.420
Table 3. The composition and physical properties of POM waste liquid.
ComponentsCAS
Number
MWMelting Point/°CBoiling Point/°CContent
/wt%
Price a
CNY/t
methanol67-56-132.04−97.865.45.493400
trioxymethylene110-88-390.0859–62114.50.3412,000
dioxolane646-06-074.08−9574–751.5923,000
formic acid64-18-646.038.2–8.4100.80.789500
methylal109-87-576.09−10542.315.343950
methyl formate107-31-360.05−99.83276.4615,000
a Purity greater than or equal to 99 wt%.
Table 4. The techno-economic comparison of various design processes for per tons of POM waste liquid a.
ItemsProduction and ConsumptionEconomic Interest/CNY
Case 1Case 2Case 1Case 2
Methyl formate/99 wt%771.2771.26940.86940.8
Methylal/99 wt%147.8516.6
Reboiler/Gcal·h−10.4990.617−190.1−235.0
Cooling/Gcal·h−10.4860.574−19.4−22.9
Residual liquid/kg·h−1228.881.0228.881.0
Total/CNY6960.17281.2
a All prices used for costs calculation were market prices, of which the prices of cooling water at 303.15 K was 0.2 CNY·t−1, the thermal energy with 2200 MJ·t−1 was 200 CNY·t−1, methyl formate with 99 wt% was 9000 CNY·t−1, methylal with 99 wt% was 3500 CNY·t−1, and the residual liquid was 1000 CNY·t−1.
Table 2. The RMSD of experimental and simulated values for the VLE experimental of methanol–methyl formate–methylal ternary system at atmospheric pressure.
Property
Method
RMSD (y1) aRMSD (y2) aRMSD (y3) aRMSD (T) bRMSD (P) c
NRTL0.00870.00690.00660.44350.0011
UNIQUAC0.00850.00690.00680.43750.0011
Wilson0.00900.00700.00750.48630.0012
a  R M S D y j = i N y i j e x p y i j c a l 2 N ; b  R M S D T = i N T i e x p T i c a l 2 N ; c  R M S D P = i N P i e x p P i c a l 2 N .
Disclaimer/Publisher’s Note: The statements, opinions and data contained in all publications are solely those of the individual author(s) and contributor(s) and not of MDPI and/or the editor(s). MDPI and/or the editor(s) disclaim responsibility for any injury to people or property resulting from any ideas, methods, instructions or products referred to in the content.

