Article

Continuous Purification of Biodiesel with Deep Eutectic Solvent in a Laboratory Karr Column

by
Aleksandra Sander
1,*,
Ana Petračić
1,
Domagoj Vrsaljko
1,
Jelena Parlov Vuković
2,
Patricija Hršak
1,3 and
Antonija Jelavić
1
1
University of Zagreb, Faculty of Chemical Engineering and Technology, Trg Marka Marulića 19, 10000 Zagreb, Croatia
2
Ruđer Bošković Institute, Bijenička Cesta 54, 10000 Zagreb, Croatia
3
University of Zagreb, Faculty of Metallurgy, Aleja Narodnih Heroja 3, 44000 Sisak, Croatia
*
Author to whom correspondence should be addressed.
Separations 2024, 11(3), 71; https://doi.org/10.3390/separations11030071
Submission received: 30 January 2024 / Revised: 21 February 2024 / Accepted: 23 February 2024 / Published: 24 February 2024
(This article belongs to the Special Issue Application of Deep Eutectic Solvents in Green Separation Chemistry)

Abstract

:
Following the trend of transport decarbonization, biodiesel has become a promising alternative fuel option. Its production includes multiple steps, all of which can be time-consuming and energy intensive. Improving any of these steps could bring considerable environmental and economic benefits. The utilization of deep eutectic solvents (DESs) for glycerol extraction from crude biodiesel has predominantly been explored as a batch process. This work provides insight into continuous column extraction. Different waste cooking oils were used to produce biodiesel via transesterification with methanol, and the selective solvent for purification was DES choline chloride–ethylene glycol (1:2.5, mol.). A laboratory Karr column at different pulsation frequencies and DES to biodiesel mass ratio was used for extraction. Plate material (steel and 3D printed PETG) and geometry influence on the efficiency of extraction were investigated. Contact angle measurement was used to measure the surface free energy of steel and PETG and the spreading ability of biodiesel and DESs on both materials. Extraction efficiency was analyzed by several analytical techniques. Higher efficiency was observed with steel plates of a triangular pitch hole arrangement. Increasing the mixing intensity and DES to biodiesel mass ratio further increased the efficiency of extraction.

1. Introduction

Biofuels have an important role in improving sustainability in the transport sector. It is emphasized that advanced biofuels, or biofuels produced from waste or algae, greatly reduce greenhouse gas emissions, do not pose a threat to the food industry, and are not ethically dubious. Therefore, the production and use of advanced biofuels is encouraged, as it ensures the fulfilment of obligations on the share of energy from renewable energy sources in the transport sector.
Deep eutectic solvents (DESs) are widely used for various purification processes due to their ability to dissolve different solutes, such as glycerol [1], amino acids [2], polyphenols [3], and many more. Their role in the biodiesel production process is very diverse—they can be used as catalysts [4], reaction media [5], for feedstock purification, and for crude biodiesel purification [6]. For the most part, DES-assisted extractive purification of crude biodiesel from glycerol was explored as a batch process.
Continuous glycerol extraction processes with DESs found in the literature include integrated production and purification of sunflower oil biodiesel in a microreactor [7,8] and continuous purification of sunflower oil [9] and waste coffee ground oil biodiesel [10] in a Karr column.
A Karr column is an extraction column with perforated pulsating plates whose role is to agitate the dispersed phase and consequently create smaller droplets, resulting in a larger interfacial area [11]. It is appropriate for systems prone to emulsification and can work with high volumetric efficiency [12], finding applications in pharmaceutical, petrochemical, metallurgical, and chemical industries, and it can also be used in wastewater treatment [13,14]. Studies show that various factors such as phase flowrates, physical properties of the system, mixing intensity, geometry, the material of the trays, and column diameter significantly affect the hydrodynamics of the column [13].
The influence of the pulsation rate on the extraction of glycerol and glycerides from biodiesel produced from household waste sunflower oil has been previously investigated in the same column [9].
The hydrodynamic regime in the mechanically agitated columns is influenced by the flowrates of both phases and the mixing intensity. To ensure high rates of mass transfer, the interfacial area should be increased. This can be achieved by increasing the dispersed phase flowrate and/or the mixing intensity. In the absence of experimental droplet size distribution, one must know the Sauter mean diameter to evaluate the interfacial area. Sauter mean diameter is influenced by the properties of both phases, column geometry, and mixing intensity. Among many correlations for evaluation of the Sauter mean diameter, the one proposed by Kumar and Hartland provides results with an average error deviation of 16% [15]. For the mass transfer direction from continuous to disperse phase in the Karr column:
d 32 H = 0.92 e 0.32 1 1.55 γ ρ g H 2 1 / 2 + 1 0.42 ε g ρ g γ 1 / 4 0.35 H ρ g γ 1 / 2 1.15 ,
where Δρ is density difference between phases, kg m−3; γ is interfacial tension, N m−1; g is acceleration due to gravity, m s−2; H is the distance between plates; and γ is interfacial tension.
The power dissipation per unit mass of the phases, ε, can be calculated as follows:
ε = 2 π 2 ( 1     e 2 ) 3 H C 0 2 e 2 ( A f ) 3 .
In this equation, A is stroke, m, and f is frequency, s−1. The value of the orifice coefficient, C0, is set to 0.6.
Three-dimensional printing, also known as additive manufacturing, offers unparalleled design flexibility and precision, allowing engineers to create intricate and customized column separator parts that may be challenging or even impossible to produce using traditional manufacturing methods. This technology empowers designers to experiment with complex geometries, internal structures, and material compositions, ultimately enhancing the performance and effectiveness of column separators [16].
Moreover, the surface properties of column separator parts significantly influence their interaction with the substances being processed. The ability to fine-tune surface characteristics, such as roughness, porosity, and chemical composition, can have profound effects on separation efficiency, material flow, and overall system performance. Understanding and optimizing these surface properties through 3D printing enables engineers to tailor column separators to specific applications, ensuring compatibility with diverse substances and operational conditions.
The goal of this paper is to analyze the influence of different process conditions on continuous crude biodiesel purification with deep eutectic solvents in a laboratory scale Karr column.

2. Materials and Methods

Two types of waste cooking oils were used: waste household sunflower oil (biodiesel 1) and waste cooking oil obtained from commercial sources (Agroproteinka (Sesvete, Croatia) (biodiesel 2)). For both waste oils, total acid number (TAN) was lower than 2 mg KOH/g. Solid particles were filtered and residual water was evaporated prior to the synthesis of biodiesel, which was confirmed gravimetrically (Moisture Analyzer Kern MLB50-3N).

2.1. Chemicals

The chemicals used in this work are listed in Table 1. Methanol and potassium hydroxide were used without purification. Methanol (HPLC grade, J.T. Baker) and potassium hydroxide (p.a., Kemika) were used without purification. Choline chloride (99%, Acros Organics) and ethylene glycol (p.a., Lach-ner) were vacuum dried at 60 °C for 8 h before preparation of DES. DES (choline chloride–ethylene glycol (1:2.5, mol.)) was prepared according to the previously described procedure [9].

2.2. Biodiesel Synthesis

Biodiesel was prepared via transesterification of waste cooking oil with methanol at a mass ratio of KOH, methanol and oil 1:40:100. The mixture of potassium methoxide was intensively agitated in a reactor using a temperature-controlled magnetic stirrer at 60 °C for 1 h.

2.3. Characterization of DES and Biodiesel

Density, surface tension, and interfacial tension were measured using a DataPhysic tensiometer DCAT 8T. The du Nuoy ring method was used for measuring the surface tension and interfacial tension. Contact angle measurements were carried out to determine the surface free energy (SFE) of steel and PETG and the spreading ability of DES and BD by sessile drop method (DataPhysics Instruments OCA 20 goniometer). The concentration of glycerol and glycerides in biodiesel samples were determined by gas chromatography (GC, Scion 436-GC). Fourier transform infrared spectroscopy (FTIR), as well as nuclear magnetic resonance spectroscopy (NMR), were further used to analyze biodiesel samples.
FTIR measurements were conducted with a Bruker Vertex 70 spectrometer, in FTIR ATR mode with a range of 4000–400 cm−1 (MIR). All the 1H and 13C NMR spectra were recorded on a Bruker Avance 300 NMR spectrometer, with operating parameters set at 300 MHz for 1H and 75 MHz for 13C using a C/H dual 5 mm probe.
NMR spectra were recorded in deuterated chloroform with tetramethylsilane (TMS) at room temperature. The 1H NMR experiments were carried out with 32 scans, 10 s recycle delay, 7.6 μs π/2 pulse length, and 16 K time domain data. 13C APT spectra with spectral widths of 18,030 Hz were collected with 10,240 scans. Digital resolution was 0.55 Hz per point. Typical spectral conditions for HSQC were used. Spectral width was 2994 Hz and 16,605 Hz in the f2 and f1 dimensions, respectively. In the time domain, 2K data points were used and 256 increments were collected, with resulting digital resolution being 2.94 and 125.1 Hz per point in the f2 and f1 dimensions, respectively.

2.4. Liquid–Liquid Extraction

2.4.1. Batch Extraction

Batch extraction experiments were performed in a laboratory-scale extractor at room temperature. The influence of mixing rate (400, 600, 800, and 1000 rpm), extraction time (15, 30, 45, and 60 min), and DES to biodiesel (BD) mass ratio (0.25:1, 0.50:1, 0.75:1, and 1:1) was investigated. The biodiesel used in these experiments was synthesized from used household sunflower oil. After mechanical separation of glycerol, biodiesel 1 was dried in order to remove residual methanol.

2.4.2. Continuous Extraction

After the mechanical separation of biodiesel and glycerol, crude biodiesel was purified in a computer-controlled laboratory Karr reciprocating plate column, Figure 1. Two plate hole arrangements with the same free surface area (22%) were used. The influence of DES to BD mass flow rate, pulsation intensity, geometry, and plate material on the extraction efficiency was analyzed.
Biodiesels synthesized from two different waste cooking oils were purified in the described column.

2.5. 3D Printing

A Zortrax M200 3D printer (Zortrax S.A., Olsztyn, Poland) was used for this work. The printer uses the additive manufacturing technology of material extrusion and filaments with a diameter of 1.75 mm. A nozzle with a diameter of 0.4 mm was used.
The models were first designed in the CAD software Fusion 360 (Autodesk, San Francisco, CA, USA). The slicer software used was Z-Suite (Zortrax S.A., Olsztyn, Poland).
The material was transparent PETG, (Devil Design, Mikołów, Poland, 1 kg spools, 1.75 mm diameter). A temperature of 250 °C was used for the nozzle and 70 °C for the print bed. The manufacturer states a specific density of 1.23 g/cm3 and a relative density of 1.29 g/cm3.

3. Results and Discussion

3.1. Physical and Surface Properties of Phases

The measured values of density, ρ, viscosity, μ, surface tension, σ, and interfacial tension, γ, are given in Table 2. The density difference was large enough to assure phase separation after extraction, the viscosity of the DES was low enough not to interfere with mass transfer, and based on prior experience with the DES the system is prone to coalescence, which also allows for phase separation at the bottom and the top of the extraction column [9]. Low interfacial tension ensures the easy formation of droplets.
Contact angle measurements were taken to determine the surface free energy (SFE) of steel and PETG by a sessile drop method. Measurements were conducted at 23 °C with deionized water (κ = 2.0 μS/cm) as a polar liquid, diiodomethane (99%, Aldrich, St. Louis, MO, USA) as a non-polar liquid, and formamide (p.a. 99.5%, Fluka, Charlotte, NC, USA) with properties in between. The drop volume of 2 μL was used for the measurements. The contact angles were determined at the same time, 80 ms after the droplet touched the surface of the tested material. Arithmetic mean values of five contact angles were calculated for each sample. The surface free energies of steel and PETG were calculated using three models: Owens–Wendt (OW), Wu, and Acid-base (AB), Table 3. Higher surface free energy was observed for PETG plates (SFE (steel) = 33.0 mJ m−2, SFE (PETG) = 46.2 mJ m−2), which indicates the slightly better wettability of PETG. The spreading ability of both liquids was determined by measuring the contact angle of both liquids on steel and PETG. A drop volume of 10 μL was used for the measurements. The contact angles were determined at the same time, 90 ms and 2000 ms, after the drop touched the surface of the tested materials, Table 4. The contact angle of biodiesel after 2 s is much lower compared to DES. Both the lower contact angle and its reduction indicate a better spreading ability of biodiesel. Based on the obtained results, biodiesel was chosen as the continuous phase.
The surface free energy and contact angle measurements of steel and PETG showed that both steel and PETG have similar surface properties (Table 3). Water contact angles around 75° indicate that both materials are slightly hydrophilic. The total surface free energy of PETG is slightly higher, mainly due to the higher dispersive component of the surface free energy. For both materials, the polar component of the surface free energy is very similar and is inherently basic. These results indicate that the liquids will have the same spreading ability on both materials.

3.2. Drop Size

An increase in mixing intensity resulted in smaller Sauter mean diameter and larger surface area for the same DES to BD mass flowrates ratio, as can be observed in Figure 2. Several large irregularly shaped droplets were observed at all investigated process conditions. Those droplets were the largest for plate B and the smallest for plate C. Formation of larger droplets when plates A and B were used may be attributed to the formation of larger droplets through significantly larger holes. The narrowest droplet size distribution was observed at the highest agitation rate. The greatest number of large droplets was produced with the lowest pulsation rate when PTFE plates were used. At those conditions, the accumulation of a dispersed phase on the plates was clearly visible. The minimal and maximal size of droplets were obtained by the analysis of photographs taken after 30 min. The comparison between different plates can be observed in Figure S1. The majority of droplets were spherical. Since the largest droplets are elliptical, the maximal droplet size was given as the equivalent diameter:
d ekv = d H 2 · d L 3 ,
dH and dL are the largest and the smallest droplet dimensions [17].
The observed size ranges of the majority of droplets were the same (dmin: 0.1–0.3 mm; dav = 0.3–0.5 mm). However, the maximum droplet size is highly influenced by the DES to biodiesel mass flowrates ratio. An increase in flowrate ratio resulted in larger maximum droplets. As can be seen in Figure 3, maximum droplet size depends on both plate material and plate geometry. The impact of plate material is insignificant at low disperse phase flowrate. The full droplet size analysis is given in Table S1.

3.3. Extraction Efficiency

To analyze the behavior of the system, batch extraction experiments at different hydrodynamics conditions, durations, and mass ratios of biodiesel and DES have been performed. The 1H NMR spectra of biodiesels obtained after different extraction times is presented in Figure 4. Signal characteristic for the methyl ester group at 3.65 ppm can be observed at all process conditions. The intensity of the hydroxyl group signal at around 3.44 ppm was significantly reduced, which can indicate that the used DES is suitable for the extraction of glycerol. Similar results were obtained with increasing mixing rate and DES to biodiesel mass ratio, Figures S2 and S3. When comparing the spectra of crude and dried biodiesel, the downfield effect of hydroxylic proton can be observed on the spectrum of the dried sample (after removal of methanol). Considering that the signal at 3.4 ppm belongs to hydroxyl protons of glycerol and methanol, the ratio of signal surfaces belonging to methyl esters, A(Me), and alcohols, A(OH), was calculated. The increase in this ratio from 1.08 to 1.58 is attributed to the removal of methanol. A further increase can be observed with increasing mixing rate, extraction time, and DES to biodiesel mass ratio, as a result of the decreasing concentration of glycerol in biodiesels, Table 5.
To evaluate the fatty acid methyl ester (FAME) content in biodiesel, data obtained by 1H NMR was used (integration values of signals at 3.66 ppm—methyl ester (AMe) and 2.30 ppm—glyceridic signal in triglycerides (ACH2)) [18]:
%FAME = 100 · (2·AMe)/(3·ACH2),
Crude and dried (after removal of methanol) biodiesels contain 94.61% FAME and 96.26% FAME, respectively. The results obtained by batch extraction are shown in Table 5.
Based on the obtained results, it can be concluded that hydrodynamic conditions have a significant influence on the efficiency of biodiesel purification. At lower mixing rates, n, (400 and 600 rpm) a smaller interfacial surface is formed and, due to the higher resistances, the rate of mass transfer is reduced. For mixing rates higher than 600 rpm, the FAME content complies with the biodiesel quality standard [19].
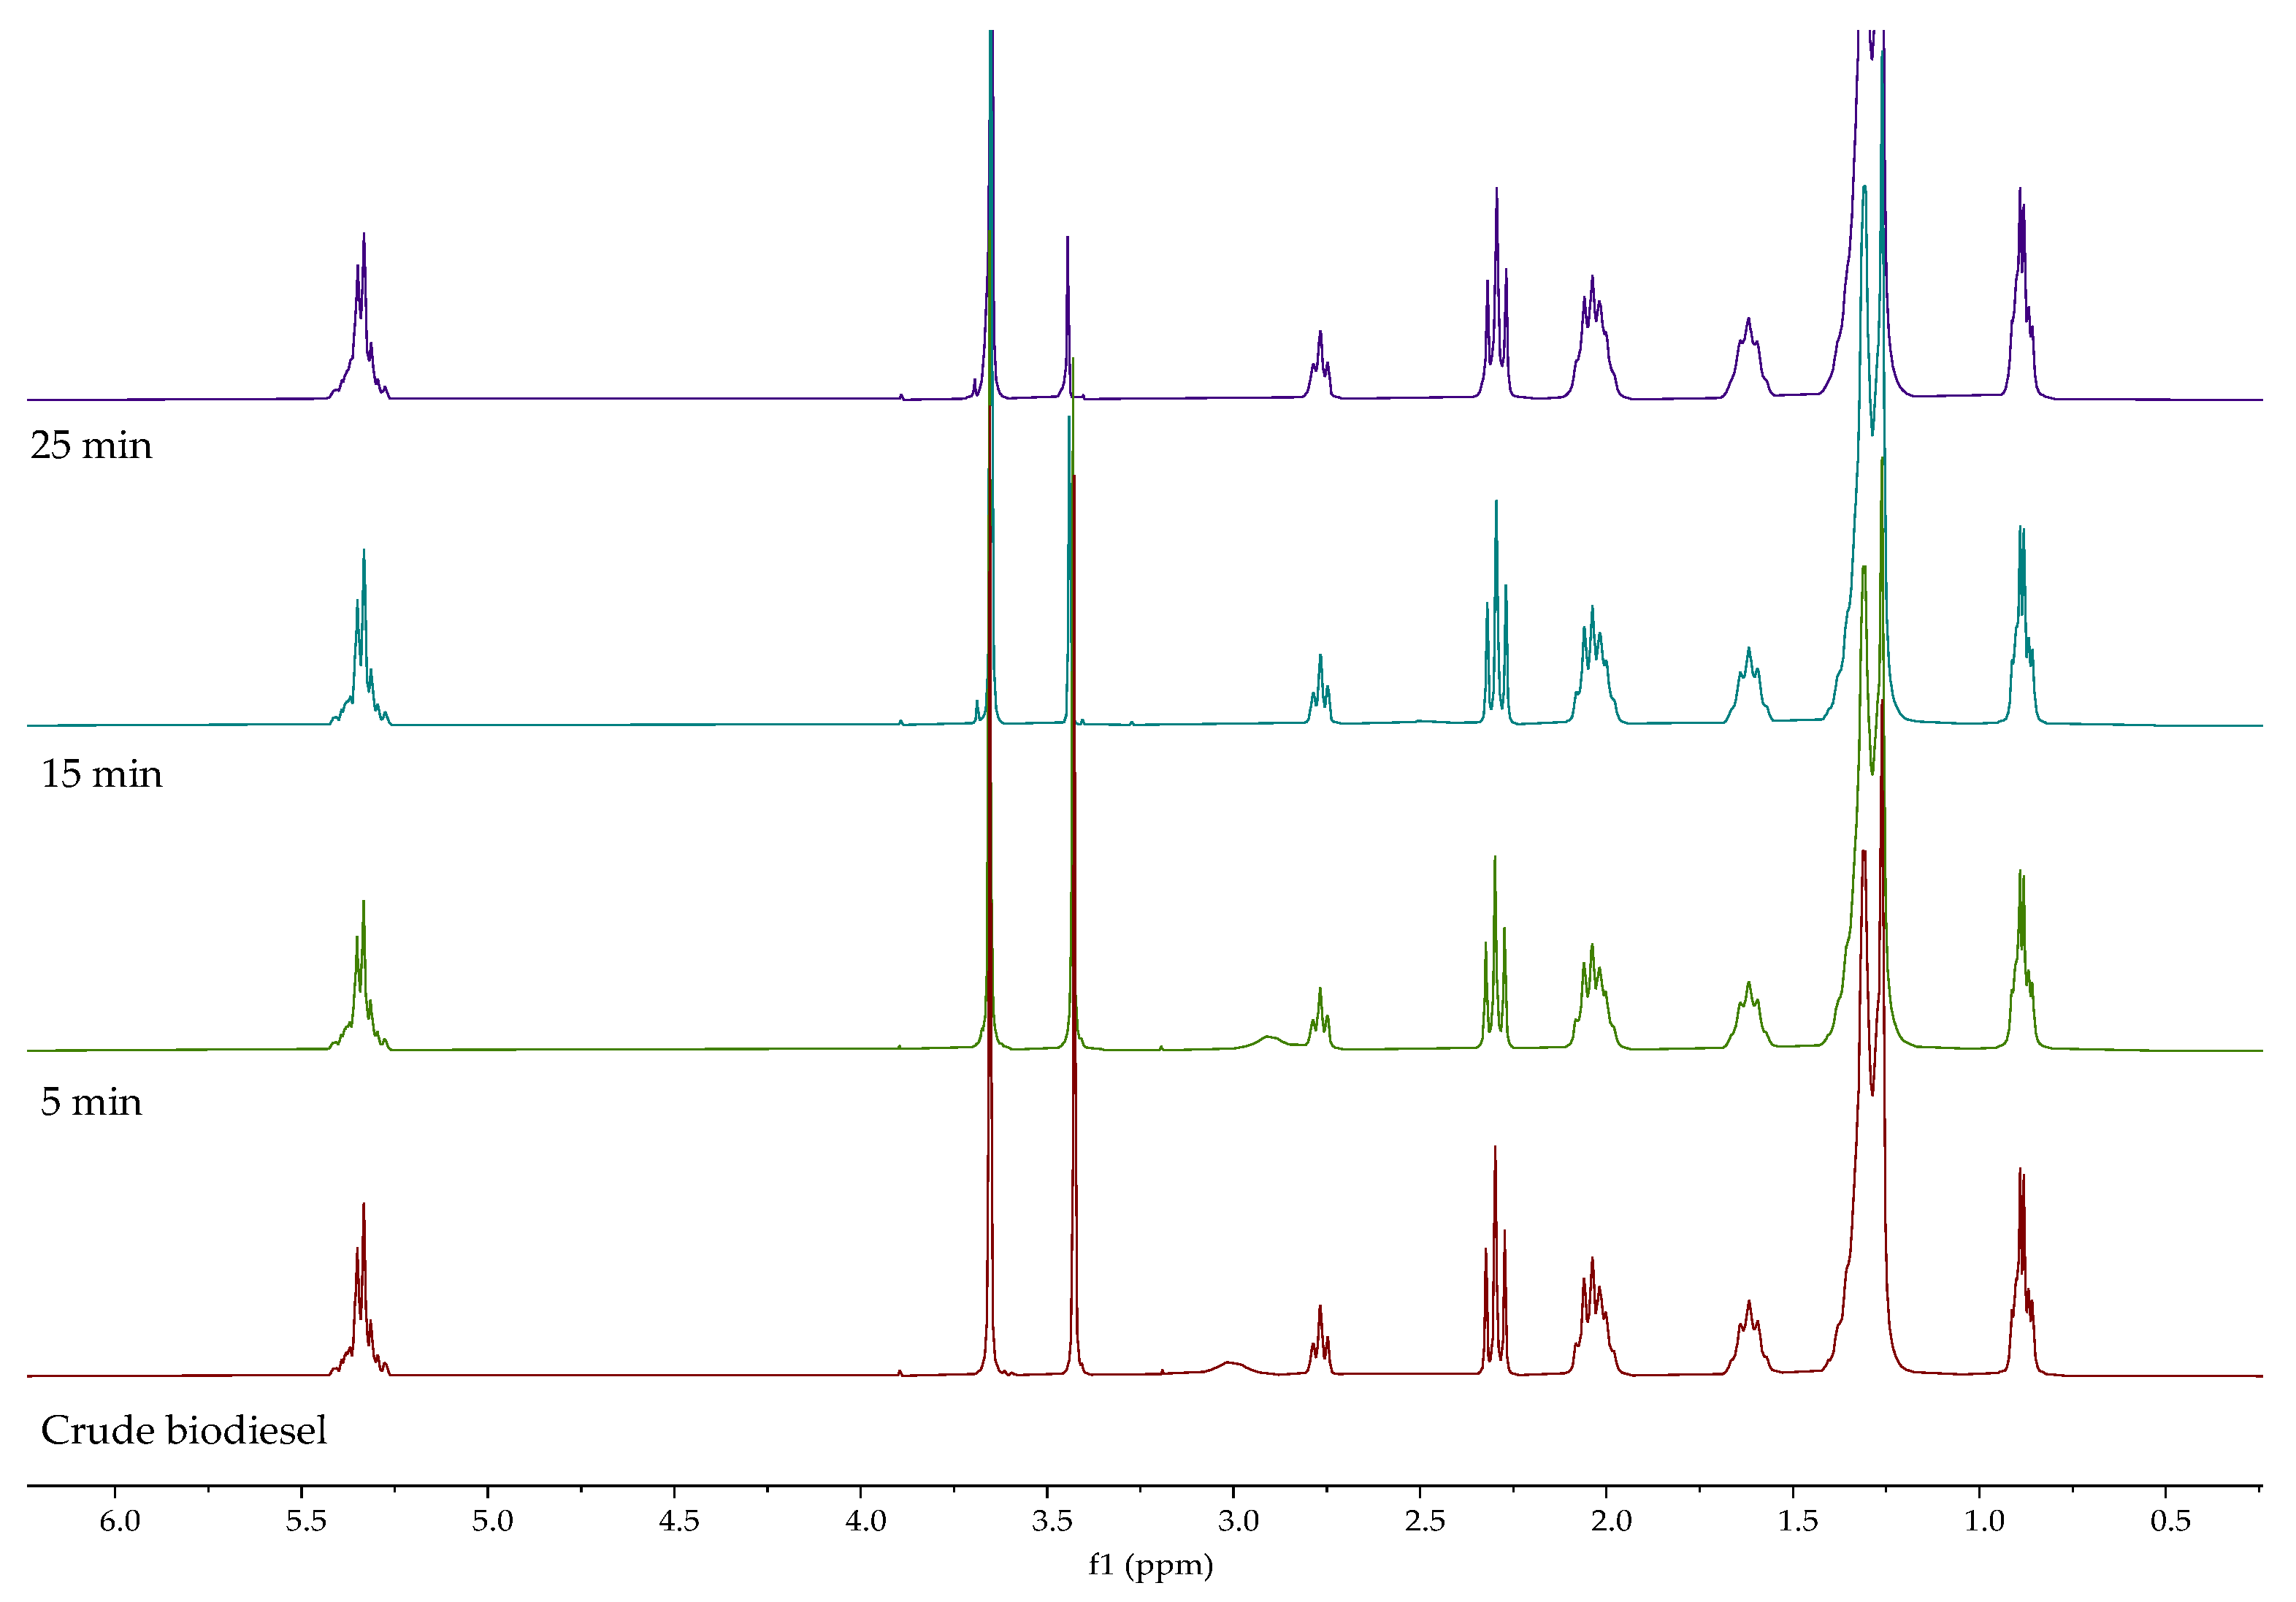
The same biodiesel was also used in the first set of experiments in the Karr column equipped with plate A (steel). The influence of extraction time, DES to biodiesel mass ratio, and agitation rate was analyzed. Samples were collected during extraction after 5, 15, and 25 min. To demonstrate the influence of the extraction time in the Karr column, the 1H NMR spectra of one experimental setup is presented in Figure 5. As extraction proceeds, the ratio A(Me)/A(OH) increases so residual methanol and glycerol are successfully extracted from crude biodiesel. A broad signal at 3 ppm (before extraction) can be attributed to methanol (OH), just as in the one at 2.9 ppm (after 5 min of extraction) [20]. This signal disappears after 15 min.
The evaluated FAME content and the ratio A(Me)/A(OH) for all process conditions are given in Table 6. All experiments resulted with a satisfactory FAME content (>96.5). At a higher pulsation rate and DES to biodiesel mass ratio (or volume fraction of the dispersed phase, φD), an increase in the extraction efficiency of glycerol and methanol can be observed. FAME content also slightly decreases, which means that methyl esters are sparingly soluble in DES.
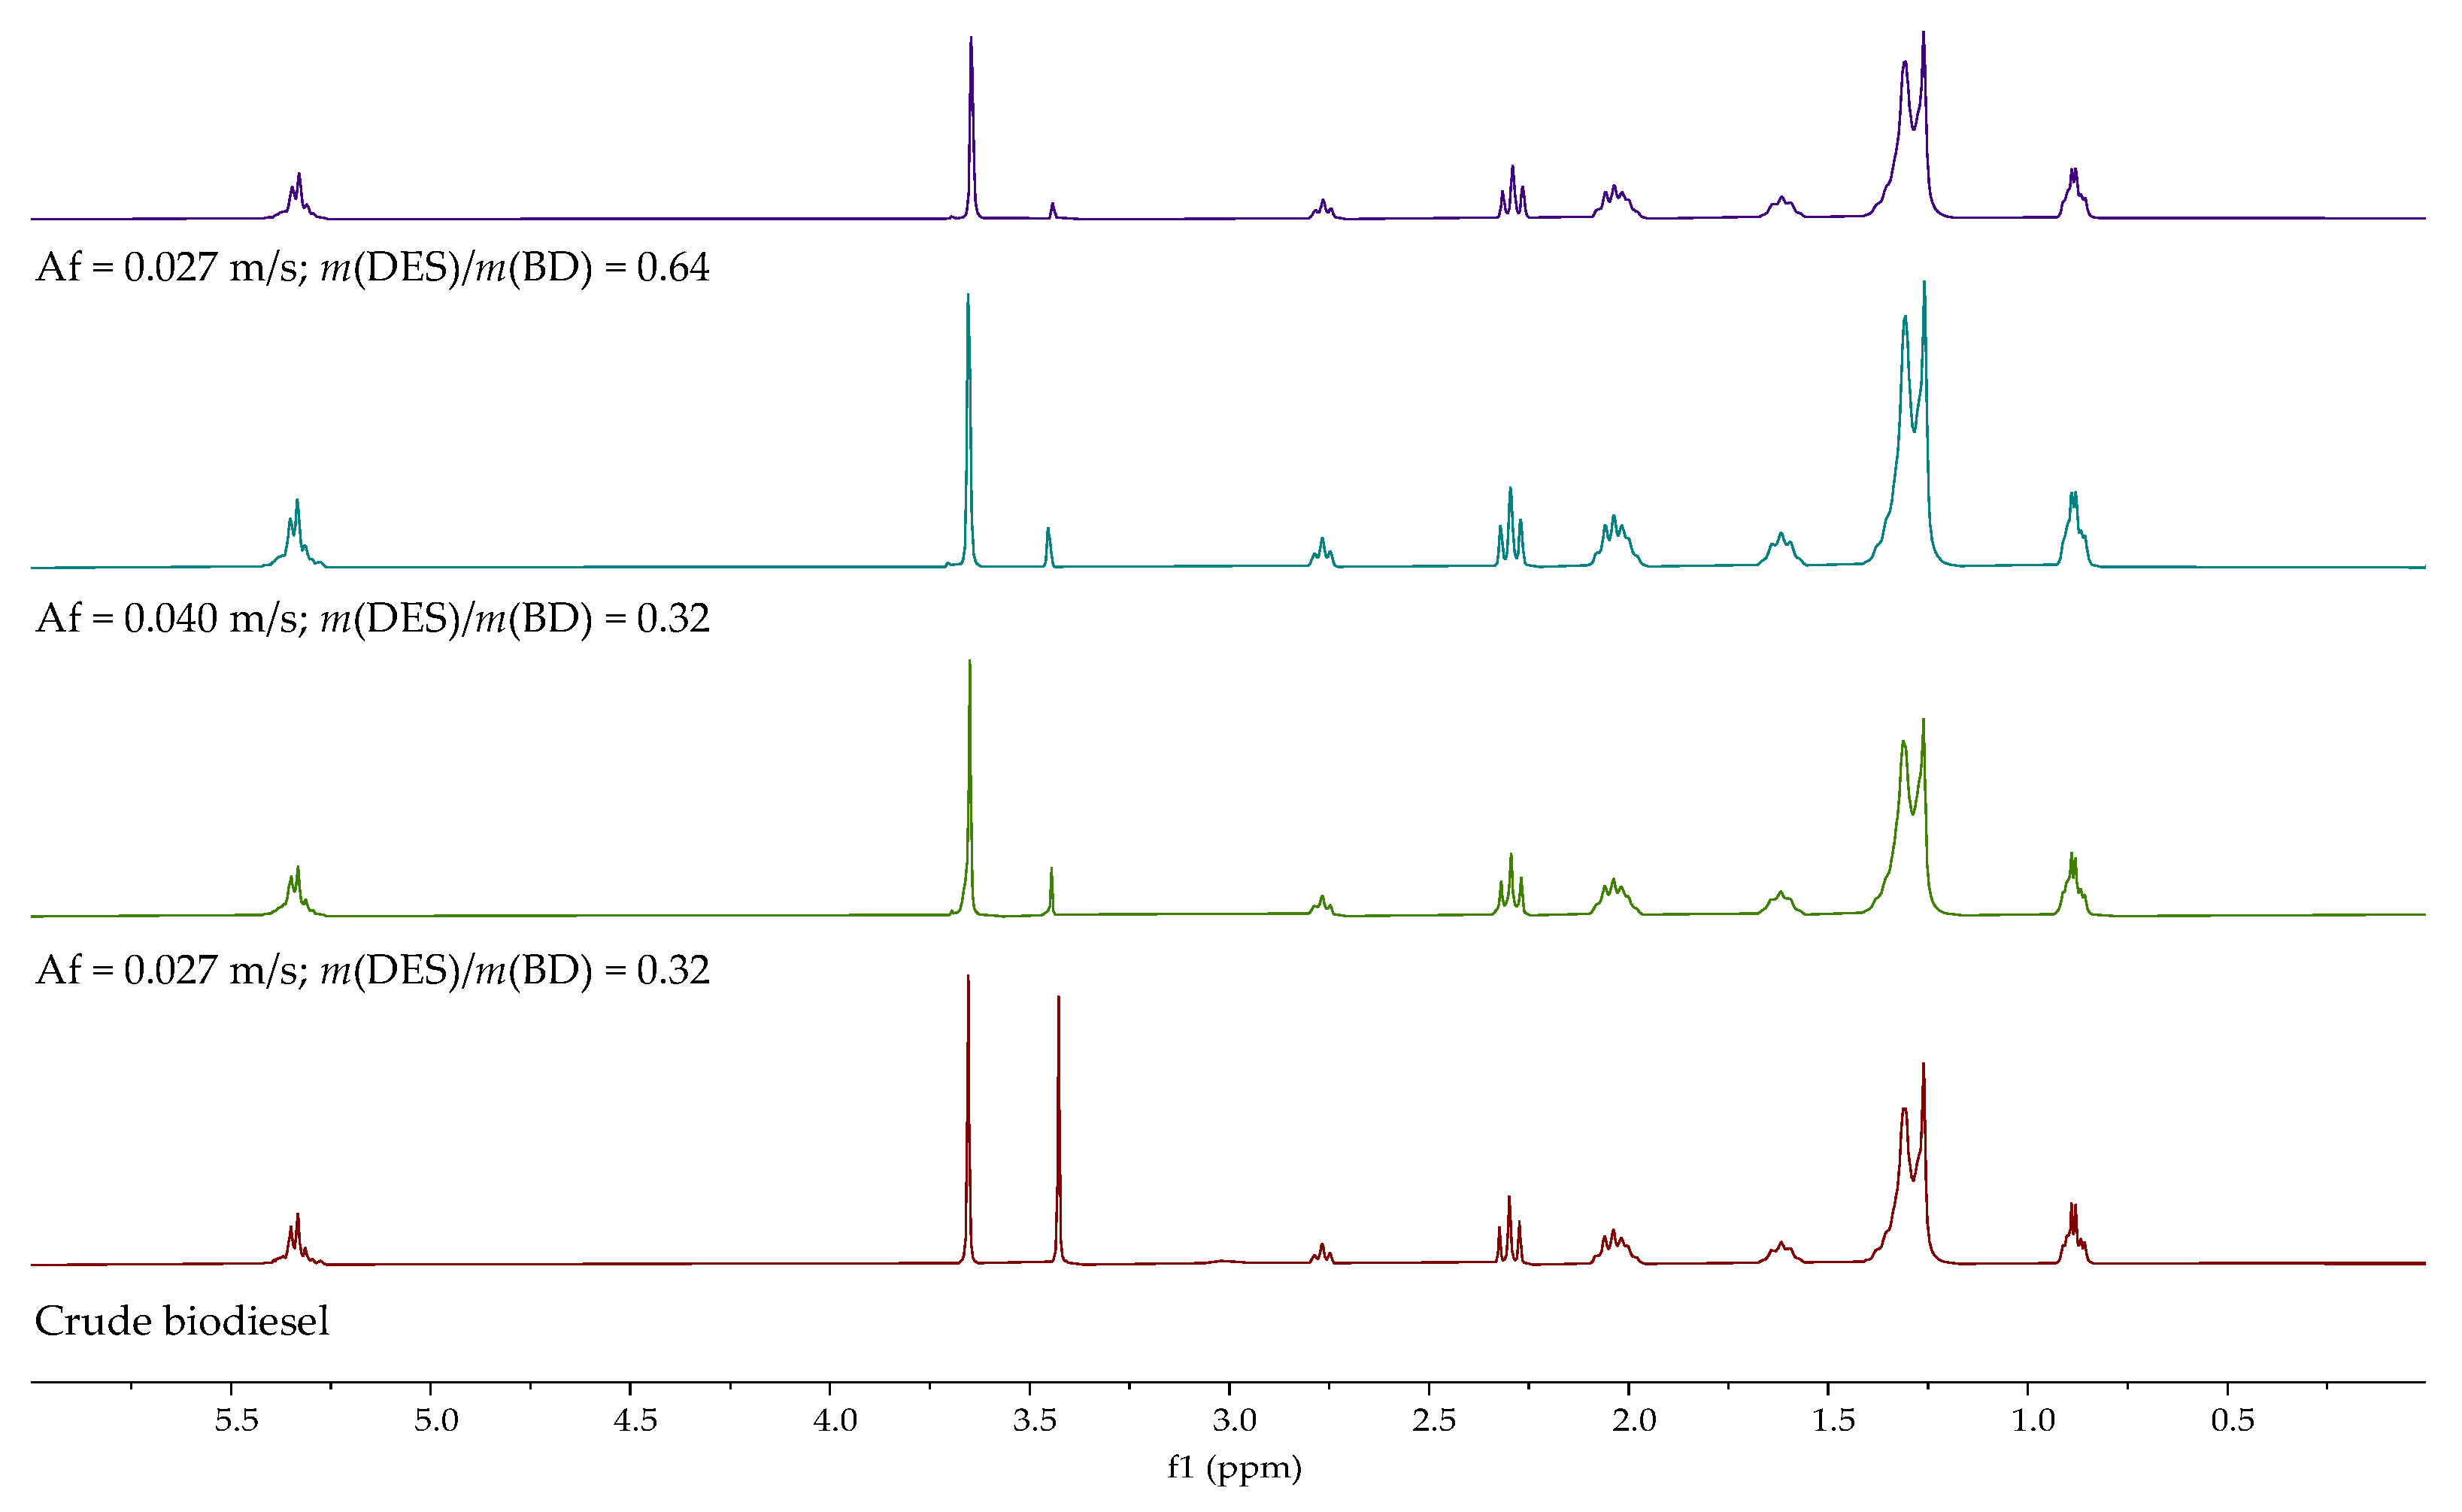
If the 1H NMR spectra of purified biodiesels after 25 min are compared, the most favorable conditions for the purification of biodiesel are a lower pulsation rate and a higher DES to biodiesel ratio, Figure 6.
After the preliminary experiments were conducted with biodiesel 1 and analyzed by 1H NMR, the following experiments were carried with biodiesel 2 and analyzed by FTIR (Figure 7), 1H NMR (Figure 8), 13C NMR (Figure 9), two-dimensional HMQC (Figure 10), and GC.
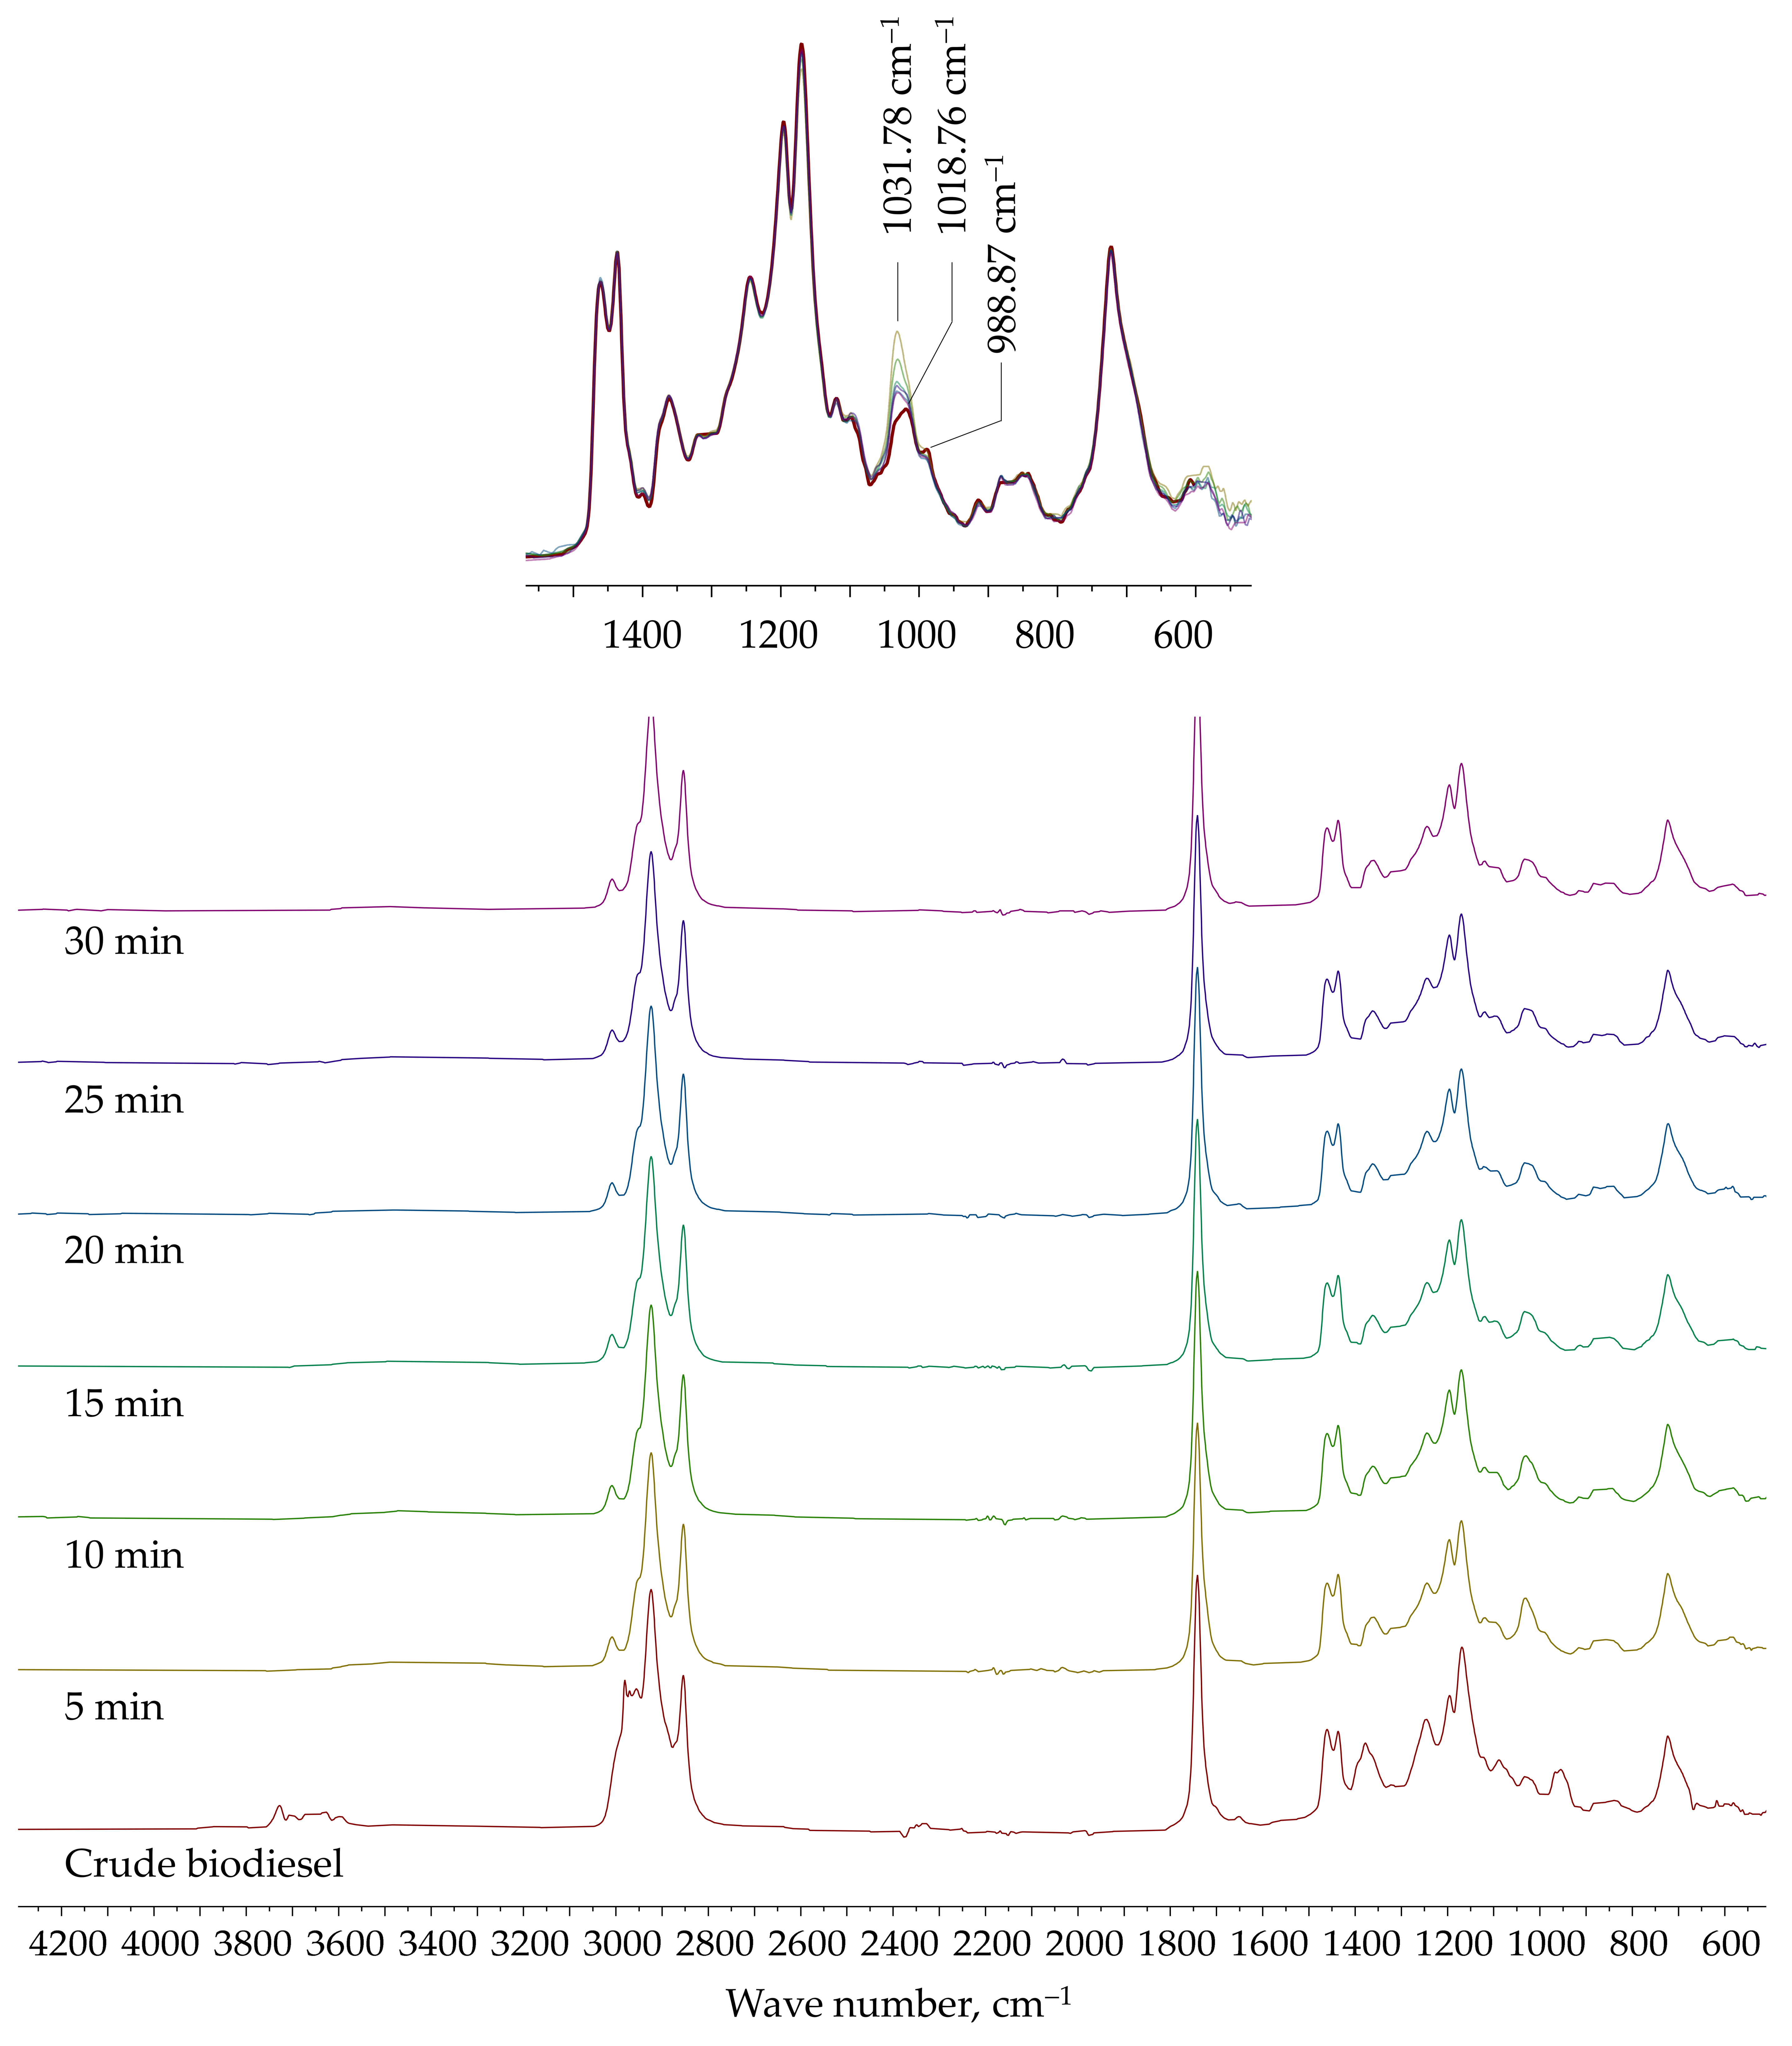
The FTIR spectra of crude biodiesel and samples of purified biodiesel collected during extraction are shown in Figure 7 (plate A, φV = 0.2; Af = 0.02 m/s). Signals characteristic of fatty-acid methyl esters are clearly visible: 1742.43 cm−1 (C=O stretching), 1435.81 cm−1 (CH3 bending), and 1195.71 cm−1 (-OCH3 stretching). The broad signal between 3000 and 3600 cm−1 corresponds to the OH group in glycerol and methanol, while the signal at 1031.78 cm−1 corresponds to the C-O stretching of methanol [21]. In the fingerprint region, a decrease in the intensity of the signal at 1031.78 cm−1 (methanol) and the disappearance of the signal at 988.87 cm−1 (glycerol) can be observed as extraction proceeds [22].
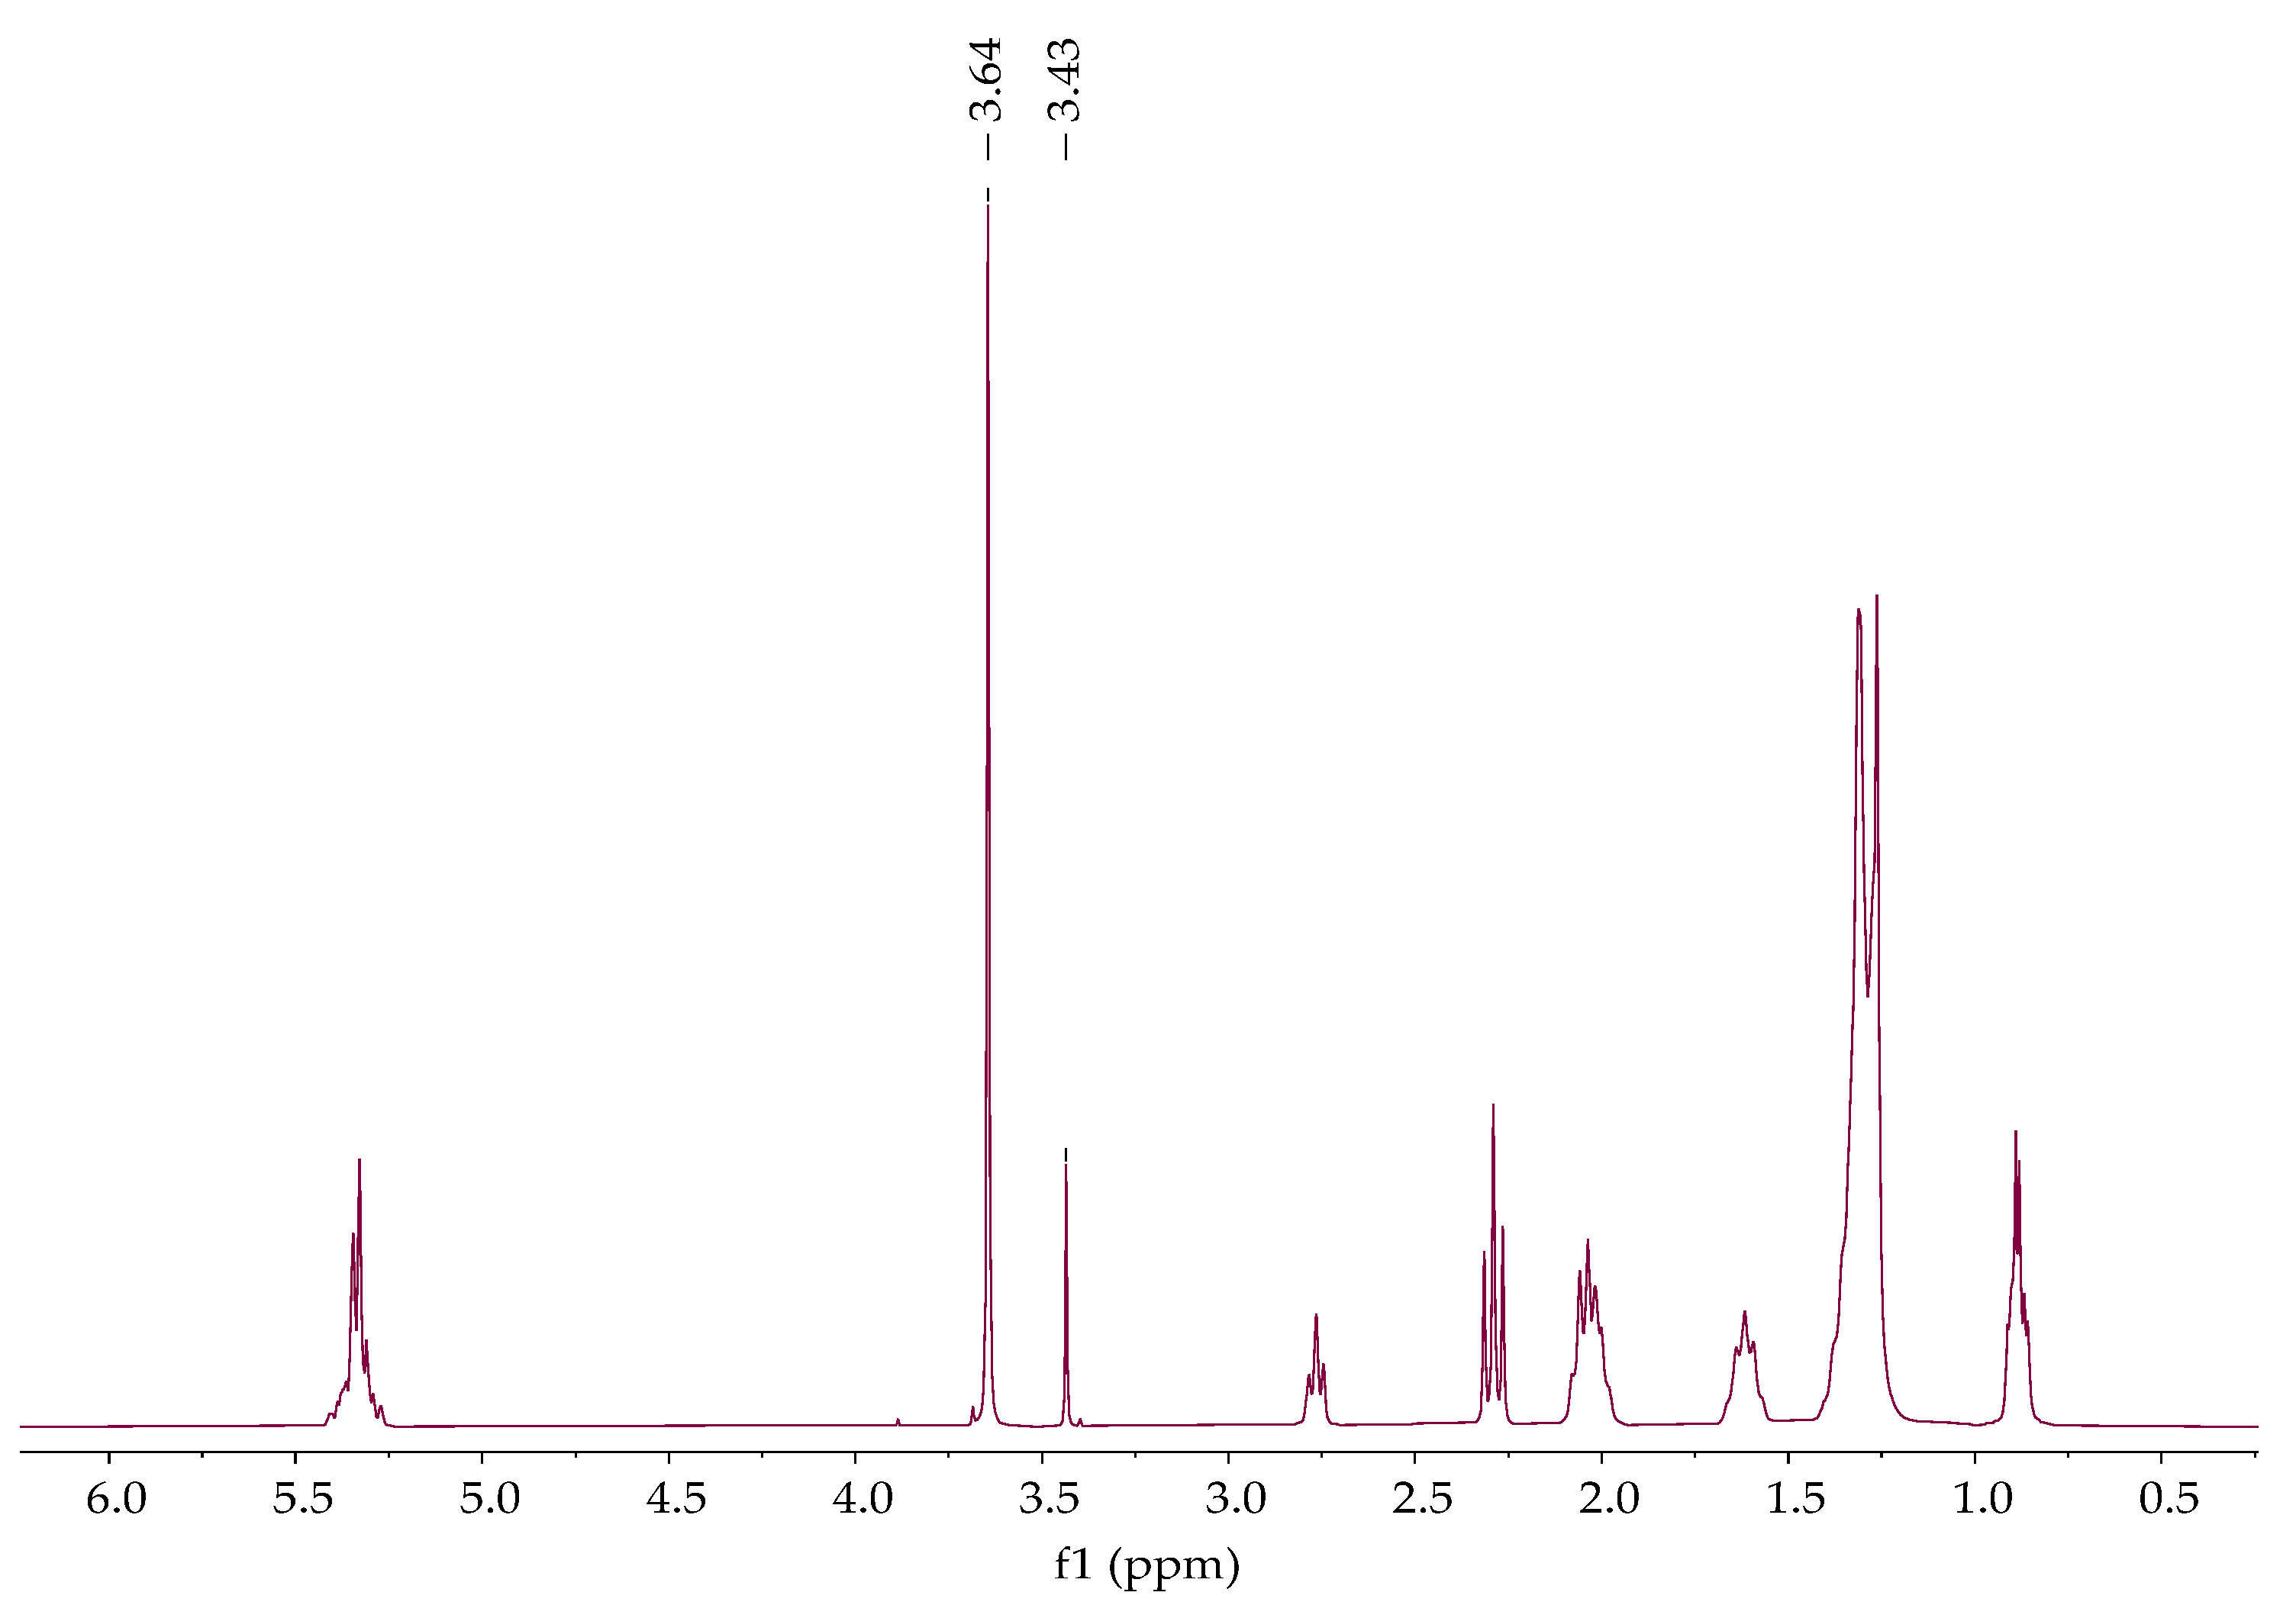
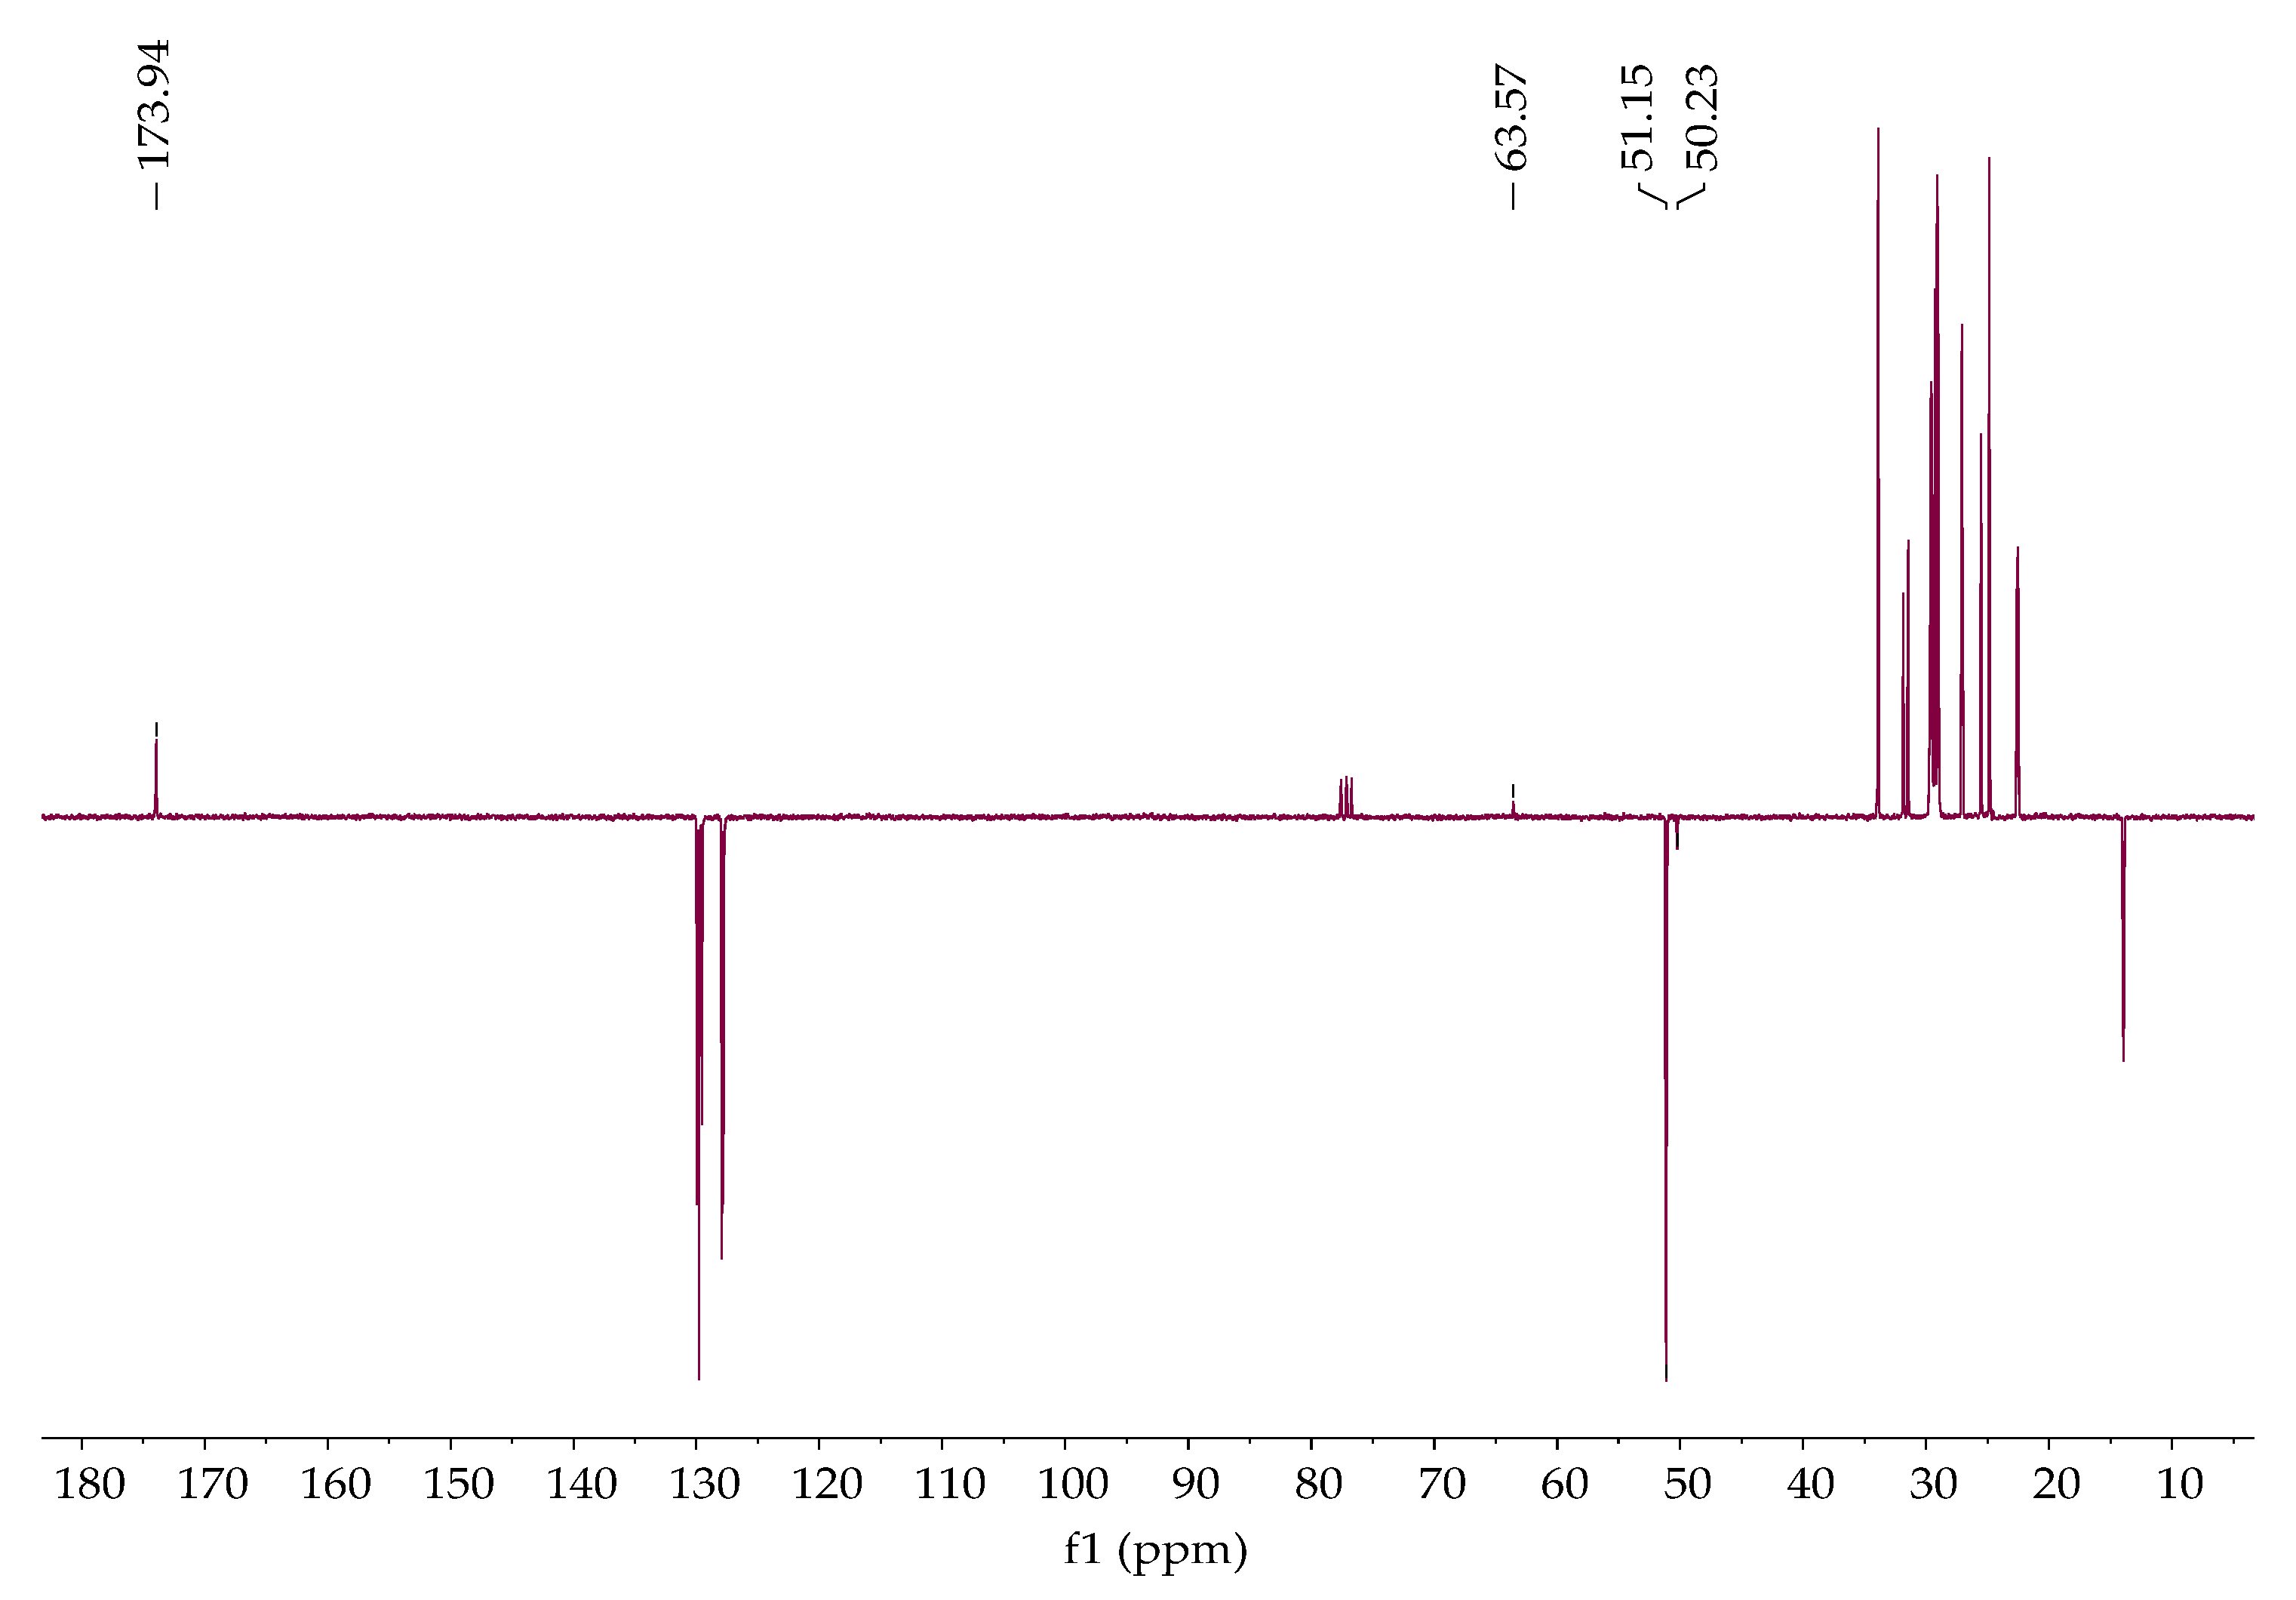
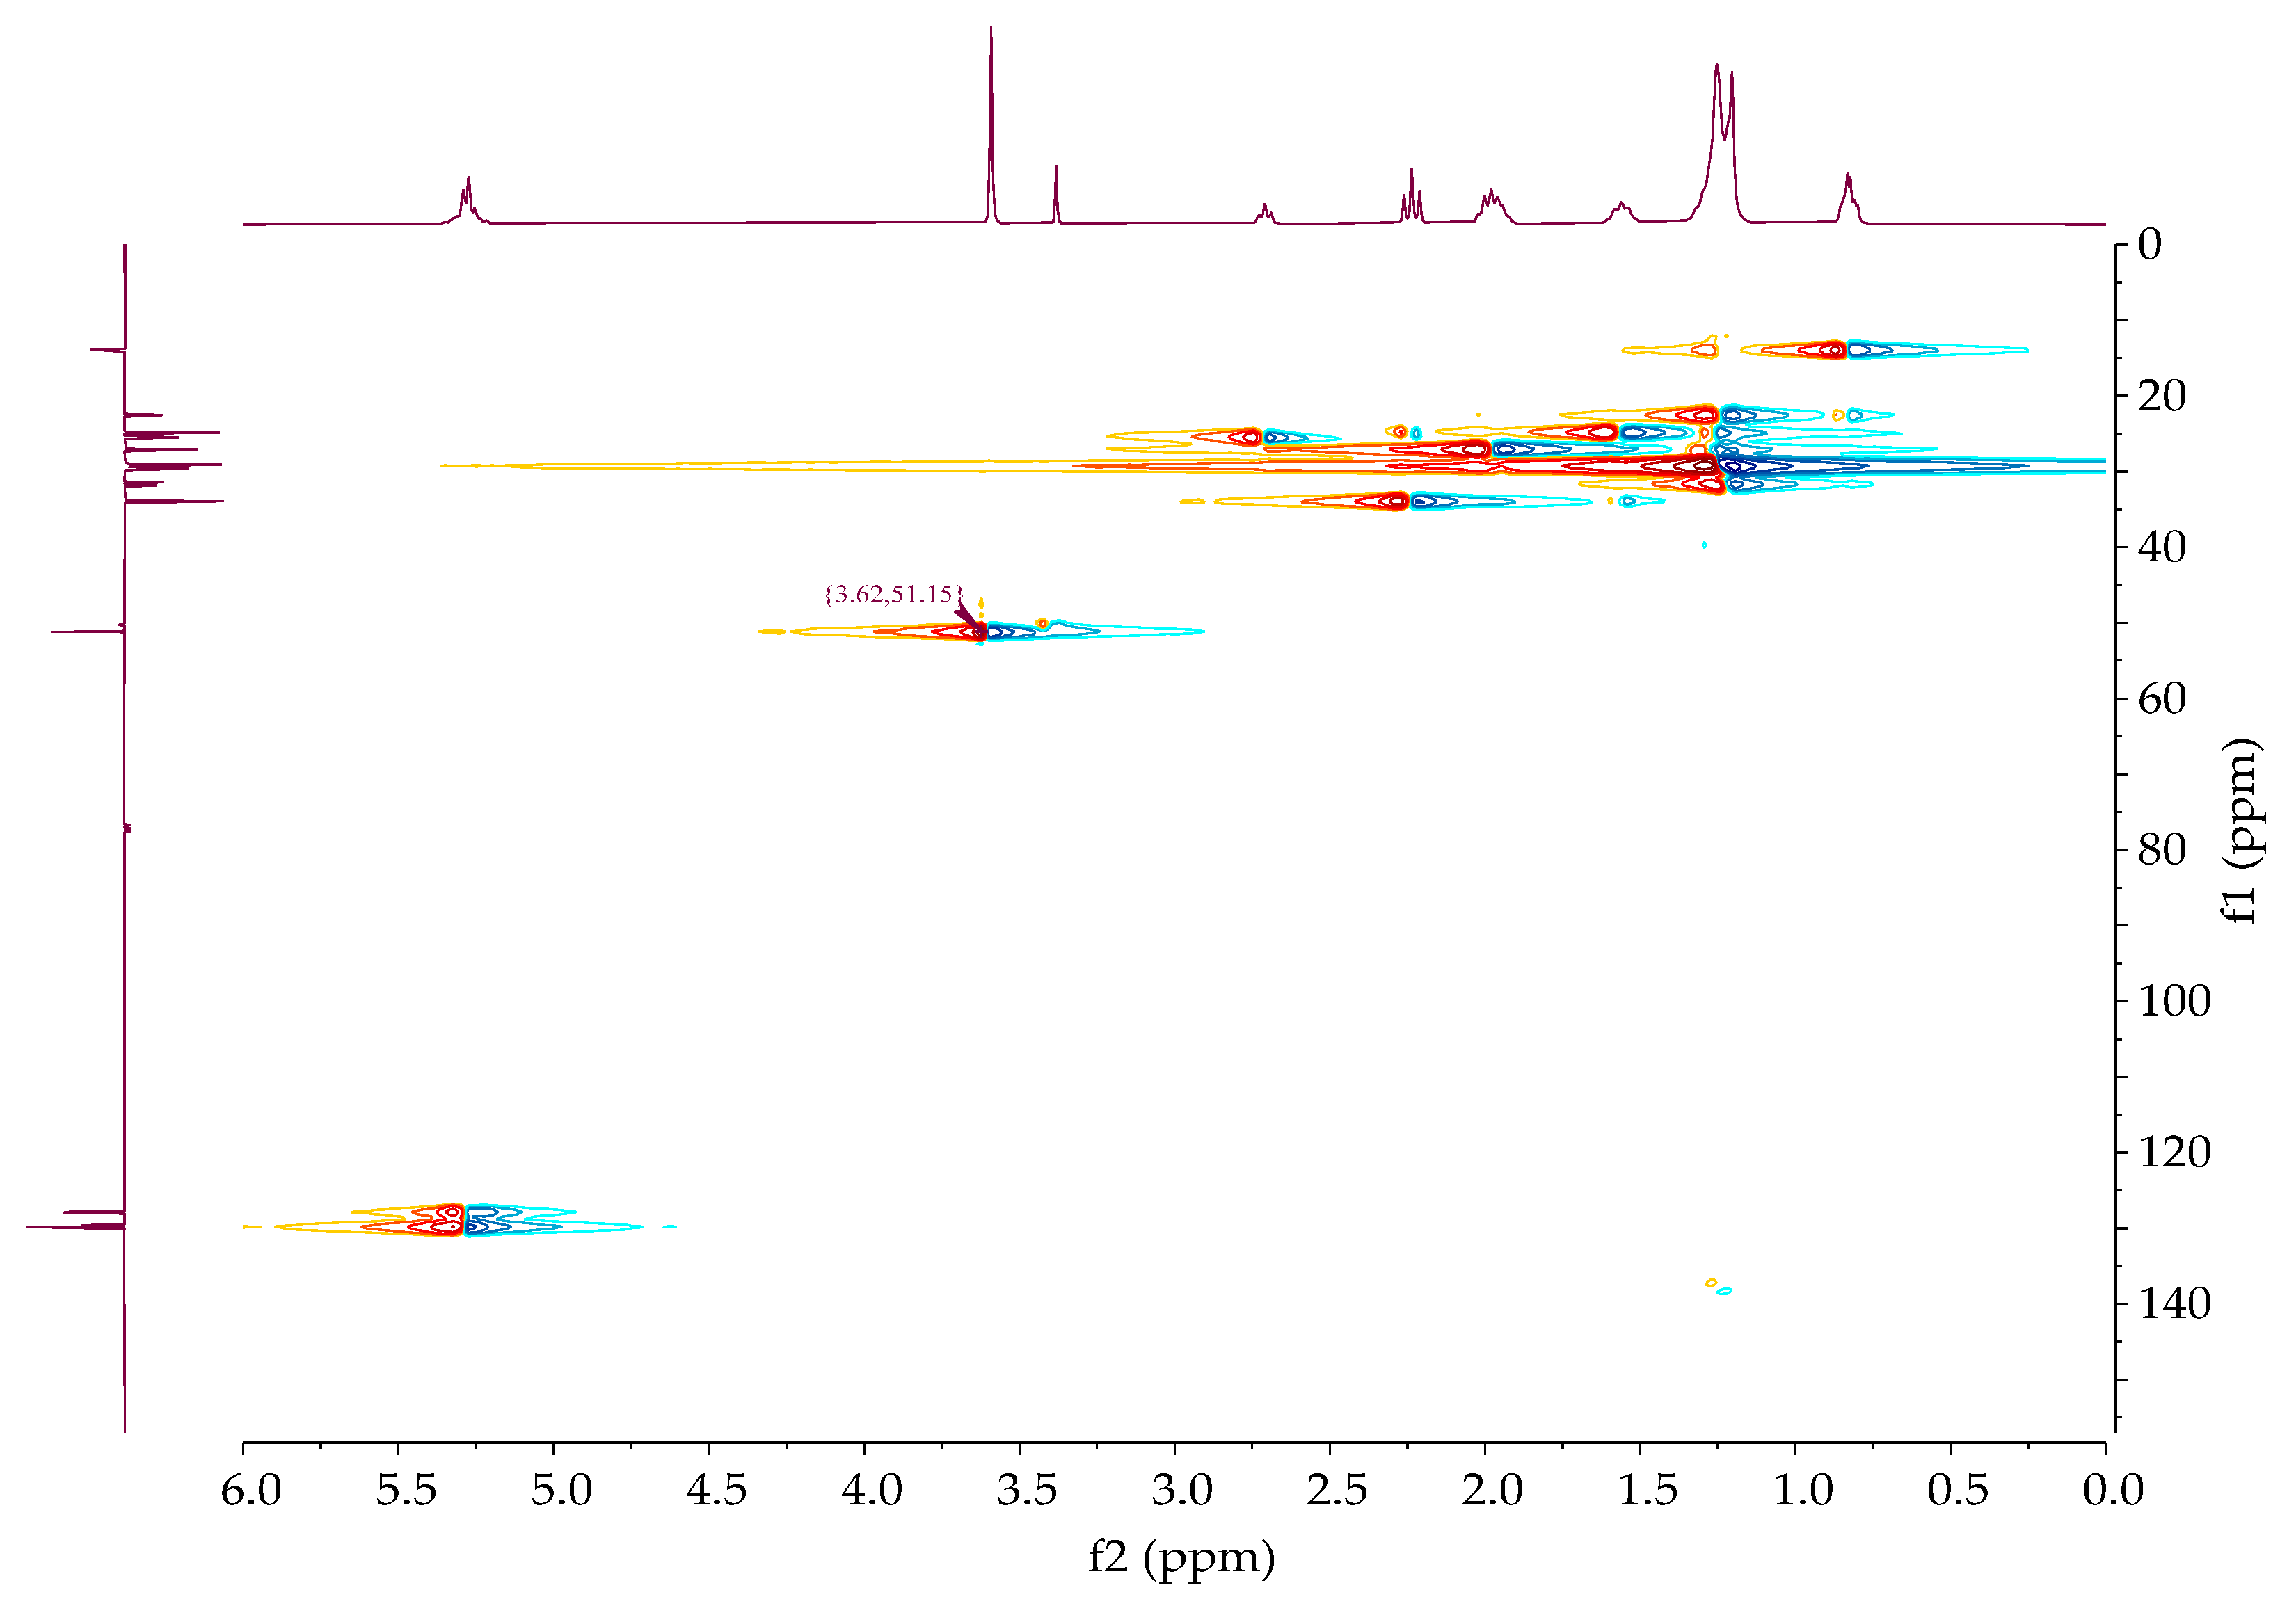
The chemical shifts of the proton and carbon NMR spectra of all samples were obtained by the combined use of one 1H, 13CAPT, and two-dimensional HMQC spectra according to the previously published data [23]. The proton spectra of the sample showed a signal that resonated at ~3.60 ppm, which was assigned to the methyl group of methanol, Figure 8. Methyl ester proton and carbon were found at 3.62 ppm and 51.15 ppm, respectively, Figure 10. The signal observed at 63.84 ppm indicates the presence of glycerol carbon atoms, Figure 9.
Concentrations (in mass fraction) of linoleic acid methyl ester, FAME, monoglycerides (MG), diglycerides (DG), triglycerides (TG), and free and total glycerol in crude biodiesel (BD) are 0.30, 96.9, 0.28, 0.06, <0.01, 0.13, and 0.21, respectively. Concentrations of linoleic acid methyl ester and triglycerides did not change during extraction. The results obtained by the GC analysis of purified biodiesels are presented in Table 7.
For all selected process conditions, concentration of glycerol was reduced. It was also observed that, at some process conditions, FAME, MG, and DG are also soluble in DES. The highest amount of glycerol was removed with steel plates and the highest DES to biodiesel mass flowrates ratio. At those conditions, the concentration of MG and DG was also reduced. For the PTFE plates of the same geometry, the highest reduction of glycerol was obtained at the highest pulsation rate. However, at those conditions, concentration of FAME was reduced below 96.5% (standard). Solubility of DG was also observed. The lowest extraction efficiency for plate C was obtained with the lowest DES to biodiesel mass flowrates ratio. When disperse phase flowrate was maintained constant, the flowrate of the continuous phase did not have an impact on the extraction efficiency for this type of plate. The increase in FAME and/or lower glyceride (MG and DG) content may be attributed to the transfer of glycerol from biodiesel to DES.
Higher pulsation rates may result in backmixing and consequently lower extraction efficiency [24]. Generally speaking, an increase in mixing intensity should produce a larger interphase surface area, which in turn enhances the rate of mass transfer. At larger volume fractions of the dispersed phase, in this case the solvent, a larger surface area for mass transfer is also formed. However, at some point there will be too many droplets and some of them will be in close contact, so the actual mass transfer area will be significantly smaller. Coalescence is also possible if the interfacial energy is low enough.
The presence of surface-active compounds in biodiesel strongly influences the droplet formation. Surfactants act as emulsifiers and dispersants by lowering the interfacial tension, which results in reduction of droplet size. Partial glycerides (monoglycerides, MG, and diglycerides, DG) are non-ionic surfactants [25], while fatty acids are anionic surfactants [26]. Biodiesel produced from waste cooking oil contains low concentrations of glycerides and free fatty acids as well as some other compounds transferred from food during frying.
As extraction proceeds, the compositions of both phases change, which in turn affects the mass transfer interface and mass transfer area. All compounds that were transferred from biodiesel to solvent change the composition of the solvent and thus influence the solubility of alcohols and FAME. Previous investigations proved that elements in traces, compounds present in biodiesel produced from waste coffee ground oil [10], and glycerides [27] are slightly soluble in the solvent used in this article.
To further put this work into the context of the existing literature, Table 8 lists all published experiments with the same DES. Shabaz et al. (2010) found that the optimal DES to palm oil biodiesel molar ratio for all synthesized DESs was 2.5:1, which corresponds to approximately 0.71:1 DES to biodiesel mass ratio, for the same DES as the one used in this investigation. The optimum DES to biodiesel molar ratio for the removal of total glycerol was 1:1, which corresponds to approximately 0.29:1 DES to biodiesel mass ratio. When biodiesels were produced from different types of animal fats and subjected to purification with the same DES, the authors concluded that when batch extraction was conducted at an elevated temperature (50 °C), free glycerol content was reduced below the standard (EN 14214) specification [27]. Extraction efficiency was higher for lower initial glycerol concentration and higher extraction temperature. Petračić et al. investigated the influence of the batch process conditions (extraction time, initial glycerol concentration, mixing rate, and DES to biodiesel mass ratio) as well as the influence of the pulsation rates in the continuous Karr column on the extraction efficiency of glycerol and glycerides from biodiesels synthesized from fresh and used sunflower oils. The optimal DES to biodiesel mass flow rate for batch experiments was found to be 0.50:1 when the concentration of glycerol was reduced below 0.02%. Biodiesel purified in the Karr column at a mixing intensity equal to 0.072 m s−1 satisfied the quality standard. The higher extraction efficiency of continuous extraction was attributed to the larger DES to biodiesel mass ratio. Extraction of glycerides was also observed [9]. Batch and continuous extraction of glycerol from biodiesel synthesized from waste coffee ground oils was compared by Sander et al. The free glycerol content of biodiesels purified in the Karr column meets the quality standard. Again, the higher DES to biodiesel mass ratio used in the continuous process resulted in higher extraction efficiency [10]. Šalić et al. investigated the use of DESs in a microreactor and compared their extraction efficiency to wet washing, with biodiesels from sunflower oil and household waste cooking oil. They used the same DES as in this work and several DESs with choline chloride and glycerol, both with and without water. Their results showed that far less DES was needed when compared to water and that DESs were very efficient at reducing free glycerol content. In their work, DESs with glycerol were found to be even more efficient than DES with ethylene glycol [8]. It may be that the increased viscosity of the glycerol DES influences hydrodynamics in a microreactor in a different way than when used on a macro scale. Critical analysis of all published data regarding the extraction of glycerol and glycerides leads to the following conclusions: (1) initial glycerol content, feedstock chemical composition, and temperature influence the extraction efficiency of glycerol and glycerides; (2) higher DES to biodiesel mass ratio in the continuous column should be used to enhance the extraction efficiency of glycerol; (3) hydrodynamic conditions show a greater influence for continuous processes.
Continuous processes offer several advantages over batch processes. They provide consistent and uninterrupted production, leading to higher efficiency and throughput. Additionally, they enable real-time monitoring and control, facilitating rapid adjustments to optimize product quality and resource utilization.
The feedstock used in this investigation had a small initial amount of glycerol and the DES to biodiesel mass ratio was significantly smaller than for other continuous experiments found in the literature, which may explain lower glycerol extraction efficiency due to a lower mass transfer driving force.

4. Conclusions

The experimental work in this article included batch and continuous liquid–liquid extraction of glycerol and glycerides from crude biodiesels obtained from two waste cooking oils. Choline–chloride-based DES was used as a selective solvent. Prior to proceeding with continuous experiments, all the samples were analyzed. Based on the physical and surface properties of the phases, biodiesel was selected as the continuous phase. Three different plates (A, B, and C) made from steel (A) and PETG (B and C, where C had a different hole arrangement than A and B) were used to investigate the influence of the material and hole arrangement, keeping the free surface area constant. Hydrodynamic conditions and DES to BD mass ratios were also varied to better understand their influence.
Considering the droplet size distribution and the extraction efficiencies, the best overall results were obtained with steel plates (A), at the highest DES to BD mass ratio. In general, hydrodynamic conditions and DES to BD mass ratio played the greatest role in affecting extraction efficiency.
Since the content of free glycerol is slightly below the quality standard for biodiesel, more work on the process conditions is needed. Further work on this column will also include biodiesels of varying qualities.

Supplementary Materials

The following supporting information can be downloaded at https://www.mdpi.com/article/10.3390/separations11030071/s1. Figure S1: Column photographs of three experiments with plates A, B, and C; Figure S2: 1H NMR spectra of biodiesel 1—influence of the mixing rate; Figure S3: 1H NMR spectra of biodiesel 1—influence of DES to BD ratio. Table S1: Droplet size characteristic diameters and specific surface areas.

Author Contributions

Conceptualization, A.S. and A.P.; methodology, A.S., A.P. and D.V.; formal analysis, A.S., A.P., D.V. and J.P.V.; investigation, A.P., P.H. and A.J.; resources, A.S. and A.P.; data curation, A.S.; writing—original draft preparation, A.S.; writing—review and editing, A.S., A.P. and D.V.; visualization, A.S.; supervision, A.S. All authors have read and agreed to the published version of the manuscript.

Funding

This research was funded under the auspices of the European Regional Development Fund, Operational Programme Competitiveness and Cohesion 2014–2020 (project number KK.01.1.1.04.0070).

Data Availability Statement

Data is contained within the article and Supplementary Materials.

Conflicts of Interest

The authors declare no conflicts of interest.

References

  1. Abbott, A.P.; Cullis, P.M.; Gibson, M.J.; Harris, R.C.; Raven, E. Extraction of Glycerol from Biodiesel into a Eutectic Based Ionic Liquid. Green Chem. 2007, 9, 868. [Google Scholar] [CrossRef]
  2. Li, Z.; Cui, Y.; Shen, Y.; Li, C. Extraction Process of Amino Acids with Deep Eutectic Solvents-Based Supported Liquid Membranes. Ind. Eng. Chem. Res. 2018, 57, 4407–4419. [Google Scholar] [CrossRef]
  3. Mitar, A.; Prlić Kardum, J. Intensification of Mass Transfer in the Extraction Process with a Nanofluid Prepared in a Natural Deep Eutectic Solvent. Chem. Eng. Technol. 2020, 43, 2286–2294. [Google Scholar] [CrossRef]
  4. Lee, Y.R.; Row, K.H. Green Synthesis of Methyl Palmitate as the Biodiesel by Deep Eutectic Solvent for Esterification Reaction. In Proceedings of the European Biomass Conference and Exhibition Proceedings, Amsterdam, The Netherlands, 6–9 June 2016; Volume 2016, pp. 1316–1317. [Google Scholar]
  5. Fernández, A.; González, L.; Álvarez, M.S.; Deive, F.J. Suitability of Non-Conventional Reaction Medium for Biocatalysis: From Lipase Activity to Thermophysical Characterization. J. Mol. Liq. 2021, 322, 114960. [Google Scholar] [CrossRef]
  6. Shahbaz, K.; Mjalli, F.S.; Hashim, M.A.; ALNashef, I.M. Using Deep Eutectic Solvents for the Removal of Glycerol from Palm Oil-Based Biodiesel. J. Appl. Sci. 2010, 10, 3349–3354. [Google Scholar] [CrossRef]
  7. Bačić, M.; Ljubić, A.; Gojun, M.; Šalić, A.; Tušek, A.J.; Zelić, B. Continuous Integrated Process of Biodiesel Production and Purification—The End of the Conventional Two-Stage Batch Process? Energies 2021, 14, 403. [Google Scholar] [CrossRef]
  8. Šalić, A.; Jurinjak Tušek, A.; Gojun, M.; Zelić, B. Biodiesel Purification in Microextractors: Choline Chloride Based Deep Eutectic Solvents vs Water. Sep. Purif. Technol. 2020, 242, 116783. [Google Scholar] [CrossRef]
  9. Petracic, A. Separation of Free Glycerol and Glycerides from Biodiesel by Means of Liquid-Liquid Extraction. Sci. J. Energy Eng. 2017, 5, 87. [Google Scholar] [CrossRef]
  10. Sander, A.; Petračić, A.; Parlov Vuković, J.; Husinec, L. From Coffee to Biodiesel—Deep Eutectic Solvents for Feedstock and Biodiesel Purification. Separations 2020, 7, 22. [Google Scholar] [CrossRef]
  11. Karr, A.E. Design, Scale-Up, and Applications of the Reciprocating Plate Extraction Column. Sep. Sci. Technol. 1980, 15, 877–905. [Google Scholar] [CrossRef]
  12. Zhang, J.; Li, W.; Mumford, K.A.; Fei, W.; Stevens, G.W.; Wang, Y. Mass Transfer Study and Combined Model for a Karr Column. Chem. Eng. Sci. 2022, 254, 117581. [Google Scholar] [CrossRef]
  13. Christo, R.; Shen, S.; Stevens, G.W. Effect of Plate Material on Dispersed-Phase Holdup in a Karr Reciprocating Plate Column. Solvent Extr. Ion Exch. 2011, 29, 800–822. [Google Scholar] [CrossRef]
  14. Jackson, S.C.; Skaf, D.W. Implementing a KARR® Extraction Column in the Unit Operations Lab. Educ. Chem. Eng. 2020, 32, 95–101. [Google Scholar] [CrossRef]
  15. Kumar, A.; Hartland, S. Unified Correlations for the Prediction of Drop Size in Liquid−Liquid Extraction Columns. Ind. Eng. Chem. Res. 1996, 35, 2682–2695. [Google Scholar] [CrossRef]
  16. Harvie, A.J.; Herrington, J.O.; DeMello, J.C. An Improved Liquid–Liquid Separator Based on an Optically Monitored Porous Capillary. React. Chem. Eng. 2019, 4, 1579–1588. [Google Scholar] [CrossRef]
  17. Panahinia, F.; Ghannadi-Maragheh, M.; Safdari, J.; Amani, P.; Mallah, M.-H. Experimental Investigation Concerning the Effect of Mass Transfer Direction on Mean Drop Size and Holdup in a Horizontal Pulsed Plate Extraction Column. RSC Adv. 2017, 7, 8908–8921. [Google Scholar] [CrossRef]
  18. Samios, D.; Pedrotti, F.; Nicolau, A.; Reiznautt, Q.B.; Martini, D.D.; Dalcin, F.M. A Transesterification Double Step Process-TDSP for Biodiesel Preparation from Fatty Acids Triglycerides. Fuel Process. Technol. 2009, 90, 599–605. [Google Scholar] [CrossRef]
  19. EN 14214:2019; Committee for Standardization Automotive Fuels—Fatty Acid Methyl Esters (FAME) for Diesel Engines—Requirements and Test Methods. European Committee for Standardization: Brussels, Belgium, 2019.
  20. Pretsch, E.; Bühlmann, P.; Affolter, C. Structure Determination of Organic Compounds: Tables of Spectral Data; Springer: Berlin/Heidelberg, Germany, 2000; ISBN 9783540938095. [Google Scholar]
  21. Deepayan, P.; Karar, P.K. Utilising FTIR and Gas Chromatograph for Optimizing Lipid Extraction for Biodiesel Production from Domestic Sewage Sludge and Food Waste. Res. J. Chem. Environ. 2017, 21, 26–36. [Google Scholar]
  22. Danish, M.; Mumtaz, M.W.; Fakhar, M.; Rashid, U. Response Surface Methodology Based Optimized Purification of the Residual Glycerol from Biodiesel Production Process. Chiang Mai J. Sci 2017, 44, 1570–1582. [Google Scholar]
  23. Doudin, K.I. Quantitative and Qualitative Analysis of Biodiesel by NMR Spectroscopic Methods. Fuel 2021, 284, 119114. [Google Scholar] [CrossRef]
  24. Stella, A.; Pratt, H.R.C.; Mensforth, K.H.; Stevens, G.W.; Bowser, T. Backmixing in Karr Reciprocating-Plate Extraction Columns. Ind. Eng. Chem. Res. 2006, 45, 6555–6562. [Google Scholar] [CrossRef]
  25. Sharma, K.; Negi, S.; Thakur, N.; Kishore, K. Partial Glycerides-an Important Nonionic Surfactant for Industrial Applications: An Overview. J. Biol. Chem. Chron. 2017, 3, 10–19. [Google Scholar]
  26. Johansson, I.; Svensson, M. Surfactants Based on Fatty Acids and Other Natural Hydrophobes. Curr. Opin. Colloid Interface Sci. 2001, 6, 178–188. [Google Scholar] [CrossRef]
  27. Sander, A.; Antonije Košćak, M.; Kosir, D.; Milosavljević, N.; Parlov Vuković, J.; Magić, L. The Influence of Animal Fat Type and Purification Conditions on Biodiesel Quality. Renew. Energy 2018, 118, 752–760. [Google Scholar] [CrossRef]
Figure 1. Geometry of the pulsation plates column and plates: (a) stainless steel (plate A) and PETG (plate B); (b) PETG (plate C).
Separations 11 00071 g001
Figure 2. Influence of the pulsation rate on Sauter mean diameter, d32, and surface area, a, (m(DES)/m(BD2) = 0.24).
Separations 11 00071 g002
Figure 3. Influence of DES to BD2 mass flowrate ratio on the maximum droplet size (Af = 0.02 ms−1).
Separations 11 00071 g003
Figure 4. 1H NMR spectra of biodiesel 1—influence of extraction time (n = 800 rpm; m(DES)/m(BD) = 0.25).
Separations 11 00071 g004
Figure 5. 1H NMR spectra of biodiesel 1—influence of extraction time (Af = 0.027 m/s; m(DES)/m(BD) = 0.32).
Separations 11 00071 g005
Figure 6. 1H NMR spectra of biodiesel 1—influence of agitation rate and DES to biodiesel mass ratio (t = 25 min).
Separations 11 00071 g006
Figure 7. FTIR spectra of biodiesel 2 (plate A, φV = 0.2; Af = 0.02 m/s).
Separations 11 00071 g007
Figure 8. 1H NMR spectrum of biodiesel 2 (Af = 0.013 m/s; m(DES)/m(BD) = 0.24).
Separations 11 00071 g008
Figure 9. 13C NMR spectrum of biodiesel 2 (Af = 0.013 m/s; m(DES)/m(BD) = 0.24).
Separations 11 00071 g009
Figure 10. 2D HMQC NMR spectrum of biodiesel 2 (Af = 0.013 m/s; m(DES)/m(BD) = 0.24).
Separations 11 00071 g010
Table 1. Physical properties of phases.
ChemicalManufacturerCAS Number
Methanol, HPLC gradeJ.T.Baker67-56-1
Potassium hydroxide, p.a.Kemika1310-58-3
Choline chloride, 99%Acros Organics67-48-1
Ethylene glycol, p.a.Lach-Ner107-21-1
Table 2. Physical properties of phases.
Phaseρ, kg m−3μ, Pa sσ, mN m−1γ (DES/BD), mN m−1
DES1117.060.035543.74
Biodiesel 1876.790.003927.800.17
Biodiesel 2878.250.004326.3614.96
Table 3. Contact angle and surface free energy, γ, of steel and PETG.
OW (mJ m−2)Wu (mJ m−2)AB (mJ m−2)
WaterFA 1DIMγγdγpγγdγpγγdγAγB
Steel77.472.854.633.026.36.737.128.38.831.531.50.011.8
PETG74.749.631.346.241.64.649.340.48.945.843.70.26.7
1 formamide.
Table 4. Contact angles, θ, of both phases on steel and PETG.
PhaseSteel PETG m−1
θ (90 ms), °θ (2000 ms), °θ (90 ms), °θ (2000 ms), °
DES83.063.777.658.2
Biodiesel 263.47.544.517.9
Table 5. Concentration of FAME in biodiesel 1 purified in batch extractor.
n, rpmt, minm(DES)/m(BD)% FAMEA(Me)/A(OH)
400300.2595.203.31
600300.2595.576.88
800150.2598.199.90
300.2598.609.99
300.5097.3012.18
300.7597.0919.23
301.0098.3427.23
450.2597.0411.94
600.2598.0914.01
1000300.2598.269.26
Table 6. Concentration of FAME in biodiesel 1 purified in Karr column—plate A.
φD, %m(DES)/m(BD)Af, m s−1t, min% FAMEA(Me)/A(OH)
20.00.320.027598.551.29
1598.123.14
2597.116.18
20.00.320.040597.531.37
1597.154.29
2596.886.59
33.30.640.027596.781.53
1596.788.61
2596.9211.68
Table 7. Data obtained by GC and 1H NMR for biodiesel 2.
PlateφD, %m(DES)/m(BD)Af, m s−1FAME, %MG, %DG, %Free Gly, %Total Gly, %A(Me)/A(OH)
A15.80.240.01396.50.290.060.1050.1886.47
15.80.240.02095.50.300.060.0840.1698.13
15.80.240.02799.30.290.060.0990.1826.45
20.00.320.02096.80.290.050.0760.1574.94
25.00.420.02097.30.260.050.0360.1105.48
B15.80.240.01397.40.290.060.0920.1759.48
15.80.240.02097.80.280.060.0670.1476.45
15.80.240.02794.50.280.050.0630.1425.38
20.00.320.02098.50.290.060.0740.1578.19
25.00.420.02097.40.290.060.0750.1587.20
C15.80.240.02097.90.270.050.1200.1969.12
20.00.320.02099.10.270.050.0470.12310.44
25.00.420.02099.50.260.050.0480.1227.36
Table 8. Literature data for biodiesel purification by DES choline chloride–ethylene glycol (1:2.5, mol).
MethodFeedstockxinitial(FG 1), %m(DES)/m(BD)n, rpm or Af, m s−1xfinal(FG), %Ref.
BatchPalm oil0.040930.21–0 86200 rpm<0.005[6]
Animal fats0.349–3.0260.50–3.00500 rpm<0.005–1.210[26]
Sunflower oils0.659–1.9390.25–1.00150–700 rpm0.018–0.087[9]
Waste coffee ground oils0.748–1.6471.00500 rpm0.024–0.029[10]
Continuous—Karr columnSunflower oil1.9395.000.036–0.084 m s−1<0.005[9]
Waste coffee ground oil1.1071.400.048 m s−10.02[10]
Continuous—microreactorSunflower oil0.091:0.65 (vol. flow rate ratio)-0.01[8]
Waste cooking oil0.165-<0.05[8]
1 FG = free glycerol.
Disclaimer/Publisher’s Note: The statements, opinions and data contained in all publications are solely those of the individual author(s) and contributor(s) and not of MDPI and/or the editor(s). MDPI and/or the editor(s) disclaim responsibility for any injury to people or property resulting from any ideas, methods, instructions or products referred to in the content.

