Article

The Development of a High-Throughput Homonuclear Decoupling HSQC NMR Platform for the Determination of 10 Sex Hormones in Animal-Source Food and Medicines

1
Shandong Institute for Food and Drug Control, Jinan 250101, China
2
Pharmaceutical College, Shandong University of Traditional Chinese Medicine, Jinan 250355, China
3
The First Clinical School, Shandong University of Traditional Chinese Medicine, Jinan 250355, China
4
School of Pharmaceutical Science, Shandong University, Jinan 250012, China
5
Hebei Edible Bird’s Nest Fresh Stew Technology Innovation Center, Langfang 065700, China
*
Authors to whom correspondence should be addressed.
These authors contributed equally to this work.
Separations 2024, 11(11), 328; https://doi.org/10.3390/separations11110328
Submission received: 8 October 2024 / Revised: 11 November 2024 / Accepted: 15 November 2024 / Published: 18 November 2024
(This article belongs to the Section Chromatographic Separations)

Abstract

:
Owing to their endocrine disruption effect, the hormone levels in animal-source food and medicines need to be efficiently and accurately quantified by a reliable analytical method. In the current study, by using a homonuclear decoupling and heteronuclear single quantum correlation (HSQC) experiment, coupled with non-uniform sampling (NUS) that was used to shorten the experimental time, we developed a method to quantify 10 hormone residues in animal-source products. This method was validated following the guidelines of USP–NF 2022. The application of the homonuclear decoupling (HD) technique to conventional HSQC yielded 2D spectra that exhibited excellent signal separation and specificity. For all the tested hormones, good linearity with correlation coefficients of more than 0.99 was observed in the linear range of 0.2–6 mg/0.6 mL. Satisfactory precision and recoveries of spiked animal samples were also obtained. Finally, the method was applied in residue determination of 10 hormones in real animal-source samples at the ug/g level.

1. Introduction

Sex hormones, a group of chemical messengers produced and secreted by the glands that make up the endocrine system, play important roles in multiple physiological processes at low concentrations, such as osmoregulation, sexual maturity, immunity regulation, reproduction and stress responses, by interacting with specific cellular receptors and triggering a series of biological events [1,2]. Fluctuations in the concentration of sex hormones that travel through the bloodstream, caused either by disorders of the endocrine system or by abnormal intake from the environment, may lead to the occurrence of serious health problems, such as obesity, infertility, hypertension, and precocious puberty [3,4]. Environmental residual sex hormones have gained more and more public attention owing to their endocrine-disruptive effects and chemical persistence. In particular, hormone intake from daily consumption of animal products is a great concern in the field of public health, because of (i) the preferential accumulation of fat-soluble hormones in animal tissues and (ii) the application of growth-promoting hormones as drugs or feed additives in the process of animal breeding [5]. Therefore, strict regulations of hormone residue in animal-source products are executed in many countries and areas, such as China, New Zealand, Australia, Canada, and the United States [6]. To achieve effective regulatory supervision, it is necessary and urgent to develop reliable and efficient analytical methods for the detection and quantification of multiple low-dose hormones and their synthetic derivatives in animal products.
For a long period of time, hormones in blood or plasma have been routinely quantified by enzymatic immunoassay methods, taking advantage of their high throughput, rapid data processing, and low cost. However, low specificity hinders their widespread application [7]. In particular, most sex hormones and their synthetic derivatives share similar structures that are derived from the same parent structure of cholesterol. Their similar chemical structures and physicochemical properties make the analysis and discrimination by traditional analytical methods rather difficult. In addition, the complex biological matrix of animal products, as well as the great variations of the concentration levels of different hormones render the sample pretreatment a notoriously time-consuming task. Recently, analytical protocols based on liquid chromatography (LC) coupled with tandem mass spectrometry (MS/MS) detection and nuclear magnetic resonance (NMR) spectroscopy provide promising alternatives to immunoassays for their good selectivity and accuracy, as well as their ability to simultaneously analyze multiple components in complex biological matrices. In previous research, multiple LC-MS/MS methods have already been developed for the determination of steroid hormones in farmed fish, Antarctic krill, fathead minnows, Sphoeroides maculatus, and fish plasma [8,9,10,11]. Moreover, in China, a national standard of GB/T 21981 describes a series of LC-MS/MS analytical procedures to determine 50 kinds of hormone residues in foods of animal origin. Compared to LC-MS/MS, NMR has its own intrinsic advantages, such as the non-destructive analysis of samples and the availability of a variety of NMR pulse schemes that can satisfy specific requirements of structural analysis [12,13,14]. Despite the above-mentioned advantages, the application of NMR spectroscopy is still lacking in the quantification of hormones, which may be attributed to its low sensitivity and severe peak overlaps in their 1D NMR spectra. Heteronuclear single quantum coherence (HSQC) is a 2D NMR method that integrates the sensitivity of 1H and the resolution of 13C by extending 1D 1H NMR signals to 2D 1H-13C HSQC cross peaks along the 13C dimension, offering an excellent solution to the peak overlaps and allowing the dispersed peak intensities to be determined accurately for quantitative analysis. Although compared to 1D NMR experiments, HSQC usually takes a longer running time, but by coupling it with multiple techniques, such as non-uniform sampling (NUS), acceleration by sharing adjacent polarization (ASAP) and the excitation of selective bands, the measure time can be reduced to a few minutes [15,16,17]. Up to now, HSQC has already been successfully used in the differentiation and quantification of a variety of components that share similar chemical structures in different complex samples, such as 12 lignans in Sambucus williamsii, epoxide formation in oil and mayonnaise, four 11-α-hydroxy-mogrosides in Siratia grosvenorii, 16 sesquiterpene pyridine alkaloids in Tripterygium wilfordii, the ratio between aloin A and B in Aloe vera and Aloe ferox samples, and three sennosides in the leaves of Senna alexandrina [18,19,20,21,22,23].
The current work aimed at developing an analytical method for the simultaneous quantification of a series of sex hormones in animal products. A total of 10 representative sex hormones were used, of which the application in animal food and drugs is prohibited according to the regulations of animal breeding in China, including one estrogen, three progesterone and six androgens. The method involved extraction with methanol combined with sonication, followed by the HSQC experiment. First, HSQC cross peaks for each hormone were assigned, and signals with good specificity and separation were used for subsequent quantification. The linearity range, precision and recovery of the method were then validated according to the guidelines of USP–NF 2022 [24]. Finally, the established method was applied for the quantification of the ten sex hormones in bird’s nest, Colla corii asini, chicken gizzard membrane, propolis, gecko and oyster.

2. Materials and Methods

2.1. Materials

Testosterone (GT), Testosterone propionate (GWS), Progesterone (HTT), Methyltestosterone (JGT), Metandienone (MXT), Nandrolone (NL), Hydroxyprogesterone (QYT), Androstenedione (XXET), Diethylstilbestrol (YXCF), and Levonorgestrel (ZQNYT) were all purchased from the Sigma-Aldrich (St Louis, MO, USA). Their chemical structures are listed in Figure 1. The solvent selection was deuterated dimethyl sulfoxide (DMSO-d6, 99.9 atom D%, Sigma-Aldrich). Bird’s nest, Colla corii asini, chicken gizzard membrane, propolis, gecko and oyster were purchased from a traditional Chinese medicine market in Bozhou, Anhui province, China.

2.2. Samples and Standards Preparation

The dried materials were first grinded into a powder and subjected to an 80-mesh sieve to obtain a homogeneous powder, which was then subjected to an ultrasound-assisted extraction with methanol (20 g/10 mL) at 100 W for 30 min at 25 °C. The supernatant of the extract, obtained by centrifugation, was dried using a parallel evaporator under vacuum. To prepare the NMR samples, each dried sample was dissolved in 700 μL of DMSO-d6 containing 0.05% tetramethylsilane (TMS, v/v), followed by a vortex for 15 min and filtration to get rid of solid particles. The resultant filtrate (600 μL) was transferred to a 5 mm NMR tube for the following measurements. Stock standard solutions (6 mg/mL) were prepared by weighing and dissolving each chemical in DMSO-d6.

2.3. NMR Parameters and Experiments

The HSQC experiments were recorded using a 600 MHz BRUKER-AV600 spectrometer equipped with a 5 mm BBO probe. The NMR samples were equilibrated prior to acquisition at 298.0 K for at least 5 min inside the spectrometer. The following parameters were used for the experiment. The pulse sequence for HSQC was phase-sensitive hsqcedetgpsisp2.3_bbhd. The number of collected data points was 4096 and 256 for the 1H and 13C channel, respectively. The acquisition time was set to 0.262 s, and the increment delay was 40.2 μs. A 25% level of NUS was performed to shorten the measurement time by recording only a randomly distributed portion of data points, with the missing data points being added after the measurement by reconstruction algorithms. The total acquisition time for this HSQC experiment was about 30 min. The homonuclear decoupling scheme was coupled with HSQC to simplify the spectra. The manual phase correction and automatic baseline correction were applied. The integration of 2D peak volumes was performed using the integration routine in the Bruker software TopSpin version 4.1.2. All the integration results are the average of three experiments.

2.4. Method Validation

A quantitative analysis was performed using the absolute integrals of the HSQC cross peaks of the standard samples. The analytical performance parameters of the method, including selectivity, linearity range, precision, as well as recovery, were validated [25,26]. The specificity was evaluated by analyzing the hormone mixture dissolved in DMSO-d6 in a single HSQC experiment. The 2D cross peaks were then assigned based on the standard spectra. The resolution, intensity, and interference of the signals assigned for different hormones were investigated and compared. Through the obtained results, HSQC signals with good specificity were selected and applied for subsequent linearity analysis.
The hormone mixture with concentrations in the range of 0.2–6 mg/0.6 mL were prepared for linearity analysis and their HSQC spectra were recorded. The analytical curve was obtained containing 6 points, with each point analyzed in triplicate. The standard curves were then constructed by plotting the peak volume of selected quantitative signals on the y-axis for each analyte versus the concentration on the x-axis. Finally, the regression equations and coefficients of determination (R2) for these analytes were calculated.
The precision, expressed as the relative standard deviation (%RSD), and the recovery of the method were assessed by conducting repeated experiments using the samples spiked at the concentration of 2 mg/0.6 mL in bird’s nest, which has been shown by the LC-MS/MS method to be free of the 10 sex hormones and was selected as a blank sample. Each sample was analyzed 3 times on 3 consecutive days under the same analytical conditions. For the recovery, an appropriate amount of standards (2 mg) was accurately added to the analyte samples (20 g), and then six test solutions were prepared in parallel according to the spectral conditions. The content of each component was calculated by the external standard method and the recovery was calculated as below: recovery (%) = {(amount found − original amount)/amount spiked} × 100%.

3. Results and Discussion

3.1. Method Development

Based on the LC/MS-MS method described by our collaborator, which can detect as many as 115 hormones simultaneously using non-targeted approaches, the residual hormones in the six animal products (three batches for each) were initially analyzed. The result showed that testosterone was detected in chicken gizzard membrane (two batches), propolis (one batch) and oyster (one batch), while 17-methyltestosterone was found in propolis (two batches) and oyster (two batches) (Supporting Table S1). In Bird’s nest, Colla corii asini, and gecko, no hormone was detected. However, none of the hormones were absolutely quantified. The aim of the present study was to directly determine the concentration of 10 sex hormones in animal-source products using a quantitative HSQC experiment, thus providing an alternative and more comprehensive method for their quality evaluation.
To achieve the purpose, a series of NMR samples were first prepared by mixing the ten standard solutions, and their NMR spectra were recorded. Except for Diethylstilbestrol, all tested hormones were derived from cholesterol, so severe signal overlap in the regions δH 0.4–2.8 ppm and δC 10.0–70.0 ppm on the 1D spectrum were unsurprisingly observed. In the 2D HSQC spectrum, the resolution was significantly improved. To further reduce the signal crowding and improve the efficiency, the HSQC pulse program was optimized. NUS, an NMR technique which records only a randomly distributed portion of data points, combined with subsequent appropriate data reconstruction algorithms, as reported, has been successfully employed in the quantitative analysis of active lignans in Sambucus williamsii and linear low-density polyethylene [20]. It turned out that, in the current study, with an NUS rate of 25% and subsequent linear prediction, the experiment time was reduced to less than an hour while preserving the signal intensity. Additionally, suppression of homonuclear J-coupling enabled the production of clean and ambiguous singlet peaks, further significantly simplifying the spectroscopy assignment (Figure S1) [27,28]. As a result, in the 2D HSQC spectrum of the hormone mixture, a large number of cross peaks (δC 70 to 40 ppm), the signals which strongly overlapped in the 1D 1H NMR spectrum, were well-resolved from each other, rendering both peak assignment and quantification for each analyte possible. Based on the chemical shift, nearly all the signals were assigned to the 10 sex hormones, among which the signals of the Diethylstilbestrol were obviously separated from those of others because of its characteristic symmetrical structure of phenol (Figures S2–S11, Table S2). Several representative signals that were well-separated from others were selected for further linear analysis of each analyte (Figure 2). The analysis of the mixed samples for the HSQC spectra revealed the presence of two to five characteristic peaks for each molecule. These peaks were successfully distinguished from other peaks and matrix signals and were suitable for quantitative analysis. Subsequently, based on a selection of factors such as data processing and the regression equation R2, one characteristic peak for each compound was identified as a quantitative integration peak, which is indicated with an asterisk in Table 1.

3.2. Method Validation Results

For the validation of linearity, the calibration curves for the selected signals from each hormone were constructed by plotting the HSQC absolute signal strength versus the concentration in the range of 0.2–10 mg/0.6 mL. As shown in Table 1, all the calibration curves exhibited excellent linearity with regression coefficients (R2) greater than 0.993. To perform subsequent validation, one signal that exhibits the best separation and specificity for each hormone was selected. Correspondingly, their calibration curves were obtained and shown to be straight lines (Figure 3). The validation results demonstrated that the %RSD values were consistently below 5.78% in all samples, and the mean absolute recoveries of 10 hormones in all the samples were in the range of 101.6% to 106.6%, with %RSD values lower than 3.72% (Table 2). To summarize, the validation results indicated that the established analytical method performed well under our experimental conditions.

3.3. Quantification of 10 Sex Hormones in Animal-Source Products

The validated method was applied to determine the levels of 10 sex hormones in six animal-source products. For each sample, a total of five batches (20 g each) were selected and treated according to the procedures described previously. The residue concentration of each hormone in the products is shown in Table 3. An analysis of the results revealed that in all the batches of bird’s nest, Colla corii asini and gecko, none of the 10 hormones were detected. Testosterone was the most frequently detected hormone, found in four batches of chicken gizzard membrane, one batch of propolis and three batches of oyster, followed by methyltestosterone, found in two batches of chicken gizzard membrane and three batches of oyster. Metandienone was found to be only existed in two batches of propolis, while the other hormone has not been detected in any sample. Testosterone, methyltestosterone, and metandienone belong to androgen, which plays an important role in promoting the maturation and development of male reproductive organs and maintaining their normal functions. As previously described, propolis and oyster can ameliorate reproductive toxicity and enhance semen quality in vivo, by reducing testicular oxidative damage and boosting testosterone production, etc. [29,30]. The addition of androgen in animal-source product is prohibited, and therefore their detection in the commercial samples should rise deep concerns for the safety and efficacy of Chinese medicine products. In terms of chicken gizzard membrane, it is a traditional Chinese medicine obtained from chicken, for which the application of hormones in the breeding process for multiple purpose has been reported. Since testosterone is also an endogenous sex hormone secreted by chicken, it is uncertain about the origins of the residues [31]. In conclusion, sex hormone levels in the animal-source products depend on multiple factors, and thus, comprehensive investigation is necessary to establish the criterion for the safety assessment.

4. Conclusions

In the current study, a cheap, simple, efficient and high-throughput analytical method was established and validated for the simultaneous quantification of 10 sex hormones in bird’s nest, Colla corii asini, chicken gizzard membrane, propolis, gecko and oyster, six animal-source food and medicines. The HSQC experiment was optimized in the aspects of resolution and running time, by coupling it with HD and NUS, respectively. The resultant 2D HSQC spectra achieved satisfactory efficiency, separation, and sensitivity, as well as specificity for the analysis of 10 sex hormones. The method was then applied to the analysis of 30 batches of real samples. The results showed that three androgens, including testosterone, methyltestosterone and metandienone, were detected in some batches of chicken gizzard membrane, propolis, and oyster, but none of the 10 sex hormones have been found in bird’s nest, Colla corii asini, and gecko. It is indicated that the modified HSQC experiment is a promising means for routine screening and quantitative analysis of multiple structurally similar sex hormones in animal-source products. Since the identification is made in a limited number of samples, the current study can be considered a preliminary study, and more samples will be included in the future to further prove its applicability. In the future, with some modifications in either the sample preparation process or the experimental parameters, the method should also be applicable to other animal-source products.

Supplementary Materials

The following supporting information can be downloaded at: https://www.mdpi.com/article/10.3390/separations11110328/s1, Figure S1. The resolution of 2D HSQC spectra of the hormone mixture was greatly improved by a homonuclear decoupling technique. (A): the spectra of heteronuclear single quantum correlation, pulse sequence: hsqcetgpsi2. (B): the spectra of homonuclear decoupling heteronuclear single quantum correlation coupled with non-uniform sampling; pulse sequence: hsqcedetgpsisp2.3_bbhd; Figure S2. The NMR assignment for testosterone in the HSQC spectrum; Figure S3. The NMR assignment for testosterone propionate in the HSQC spectrum; Figure S4. The NMR assignment for progesterone in the HSQC spectrum; Figure S5. The NMR assignment for methyltestosterone in the HSQC spectrum; Figure S6. The NMR assignment for metandienone in the HSQC spectrum; Figure S7. The NMR assignment for nandrolone in the HSQC spectrum; Figure S8. The NMR assignment for hydroxyprogesterone in the HSQC spectrum; Figure S9. The NMR assignment for androstenedione in the HSQC spectrum; Figure S10. The NMR assignment for diethylstilbestrol in the HSQC spectrum; Figure S11. The NMR assignment for levonorgestrel in the HSQC spectrum; Table S1. The detection of 115 hormones in animal-source food and medicines using LC-MS; Table S2. The NMR assignment for the hormones in the HSQC spectrum (in ppm).

Author Contributions

B.W. and Q.-Z.L.: laboratory work, analysis of data, and writing—original draft preparation; J.-Y.Y., Y.-J.D., N.-S.L., W.-L.C., M.Y., Y.Z. and J.-Q.W.: analysis of data and writing—original draft preparation; D.-L.W.: laboratory work, supervision and writing—reviewing and editing. S.-Q.W.: laboratory work, funding acquisition, analysis of data, writing, and project administration. All authors contributed to the writing and review of the article. All authors have read and agreed to the published version of the manuscript.

Funding

This research was funded by the Shandong Province Major Scientific and Technological Innovation Project (2021CXGC010511), and the National Key R&D Program of China (2023YFC3504102); it was supported by the Natural Science Foundation of Shandong Province of China (ZR2022MH224), the Program of Shandong University (2018WLJH93), and the Instrument Improvement Funds of the Shandong University Public Technology Platform (TS20220206).

Data Availability Statement

All data is contained within the article.

Conflicts of Interest

The authors declare no conflicts of interest. Authors Man Yuan, Yong Zhang, Jing-Qi Wang, Dong-Liang Wang were employed by the company Hebei Edible Bird’s Nest Fresh Stew Technology Innovation Center, Xiaoxiandun Bazhou Food Co., LTD., Langfang 065700, China. The remaining authors declare that the research was conducted in the absence of any commercial or financial relationships that could be construed as a potential conflict of interest.

References

  1. Lösel, R.; Wehling, M. Nongenomic actions of steroid hormones. Nat. Rev. Mol. Cell Biol. 2003, 4, 46–56. [Google Scholar] [CrossRef] [PubMed]
  2. Wehling, M. Specific, nongenomic actions of steroid hormones. Annu. Rev. Physiol. 1997, 59, 365–393. [Google Scholar] [CrossRef]
  3. Chiang, Y.R.; Wei, S.T.S.; Wang, P.H.; Wu, P.H.; Yu, C.P. Microbial degradation of steroid sex hormones: Implications for environmental and ecological studies. Microb. Biotechnol. 2020, 13, 926–949. [Google Scholar] [CrossRef] [PubMed]
  4. Ojoghoro, J.O.; Scrimshaw, M.D.; Sumpter, J.P. Steroid hormones in the aquatic environment. Sci. Total Environ. 2021, 792, 148306. [Google Scholar] [CrossRef]
  5. Luzio, A.; Monteiro, S.M.; Rocha, E.; Fontaínhas-Fernandes, A.A.; Coimbra, A.M. Development and recovery of histopathological alterations in the gonads of zebrafish (Danio rerio) after single and combined exposure to endocrine disruptors (17α-ethinylestradiol and fadrozole). Aquat. Toxicol. 2016, 175, 90–105. [Google Scholar] [CrossRef] [PubMed]
  6. Pan, X.D.; Han, J.L. Determination of steroid hormone residues in farmed fish using high-resolution orbital ion trap mass spectrometry. Anal. Methods 2022, 14, 4146–4152. [Google Scholar] [CrossRef] [PubMed]
  7. Lemos, L.S.; Olsen, A.; Smith, A.; Chandler, T.E.; Larson, S.; Hunt, K.; Torres, L.G. Assessment of fecal steroid and thyroid hormone metabolites in eastern North Pacific gray whales. Conserv. Physiol. 2020, 8, coaa110. [Google Scholar] [CrossRef]
  8. Evangelista, S.; Vazakidou, P.; Koekkoek, J.; Heinzelmann, M.T.; Lichtensteiger, W.; Schlumpf, M.; Tresguerres, J.A.F.; Linillos-Pradillo, B.; van Duursen, M.B.M.; Lamoree, M.H.; et al. High throughput LC-MS/MS method for steroid hormone analysis in rat liver and plasma-unraveling methodological challenges. Talanta 2024, 266, 124981. [Google Scholar] [CrossRef]
  9. Li, Y.; Yan, Z.; Li, X.; Yin, X.; Li, K. UPLC–TOF–MS method for simultaneous quantification of steroid hormones in tissue homogenates of zebrafish with solid-phase extraction. Molecules 2021, 26, 6213. [Google Scholar] [CrossRef]
  10. Ross, A.R.S.; Liao, X.; Brown, T.M. Simultaneous determination of steroid hormones and pharmaceuticals in killer whale (Orcinus orca) faecal samples by liquid chromatography tandem mass spectrometry. Conserv. Physiol. 2023, 11, coad081. [Google Scholar] [CrossRef]
  11. Bechshoft, T.; Wright, A.J.; Styrishave, B.; Houser, D. Measuring and validating concentrations of steroid hormones in the skin of bottlenose dolphins (Tursiops truncatus). Conserv. Physiol. 2020, 8, coaa032. [Google Scholar] [CrossRef] [PubMed]
  12. Praveen, A.; Prasad, D.; Mishra, S.; Nagarajan, S.; Chaudhari, S.R. Facile NMR approach for profiling curcuminoids present in turmeric. Food Chem. 2021, 341, 128646. [Google Scholar] [CrossRef] [PubMed]
  13. Li, F.F.; Guo, C.C.; Zhang, Y.L.; Wang, N.; Shi, Y.; Wang, S.Q. A screening method based on 1D CSSF-TOCSY for the identification and quantification of 11 illegal adulterants in herbal medicines. Microchem. J. 2020, 153, 104495. [Google Scholar] [CrossRef]
  14. Kakeshpour, T.; Bax, A. Simultaneous Quantification of H2O2 and Organic Hydroperoxides by 1H NMR Spectroscopy. Anal. Chem. 2022, 94, 5729–5733. [Google Scholar] [CrossRef]
  15. Haddad, L.; Renou, S.; Remaud, G.S.; Rizk, T.; Bejjani, J.; Akoka, S. A precise and rapid isotopomic analysis of small quantities of cholesterol at natural abundance by optimized 1H-13C 2D NMR. Anal. Bioanal. Chem. 2021, 413, 1521–1532. [Google Scholar] [CrossRef]
  16. Fels, L.; Ruf, F.; Bunzel, M. Quantification of Isomaltulose in Food Products by Using Heteronuclear Single Quantum Coherence NMR-Experiments. Front. Nutr. 2022, 9, 928102. [Google Scholar] [CrossRef]
  17. Wu, Y.S.; Li, B.X.; Long, Y.Y. Rapid quantitative 1H-13C two-dimensional NMR with high precision. RSC Adv. 2022, 12, 5349–5356. [Google Scholar] [CrossRef]
  18. Boerkamp, V.J.P.; Merkx, D.W.H.; Wang, J.; Vincken, J.P.; Hennebelle, M.; van Duynhoven, J.P.M. Quantitative assessment of epoxide formation in oil and mayonnaise by 1H-13C HSQC NMR spectroscopy. Food Chem. 2022, 390, 133145. [Google Scholar] [CrossRef]
  19. Bourmaud, C.L.; Bertella, S.; Rico, A.B.; Karlen, S.D.; Ralph, J.; Luterbacher, J. Quantification of native lignin structural features with gel-phase 2D-HSQC0 reveals lignin structural changes during extraction. Angew. Chem. Int. Ed. 2024, 136, 202404442. [Google Scholar] [CrossRef]
  20. Xiao, H.H.; Lv, J.; Mok, D.; Yao, X.S.; Wong, M.S.; Cooper, R. NMR Applications for Botanical Mixtures: The Use of HSQC Data to Determine Lignan Content in Sambucus williamsii. J. Nat. Prod. 2019, 82, 1733–1740. [Google Scholar] [CrossRef]
  21. Çiçek, S.S.; Esposito, T.; Girreser, U. Prediction of the sweetening effect of Siraitia grosvenorii (luo han guo) fruits by two-dimensional quantitative NMR. Food Chem. 2021, 335, 127622. [Google Scholar] [CrossRef] [PubMed]
  22. Girreser, U.; Ugolini, T.; Çiçek, S.S. Quality control of Aloe vera (Aloe barbadensis) and Aloe ferox using band-selective quantitative heteronuclear single quantum correlation spectroscopy (bs-qHSQC). Talanta 2019, 205, 120109. [Google Scholar] [CrossRef] [PubMed]
  23. Kontogianni, V.G.; Exarchou, V.; Troganis, A.; Gerothanassis, I.P. Rapid and novel discrimination and quantification of oleanolic and ursolic acids in complex plant extracts using two-dimensional nuclear magnetic resonance spectroscopy-comparison with HPLC methods. Anal. Chim. Acta 2009, 635, 188–195. [Google Scholar] [CrossRef] [PubMed]
  24. Chen, Y.; Wang, Y.; Xu, Y.; Ma, S.; Yang, H.; Liu, Y.; Wu, X. Quality Evaluation of Tripterygium Glycoside Tablets Based on Quantitative Band-Selective 2D 1H–13C HSQC and 1H NMR Fingerprinting. ACS Omega 2024, 9, 27321–27328. [Google Scholar] [CrossRef]
  25. Sutcharitchan, C.; Miao, S.; Li, W.; Liu, J.; Zhou, H.; Ma, Y.; Ji, S.; Cui, Y. High performance liquid chromatography-tandem mass spectrometry method for residue determination of 39 plant growth regulators in root and rhizome Chinese herbs. Food Chem. 2020, 322, 126766. [Google Scholar] [CrossRef]
  26. Martín-Gómez, B.; Valverde, S.; Bernal, J.; Ares, A.M. Development and validation of an analytical methodology based on solvent microextraction and UHPLC-MS/MS for determining bisphenols in honeys from different botanical origins. Food Chem. 2024, 450, 139358. [Google Scholar] [CrossRef]
  27. Zhao, Q.; Liu, Y.; Ma, H.; Qiao, Y.; Chao, J.; Hou, X.; Wang, Y.; Wang, Y. Combination of pure shift NMR and chemical shift selective filters for analysis of Fischer-Tropsch waste-water. Anal. Chim. Acta 2020, 1110, 131–140. [Google Scholar] [CrossRef]
  28. Weitzel, A.; Samol, C.; Oefner, P.J.; Gronwald, W. Robust metabolite quantification from j-compensated 2d 1H–13C HSQC experiments. Metabolites 2020, 10, 449. [Google Scholar] [CrossRef]
  29. Yan, Y.; Li, M.; Wei, Y.; Jia, F.; Zheng, Y.; Tao, G.; Xiong, F. Oyster-derived dipeptides RI, IR, and VR promote testosterone synthesis by reducing oxidative stress in TM3 cells. Food Sci. Nutr. 2023, 11, 6470–6482. [Google Scholar] [CrossRef]
  30. Banihani, S.A. Ameliorative effects of propolis upon reproductive toxicity in males. Clin. Exp. Reprod. Med. 2023, 50, 12–18. [Google Scholar] [CrossRef]
  31. Xu, H.; Pu, J.; Teng, Y.; Zhu, Q.; Guo, L.; Zhao, J.; Ding, H.; Fang, Y.; Ma, X.; Liu, H.; et al. Melatonin Inhibits Testosterone Synthesis in Rooster Leydig Cells by Targeting CXCL14 through miR-7481-3p. Int. J. Mol. Sci. 2023, 24, 16552. [Google Scholar] [CrossRef]
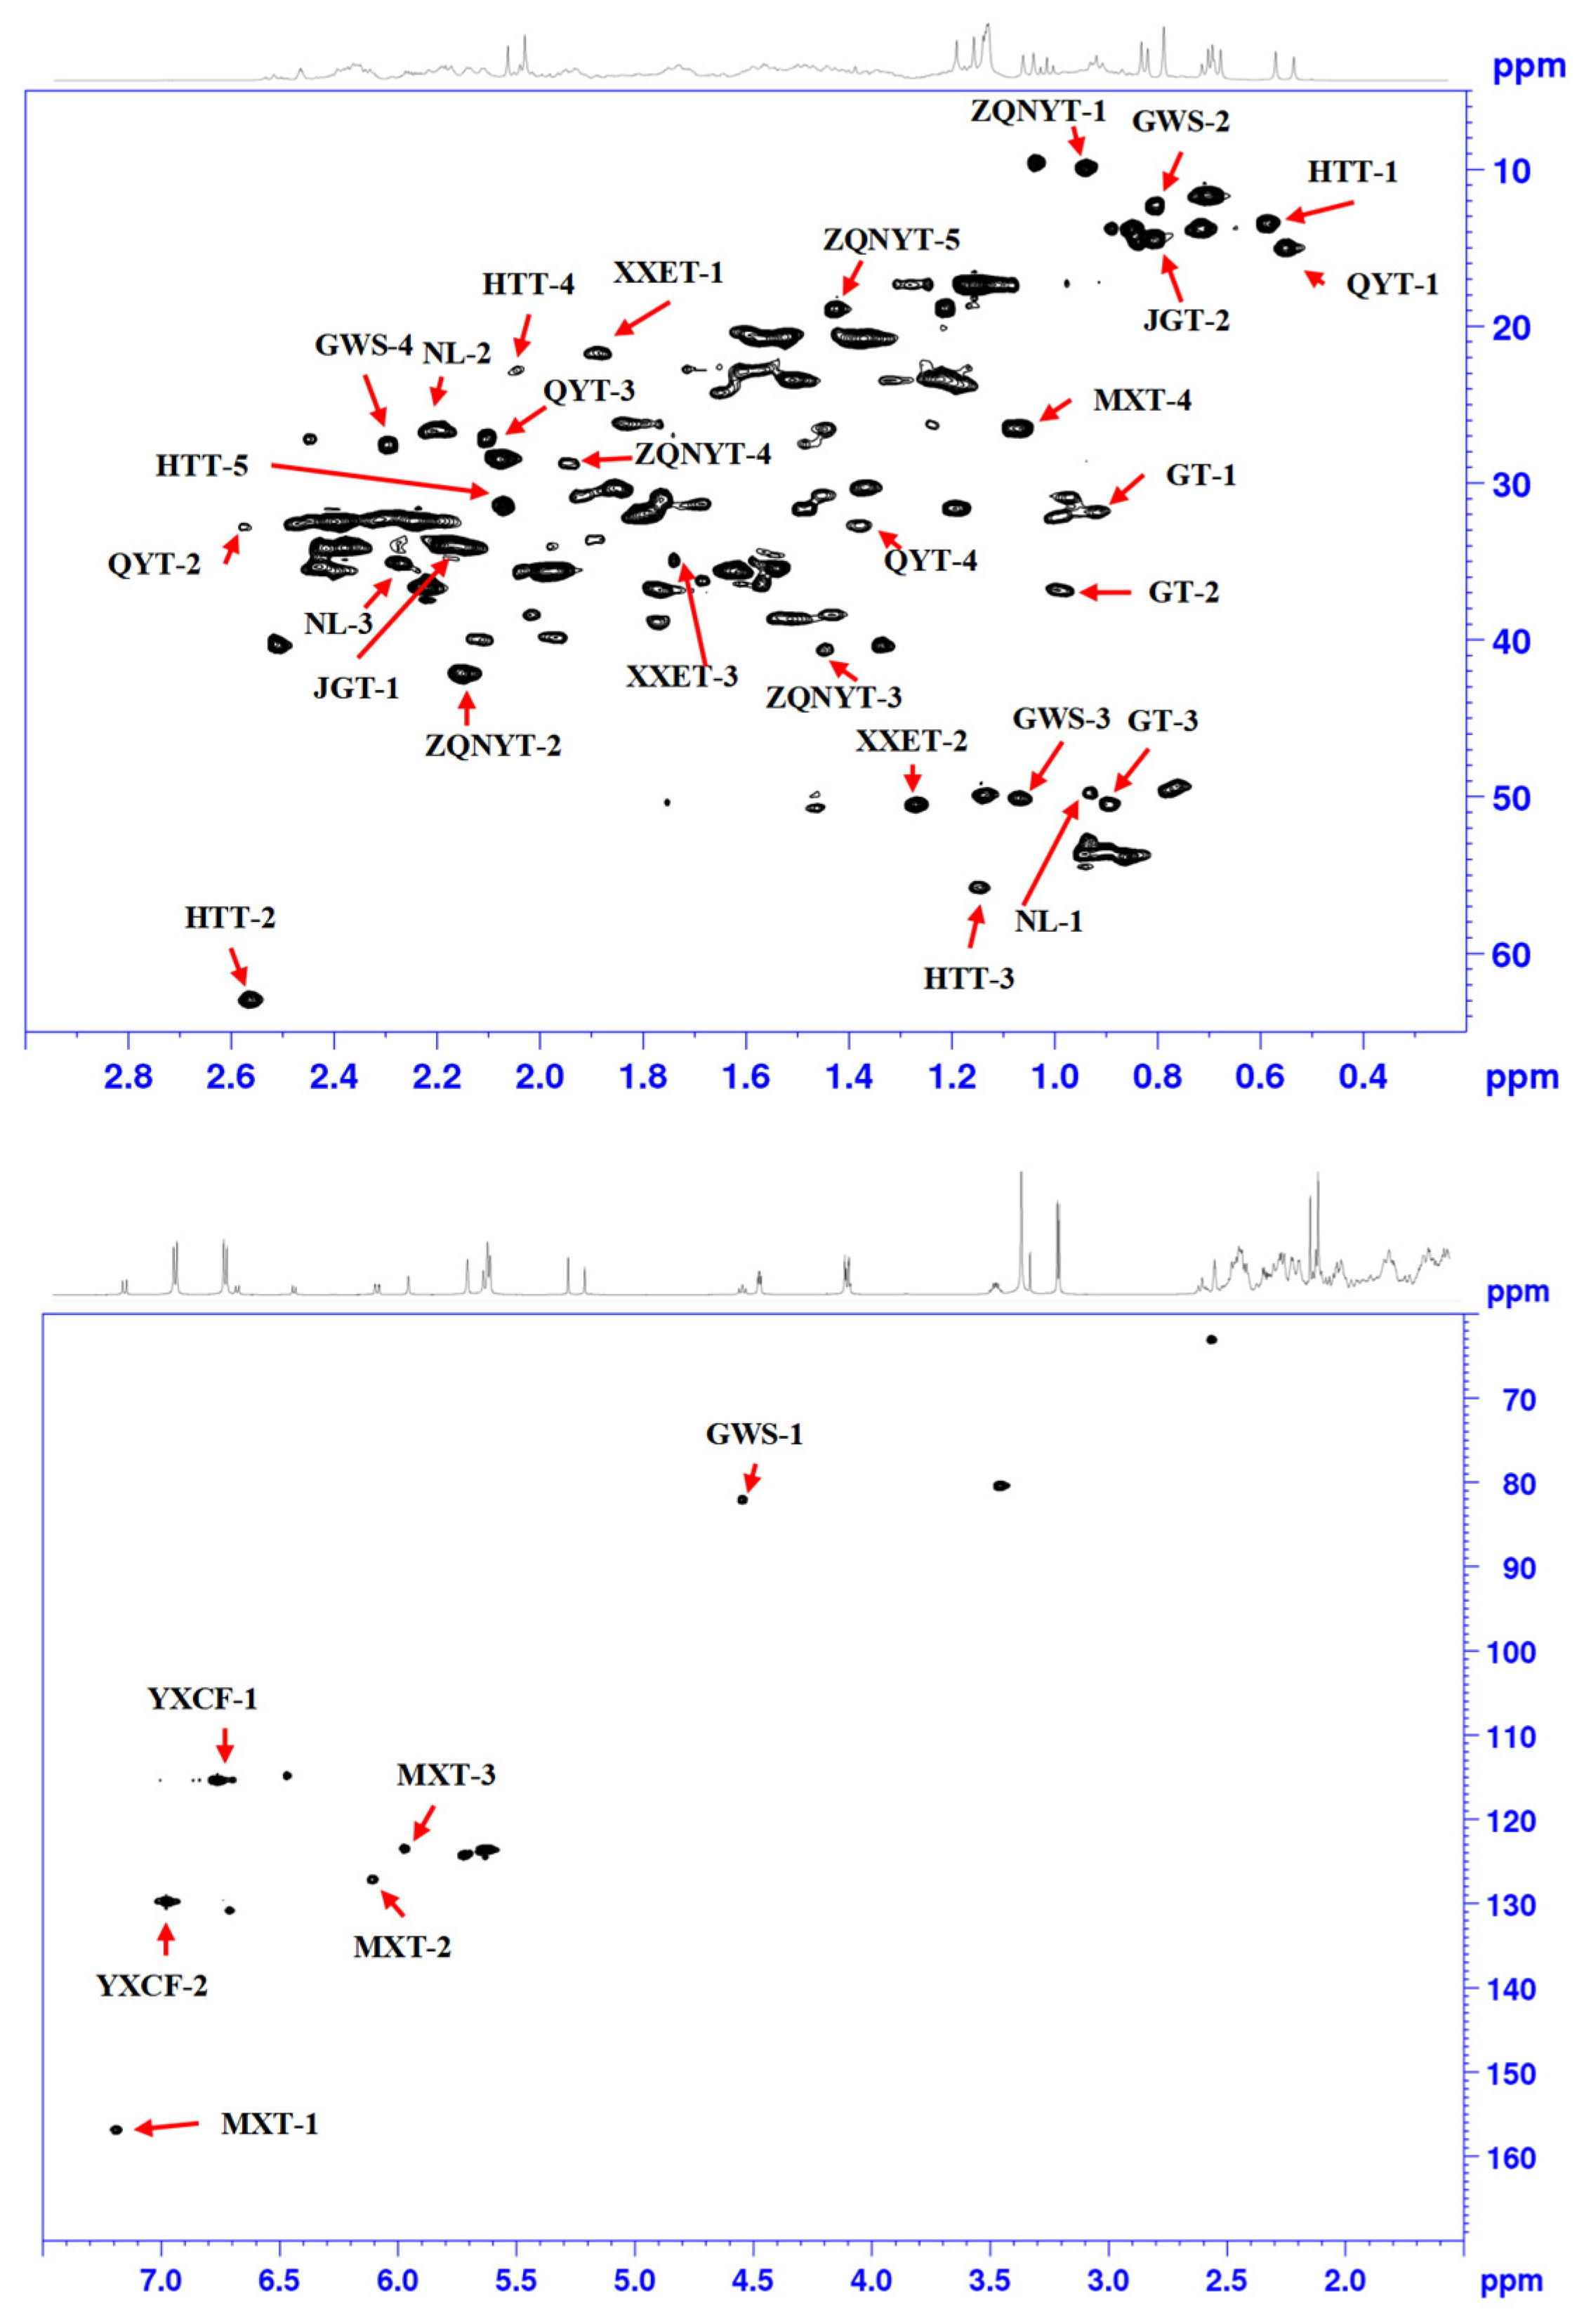
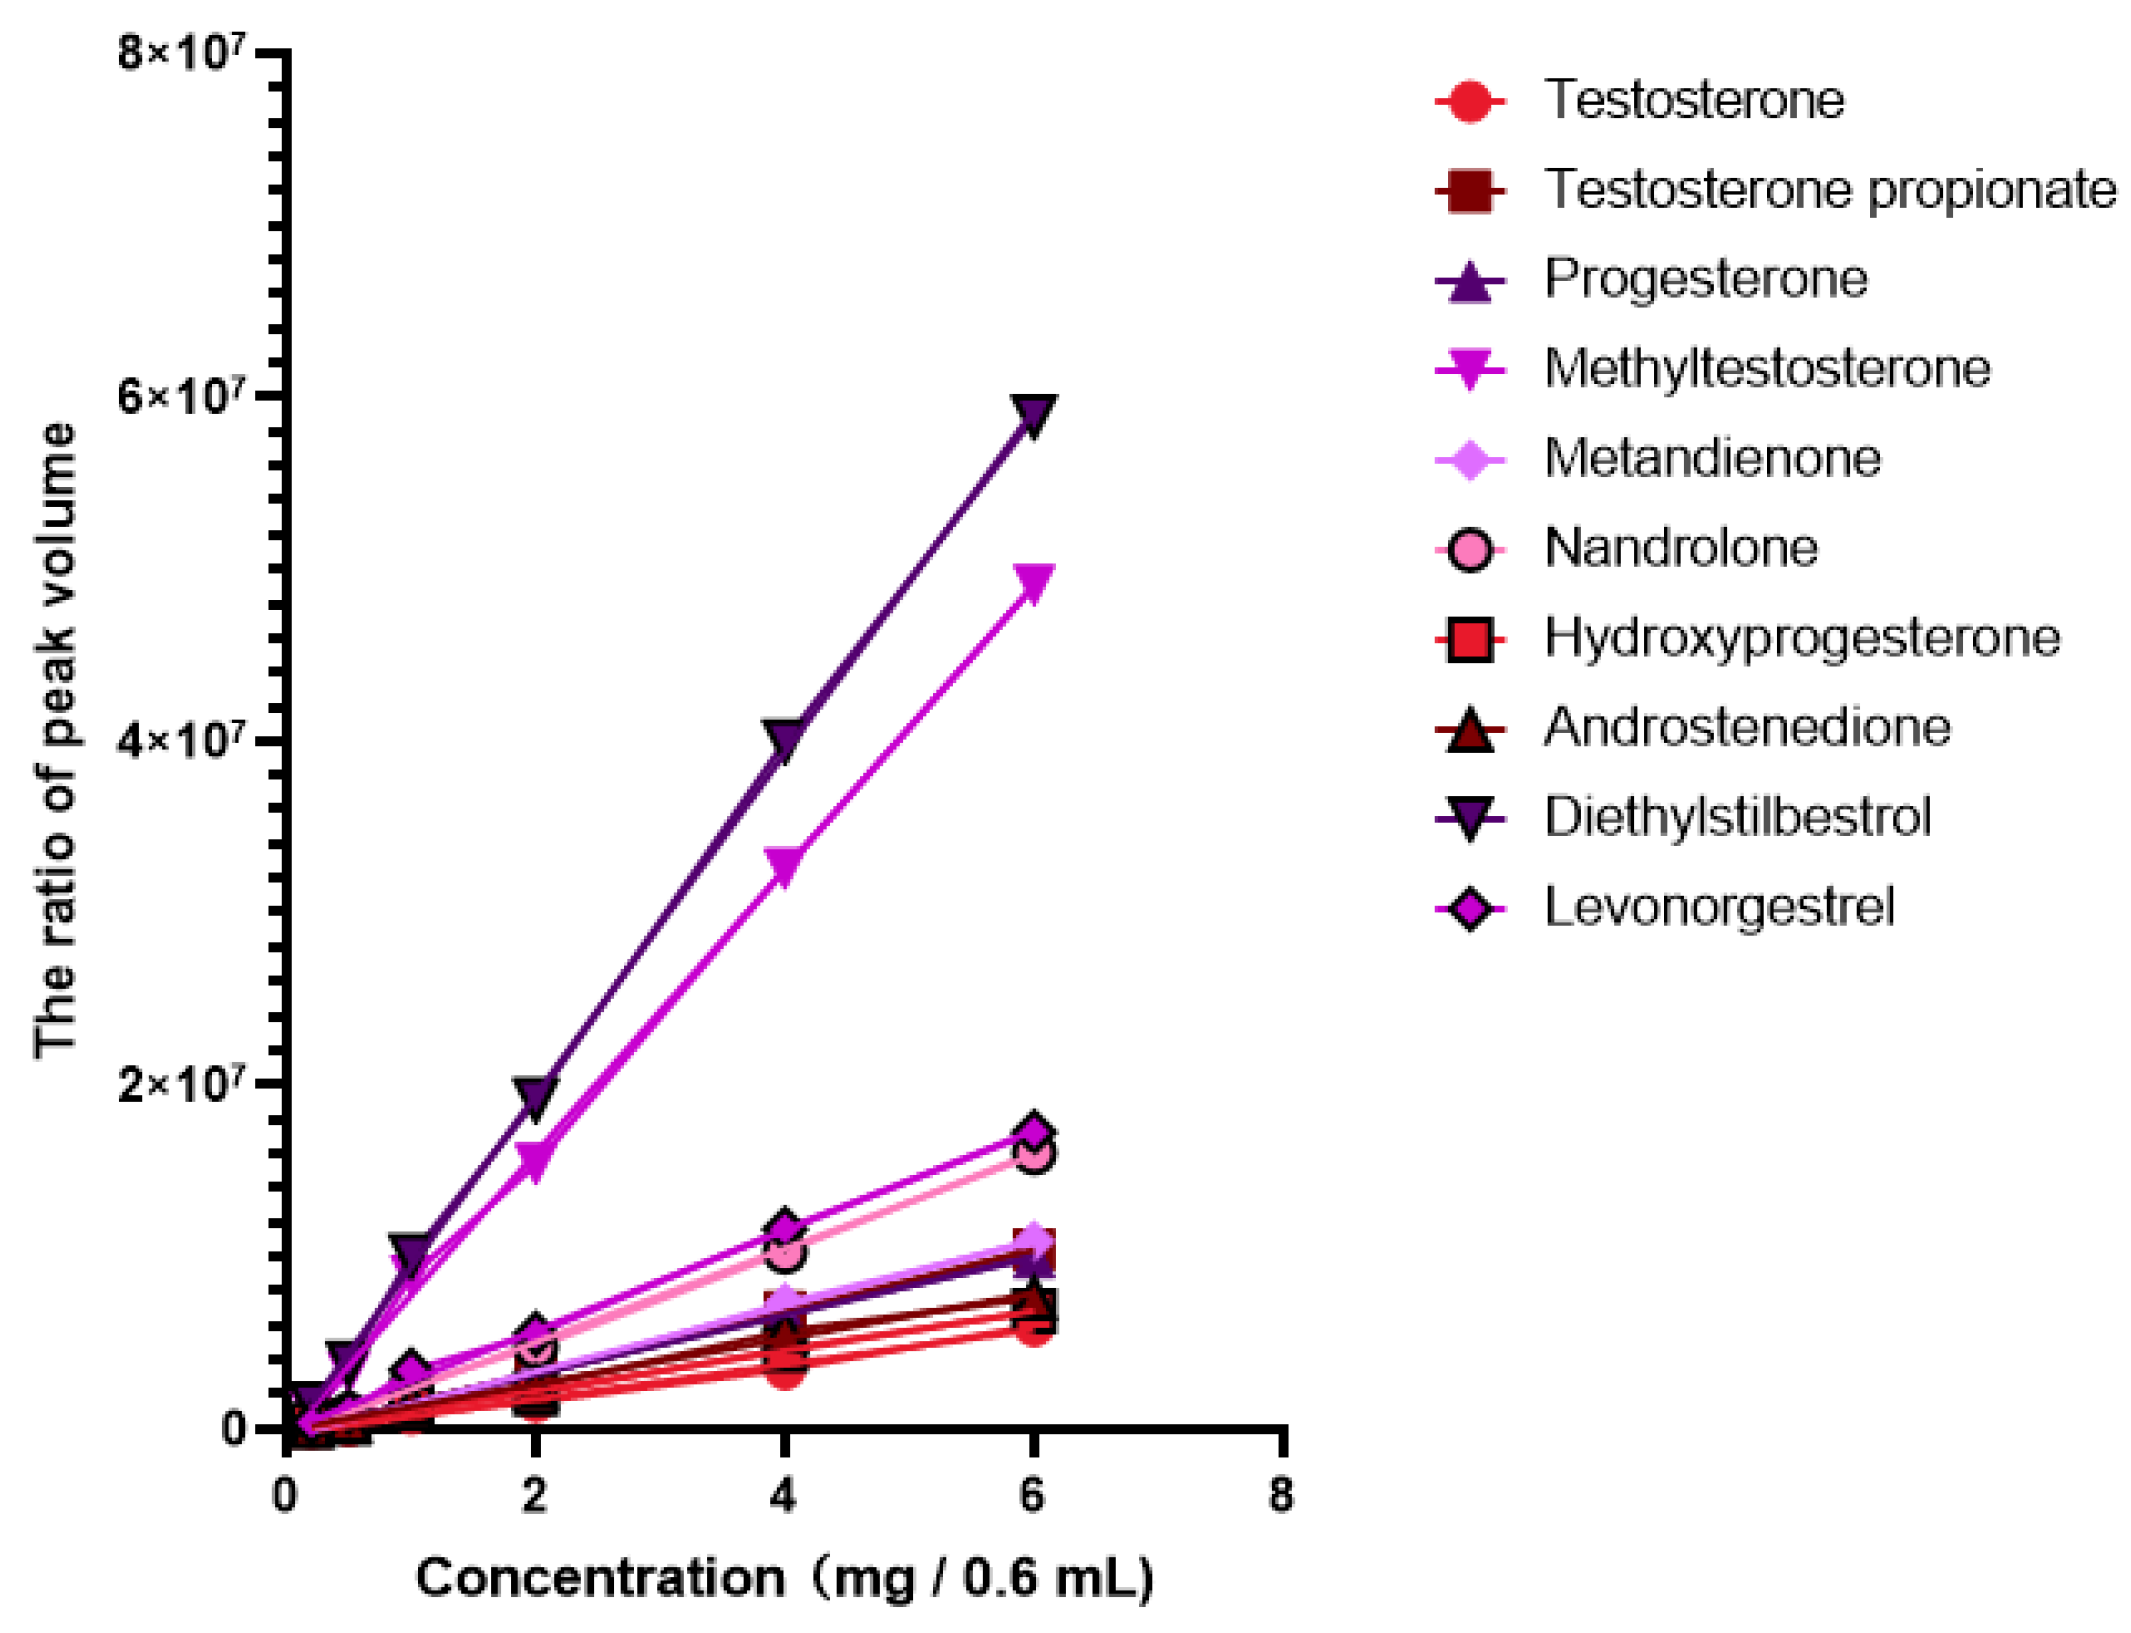
Figure 1. Structures of 10 hormones. The quantitative signals are marked in blue.
Separations 11 00328 g001
Figure 2. 2D 1H-13C HSQC spectra of 10 sex hormones in DMSO-d6.
Separations 11 00328 g002
Figure 3. Calibration curves for the quantification of 10 hormones by HSQC experiment.
Separations 11 00328 g003
Table 1. HSQC cross-peak assignment, calibration equation, R2 and linear range of 10 sex hormones.
AnalyteLabel13C1HAssignmentLinear Range mg/0.6 mLEquationR2
TestosteroneTestosterone-131.30.91C12/H12 in Testosterone0.2–6Y = 901581 × X − 2404130.9991
Testosterone-2 *37.00.97C8/H8 in Testosterone0.2–6Y = 1012040 × X − 2808750.9932
Testosterone-350.40.89C3/H3 in Testosterone0.2–6Y = 1126412 × X − 965530.9998
Testosterone propionateTestosterone propionate-1 *82.24.54C11/H11 in Testosterone propionate0.2–6Y = 1781890 × X − 2852000.9998
Testosterone propionate-212.00.81C25/H25 in Testosterone propionate0.2–6Y = 1425738 × X − 374690.9955
Testosterone propionate-350.01.07C4/H4 in Testosterone propionate0.2–6.0Y = 1349384 × X − 2815880.9944
Testosterone propionate-427.12.29C9/H9 in Testosterone propionate0.2–6.0Y = 2018563 × X − 1516090.9993
ProgesteroneProgesterone-113.10.59C15/H15 in Progesterone0.2–6.0Y = 2316192 × X − 1447380.9979
Progesterone-2 *63.12.56C8/H8 in Progesterone0.2–6.0Y = 1709294 × X − 2086640.9997
Progesterone-355.81.14C6/H6 in Progesterone0.2–6.0Y = 851794 × X − 831560.9989
Progesterone-422.02.06C13/H13 in Progesterone0.2–6.0Y = 307373 × X + 643810.984
Progesterone-531.72.07C5/H5 in Progesterone0.2–6.0Y = 2002516 × X − 2433070.9936
MethyltestosteroneMethyltestosterone-1 *34.22.16C16/H16 in Methyltestosterone0.2–6.0Y = 8248066 × X − 4517510.999
Methyltestosterone-214.40.80C14/H14 in Methyltestosterone0.2–6.0Y = 2629071 × X − 2438180.9994
MetandienoneMetandienone-1 *156.37.19C19/H19 in Metandienone0.2–6.0Y = 1902488 × X − 4474720.9984
Metandienone-2126.86.11C21/H21 in Metandienone0.2–6.0Y = 2381153 × X − 3640670.999
Metandienone-3123.25.97C20/H20 in Metandienone0.2–6.0Y = 2470837 × X − 652840.9986
Metandienone-426.61.07C17/H17 in Metandienone0.2–6.0Y = 3340572 × X − 1592530.9989
NandroloneNandrolone-149.80.93C4/H4 in Nandrolone0.2–6.0Y = 693588 × X + 1360100.9901
Nandrolone-2 *26.42.20C9/H9 in Nandrolone0.2–6.0Y = 2721231 × X − 3915200.9989
Nandrolone-335.02.27C10/H10 in Nandrolone0.2–6.0Y = 1420652 × X − 246080.999
HydroxyprogesteroneHydroxyprogesterone-115.10.55C19/H19 in Hydroxyprogesterone0.2–6.0Y = 2378870 × X − 1951470.9991
Hydroxyprogesterone-232.62.57C21/H21 in Hydroxyprogesterone0.2–6.0Y = 404375 × X + 166400.9331
Hydroxyprogesterone-326.82.11C12/H12 in Hydroxyprogesterone0.2–6.0Y = 2003262 × X − 391840.9987
Hydroxyprogesterone-4 *32.61.38C14/H14 in Hydroxyprogesterone0.2–6.0Y = 1156806 × X − 757440.9981
AndrostenedioneAndrostenedione-121.71.88C8/H8 in Androstenedione0.2–6.0Y = 1142997 × X − 248020.9993
Androstenedione-2 *50.41.27C5/H5 in Androstenedione0.2–6.0Y = 1319332 × X − 92900.9926
Androstenedione-334.81.74C9/H9 in Androstenedione0.2–6.0Y = 733839 × X − 1339020.9938
DiethylstilbestrolDiethylstilbestrol-1115.36.78C15/H15 in Diethylstilbestrol0.2–6.0Y = 8407064 × X + 13210.999
Diethylstilbestrol-2 *129.46.98C11/H11 in Diethylstilbestrol0.2–6.0Y = 9963598 × X − 5400500.9994
LevonorgestrelLevonorgestrel-19.70.93C18/H18 in Levonorgestrel0.2–6.0Y = 1605386 × X + 76470.9988
Levonorgestrel-2 *42.02.15C20/H20 in Levonorgestrel0.2–6.0Y = 2909640 × X − 873860.9976
Levonorgestrel-340.61.44C5/H5 in Levonorgestrel0.2–6.0Y = 756719 × X − 1516250.9964
Levonorgestrel-428.91.94C17/H17 in Levonorgestrel0.2–6.0Y = 791756 × X − 2102860.9971
Levonorgestrel-518.51.41C14/H14 in Levonorgestrel0.2–6.0Y = 1894622 × X − 2574530.9984
*, signals selected for the quantification of 10 hormones in animal-source products.
Table 2. Validation results of 10 compounds in bird’s nest.
CompoundLabelPrecision RSD (%)
(2 mg/0.6 mL, n = 9)
Recovery (2 mg/0.6 mL, n = 5)
Average Recovery (%)RSD (%)
TestosteroneTestosterone-25.78104.21.09
Testosterone propionateTestosterone propionate-13.61103.61.71
ProgesteroneProgesterone-24.95104.21.79
MethyltestosteroneMethyltestosterone-12.53106.63.15
MetandienoneMetandienone-15.66101.61.75
NandroloneNandrolone-22.92103.42.41
HydroxyprogesteroneHydroxyprogesterone-45.22101.71.64
AndrostenedioneAndrostenedione-22.22104.03.72
DiethylstilbestrolDiethylstilbestrol-23.32104.31.04
LevonorgestrelLevonorgestrel-21.23105.33.51
Table 3. Contents of 10 hormones in six animal-source products.
SamplesNo.Concentration (mg/20 g)
TestosteroneTestosterone PropionateProgesteroneMethyltestosteroneMetandienoneNandroloneHydroxyprogesteroneAndrostenedioneDiethylstilbestrolLevonorgestrel
Bird’s nest1----------
2----------
3----------
4----------
5----------
Colla corii asini1----------
2----------
3----------
4----------
5----------
Chicken gizzard membrane11.2--0.8------
20.9-----0.3---
3---0.5------
40.3---------
51.3---------
Propolis1----------
20.6---0.8-----
3----1.3-----
4----------
5----------
Gecko1----------
2----------
3----------
4----------
5----------
Oyster10.5--0.6------
21.1--1.3------
30.7--0.2------
4----------
5----------
“-” indicates that none of the hormones were detected in the sample.
Disclaimer/Publisher’s Note: The statements, opinions and data contained in all publications are solely those of the individual author(s) and contributor(s) and not of MDPI and/or the editor(s). MDPI and/or the editor(s) disclaim responsibility for any injury to people or property resulting from any ideas, methods, instructions or products referred to in the content.

