Article

Extraction and Counter-Current Separation of Phenylpropanoid Glycosides from Pedicularis oederi Vahl by Deep Eutectic Solvent

1
School of Life Science, Qinghai Normal University, Xining 810000, China
2
Engineering Technology Research Center of Plant Cell Engineering, West AnHui University, Lu’an 237000, China
*
Authors to whom correspondence should be addressed.
These authors contributed equally to this work.
Separations 2024, 11(11), 323; https://doi.org/10.3390/separations11110323
Submission received: 16 September 2024 / Revised: 6 November 2024 / Accepted: 6 November 2024 / Published: 8 November 2024
(This article belongs to the Special Issue Green Separation and Purification Technology)

Abstract

:
Deep eutectic solvents (DESs) are mixtures of organic compounds displaying excellent solvent properties while keeping an ecofriendly character. In this study, DESs have been applied to the extraction of phenylpropanoid glycosides from Pedicularis oederi Vahl, successively separated by means of counter-current chromatography. Firstly, the ultrasonic-assisted extraction conditions were optimized by response surface methodology, and the results showed phenylpropanoid glycosides could be well extracted under the optimized extraction conditions with deep eutectic solvents. Then, the sample was separated by counter-current chromatography using ethyl acetate/aqueous solution of choline chloride and glycerol (6:6, v/v) as the solvent system. In about 360 min, four phenylpropanoid glycosides, including 31.6 mg of echinacoside, 65.3 mg of Jionoside A1, 28.9 mg of Forsythoside B, 74.1 mg of verbascoside, and 21.2 mg of kaempferol-3-O-rutinoside were obtained from about 900 mg of the sample. It revealed deep eutectic solvents could be well employed as a green solvent for the extraction and counter-current separation of natural products.

1. Introduction

In the realm of traditional Tibetan medicinal practices, the herb known as Pedicularis oederi Vahl occupies a prominent position, predominantly thriving in the elevated terrains of Tibet, along with the provinces of Qinghai, Sichuan, and Gansu within China [1]. Research has validated its efficacy in addressing numerous forms of ailments, such as hepatic inflammation, gallbladder inflammation, edema, spermatorrhea, and ear ringing [2]. Phenylpropanoid glycosides, the primary bioactive compounds identified within this plant, exhibit a spectrum of pharmacological effects. These effects span antihepatotoxic, anti-inflammatory, antibacterial, analgesic, oxidation inhibitory, and genotoxicity prevention capabilities [3]. Given the broad spectrum of its pharmacological benefits, there exists an acute demand to isolate and purify these compounds’ substantial volumes to serve as reference materials for analytical purposes and to facilitate in-depth pharmacological research.
Deep eutectic solvents (DESs), a type of ambient temperature liquid salt mixture formed by combining a hydrogen bond donor and a hydrogen bond acceptor, have been widely utilized in extracting bioactive compounds from various plant sources [4,5]. These compounds include anthocyanins extracted from raspberries, flavonoids isolated from Pollen Typhae, phenolic compounds from grape skins, and significant flavonoids from Oroxylum indicum seeds, as documented in several studies [6,7,8]. DESs offer numerous advantages, such as non-volatility, environmental friendliness, cost efficiency, and versatility, making them attractive for various green chemistry applications. However, challenges like high viscosity, limited thermal stability, and the need for specific handling conditions highlight the areas where further research and development are needed [9,10].
Traditional methods of column chromatography have been widely employed for extracting and purifying compounds from botanical sources. Despite their widespread use, these methodologies are known for being labor-intensive, slow, and inefficient in terms of solvent use, often necessitating multiple stages to complete. Moreover, they are prone to causing the permanent adsorption of substances onto the column’s solid phase [11,12,13]. In contrast, preparative HPLC and high-speed counter-current chromatography (HSCCC) stand out as superior techniques, offering significant benefits such as enhanced efficiency, superior resolution, and consistent results [14,15,16]. These methods leverage advanced separation capabilities, inline monitoring, and automated management to facilitate the effective isolation of desired molecules [17,18,19]. Nonetheless, preparative HPLC typically does not accommodate crude extracts directly. Distinguished by its support-free liquid–liquid partitioning mechanism, HSCCC avoids the drawbacks of solid phase sample adsorption inherent in traditional chromatography, thereby minimizing the risk of sample degradation [20,21,22,23]. This method is particularly adept at extracting components from unrefined extracts without the need for prior processing, allowing for substantial sample volumes [12,22,24,25]. Consequently, HSCCC is gaining recognition for its utility in isolating pharmaceutical agents, particularly in the preparative extraction of active elements from natural product extracts. DESs present a sustainable, versatile, and cost-effective alternative to traditional solvents, aligning well with green chemistry principles. Their biodegradability, low toxicity, and ease of customization make them a promising choice for various industrial, pharmaceutical, and environmental applications. Considering the above advantages and previous reports, a DES based on choline chloride/glycerol was prepared for subsequent extraction and HSCCC separation of these bioactive phenylpropanoid glycosides from Pedicularis oederi Vahl.
In this study, a DES was employed as a green solvent to fuel the extraction and counter-current separation of phenylpropanoid glycosides from Pedicularis oederi Vahl to pave the way for further medicinal applications. Employing a minimalistic approach to resource usage, response surface methodology (RSM) utilizes quantitative data from tailored experimental designs to address and resolve complex multivariate equations effectively [26]. Its application has been extensively documented for the optimization of operational conditions [27,28,29]. As such, this study has applied RSM to refine the conditions under which ultrasonic-assisted extraction is performed. Eventually, four phenylpropanoid glycosides combined with a flavonoid were acquired, and their configurations were elucidated through 1H-NMR analysis. This strategy heralds the current frontier in the DES application of natural product extraction and separation.

2. Materials and Methods

2.1. Apparatus

The HSCCC separation was performed employing a TBE-1000A system from Shanghai Tauto Biotech, Co., Ltd. (Shanghai, China). This system was notably outfitted with a trio of PTFE preparative coils, collectively encompassing a volume of 1000 mL, alongside an 80 mL sample loop. Further enhancements to the system included the incorporation of a TBP-5002 model constant-flow pump (Shanghai, China), a model sensing unit module of UV500 operational at 280 nm (Shanghai, China), and a N2000 model workstation (Shanghai, China), the latter being a product of Zhejiang University, Hangzhou, China. Temperature regulation during the experiments was achieved through a constant-temperature circulating device DC-0506, courtesy of Shanghai Sunny Hengping Scientific Instruments Co., Ltd. (Shanghai, China). Moreover, the analysis via a UPLC was performed via a Waters Acquity UHPLC I-Class system from Waters Corporation (Milford, CT, USA), which was distinguished by its binary solvent management system and an automated sample handling feature.

2.2. Reagents and Plant Material

For the extraction and separation processes, we exclusively utilized solvents of analytical grade, sourced from Macklin (Shanghai, China). The methanol with chromatographic purity for UPLC analysis was purchased from Yuwang Chemical Ltd. (Shandong, China). Throughout our experimentation, we employed deionized water. Pedicularis oederi Vahl, the plant material under study, was gathered from the Maixiu region within Qinghai Province, China, and subsequently reduced to a fine powder, achieving a granularity between 20 and 40 mesh prior to the extraction process. Furthermore, we obtained choline chloride (ChCl, purity of 99% or higher) and glycerol (purity of 99% or higher) from Aladdin (Shanghai, China).

2.3. UPLC Analysis

In this study, chromatographic separation was achieved utilizing the Acquity UPLC HSS T3 Column with dimensions of 2.1 × 100 mm and a 1.8 μm particle size, provided by Waters, headquartered in Milford, USA. The separation temperature was maintained at 35 °C. A binary mobile phase system was utilized, comprising water with 0.1% formic acid (A) and acetonitrile (B). A gradient elution method was applied, initiating with 5% of component B, which was linearly increased to 100% over 8 min, followed by a constant 100% of component B for an additional 2 min. The flow was set at 0.3 mL/min, and the quantity of each sample injected was precisely 1.0 μL. The analysis was conducted with the column oven set to a temperature of 35 °C, and absorbance was monitored at a wavelength of 320 nm.

2.4. Preparation of DES

Following the previously outlined procedure, the components required for the hydrogen bond interaction, namely ChCl as the acceptor and glycerol as the donor, were precisely measured and combined. Utilizing a magnetic stirrer, the mixture with a ratio of 1:2 was heated and agitated at a temperature of 80 °C. This process was continued until the resultant mixture achieved a transparent and uniform consistency. To preserve its quality until further application, the freshly synthesized deep eutectic solvent (DES) was subsequently placed in a desiccator for storage.

2.5. Optimization of Ultrasonic-Assisted Extraction Conditions

Response surface methodology (RSM) was employed to enhance the conditions for the ultrasonic-assisted extraction (UAE) of the target compounds. In this study, the variables considered were ultrasonic power (X1), the water content of deep eutectic solvents (DESs) (X2), and the ratio of liquids to solids (X3). The dependent variable, represented by Y, was characterized as the proportion of the maximum region for target compounds. A total of 17 experimental runs were designed, comprising 12 factorial points and five central point replicates (Table 1). For an investigation of the correlation between independent and dependent variables, the methodology of multiple regression based on least squares was employed. A robust model is further confirmed by substantial values in adjusted and predicted R2 values, verifying its fit to the dataset [25]. The study of factor interactions was visualized through surface plots based on the selected model.

2.6. Ultrasonic-Assisted Extraction

One kilogram of Pedicularis oederi Vahl, after drying, was finely pulverized before being subjected to a trio of ultrasonic-assisted extraction (UAE) processes. These extractions were performed utilizing a deep eutectic solvent (DES) formulation that included a 50% water mixture while operating at a 230-watt power level and upholding a 24 liquid-to-solid ratio. The combined extracts, post-extraction, were then subjected to a vacuum drying process, yielding a crude extract weighing 171 g. This extract underwent further processing by being introduced into a D101 resin column, sized at 2.5 cm by 60 cm, for purification. Water was employed to wash away the DES from the extract. Subsequently, the fraction representing 80% of this purified extract was earmarked for further refinement via HSCCC.

2.7. Selection of Two-Phase Solvent System

When choosing the suitable solvent system, the choice was determined by the partition coefficient (K) associated with the sample’s key constituents. This coefficient was evaluated through the HPLC methodology. Initially, a moderate quantity of the crude extract was dissolved in a solvent system consisting of two phases that had been pre-equilibrated. This mixture was then transferred to a separation funnel. Following a vigorous shake to ensure complete mixing of the two phases, 2 mL from each phase was removed and allowed to evaporate until dry. The resultant dry residues were prepared via methanol for subsequent examination via UPLC. The calculation of the K value involved comparing the upper phase’s peak area to that in the lower phase, represented as a ratio.

2.8. Preparation of Two-Phase Solvent System and Sample Solution

In the method described, a ternary solvent mixture comprising ethyl acetate/aqueous solution of choline chloride and glycerol with a volume ratio of 6:6 was utilized. This blend was placed into a separation funnel and allowed to attain equilibrium at room temperature. Following equilibrium, the clearly defined upper and lower stages were meticulously separated and underwent a 30 min degassing procedure in an ultrasonic bath, conducted just before their application. For the HSCCC separation process, the preparation of the sample solution entailed dissolving 1.0 g of the crude extract’s dry powder in 80 mL of the solvent system’s upper phase.

2.9. High-Speed Counter-Current Chromatography Separation Procedure

To commence each trial, HSCCC was initially flushed with ethanol to eliminate any residual substances. Subsequently, the lower phase in the stationary stage was introduced to completely occupy the multilayer column. The lower phase was employed as a stationary phase with flow rate of 10 mL/min. The revolution speed was set at 1100 rpm with retention of the stationary phase at 65%, and the sample loading amount was 1.0 g. The separation temperature was set at 45 °C with a detection wavelength of 320 nm.
Once the leading edge of the solvent appeared and a stable hydrodynamic balance was achieved within the system, the sample was administered into HSCCC via the sample injection port. This was immediately followed by data acquisition. The divided fractions were gathered manually according to the chromatogram’s instructions and then dehydrated using a vacuum. Following that, the desiccated specimens were reestablished in methanol for a subsequent assessment of their purity via UPLC analysis.

3. Results and Discussion

3.1. Optimization of Ultrasonic-Assisted Extraction Conditions

In the designed study, we conducted 17 trials in pairs, presenting the outcomes in Table 1. The R2, R2-adj, and R2-predicted values stood at 98.64%, 96.90%, and 90.05%, respectively. These statistics highlight the superior efficacy of full quadratic models over alternative approaches in predicting Y.
To assess the impact of various factors on chlorogenic acid levels, the analysis of variance (ANOVA) methodology was employed, with the findings detailed in Table 2. The significance of each model component was inferred from the F-value’s magnitude and the reciprocal relationship of the p-value, as suggested in [26]. Consequently, significant influences on chlorogenic acid content were observed for the linear components (X1, X2, and X3), the interaction term (X1×2), and the quadratic components (X12, X22, and X32), all registering p-values below the 0.05 threshold. In contrast, the interaction components (X1×3 and X2×3) were found to be statistically insignificant, with p-values exceeding 0.05. The model’s precision in forecasting was further validated through an absence of compatibility analysis, which yielded a significance level exceeding 0.05, thus affirming the model’s reliability in forecasting variations, as cited from [30].
In three-dimensional graphical representations, regression analyses are vividly portrayed, enabling an exploration of the dynamics between experimental variables and their resultant responses, as well as interactions among pairs of variables being tested. This method showcases how independent variables correlate with dependent variables through three-dimensional surface plots of response for Y (Figure 1). Within these plots, two variables are visualized simultaneously on a single three-dimensional surface, with a third variable maintained at a baseline level of zero.
Figure 1A showed the interaction between ultrasonic power and water content. Initially, Y increased by increasing the water content, and then Y reached a constant level. Based on an excellent extraction ability toward phenylpropanoid glycosides, the extraction and enrichment of compounds within the optimal water content range for DESs have demonstrated their potential to be as effective as traditional methods such as liquid–liquid extraction or chromatography using macroporous resins. Initially, an increase in water content resulted in an increase in the yield (Y), demonstrating the efficiency of this process. However, with the increase in water, the content of phenylpropanoid glycosides maintained a constant level due to the fact that most of the phenylpropanoid glycosides had been extracted, and it had a tiny effect on the extraction procedure for further increases in the water content in DESs. The effectiveness of DESs in isolating substances from organic origins has been shown to be remarkably effective.
In Figure 1B, the correlation between the liquid/solid ratio and ultrasonic power is depicted. At first, a rise in Y was noted as the ratio of liquids to solids increased, but this trend reversed beyond a certain point. This behavior can be exemplified by the diverse polarity range found in the crude extract of Pedicularis oederi Vahl. As the liquid-to-solid ratio increased, both the quantities of phenylpropanoid glycosides and additional constituents experienced a simultaneous escalation. However, upon surpassing a liquid-to-solid ratio of 24, the growth rate of the sum of concentrations of other compounds (∑Cj) surpassed that of the target compounds (∑Ci), leading to a reduction in Y.
The optimal parameters for the ultrasonic-assisted extraction (UAE) procedure were determined to be a sonic energy input of 230.61 W, a 50% water content in deep eutectic solvents (DESs), and a liquid-to-solid ratio of 23.54, predicting a Y of 69.60%. Adapting to real-world conditions, the settings were adjusted to a 230 W power with a 50% water content in DESs and a liquid-to-solid ratio of 24. Performed three times under these ideal circumstances, the experiment yielded a Y of 68.52%. It affirms the efficacy of the RSM, coupled with a well-considered experimental design, in fine-tuning the UAE process for the enhanced extraction and concentration of desired compounds. These findings endorse UAE as a favorable method for compound extraction and enrichment.

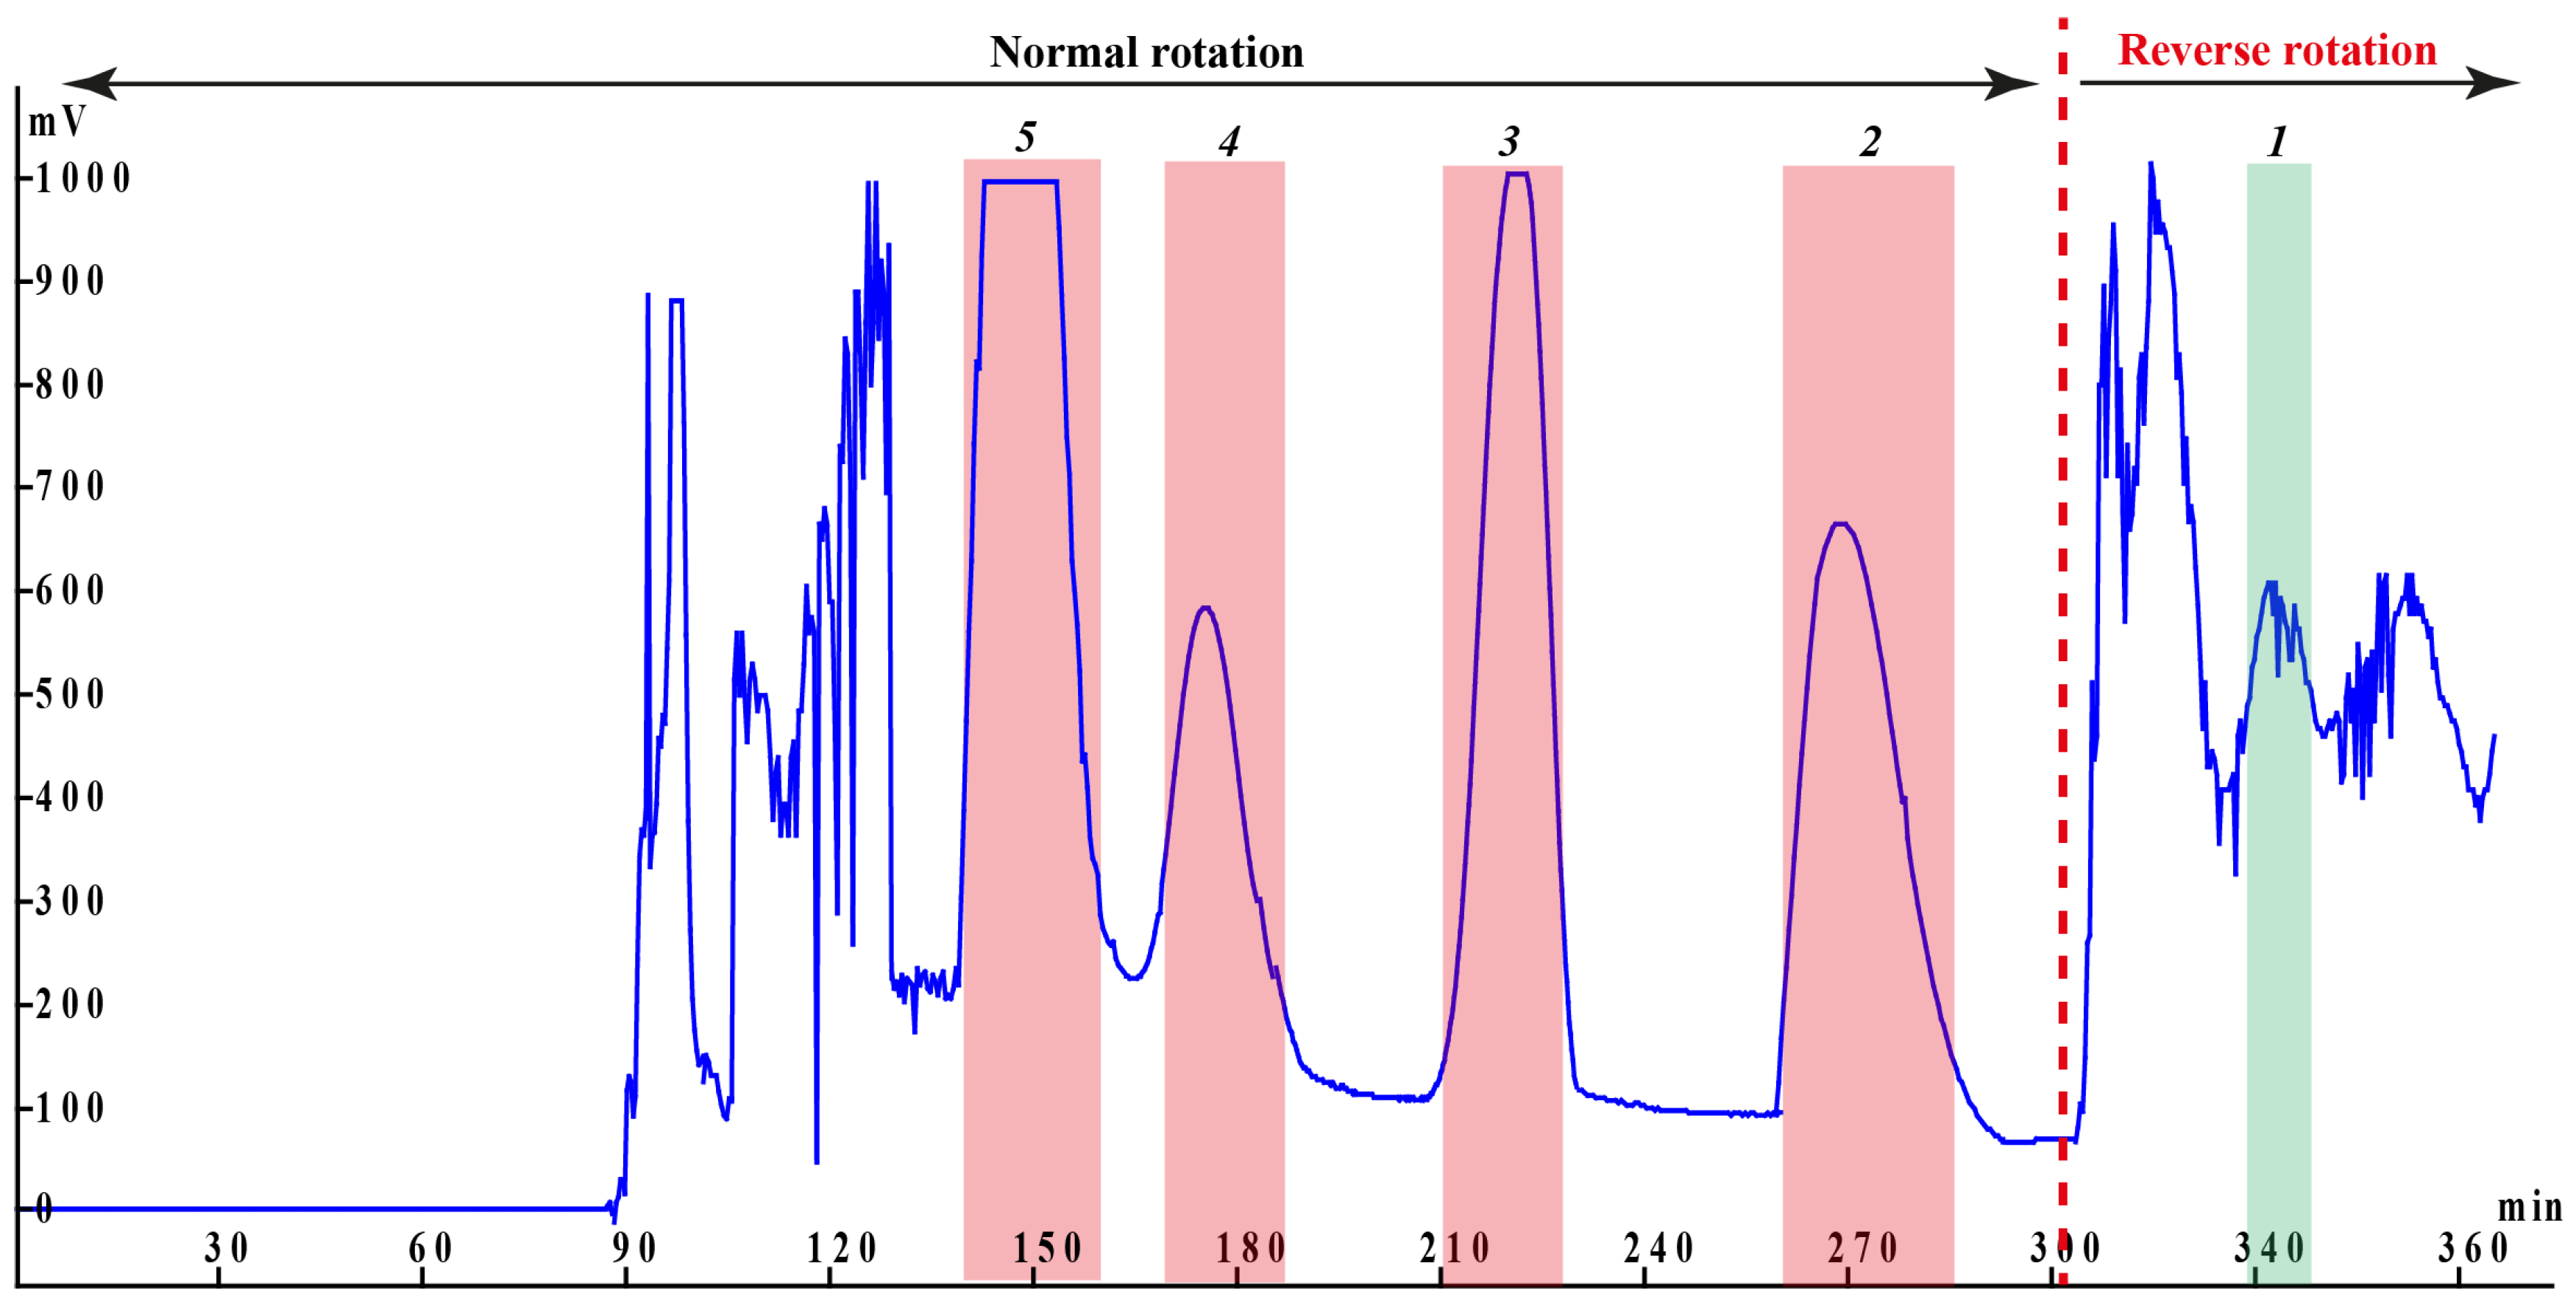
3.2. Selection of High-Speed Counter-Current Chromatography Experimental Conditions

In initiating an HSCCC separation procedure, selecting a suitable solvent system is paramount to achieving the preferred K value for the substances of interest. This selection process is largely influenced by the compounds’ chemical properties. Various critical factors, including the polarity of the sample (evaluated based on partition coefficient values), its dissolution rate, presence of ions, and capacity to create complexes, must be carefully considered. Ideally, the partition coefficient (K) must fall within the 0.2 to 5 range [21,31,32], and for a successful separation of two compounds, the separation factor (α = K2/K1, where K2 > K1) needs to be above 1.5 [21,33]. Solute elution close to the solvent front, resulting from a significantly low K value, leads to reduced resolution, whereas a high K value can enhance resolution but at the cost of producing broader and more diluted peaks due to extended elution times [31,34,35,36]. It is critical that the compounds under study remain steady and easily dissolved, with the solvent system capable of rapidly and neatly dividing into two separate phases.
To optimize the HSCCC separation, we systematically assessed various biphasic solvent combinations comprising ethyl acetate/aqueous solution of choline chloride and glycerol in varying ratios (5:9, 5:8, 5:7, 5:6, v/v/v), evaluating the K values for the desired substances and consolidating the results in Table 3. In the beginning, the solvent system of ethyl acetate/aqueous solution of choline chloride and glycerol with a 5:9 proportion (v/v/v) was examined for its effectiveness in distributing phenylpropanoid glycosides. These glycosides were predominantly found in the lower phase, indicating an excessively high polarity for this system in comparison to chlorogenic acid. Subsequently, adjustments were made to the DES ratio to lower the system’s polarity. While such modifications allowed for the phenylpropanoid glycosides to be distributed in the upper phase, achieving the optimal partition coefficient range (0.2 < K < 5) for these glycosides remained elusive. As a result, we raised the ratio of ethyl acetate, which effectively adjusted the distribution of the phenylpropanoid glycosides. The final selection of the ethyl acetate/aqueous solution of choline chloride and glycerol at a 6:6 ratio (v/v) provided satisfactory K and α values, aligning with the established criteria for effective separation.
Exploring various parameters beyond solvent configurations, this study delved into the impacts of mobile phase flow rates and apparatus rotation speeds on chromatographic outcomes. The mobile phase was delivered at varying rates (8.0, 10.0, and 12.0 mL/min) to assess its influence on both the duration of separation and the clarity of chromatographic peaks. It was observed that decreased flow rates extended the separation process yet enhanced peak clarity, whereas increased rates resulted in reduced separation quality. Consequently, a moderate flow rate of 10.0 mL/min was selected to proceed with HSCCC experiments. Furthermore, the rotation speed of the device was found to significantly affect the preservation of the immobile stage, with higher speeds leading to potential emulsification issues. Therefore, an optimal speed of 1100 revolutions per minute (rpm) was established, achieving a 65% stationary phase retention. Interestingly, this setup also facilitated the isolation of a flavonoid compound with satisfactory purity using a reverse rotation approach in the HSCCC process.
Under optimized parameters, the four phenylpropanoid glycosides combined with a flavonoid were obtained in approximately 360 min for a single iteration, as depicted in Figure 2. The five targets were subjected to NMR for a chemical structure analysis. Eventually, four phenylpropanoid glycosides, including 31.6 mg of echinacoside, 65.3 mg of Jionoside A1, 28.9 mg of Forsythoside B, 74.1 mg of verbascoside, and 21.2 mg of kaempferol-3-O-rutinoside were obtained from 900 mg of the sample. Analysis via UPLC indicated that the final isolated compounds possessed a purity exceeding 85.23%, as depicted in Figure 3. The above results indicated HSCCC offers an efficient, scalable, and gentle method for the separation and purification of phenylpropanoid glycosides, preserving their structural integrity and bioactivity.

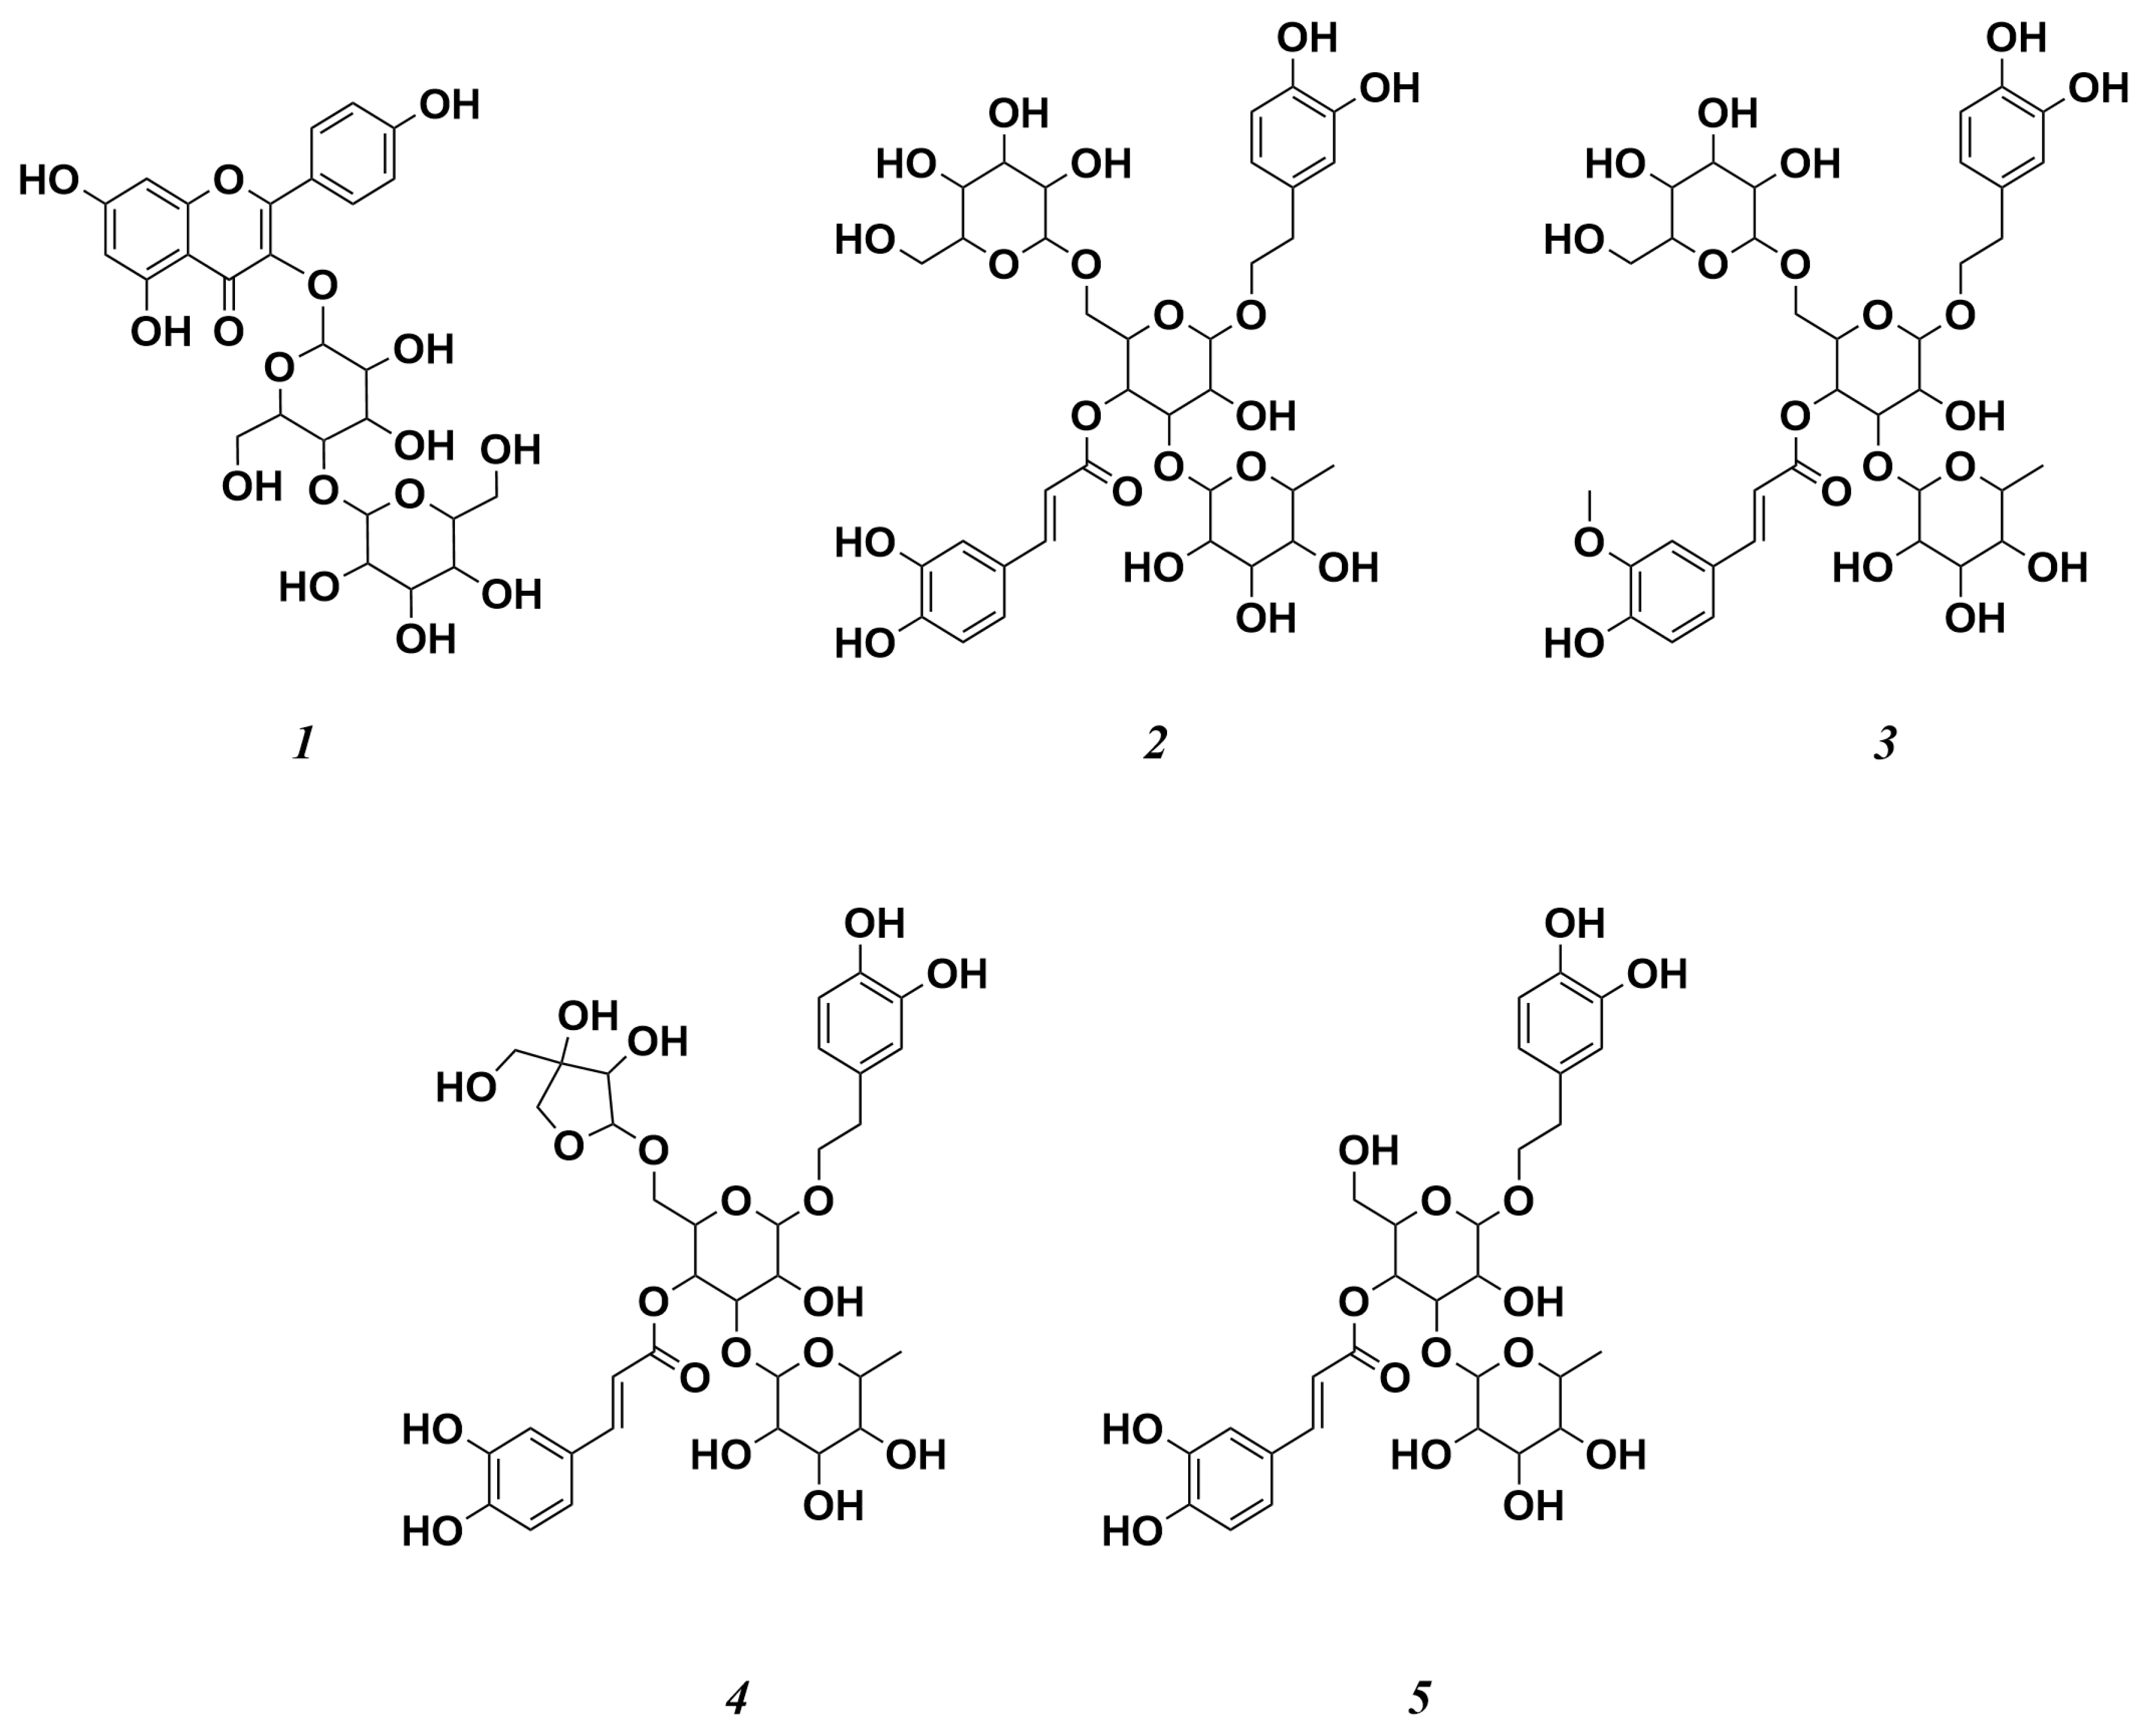
3.3. Structural Identification

The target compounds’ chemical structures were ascertained using 1H-NMR analysis (Figure 4), with the results summarized as follows:
Target 1: HRMS (m/z) 595.1607 [M + H]+ (calcd. for C27H30O15, 595.1657). 1H-NMR (DMSO-d6, 600 MHz) δ: 8.01 (2H, d, J = 8.7 Hz, 2′-H and 6′-H), 6.87 (2H, d, J = 8.6 Hz, 3′-H and 5′-H), 6.41 (1H, d, J = 1.9 Hz, 8-H), 6.22 (1H, d, J = 1.8 Hz, 6-H), 5.31 (1H, d, J = 7.4 Hz, 1″-H), 4.36 (1H, bs, 1‴-H), 3.69 (1H, bd, J = 10.1 Hz, 6a″-H), 3.69 (2H, m, 3‴-H and 5‴-H), 3.31 (1H, bd, J = 10.2 Hz, 6b″-H), 3.25 (2H, m, 5″-H and 2‴-H), 3.20 (1H, m, 3″-H), 3.15 (1H, m, 2″-H), 3.11 (1H, m, 4‴-H), 3.07 (1H, m, 4″-H), 0.98 (3H, d, J = 6.1 Hz, 6‴-H). The structure was determined as kaempferol-3-O-rutinoside based on the results of 1H NMR [37].
Target 2: HRMS (m/z) 804.2845 [M + NH4]+ (calcd. for C35H46O20, 804.2920). 1H-NMR (DMSO-d6, 600 MHz) δ (ppm): 7.48 (d, 1H, J = 14.9 Hz, H-7′), 7.03 (d, 1H, J = 1.8 Hz, H-2′), 6.99 (dd, 1H, J = 2.1 Hz, J = 8.8 Hz, H-6′), 6.78 (d, 1H, J = 8.3 Hz, H-5′), 6.66 (d, 1H, J = 1.9 Hz, H-2), 6.65 (d, 1H, J = 8.1 Hz, H-5), 6.52 (dd, 1H, J = 2.1 Hz, J = 8.4 Hz, H-6), 6.15 (d, 1H, J = 15.7 Hz, H-8′), 5.02 (s, 1H, Rha H-1), 4.72 (t, 1H, J = 9.7 Hz, Glu H-4), 4.35 (d, 1H, J = 7.91 Hz, Glu′ H-1), 4.14 (d, 1H, J = 7.82 Hz, Glu H-1), 3.88 (m, 1H, H-8), 3.71–2.92 (m, 16, H-8 or Rha/Glu/Glu′-H), 2.66 (m, 2H, H-7), 0.92 (d, 3H, J = 6.1 Hz, Rha H-6). The structure was determined as echinacoside based on the results of 1H NMR [38].
Target 3: HRMS (m/z) 801.2811 [M + H]+ (calcd. for C36H48O20, 801.2823). 1H-NMR (DMSO-d6, 600 MHz) δ (ppm): 7.55 (d, 1H, J = 15.6 Hz, H-7′), 7.27 (d, 1H, J = 1.7 Hz, H-2′), 7.09 (dd, 1H, J = 1.5 Hz, J = 8.5 Hz, H-6′), 6.79 (d, 1H, J = 8.0 Hz, H-5′), 6.66 (d, 1H, J = 2.3 Hz, H-2), 6.63 (d, 1H, J = 8.2 Hz, H-5), 6.52 (dd, 1H, J = 2.2 Hz, J = 7.8 Hz, H-6), 6.39 (d, 1H, J = 15.6 Hz, H-8′), 5.03 (s, 1H, Rha H-1), 4.73 (t, 1H, J = 9.73 Hz, Glu H-4), 4.38 (d, 1H, J = 7.9 Hz, Glu′ H-1), 4.17 (d, 1H, J = 8.3 Hz, Glu H-1), 3.87 (m, 1H, H-8), 3.77 (s, 3H, Ome), 3.70–2.90 (m, 16, H-8 or Rha/Glu/Glu′-H), 2.69 (m, 2H, H-7), 0.95 (d, 3H, J = 6.1 Hz, Rha H-6). The structure was determined as Jionoside A1 based on the results of 1H NMR [38].
Target 4: HRMS (m/z) 771.2751 [M + NH4]+ (calcd. for C34H44O19, 774.2815). 1H-NMR (DMSO-d6, 600 MHz) δ (ppm): 7.44 (d, 1H, J = 16.3 Hz, H-7′), 7.01 (s, 1H, H-2′), 6.95 (d, 1H, J = 6.8 Hz, H-6′), 6.71 (d, 1H, J = 6.9 Hz, H-5′), 6.61 (d, 1H, J = 2.1 Hz, H-2), 6.62 (d, 1H, J = 8.1 Hz, H-5), 6.47 (dd, 1H, J = 1.9 Hz, J = 7.8 Hz, H-6), 6.17 (d, 1H, J = 14.2 Hz, H-8′), 5.02 (s, 1H, Rha H-1), 4.78 (d, 1H, J = 2.8 Hz, Api H-1), 4.67 (t, 1H, J = 9.6 Hz, Glu H-4), 4.35 (d, 1H, J = 8.3 Hz, Glu H-1), 3.88–3.00 (m, 15H, H-8 or Rha/Glu/Api-H), 2.65 (m, 2H, H-7), 0.96 (d, 3H, J = 6.0 Hz, Rha H-6). The structure was determined as Forsythoside B based on the results of 1H NMR [38].
Target 5: HRMS (m/z) 642.2333 [M + NH4]+ (calcd. for C29H36O15, 642.2392). 1H-NMR (DMSO-d6, 600 MHz) δ (ppm): 7.45 (d, 1H, J = 16.2 Hz, H-7′), 6.99 (d, 1H, J = 1.7 Hz, H-2′), 6.97 (dd, 1H, J = 1.7 Hz, J = 8.6 Hz, H-6′), 6.74 (d, 1H, J = 8.1 Hz, H-5′), 6.64 (d, 1H, J = 1.7 Hz, H-2), 6.62 (d, 1H, J = 8.1 Hz, H-5), 6.49 (dd, 1H, J = 1.7 Hz, J = 7.7 Hz, H-6), 6.17 (d, 1H, J = 16.2 Hz, H-8′), 5.01 (s, 1H, Rha H-1), 4.72 (t, 1H, J = 9.3 Hz, Glu H-4), 4.35 (d, 1H, J = 7.7 Hz, Glu H-1), 3.88 (m, 1H, Rha H-2), 3.78 (m, 1H, Glu H-3), 3.75 (m, 2H, H-8), 3.55 (m, 1H, Rha H-3), 3.45–3.00 (m, 6H, Rha/Glu-H), 2.65 (m, 2H, H-7), 1.01 (d, 3H, J = 5.7 Hz, Rha H-6). The structure was determined as verbascoside based on the results of 1H NMR [38].

4. Conclusions

In this study, a DES was employed to fuel the extraction and counter-current separation of phenylpropanoid glycosides from Pedicularis oederi Vahl. After a response surface methodology optimization of ultrasonic-assisted extraction conditions, phenylpropanoid glycosides were well extracted and enriched. Under the optimal condition of 230 W ultrasonic power with a 50% water content in DESs and a liquid-to-solid ratio of 24, it yielded an extraction rate of 68.52%. Then, the extracted and enriched samples were separated by HSCCC with a DES-involved solvent system. Four phenylpropanoid glycosides, including 31.6 mg of echinacoside, 65.3 mg of Jionoside A1, 28.9 mg of Forsythoside B, 74.1 mg of verbascoside, and 21.2 mg of kaempferol-3-O-rutinoside were obtained from 900 mg of the sample in about 360 min. The results demonstrated DESs as alternative green solvents, widely exploitable in natural product extraction and separation.

Author Contributions

Conceptualization, D.Z. and D.L.; methodology, Y.W. (Yao Wang), J.D. and X.Z.; software, Y.W. (Yao Wang), J.D. and Y.W. (Yuhan Wang); validation, F.H.; formal analysis, Y.W. (Yao Wang), J.D. and L.L.; investigation, Y.W. (Yao Wang) and J.D.; resources, Y.W. (Yao Wang) and J.D.; data curation, D.Z.; writing—original draft preparation, Y.W. (Yao Wang), J.D., D.L. and D.Z.; writing—review and editing, Y.W. (Yao Wang), J.D., D.L. and D.Z.; visualization, Y.W. (Yao Wang) and J.D.; supervision, D.L. and D.Z.; project administration, D.L. and D.Z.; funding acquisition, D.L. and D.Z. All authors have read and agreed to the published version of the manuscript..

Funding

This research was funded by the National Natural Science Foundation of China grant number 82304892 and 32260129. And The APC was funded by 82304892.

Data Availability Statement

All data supporting the results of this study are included in the manuscript, and the datasets are available upon request.

Conflicts of Interest

The authors declare no conflicts of interest.

References

  1. Tkach, N.; Ree, R.H.; Kuss, P.; Röser, M.; Hoffmann, M.H. High mountain origin, phylogenetics, evolution, and niche conservatism of arctic lineages in the hemiparasitic genus Pedicularis (Orobanchaceae). Mol. Phylogenetics Evol. 2014, 76, 75–92. [Google Scholar] [CrossRef]
  2. Yatoo, M.I.; Dimri, U.; Gopalakrishnan, A.; Karthik, K.; Gopi, M.; Khandia, R.; Saminathan, M.; Saxena, A.; Alagawany, M.; Farag, M.R.; et al. Beneficial health applications and medicinal values of Pedicularis plants: A review. Biomed. Pharmacother. 2017, 95, 1301–1313. [Google Scholar] [CrossRef]
  3. Chen, C.; Zhao, X.-H.; Yue, H.-L.; Li, Y.-L.; Chen, T. Separation of Phenylpropanoid Glycosides from a Chinese Herb by HSCCC. J. Chromatogr. Sci. 2013, 52, 395–399. [Google Scholar] [CrossRef]
  4. Jessop, P.G.; Phan, L.; Carrier, A.; Robinson, S.; Dürr, C.J.; Harjani, J.R. A solvent having switchable hydrophilicity. Green Chem. 2010, 12, 809–814. [Google Scholar] [CrossRef]
  5. Jessop, P.G. Searching for green solvents. Green Chem. 2011, 13, 1391–1398. [Google Scholar] [CrossRef]
  6. Cao, J.; Chen, L.; Li, M.; Cao, F.; Zhao, L.; Su, E. Two-phase systems developed with hydrophilic and hydrophobic deep eutectic solvents for simultaneously extracting various bioactive compounds with different polarities. Green Chem. 2018, 20, 1879–1886. [Google Scholar] [CrossRef]
  7. Erythropel, H.C.; Zimmerman, J.B.; de Winter, T.M.; Petitjean, L.; Melnikov, F.; Lam, C.H.; Lounsbury, A.W.; Mellor, K.E.; Janković, N.Z.; Tu, Q.; et al. The Green ChemisTREE: 20 years after taking root with the 12 principles. Green Chem. 2018, 20, 1929–1961. [Google Scholar] [CrossRef]
  8. Huang, J.; Guo, X.; Xu, T.; Fan, L.; Zhou, X.; Wu, S. Ionic deep eutectic solvents for the extraction and separation of natural products. J. Chromatogr. A 2019, 1598, 1–19. [Google Scholar] [CrossRef]
  9. Afonso, J.; Mezzetta, A.; Marrucho, I.M.; Guazzelli, L. History repeats itself again: Will the mistakes of the past for ILs be repeated for DESs? From being considered ionic liquids to becoming their alternative: The unbalanced turn of deep eutectic solvents. Green Chem. 2023, 25, 59–105. [Google Scholar] [CrossRef]
  10. Wang, T.; Wang, Q.; Li, P.; Yang, H. High-Speed Countercurrent Chromatography-Based Method for Simultaneous Recovery and Separation of Natural Products from Deep Eutectic Solvent Extracts. ACS Sustain. Chem. Eng. 2020, 8, 2073–2080. [Google Scholar] [CrossRef]
  11. Coskun, O. Separation techniques: Chromatography. North. Clin. Istanb. 2016, 3, 156. [Google Scholar]
  12. Zou, D.; Cui, Y.; Li, S.; Sang, D.; Liu, W.; Zhao, T.; Gu, X.; Chen, T.; Li, Y. The applicability of high-speed counter-current chromatography for preparative separation of biosynthesis products: Glycosylation products as example. J. Sep. Sci. 2021, 44, 4368–4375. [Google Scholar] [CrossRef]
  13. Chen, T.; Jia, J.; Zou, D.; Shen, C.; Wang, S.; Gao, X.; Yun, Z.; Ma, J.; Zhao, J.; Wang, H. Nuclear magnetic resonance-based solvent system selection for counter-current chromatography separation of compounds present in the same high-performance liquid chromatography peak: Flavonoids in barley seedlings as an example. J. Sep. Sci. 2023, 46, 2300406. [Google Scholar] [CrossRef]
  14. Zou, D.; Du, Y.; Kuang, J.; Sun, S.; Ma, J.; Jiang, R. PH-zone-refining counter-current chromatography with a hydrophilic organic/salt-containing two-phase solvent system for preparative separation of polar alkaloids from natural products. J. Chromatogr. A 2018, 1553, 1–6. [Google Scholar] [CrossRef]
  15. Wang, Q.; Chen, T.; Cui, Y.; Li, S.; Jiang, X.; Zhao, G.; Li, Y.; Zou, D. The applicability of pH-zone-refining counter-current chromatography for preparative separation of biosynthesis products: Glycosylation products as example. J. Chromatogr. A 2021, 1657, 462582. [Google Scholar] [CrossRef]
  16. Chen, T.; Wang, Q.; Wang, Q.; La, M.; Li, Y.; He, L.; Zou, D. Ab initio calculation based solvent system selection in silico for counter-current chromatography: Separation of resibufogenin glycosylation products. J. Chromatogr. A 2022, 1686, 463649. [Google Scholar] [CrossRef]
  17. Tanimura, T.; Pisano, J.J.; Ito, Y.; Bowman, R.L. Droplet Countercurrent Chromatography. Science 1970, 169, 54–56. [Google Scholar] [CrossRef]
  18. Ito, Y.; Conway, W.D. Development of countercurrent chromatography. Anal. Chem. 1984, 56, 534A–554A. [Google Scholar] [CrossRef]
  19. Conway, W.D.; Ito, Y. Resolution in Countercurrent Chromatography. J. Liq. Chromatogr. 1985, 8, 2195–2207. [Google Scholar] [CrossRef]
  20. Brent Friesen, J.; Pauli, G.F. GUESS—A Generally Useful Estimate of Solvent Systems for CCC. J. Liq. Chromatogr. Rel. Technol. 2005, 28, 2777–2806. [Google Scholar] [CrossRef]
  21. Ito, Y. Golden rules and pitfalls in selecting optimum conditions for high-speed counter-current chromatography. J. Chromatogr. A 2005, 1065, 145–168. [Google Scholar] [CrossRef]
  22. Zou, D.l.; Chen, T.; Li, H.m.; Chen, C.; Zhao, J.y.; Li, Y.l. Separation of three phenolic high-molecular-weight compounds from the crude extract of Terminalia Chebula Retz. by ultrasound-assisted extraction and high-speed counter-current chromatography. J. Sep. Sci. 2016, 39, 1278–1285. [Google Scholar] [CrossRef]
  23. Yu, P.; Ma, J.; Du, Y.; Wang, Q.; Chen, C.; Bai, X.; He, L.; Zou, D. An efficient strategy based on liquid-liquid extraction and pH-zone-refining counter-current chromatography for selective enrichment, separation, and purification of alkaloids and organic Acids from natural products. J. Sep. Sci. 2020, 43, 3607–3614. [Google Scholar] [CrossRef]
  24. Zou, D.; Zhu, X.; Zhang, F.; Du, Y.; Ma, J.; Jiang, R. An Efficient Strategy Based on Liquid–Liquid Extraction with Three-Phase Solvent System and High Speed Counter-Current Chromatography for Rapid Enrichment and Separation of Epimers of Minor Bufadienolide from Toad Meat. J. Agric. Food Chem. 2018, 66, 1008–1014. [Google Scholar] [CrossRef]
  25. Li, J.; Wang, Q.; Wang, Y.; La, M.; Mian, R.; He, L.; Suonan, J.; Zou, D. An efficient strategy for large-scale preparation of low polarity gingerols directly from ginger crude extract by high-speed countercurrent chromatography with different rotation mode. J. Sep. Sci. 2023, 46, 2300320. [Google Scholar] [CrossRef]
  26. Khuri, A.I.; Mukhopadhyay, S. Response surface methodology. Wiley Interdiscip. Rev. Comput. Stat. 2010, 2, 128–149. [Google Scholar] [CrossRef]
  27. Liu, G.; Feng, S.; Sui, M.; Chen, B.; Sun, P. Extraction and identification of steroidal saponins from Polygonatum cyrtonema Hua using natural deep eutectic solvent-synergistic quartz sand-assisted extraction method. J. Sep. Sci. 2023, 46, 2200823. [Google Scholar] [CrossRef]
  28. Vyviurska, O.; Koljančić, N.; Gomes, A.A.; Špánik, I. Optimization of enantiomer separation in flow-modulated comprehensive two-dimensional gas chromatography by response surface methodology coupled to artificial neural networks: Wine analysis case study. J. Chromatogr. A 2022, 1675, 463189. [Google Scholar] [CrossRef]
  29. He, Q.; Lei, Q.; Huang, S.; Zhou, Y.; Liu, Y.; Zhou, S.; Peng, D.; Deng, X.; Xue, J.; Li, X. Effective extraction of bioactive alkaloids from the roots of Stephania tetrandra by deep eutectic solvents-based ultrasound-assisted extraction. J. Chromatogr. A 2023, 1689, 463746. [Google Scholar] [CrossRef]
  30. Dean, A.; Voss, D.; Draguljić, D.; Dean, A.; Voss, D.; Draguljić, D. Response surface methodology. In Design and Analysis of Experiments; Springer: Berlin/Heidelberg, Germany, 2017; pp. 565–614. [Google Scholar]
  31. Oka, F.; Oka, H.; Ito, Y. Systematic search for suitable two-phase solvent systems for high-speed counter-current chromatography. J. Chromatogr. A 1991, 538, 99–108. [Google Scholar] [CrossRef]
  32. Sutherland, I.A. Recent progress on the industrial scale-up of counter-current chromatography. J. Chromatogr. A 2007, 1151, 6–13. [Google Scholar] [CrossRef]
  33. Conway, W.D. Counter-current chromatography: Simple process and confusing terminology. J. Chromatogr. A 2011, 1218, 6015–6023. [Google Scholar] [CrossRef]
  34. Hopmann, E.; Arlt, W.; Minceva, M. Solvent system selection in counter-current chromatography using conductor-like screening model for real solvents. J. Chromatogr. A 2011, 1218, 242–250. [Google Scholar] [CrossRef]
  35. Hopmann, E.; Frey, A.; Minceva, M. A priori selection of the mobile and stationary phase in centrifugal partition chromatography and counter-current chromatography. J. Chromatogr. A 2012, 1238, 68–76. [Google Scholar] [CrossRef]
  36. Hu, R.; Pan, Y. Recent trends in counter-current chromatography. TrAC Trends Anal. Chem. 2012, 40, 15–27. [Google Scholar] [CrossRef]
  37. Jang, Y.S.; Wang, Z.; Lee, J.-M.; Lee, J.-Y.; Lim, S.S. Screening of Korean Natural Products for Anti-Adipogenesis Properties and Isolation of Kaempferol-3-O-rutinoside as a Potent Anti-Adipogenetic Compound from Solidago virgaurea. Molecules 2016, 21, 226. [Google Scholar] [CrossRef]
  38. Zhang, L.; Yue, H.L.; Zhao, X.H.; Li, J.; Shao, Y. Separation of Four Phenylpropanoid Glycosides from a Chinese Herb by HSCCC. J. Chromatogr. Sci. 2014, 53, 860–865. [Google Scholar] [CrossRef]
Figure 1. Response surface showing interaction of variable factors on Y: (A) interaction between ultrasonic power and water content; (B) interaction between ultrasonic power with liquid/solid ratio; (C) interaction between water content and liquid/solid ratio.
Separations 11 00323 g001
Figure 2. High-speed counter-current chromatography (HSCCC) chromatogram of the sample using the ethyl acetate/aqueous solution of choline chloride and glycerol (6:6, v/v). Conditions: stationary phase, lower phase; flow rate, 10 mL/min; revolution speed, 1100 rpm; sample amount, 1.0 g; separation temperature, 45 °C; detection wavelength, 320 nm; retention of the stationary phase: 65%.
Separations 11 00323 g002
Figure 3. UPLC chromatograms of the fractions obtained through HSCCC, 80% MR elution fraction, and the crude extract. Conditions: Separation was carried out using an Acquity UHPLCHSS T3 column (2.1 × 100 mm, 1.8 μm; Waters) at a maintained temperature of 35 °C. The delineated mobile phases included water supplemented with 0.1% formic acid (A) and acetonitrile (B). The elution gradient was as follows: 5–100% B in 0–8 min and 100% B in 8–10 min, operating at a flow rate of 0.3 mL/min. The procedure involved an injection volume set at 1.0 μL. Throughout the process, a consistent column temperature of 35 °C was upheld, coupled with a detection wavelength pinpointed at 320 nm.
Separations 11 00323 g003
Figure 4. The chemical structures of kaempferol-3-O-rutinoside (Target 1), echinacoside (Target 2), Jionoside A1 (Target 3), Forsythoside B (Target 4), and verbascoside (Target 5).
Separations 11 00323 g004
Table 1. Box–Behnken design matrix and experimental response.
StdIDRunFactor 1Factor 2Factor 3Response 1
A: Ultrasonic PowerB: Water ContentC: Liquid/Solid RatioContent of Targets
W%1%
17131300402063.41
15132300402066.06
553200401055.86
13134300402065.99
885400403060.15
776200403060.52
12127300503065.7
668400401052.58
119200302050.23
161310300402064.85
101011300501058.33
111112300303052.88
3313200502069.44
2214400302054.58
141315300402064.52
4416400502060.97
9917300301050.15
Table 2. Analysis of variance.
SourceSum of SquaresdfMean SquareF-Valuep-Value
Model589.59965.5156.48<0.0001significant
A—Ultrasonic power7.5517.556.510.0381
B—Water content271.451271.45234.04<0.0001
C—Liquid/solid ratio62.33162.3353.740.0002
AB41.09141.0935.430.0006
AC2.1212.121.830.2187
BC5.3815.384.640.0682
A233.58133.5828.960.0010
B246.88146.8840.420.0004
C299.62199.6285.90<0.0001
Residual8.1271.16
Lack of fit3.2431.080.88540.5207not significant
Pure error4.8841.22
Cor total597.7116
Table 3. K values of target compounds.
Solvent SystemsK2K3K4K5
5:9 (4:5)0.140.080.160.21
5:8 (3:5)0.200.190.260.32
5:7 (2:5)0.330.410.550.62
5:6 (1:5)0.420.690.780.93
6:6 (1:5)0.570.901.392.17
7:6 (1:5)0.941.121.492.66
Disclaimer/Publisher’s Note: The statements, opinions and data contained in all publications are solely those of the individual author(s) and contributor(s) and not of MDPI and/or the editor(s). MDPI and/or the editor(s) disclaim responsibility for any injury to people or property resulting from any ideas, methods, instructions or products referred to in the content.

