Abstract
The hot spot extraction agent N,N,N′,N′-tetraoctyl-3-oxoglutaramide (TODGA) has the advantages of novelty, high efficiency and environmental protection in the separation of rare earths by tandem extraction. In this paper, the characteristic parameters for the separation of dysprosium, erbium, thulium and ytterbium ions in the TOGDA–kerosene/hydrochloric acid system for tandem extraction were calculated. Using a 10% TODGA–kerosene/5 mol·L−1 hydrochloric acid extraction system, the mixture containing Dy3+ 0.258 mol·L−1, Er3+ 0.252 mol·L−1, Tm3+ 0.248 mol·L−1 and Yb3+ 0.242 mol·L−1 can be separated by three separation steps, and four products of Dy3+, Er3+, Tm3+ and Yb3+ can be obtained. The purity of the four products was 99.80%, 99.20%, 99.70% and 99.70%, and the yields were 99.03%, 98.97%, 97.88% and 96.98%, in order. In this paper, the reasons were analyzed for the differences in the ability of the TODGA system to extract heavy rare earth ions (REEs) in terms of density functionality, complex structure and bond valence model. These will provide more basic data and guidance for the industrial application of TODGA.
1. Introduction
Due to their utilization in cutting-edge and advanced industries, the strategic importance of the RE elements has been established [1]. The RE elements can be classified into two groups: the cerium group, often referred to as the light group, and the yttrium group, also known as the heavy group [2,3]. The unique physicochemical properties of heavy rare earth elements (HREs consist of yttrium, holmium, erbium, thulium, ytterbium and lutetium) [4] have made them extensively utilized in diverse areas like optoelectronics and electromagnets. These HREs find applications in laser media [5], radiation sources [6], scintillation crystals [7] and tungsten–tellurite glasses that are doped with erbium (Er3+), erbium/thulium (Er3+/Tm3+) and erbium/thulium/ytterbium (Er3+/Tm3+/Yb3+) [8].
As the global demand for heavy rare earths (HREs) in advanced materials continues to rise, there has been significant focus on the separation and purification processes. Nevertheless, the individual separation of HREs is challenging due to their closely related electronic structures [9,10]. Separating individual rare earth ions (REEs) poses a significant and daunting challenge for scientists [11].
The stable trivalent ions of similar sizes among RE elements give rise to their closely interconnected physical and chemical properties [12]. The chemical solubility of these elements exhibits minor changes within the lanthanide series but remains largely similar. Although it is possible to chemically separate RE elements into individual RE oxides, the process of separation is nonetheless challenging [13,14]. The separation of RE elements by exploiting variations in their basic properties at the same oxidation state encompasses several techniques, including fractionation crystallization, fractionation precipitation, adsorption, ion exchange, solvent extraction, membrane separation and liquid–liquid chromatography [12]. The typical method for HRE production is the mining of rare earth ore by hydrometallurgy. One of the most widely used separation methods is solvent extraction. This method relies on the differential solubility of metal ions in two immiscible solvents, typically employing water and organic solvents such as kerosene as the diluent solvent, along with an extractant capable of extracting metals in a complex form [15].
HEH[EHP] (2-ethyl(hexyl) phosphonic acid mono-2-ethylhexyl ester), also known as P507, is extensively utilized as an extractant for individual rare earth element (REE) separation in the Chinese rare earth industry [16]. Nevertheless, certain properties of HEH[EHP] for REE separation, such as the treatment of saponification wastewater, remain unsatisfactory [17]. The smaller ionic radius of heavy rare earth elements (HREs) compared to the light REEs, known as lanthanide contraction [18], gives them enhanced coordination capabilities. Nevertheless, incomplete stripping of HREs during separation processes can result in substantial resource wastage, particularly considering their limited occurrence in natural minerals.
As a result, numerous innovative extraction systems were proposed. In a study conducted by Abreu et al. [19], the effectiveness of three organophosphorus acids (DEHPA, IONQUEST®801 and CYANEX®272), a combination of DEHPA/TOPO (a neutral ester) and three amines (ALAMINE®336, ALIQUAT®336 and PRIMENE®JM-T) was investigated for the separation of HREs in hydrochloric and sulfuric acid environments. Cyanex272 was commonly utilized for the separation of nickel and cobalt in the past. Furthermore, comprehensive studies were conducted on its extraction behavior for all rare earth elements (REEs) [20]. Whereafter, the synergistic system consisting of P507 and Cyanex272 has garnered considerable attention and continues to be of significant interest to researchers [21,22,23,24]. Additionally, the incorporation of long-chain aliphatic alcohols [25] into the P507 extractant was successfully implemented. Room-temperature Ionic liquids, known for their minimal vapor pressure, excellent stability and eco-friendly properties, have emerged as a viable substitute for volatile organic solvents [26,27,28,29]. Both as diluents and extractants, they have found widespread use in the separation of metal ions. The extraction and separation properties of rare earth elements (REEs) using [A336][P507] and [A336][P204] in chloride and nitrate media were extensively investigated and compared [30]. A novel extractant called 2-ethylhexyl-3-(2ethylhexylamino)-pentan-3-yl phosphonic acid (HA), an α-aminophosphonic acid extractant, was synthesized for the purpose of extracting and separating REs. The extraction capacity of the extractant, formation of extraction chelates, separation factors and the stripping process of the loaded organic solution were thoroughly investigated [31].
The extractants used in existing studies for the separation of HREs are still mainly phosphorus-containing extractants, which are prone to environmental pollution. The extractant used in this study is TODGA; in addition to the study of the factors affecting the distribution ratio for the separation of Dy3+, Er3+, Tm3+ and Yb3+ by TODGA, the process parameters for the separation of liquid–liquid extraction for the obtainment of a single rare earth ionic product is calculated according to the fractional extraction method.
2. Materials and Methods
2.1. Reagents and Materials
The standard reagent was purchased from Guobiao (Beijing) Testing & Certification Co., Ltd., China. The standard solutions of Dy3+, Er3+, Tm3+ and Yb3+ were 10.00 mg·mL−1 and contain 2.0 mol·L−1 nitric acid. Hydrochloric acid was analytically pure (Sinopharm Chemical Reagent Co., Ltd., Shanghai, China). Kerosene was industrial grade (Jinan Hongcheng Chemical Co., Ltd., Jinan, China). TODGA was synthesized by our laboratory. REEs were determined by 715-ES ICP-OES (Varian Medical Systems, Palo Alto, CA, USA). Plastic and glassware were soaked in 10% nitric acid for 24 h and rinsed with ultrapure water before being used in the experiment.
2.2. Experimental Methods
2.2.1. Liquid–Liquid Extraction
The single REE solution and TODGA–kerosene solution (TODGA-KS) of the hydrochloric acid system were accurately measured in a 10 mL plug centrifuge tube and oscillated in a water bath oscillator for 10 min to achieve a balanced extraction. The extracted mixture was centrifuged at 3000 rpm for 3 min to separate the layers. The concentration of REE in the aqueous phase was directly measured by ICP-OES according to GB/T 18882.1-2008 [32] and the concentration of REE in the organic phase was calculated by Equation (1).
where is the ion concentration in organic solution after extraction equilibration, is the ion concentration in an aqueous phase solution before extraction, is the ion concentration in aqueous solution after extraction equilibration, is the volume of the aqueous phase and is the volume of the organic phase.
Liquid–liquid extraction was carried out under the given experimental conditions to obtain the concentration of cations in the organic and aqueous phases after extraction reached equilibrium. Equation (2) is used to calculate the distribution ratio (D) of ions under corresponding experimental conditions; and are the same as Equation (1).
The distribution ratios of REEs were determined for different concentrations of REEs, different acid concentrations of the aqueous phase, different extraction times and different extraction temperatures.
2.2.2. Saturation Concentrations of Dy3+, Er3+, Tm3+ and Yb3+ in TODGA–Kerosene Medium
Dy3+, Er3+, Tm3+ and Yb3+ were mixed in a concentration ratio of 1:1:1:1. The material solution was prepared with total REE concentrations of 1.000 mol·L−1, 0.567 mol·L−1 and 0.353 mol·L−1, respectively. A total of 10 mL of the material solution and 10 mL of TODGA–kerosene solution (10% TODGA content) was added to a 30 mL separatory funnel. The separatory funnel was shaken at 20 °C for 10 min and then left to stand until the organic and aqueous phases stratified. Then, the extract from the 1st stage was mixed with 10 mL of the material solution, and after the 2nd extraction, the extract was mixed with 10 mL of the material solution again. This process was repeated until a total of five extractions were completed. Five extractions were carried out sequentially with material solutions of 1.000 mol·L−1, 0.567 mol·L−1 and 0.353 mol·L−1.
The first three raffinate aqueous phases were mixed. The total concentration of REEs () in this mixed solution was determined. was substituted into Equation (3) to calculate the saturation concentration of mixed REEs in the organic phase ().
where is the saturation concentration of REEs in TODGA-KS, is REEs concentration in the feed solution and is the total concentration of REEs in the mixed solution of the first three raffinate aqueous phases.
2.2.3. Theoretical Calculations and Experimental Validation of Cascade Extraction
Using the experimental data, the material equilibrium data of Dy3+, Er3+, Tm3+ and Yb3+ were calculated step by step by fractional extraction [23], and the feed solution, organic phase and aqueous phase were prepared according to the theoretical calculation.
3. Results and Discussion
3.1. Distribution Ratios of Dy3+, Er3+, Tm3+ and Yb3+ in the TODGA–Kerosene/Hydrochloric Acid System
3.1.1. Effect of Acid Concentration
The concentration of acid in the aqueous phase during cascade extraction is an important influence on the REE distribution ratio. The inorganic acid used in the separation system employed in this experiment was hydrochloric acid. The correlation between the distribution ratios of Dy3+, Er3+, Tm3+ and Yb3+ and the concentration of hydrochloric acid was determined when the concentration of Dy3+, Er3+, Tm3+ and Yb3+ was 150 mg·L−1, as shown in Figure 1.
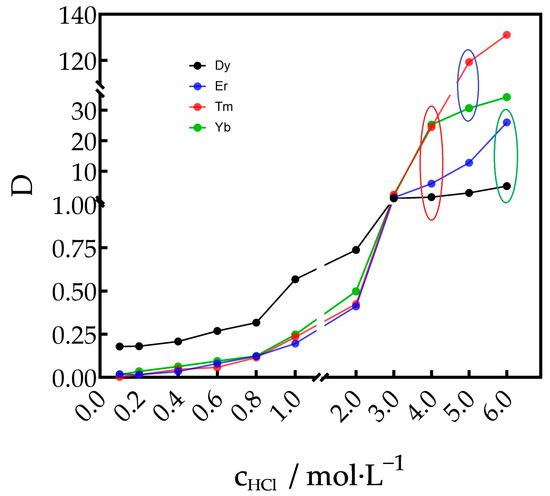
Figure 1.
Distribution ratios of Dy3+, Er3+, Tm3+ and Yb3+ at different hydrochloric acid concentrations.
When the hydrochloric acid concentration was less than 3.0 mol·L−1, the distribution ratios of the four REEs slightly increased with the increase in hydrochloric acid concentration. The distribution ratios of Dy3+, Er3+, Tm3+ and Yb3+ were 1.084, 1.364, 2.359 and 1.872, respectively, in order. The difference between the distribution ratios of each element was not obvious. When the hydrochloric acid concentration increased to 4.0 mol·L−1, the distribution ratios of Dy3+, Er3+, Tm3+ and Yb3+ were 1.517, 5.927, 24.430 and 25.231, respectively, in order. The difference between the distribution ratios began to increase gradually. When the concentration of hydrochloric acid is 5.0 mol·L−1, the distribution ratios of Dy3+, Er3+, Tm3+ and Yb3+ were 2.903, 12.718, 119.258 and 30.641, respectively, in order. The difference between the distribution ratios of Tm3+ and Yb3+ was the largest, so the distribution coefficient between them reached the maximum. When the concentration of hydrochloric acid is 6.0 mol·L−1, the distribution ratios of Dy3+, Er3+, Tm3+ and Yb3+ were 5.153, 25.983, 131.069 and 34.250. The difference between the distribution ratios of Dy3+ and Er3+ was the largest, so the distribution coefficient between them reached the maximum. The presence of anions in the outer-coordination sphere is crucial in low-dielectric constant organic solvents due to the strong electrostatic force [28]. In this experiment, chloride ions (Cl−) serve as the anions that fulfill this role.
3.1.2. Effect of REE Concentration
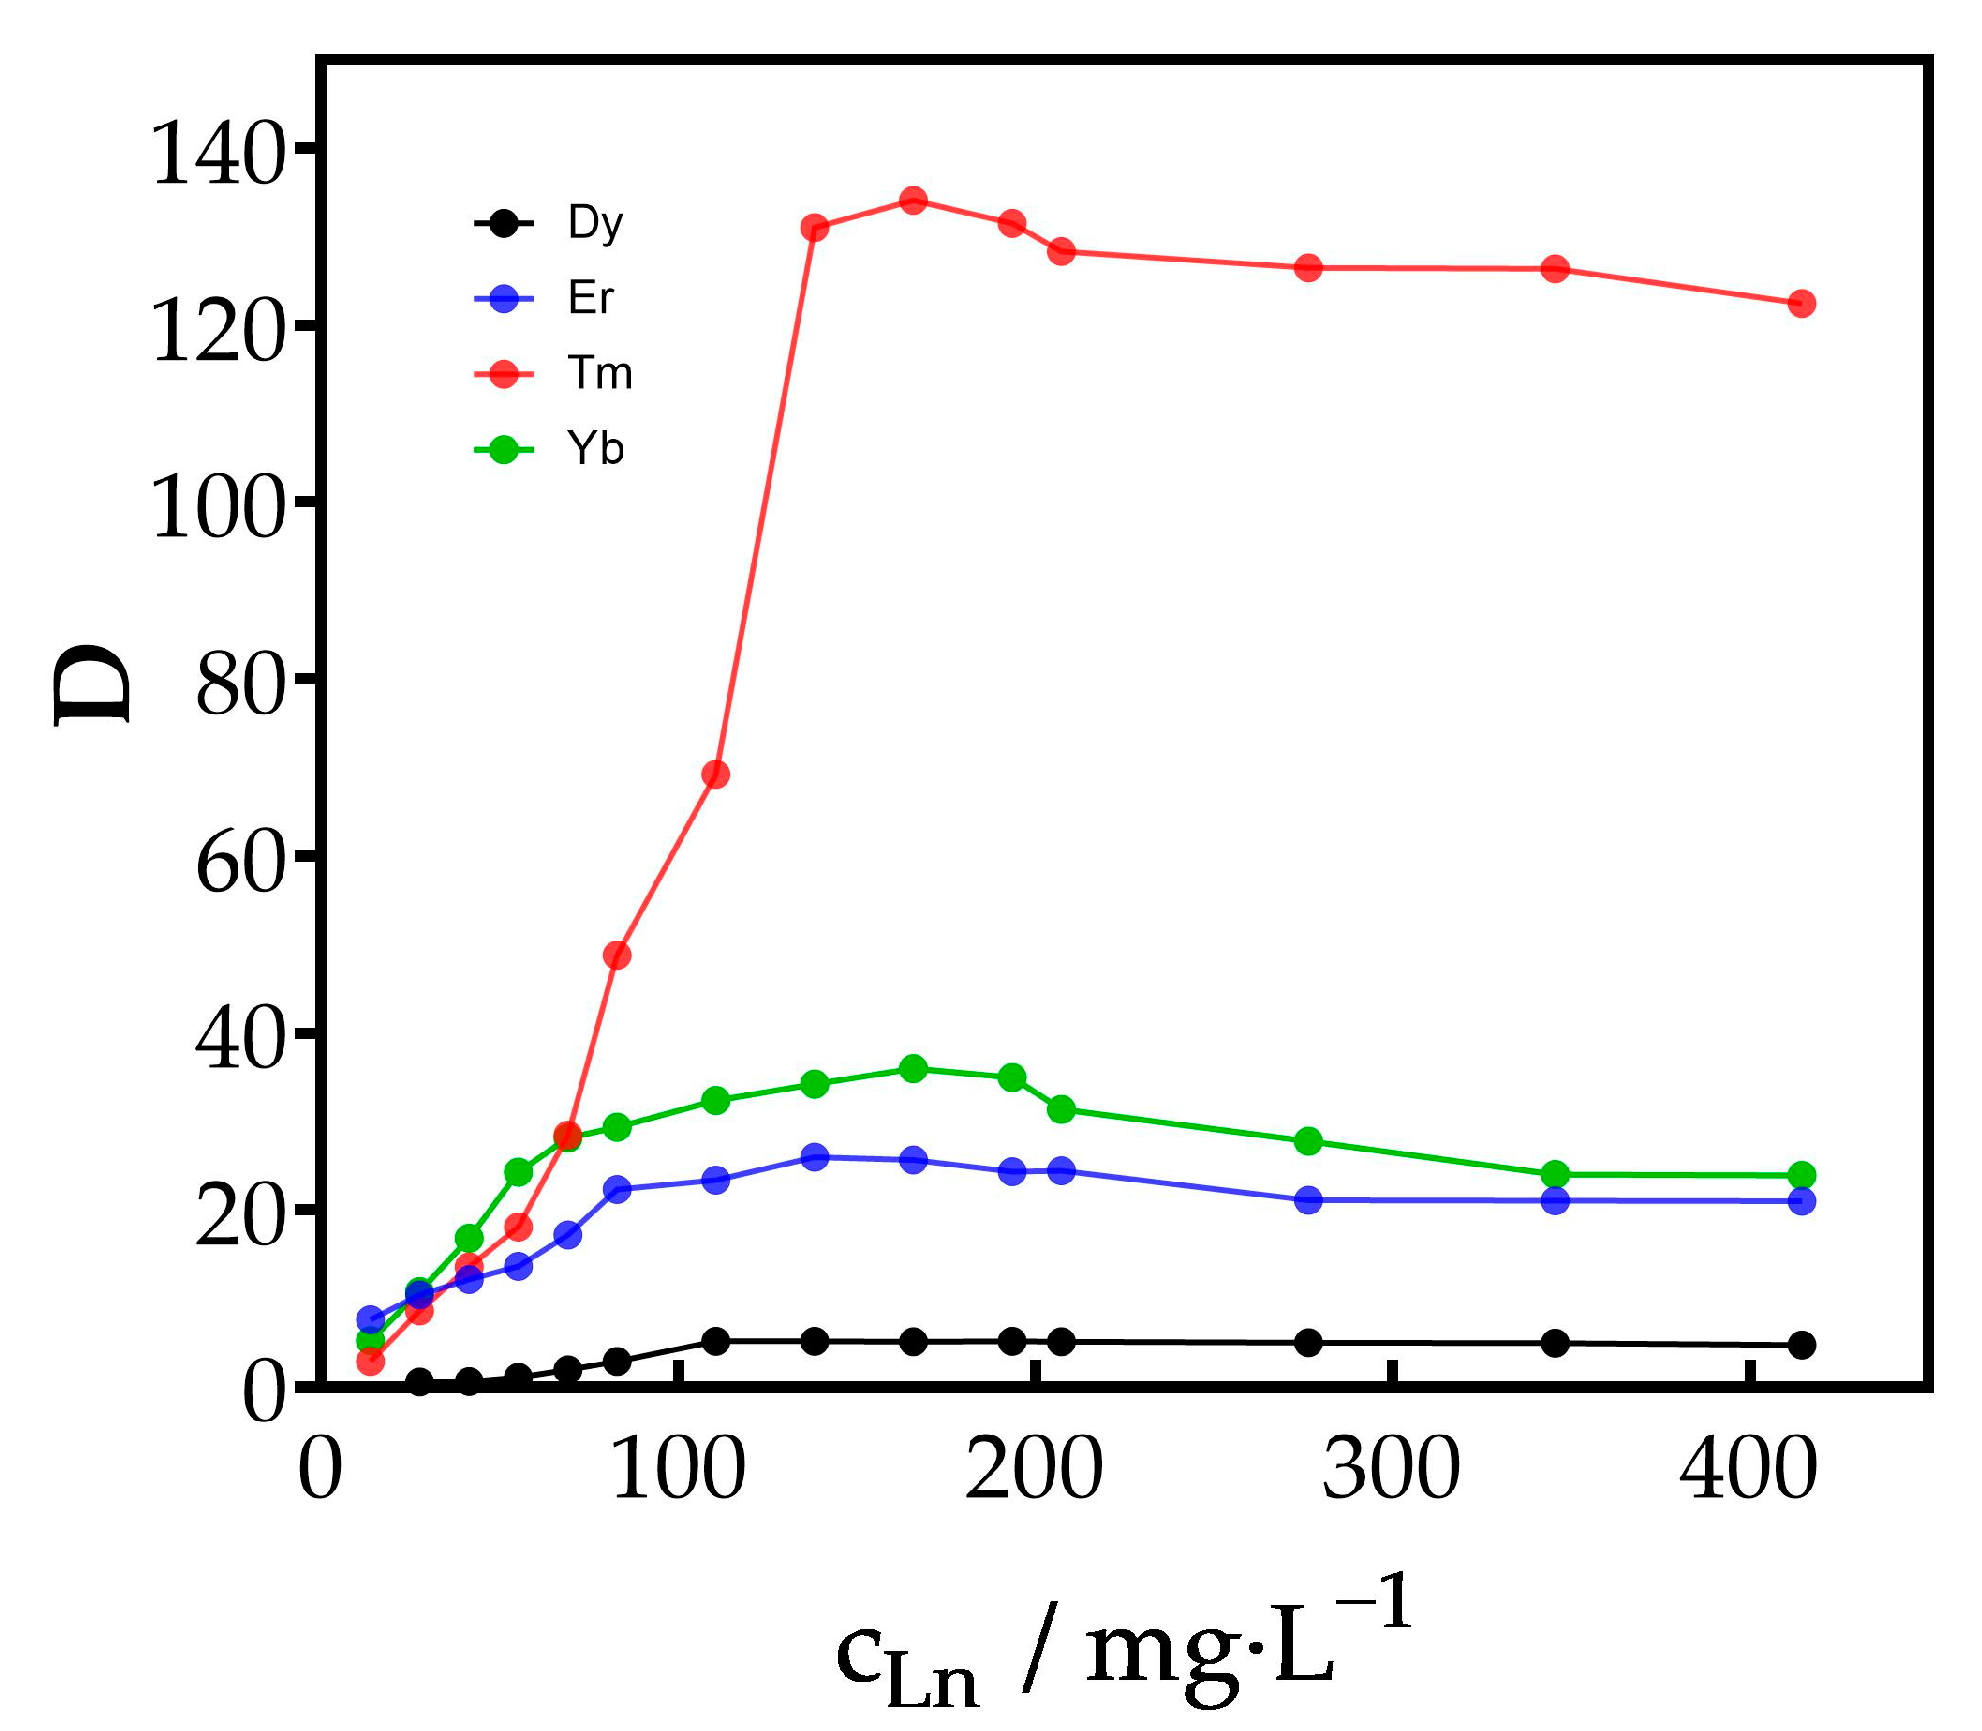
In order to explore the effect of the concentrations of Dy3+, Er3+, Tm3+ and Yb3+ on the distribution ratio, the distribution ratio was determined during the process of changing the concentration of the given ion in the feed solution from 13 mg·L−1 to 414 mg·L−1, as shown in Figure 2. For Dy3+, when the concentration increased from 13 mg·L−1 to 110 mg·L−1, the distribution ratio increased from 0.543 to 5.153 quickly. After exceeding 110 mg·L−1, the distribution ratio remained in the range of 4.726 to 5.177. For Er3+, when the concentration increased from 13 mg·L−1 to 83 mg·L−1, the distribution ratio increased from 7.599 to 22.325 quickly. After exceeding 83 mg·L−1, the distribution ratio remained in the range of 20.987 to 25.983. For Tm3+, when the concentration increased from 13 mg·L−1 to 135 mg·L−1, the distribution ratio increased from 2.883 to 131.069 quickly. After exceeding 135 mg·L−1, the distribution ratio remained in the range of 122.471 to 134.161. For Yb3+, when the concentration increased from 13 mg·L−1 to 55 mg·L−1, the distribution ratio increased from 5.223 to 24.261 quickly. After exceeding 55 mg·L−1, the distribution ratio remained in the range of 23.919 to 35.992. When the concentrations of Dy3+, Er3+, Tm3+ and Yb3+ in the feed solution exceeded 135 mg·L−1, the distribution ratios of all four ions stabilized in a small range. Therefore, the distribution ratio can be approximated as a fixed value when the concentrations of Dy3+, Er3+, Tm3+ and Yb3+ in the feed solution exceed 135 mg·L−1.
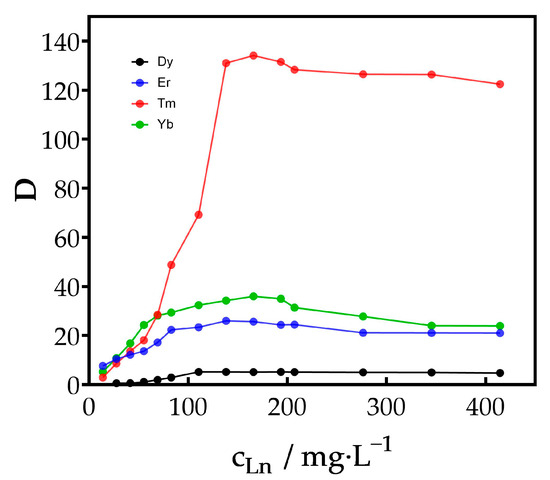
Figure 2.
Distribution ratios of Dy3+, Er3+, Tm3+ and Yb3+ at different iron concentrations.
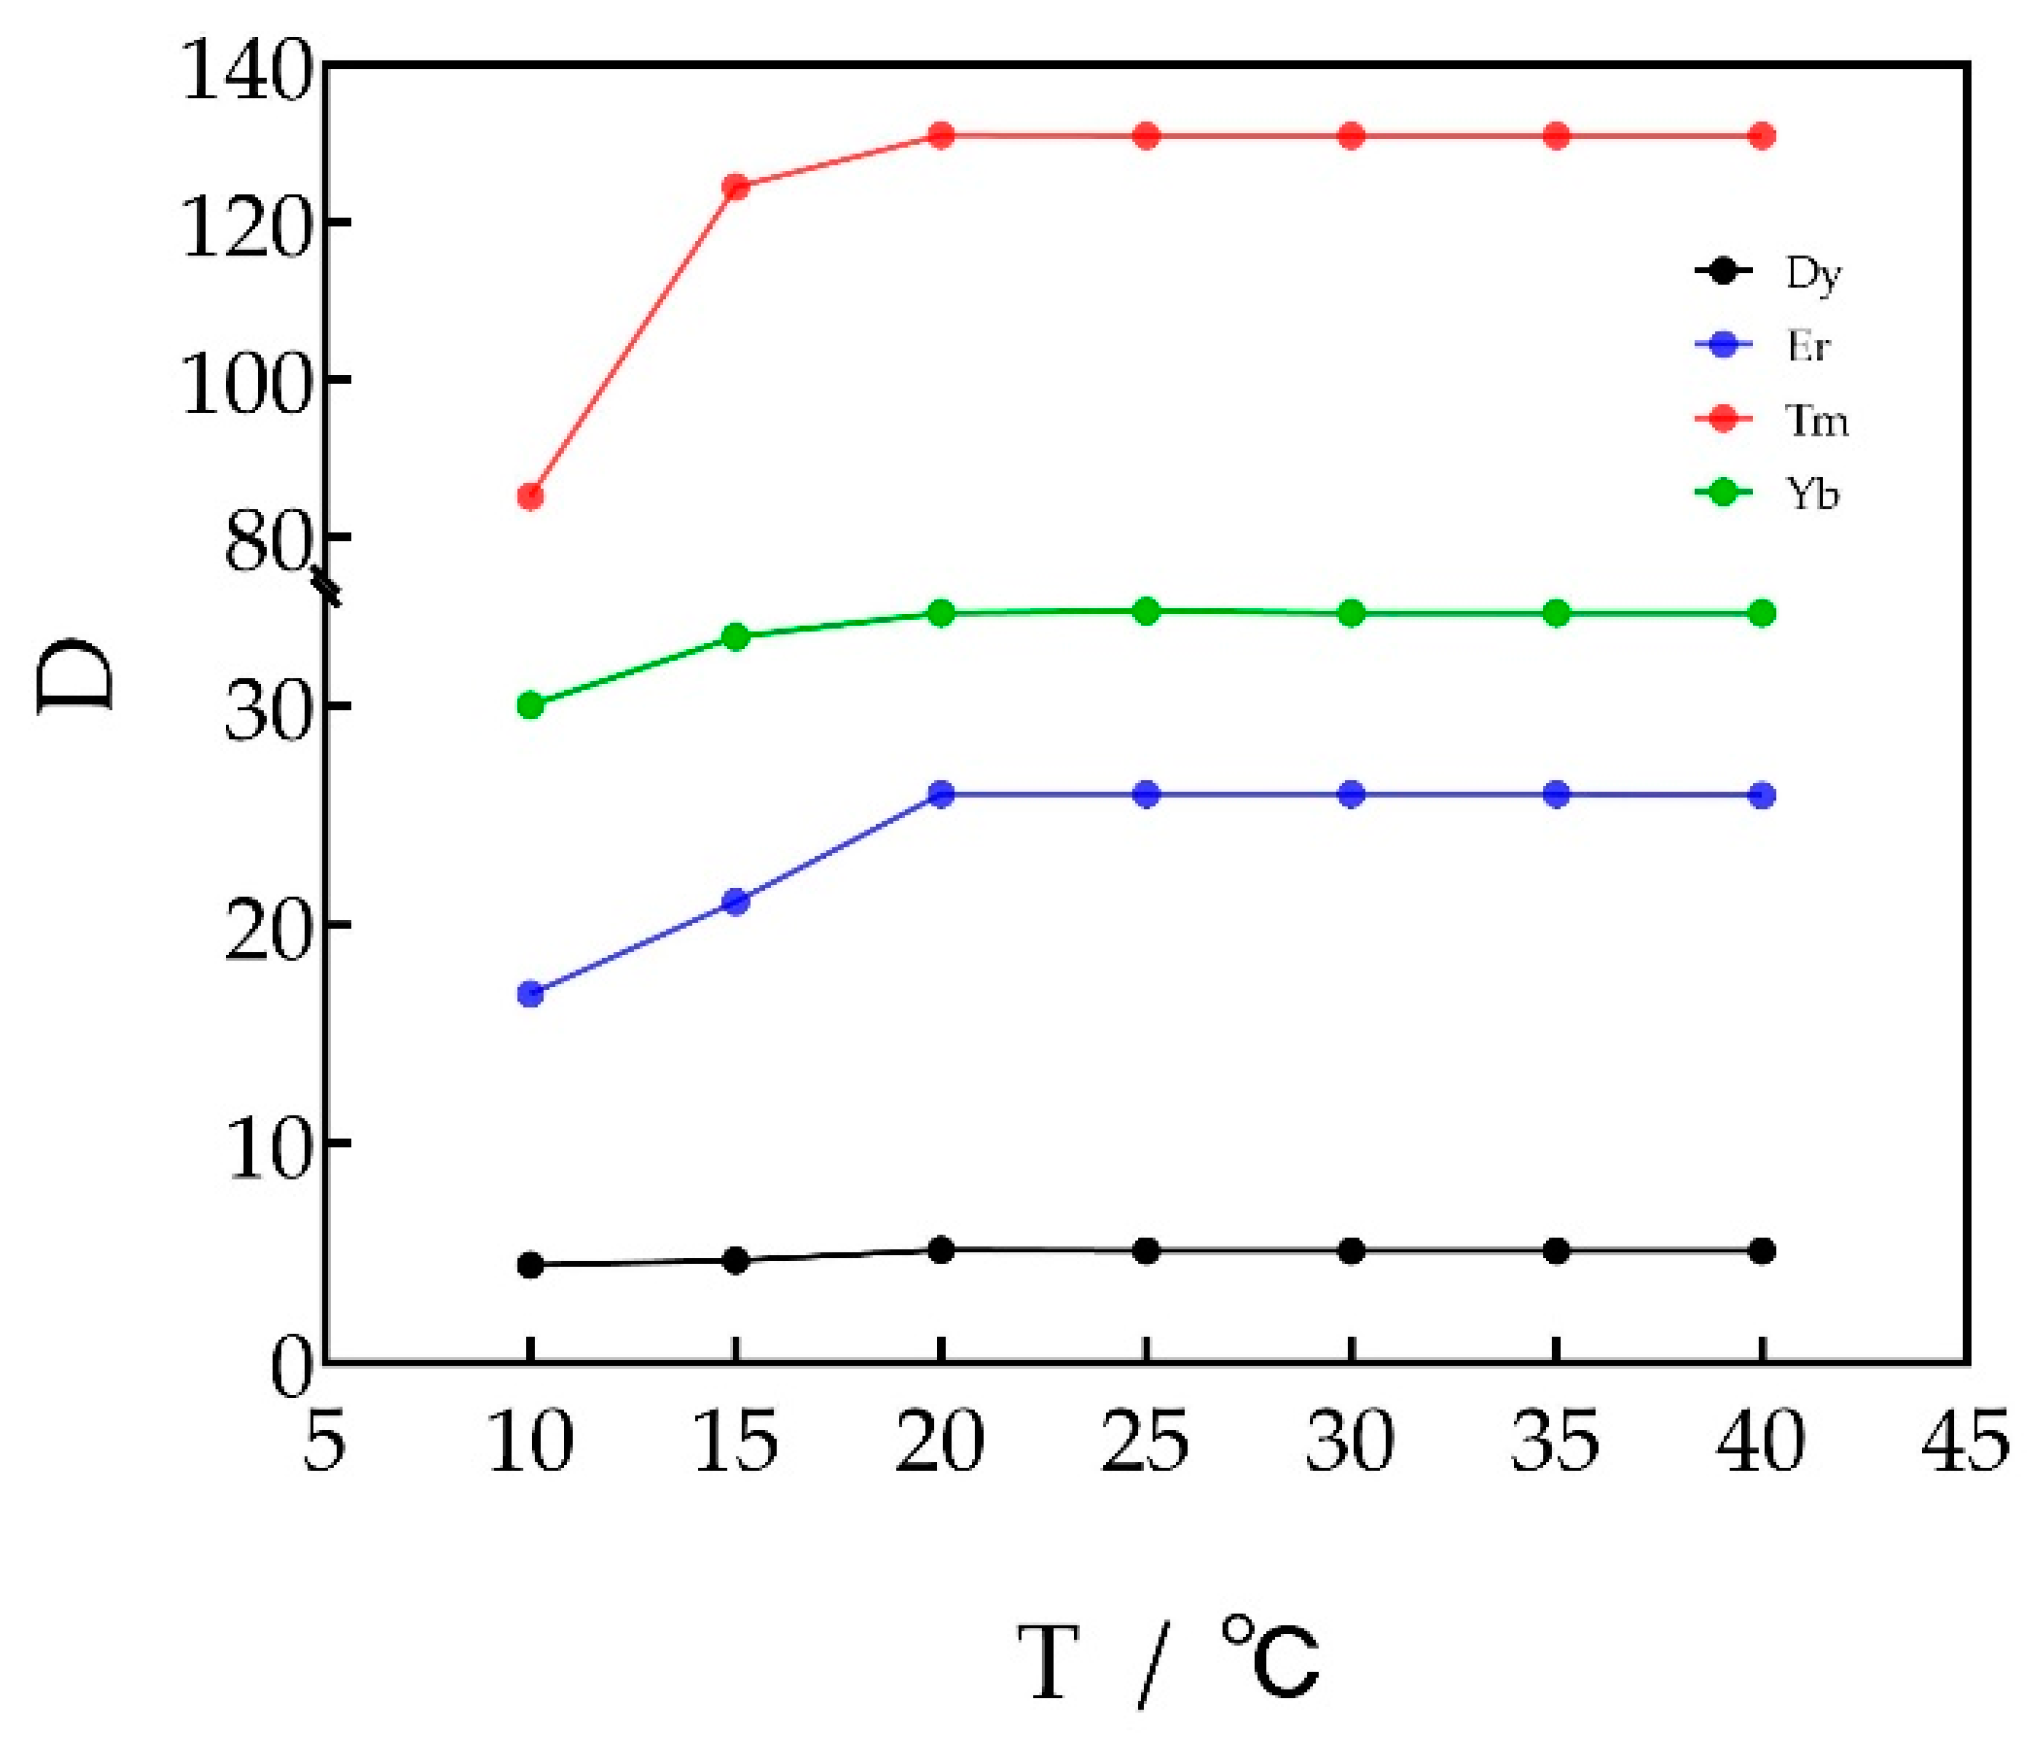
3.1.3. Effect of Extraction Temperature
The effect of temperature on the distribution ratios was investigated and is shown in Figure 3. The distribution ratios of Dy3+, Er3+, Tm3+ and Yb3+ were gradually increased when the extraction temperature was increased from 10 to 20 °C. The distribution ratios of Dy3+, Er3+, Tm3+ and Yb3+ did not change much when the extraction temperature was increased from 20 °C to 40 °C. The distribution ratios of Dy3+, Er3+, Tm3+ and Yb3+ stabilized at 5.125, 25.983, 131.025 and 34.251, respectively, when the extraction temperature exceeded 20 °C. Therefore, the optimum extraction temperature was 20 °C.

Figure 3.
Distribution ratios with extraction temperatures.
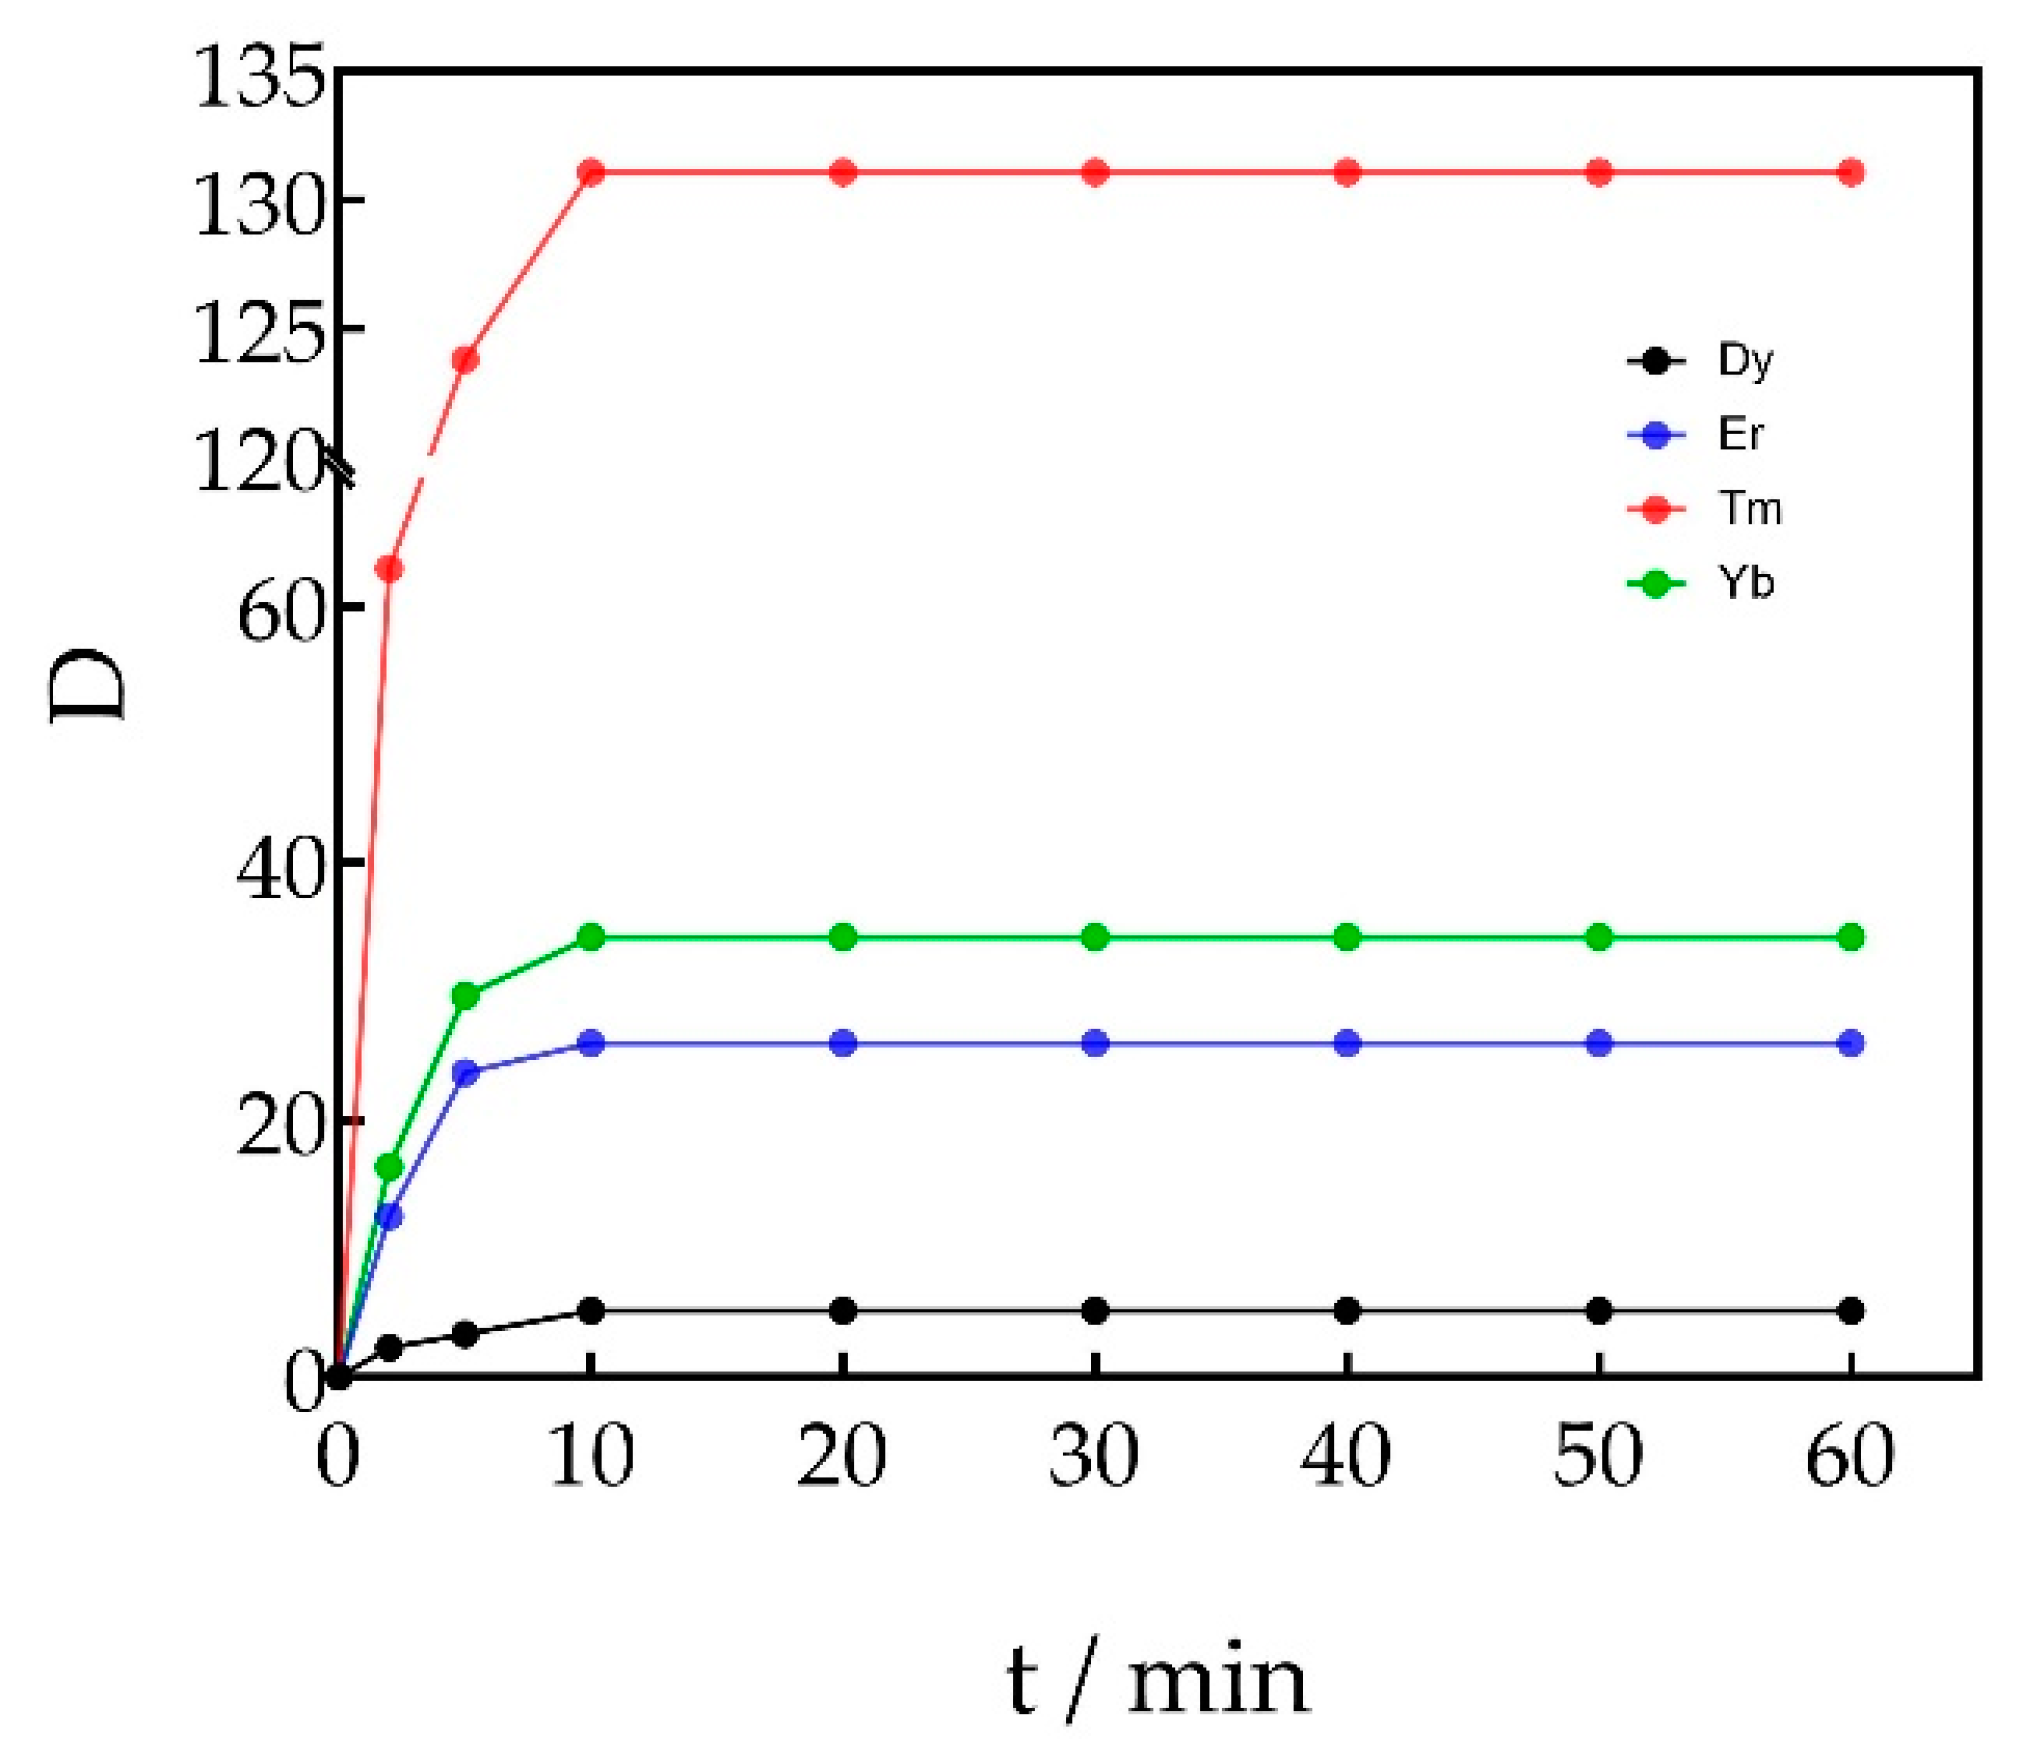
3.1.4. Effect of Extraction Time
In this paper, the effect of oscillation time on the distribution ratio was investigated and is shown in Figure 4. When the oscillation time was increased from 0 min to 10 min, the distribution ratio gradually increased. When the oscillation time is increased from 10 min to 60 min, the distribution ratio is basically unchanged. Therefore, the optimal oscillation time is 10 min.
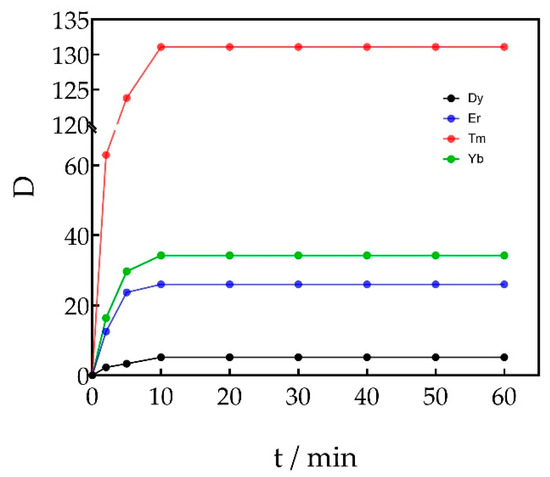
Figure 4.
Distribution ratios with contact time.
3.1.5. Determination of the Process Flow for the Separation of Dy3+, Er3+, Tm3+ and Yb3+ by Fractional Extraction with TODGA
Dy3+, Er3+, Tm3+ and Yb3+ were separated by fractional extraction using TODGA as the extractant (kerosene medium with 10% TODGA content). The material to be separated was an aqueous solution of Dy3+, Er3+, Tm3+ and Yb3+ with a concentration ratio of 1:1:1:1. The total concentration of REEs can be any concentration ranging from 1 mmol·L−1 to 1 mol·L−1. The objective of the separation was to obtain four products with 99% purity of Dy3+, Er3+, Tm3+ and Yb3+. Therefore, the four REEs in the initial feed solution were divided into two groups: easy-to-extract component A and hard-to-extract component B.
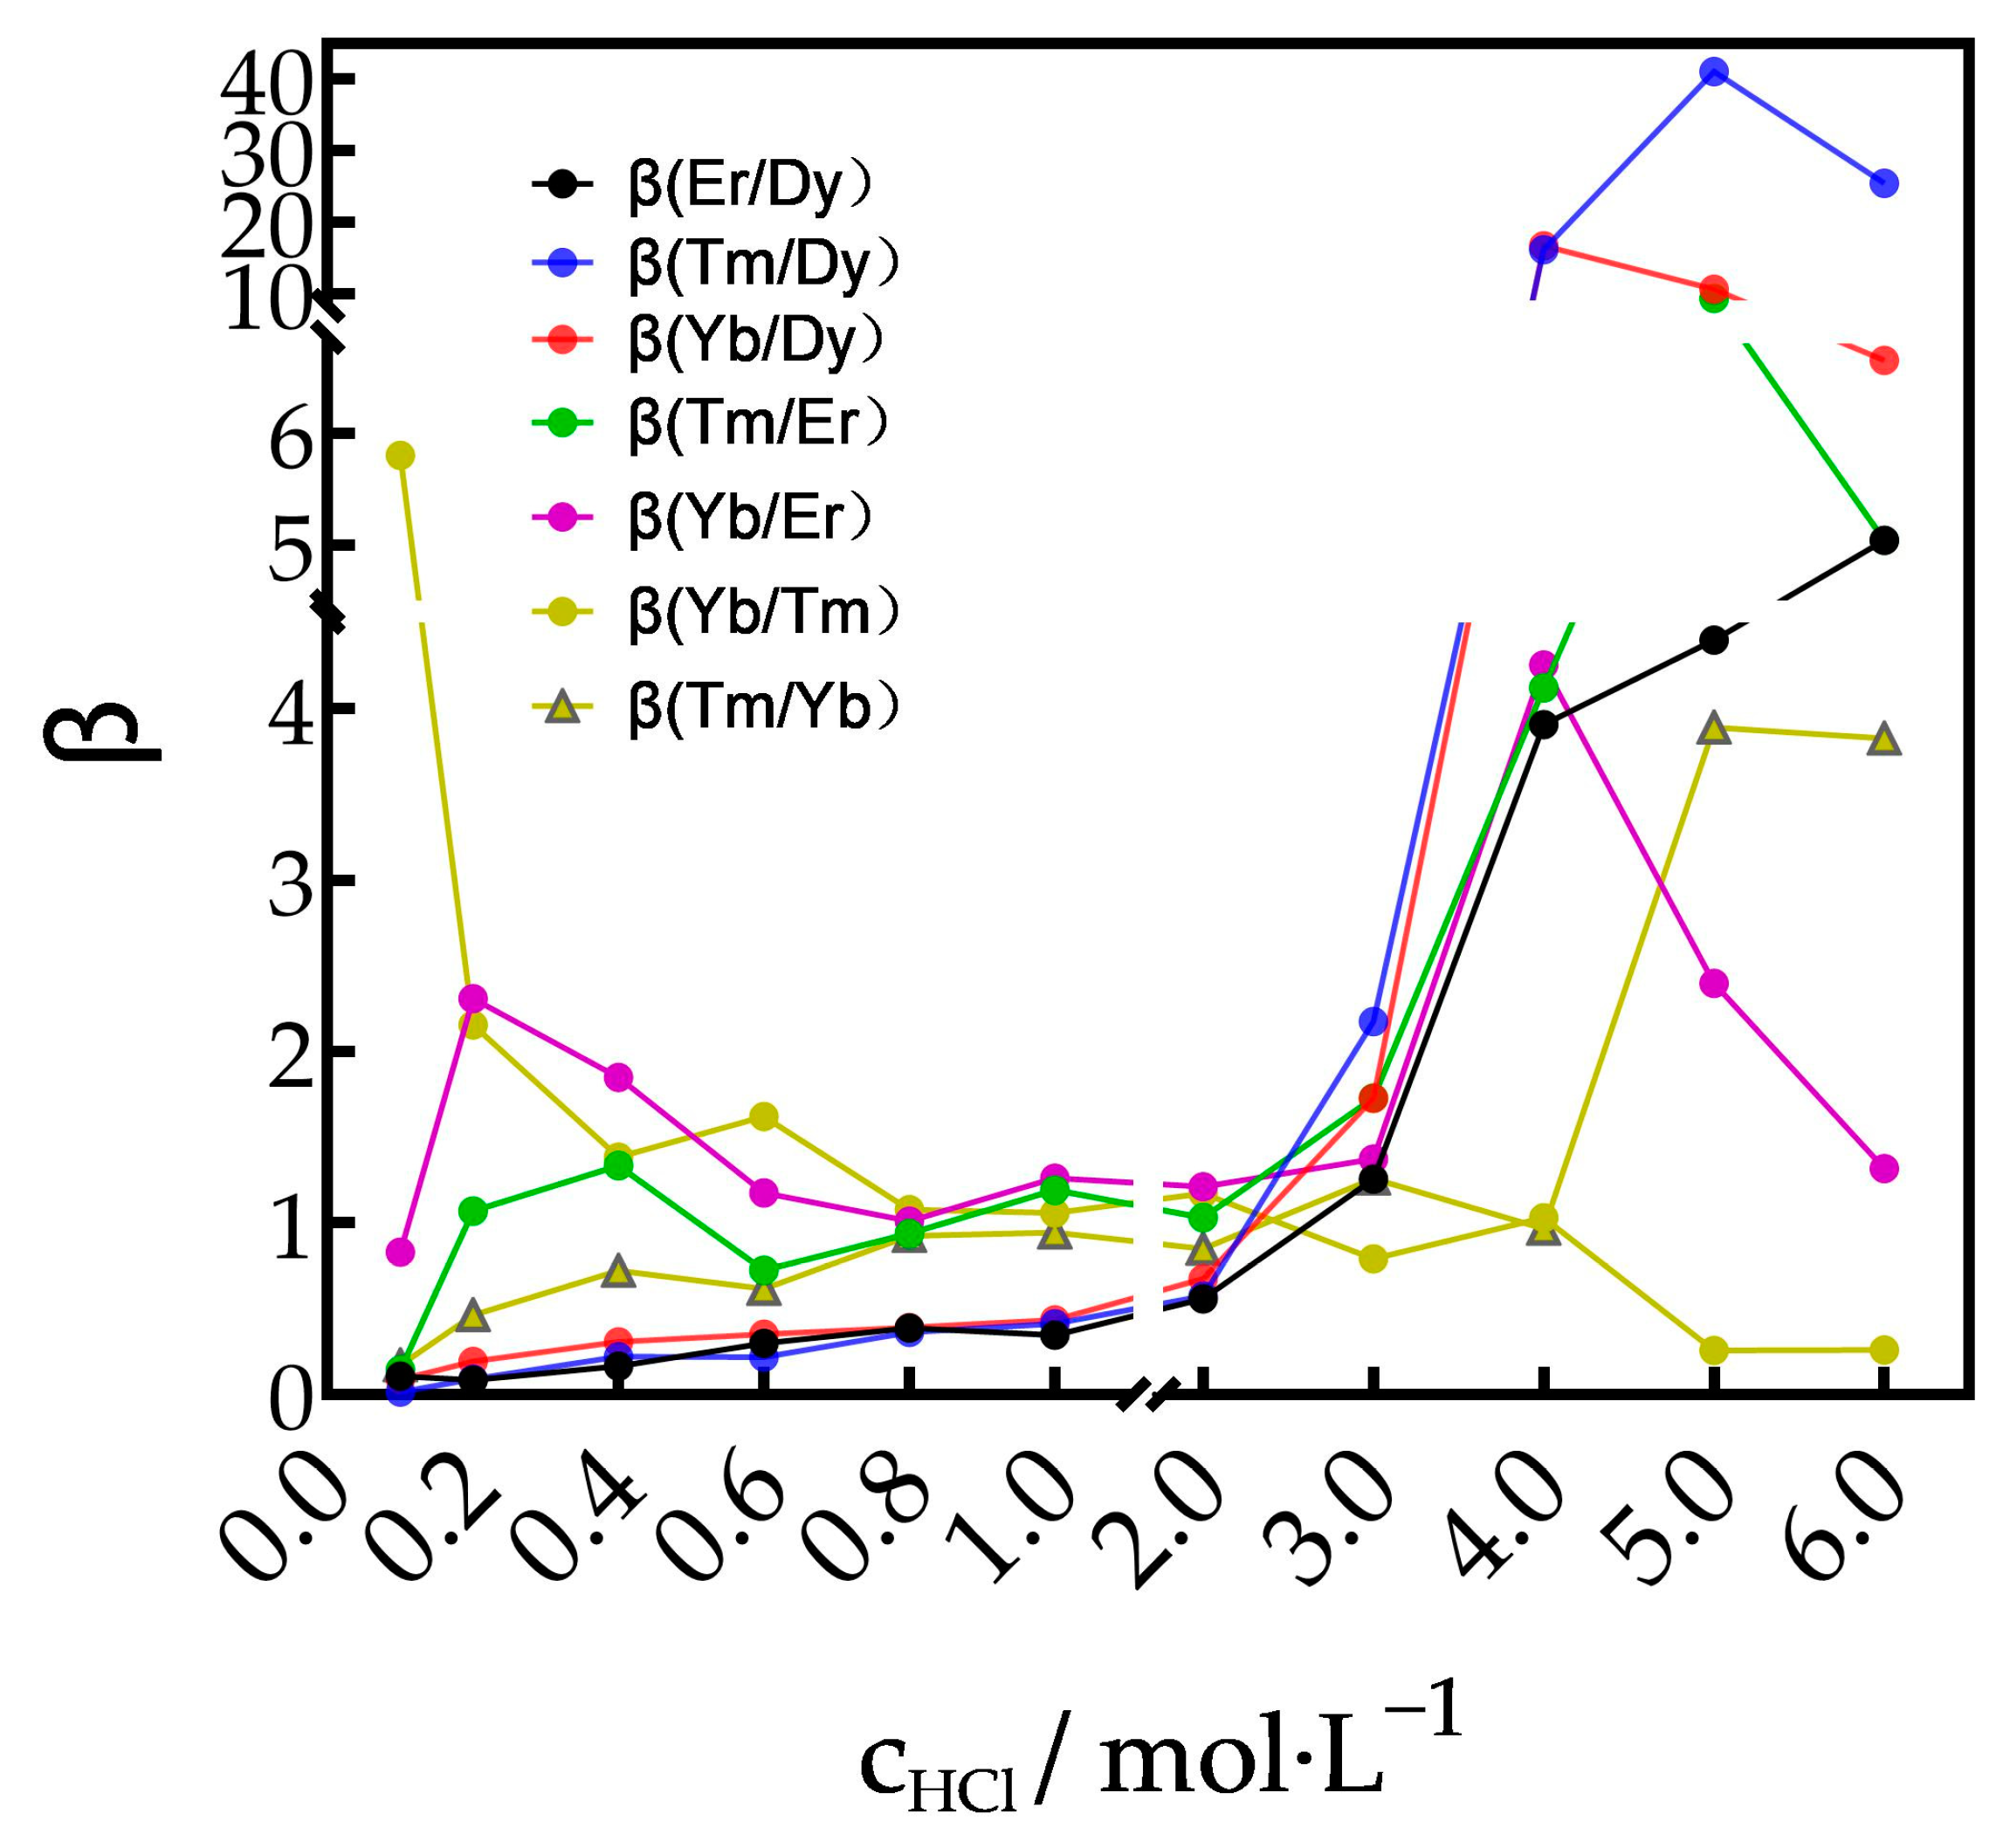
When compared to , in order to maximize the yield of REEs in the outlet of the organic phase, the calculation of the average extraction ratio for the extraction section of group A should be carried out by selecting the value with the smallest distribution ratio D in the group. Similarly, in order to maximize the yield of REEs in the aqueous phase outlet, the calculation of the average extraction ratio for the extraction section of group B should be carried out by selecting the value with the largest distribution ratio D in the group. From Figure 1, it can be seen that when the aqueous phase is from 4.0 to 6.0 mol·L−1 hydrochloric acid solution, there is a large difference in the distribution ratios of Dy3+, Er3+, Tm3+ and Yb3+. The separation factors between any two of the four ions were calculated by substituting the data from Figure 1 into Equation (4), and the results are shown in Figure 5.
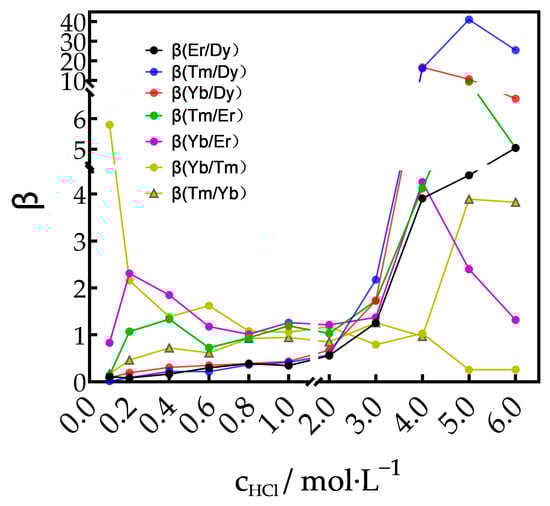
Figure 5.
Separation factor of groups A and B at different hydrochloric acid concentrations.
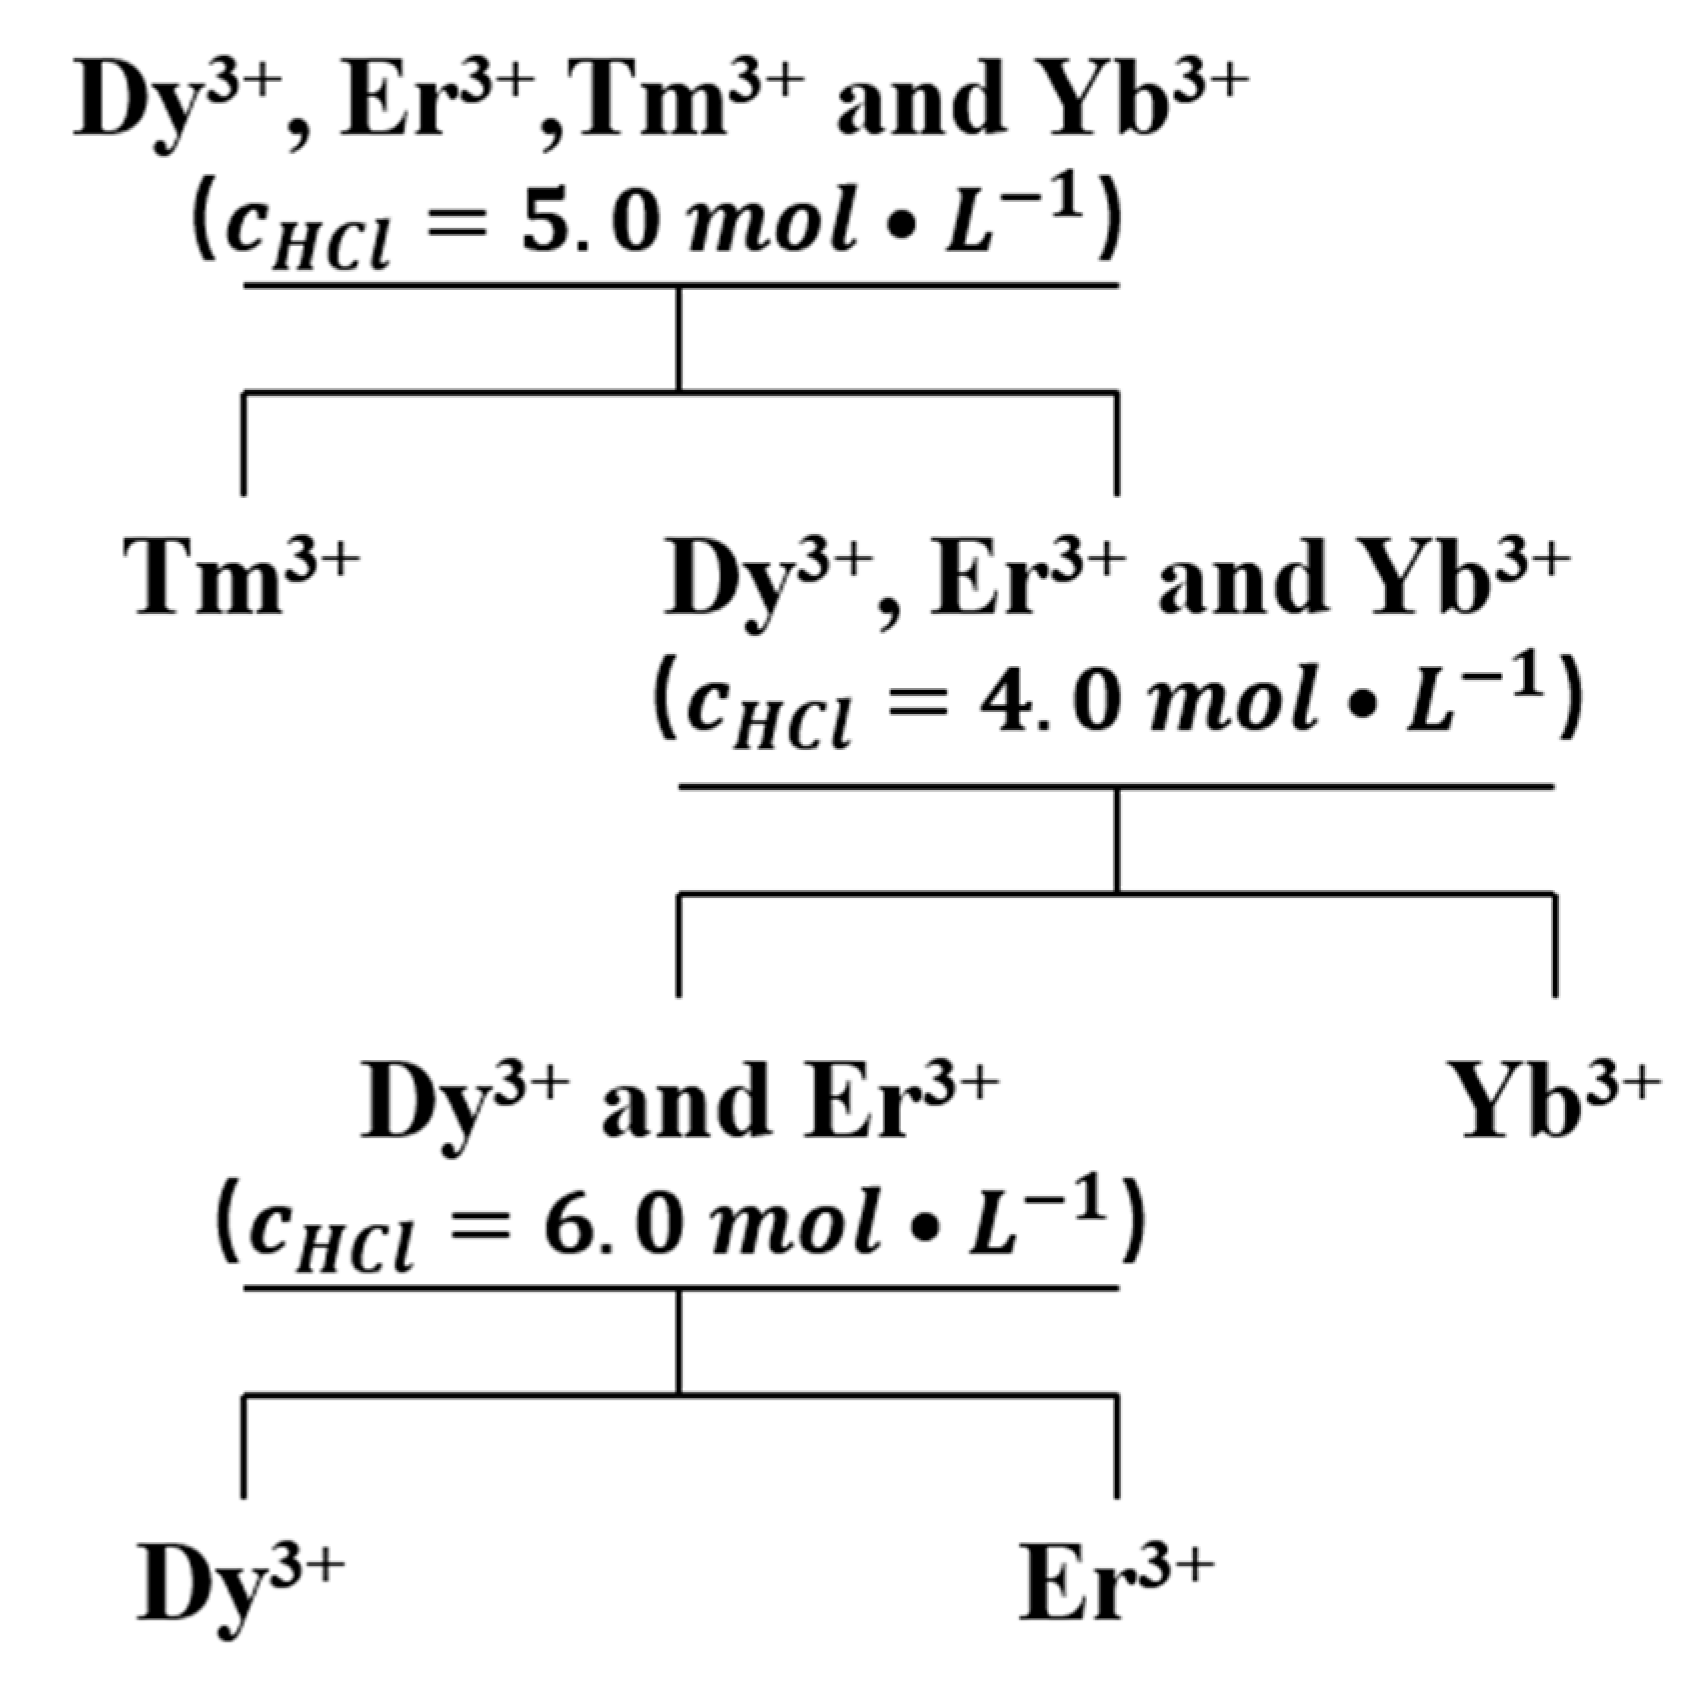
From Figure 5, it can be observed that the main challenges in separating Dy3+, Er3+, Tm3+ and Yb3+ lie in the separation of Dy3+ from Er3+ and the separation of Tm3+ from Yb3+. When the hydrochloric acid concentration in the aqueous phase is 5.0 mol·L−1, the separation factors β between Tm3+ as an easily extractable component and the other three ions are , and . All three separation factors have reached their maximum values. Under these conditions, if Tm3+ is taken as the easily extractable component alone, the separation factor between Tm3+ and Yb3+ is used to represent the separation coefficient between the easily extractable component and the difficult extractable component. It can both solve one of the separation difficulties and maximize the yield of Tm3+. Therefore, the first step of the process for separating the four REEs is designed to separate Tm3+ first, as illustrated in Figure 6.

Figure 6.
Process flow for the separation of Dy3+, Er3+, Tm3+ and Yb3+ by TODGA.
From Figure 5, when the hydrochloric acid concentration in the aqueous phase was 4.0 mol·L−1, the separation factors between Yb3+ and the other two ions were and . Both of these separation factors reached their maximum values. Therefore, the second step of the process for separating the four REEs is designed to separate Yb3+, as shown in Figure 6. As depicted in Figure 5, the optimal condition for the separation of Dy3+ from Er3+ is a hydrochloric acid concentration of 6.0 mol·L−1 in the aqueous phase. Under this condition, the separation factor between Dy3+ and Er3+ is .
3.2. Saturation Concentrations of Dy3+, Er3+, Tm3+ and Yb3+ in TODGA–Kerosene Medium
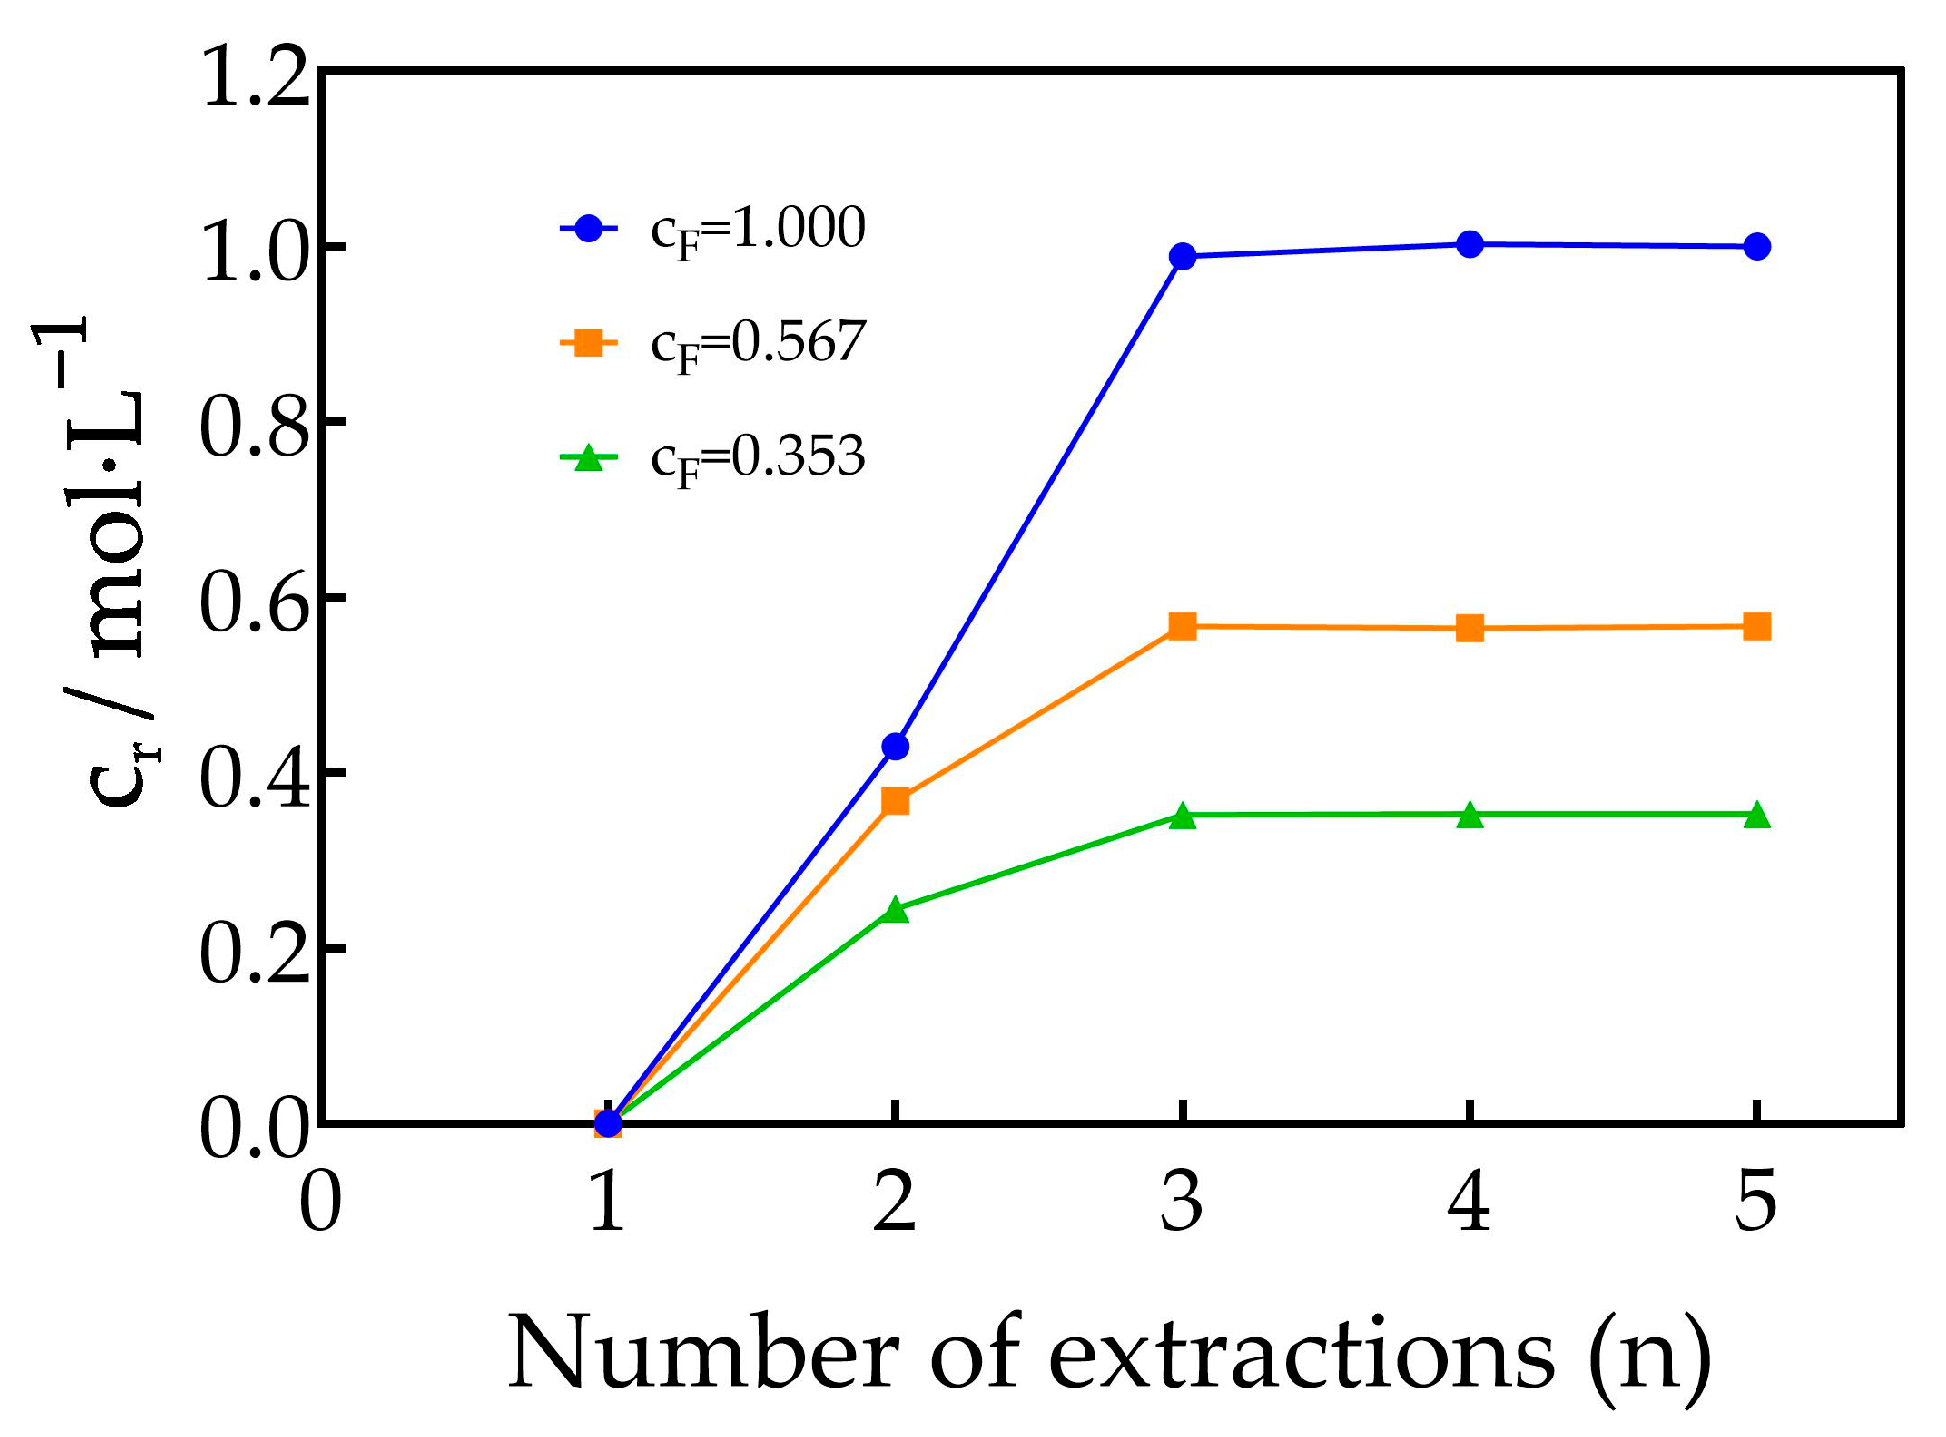
The number of extractions was plotted as the horizontal coordinate, and the total concentration of REEs in the raffinate aqueous phase () in each stage was plotted as the vertical coordinate, as shown in Figure 7. When the number of extractions is 1–3, the total concentration of REEs in the raffinate aqueous phase increases with the increase in the number of extraction cycles. When the extraction times are 3–5 times, the concentration of REEs in the aqueous phase of raffinate changed little. It can be judged that after three times of extraction, TODGA in the organic phase can no longer capture REEs from the aqueous phase, and the concentration of mixed REEs in the organic phase has reached saturation.
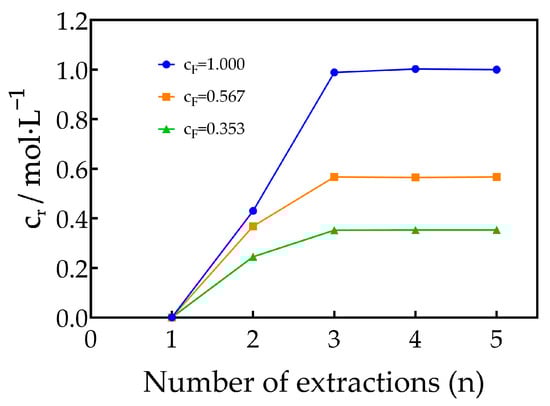
Figure 7.
Concentrations of the raffinate aqueous phase with number of extractions.
The relationship between the concentration of REEs in the feed solution, the concentration of REEs in the mixed solution of the first three raffinate aqueous phases and the saturated concentration of REEs in the TODGA–KS medium is shown in Table 1.

Table 1.
The relationship between the concentration of REEs in the feed solution, the concentration of REEs in the mixed solution of the first three raffinate aqueous phases and the saturated concentration of REEs in the TODGA–KS medium.
When the REEs concentration in the feed was 1.000 mol·L−1, the saturation concentration of REEs in the TODGA–KS medium was 1.790 mol·L−1; when the was 0.567 mol·L−1, the was 1.028 mol·L−1; and when the was 0.353 mol·L−1, the was 0.664 mol·L−1.
3.3. Theoretical Calculation of Separation Parameters of REEs Using TODGA as Extractant
Dy3+, Er3+, Tm3+ and Yb3+ were separated by fractional extraction using TODGA as the extractant (kerosene medium with 10% TODGA content). The objective was to obtain four individual rare earth products with a purity of 99%. According to the process shown in Figure 6, the number of separation stages and the concentration of REEs in each separation step were calculated sequentially.
3.3.1. Separation of Tm3+ from Dy3+, Er3+, Tm3+ and Yb3+ Mixtures
The concentrations of Dy3+, Er3+, Tm3+ and Yb3+ in the material to be separated were 0.258 mol·L−1, 0.252 mol·L−1, 0.248 mol·L−1 and 0.242 mol·L−1, in that order. The separation objective was to obtain a product with 99% purity of Tm3+ and a mixed product with 99% total purity of Dy3+, Er3+ and Yb3+.
From Figure 5, when the concentration of hydrochloric acid in the aqueous phase is 5 mol·L−1, the easily extractable component A is classified as Tm3+ and the difficulty extractable component B as Dy3+, Er3+ and Yb3+. The separation factors β:
The purification factor of groups A and B:
Group A yields in the organic phase outlet and Group B yields in the aqueous phase outlet:
Organic phase outlet fraction and aqueous phase outlet fraction:
Since , the extraction is controlled by the extraction section, and the optimized extraction ratios were calculated by Equations (10) and (11):
The maximum extraction mass flow and the maximum scrubbing mass flow were
The extraction stage number and scrubbing stage number can be approximated as
That is, the extraction stage number = 6 and the scrubbing stage number = 5. Let be the flow rate of feed solution per minute, be the flow rate of organic solution per minute and be the flow rate of scrubbing solution per minute, then the flow ratio can be calculated as
Calculate the flow rate, purity and average extraction ratio of the material in each stage of the extraction section step by step by using Equations (18)–(25). Let the feed stage i = 1, with Equations (18)–(21) to calculate the material flow rate of the feed stage.
The formula for stage i (i = 2, 3, …i) is
The step-by-step calculation until completes the calculation of the extraction section.
Calculate the flow rate, purity and average extraction ratio of the material at each stage of the scrubbing section step by step by using Equations (26)–(29). Let the feed stage j = 1, then the formula for stage j (j = 2, 3, …j) is
The step-by-step calculation until completes calculation of the scrubbing section.
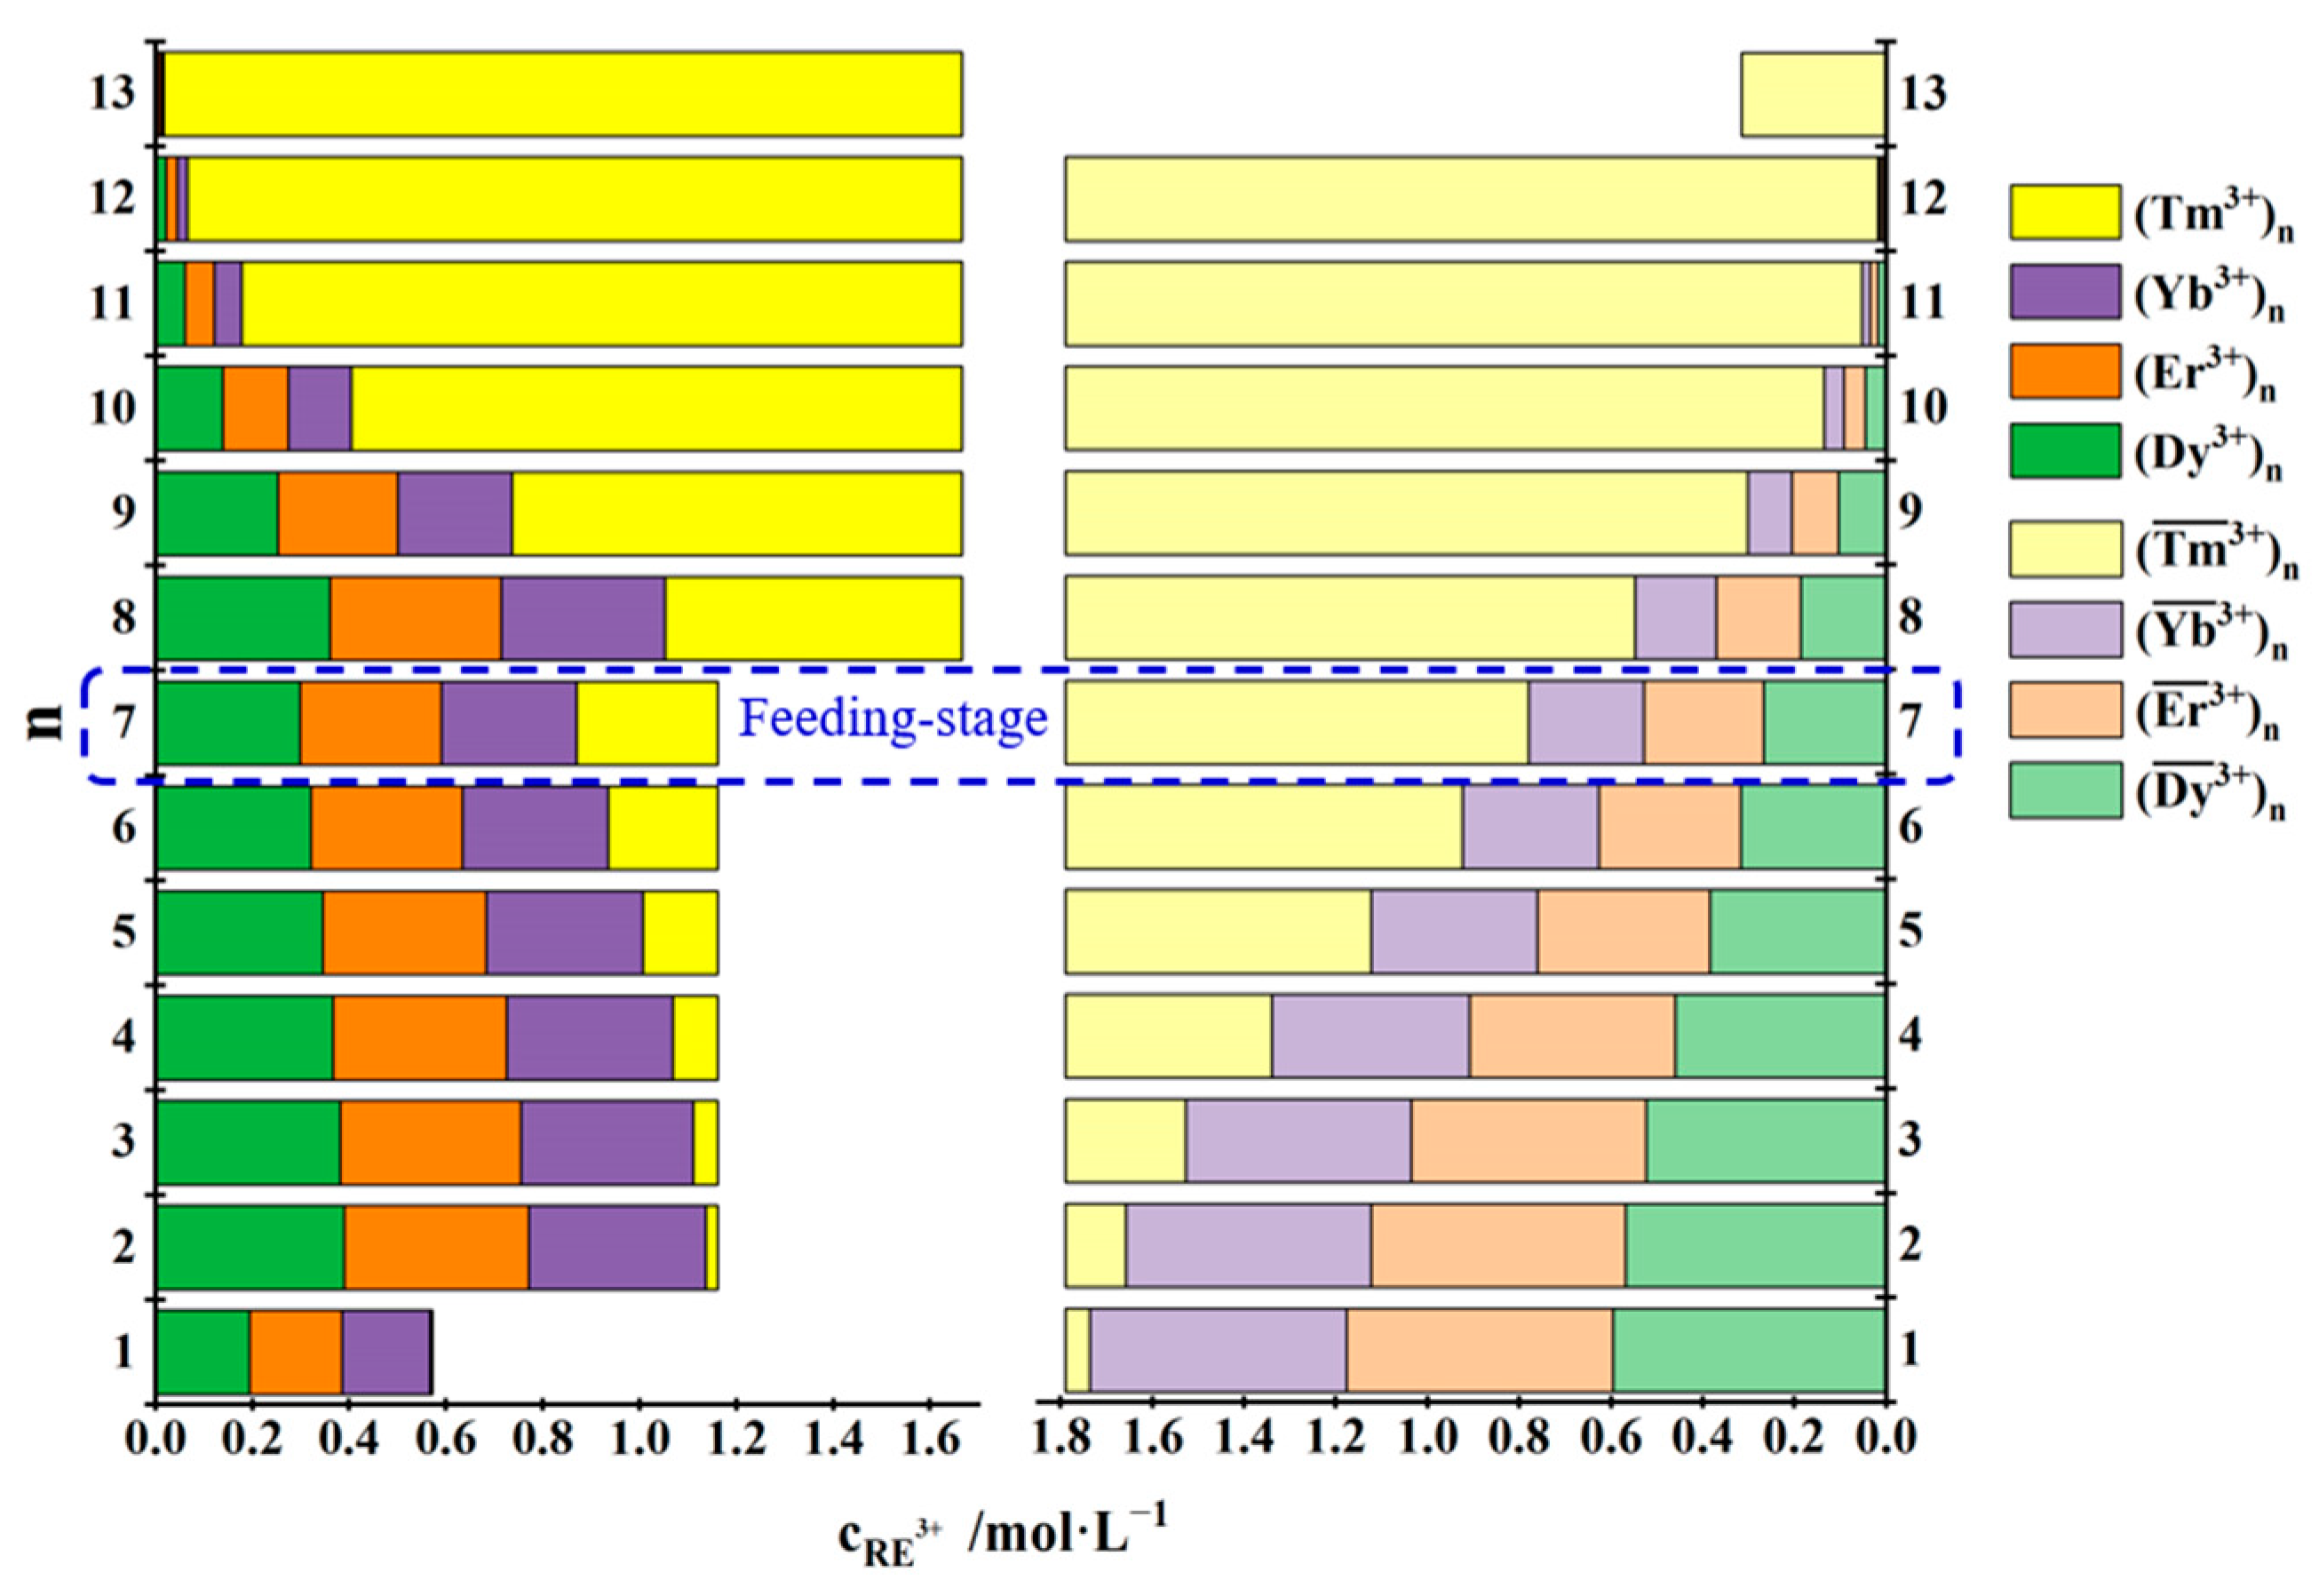
The process parameters , , , , were substituted into the recursive Equations (18)–(29) to calculate the flow rate, purity and average extraction ratio of the material at each stage, shown in Table 2. The variation in REE concentrations in the organic and aqueous phases at each stage is shown in Figure 8.
Table 2.
Material-by-stage calculation for TODGA extraction of Dy3+, Er3+, Tm3+ and Yb3+.
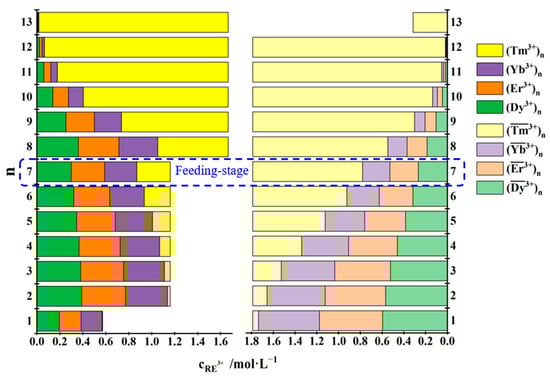
Figure 8.
Calculation of concentration of REEs by stage for TODGA extraction of Dy3+, Er3+, Tm3+ and Yb3+.
The results of the step-by-step calculations differ slightly from those of the optimization equations, with the feed stage being the seventh stage, the first stage being the organic phase inlet stage and the aqueous phase outlet stage and the thirteenth stage being the aqueous phase inlet stage and the organic phase outlet stage. Stages 1 through 7 were extraction sections, and stages 8 through 13 were scrubbing sections. Because of the addition of the feed solution to the aqueous phase in stage 7, the concentration of the components in the aqueous phase in stage 7 shows a large difference from that in the aqueous phase in stage 8. After 13 stages of separation, the Tm3+ product with 99.70% purity and 0.315 mol·L−1 concentration was obtained from the organic phase outlet, and the aqueous solution obtained from the aqueous phase outlet had a total purity of 99.20%, in which the concentrations of Dy3+, Er3+ and Yb3+ were in the order of 0.195 mol·L−1, 0.190 mol·L−1 and 0.183 mol·L−1.
3.3.2. Separation of Yb3+ from Dy3+, Er3+ and Yb3+ Mixtures
The concentrations of Dy3+, Er3+ and Yb3+ in the material to be separated were 0.195 mol·L−1, 0.190 mol·L−1 and 0.183 mol·L−1, in that order. The separation objective was to obtain a product with 99% purity of Yb3+ and a mixed product with 99% total purity of Dy3+ and Er3+.
From Figure 5, when the concentration of hydrochloric acid in the aqueous phase is 4 mol·L−1, the easily extractable component A is classified as Yb3+ and the difficult extractable component B as Dy3+ and Er3+. The separation factors β:
With Equations (5)–(10), the purification factor of group A and group B was obtained: ; the yields of group A in the organic phase outlet and group B in the aqueous phase outlet: , ; the organic phase outlet and aqueous phase outlet fractions: , .
Since , the extraction is controlled by the extraction section, and the process parameters were calculated by Equations (11) and (14): , , .
The extraction stage number and scrubbing stage number can be approximated with Equations (15) and (16), . That is, the extraction stage number = 6 and the scrubbing stage number = 6. The flow ratio can be calculated with Equation (17), .
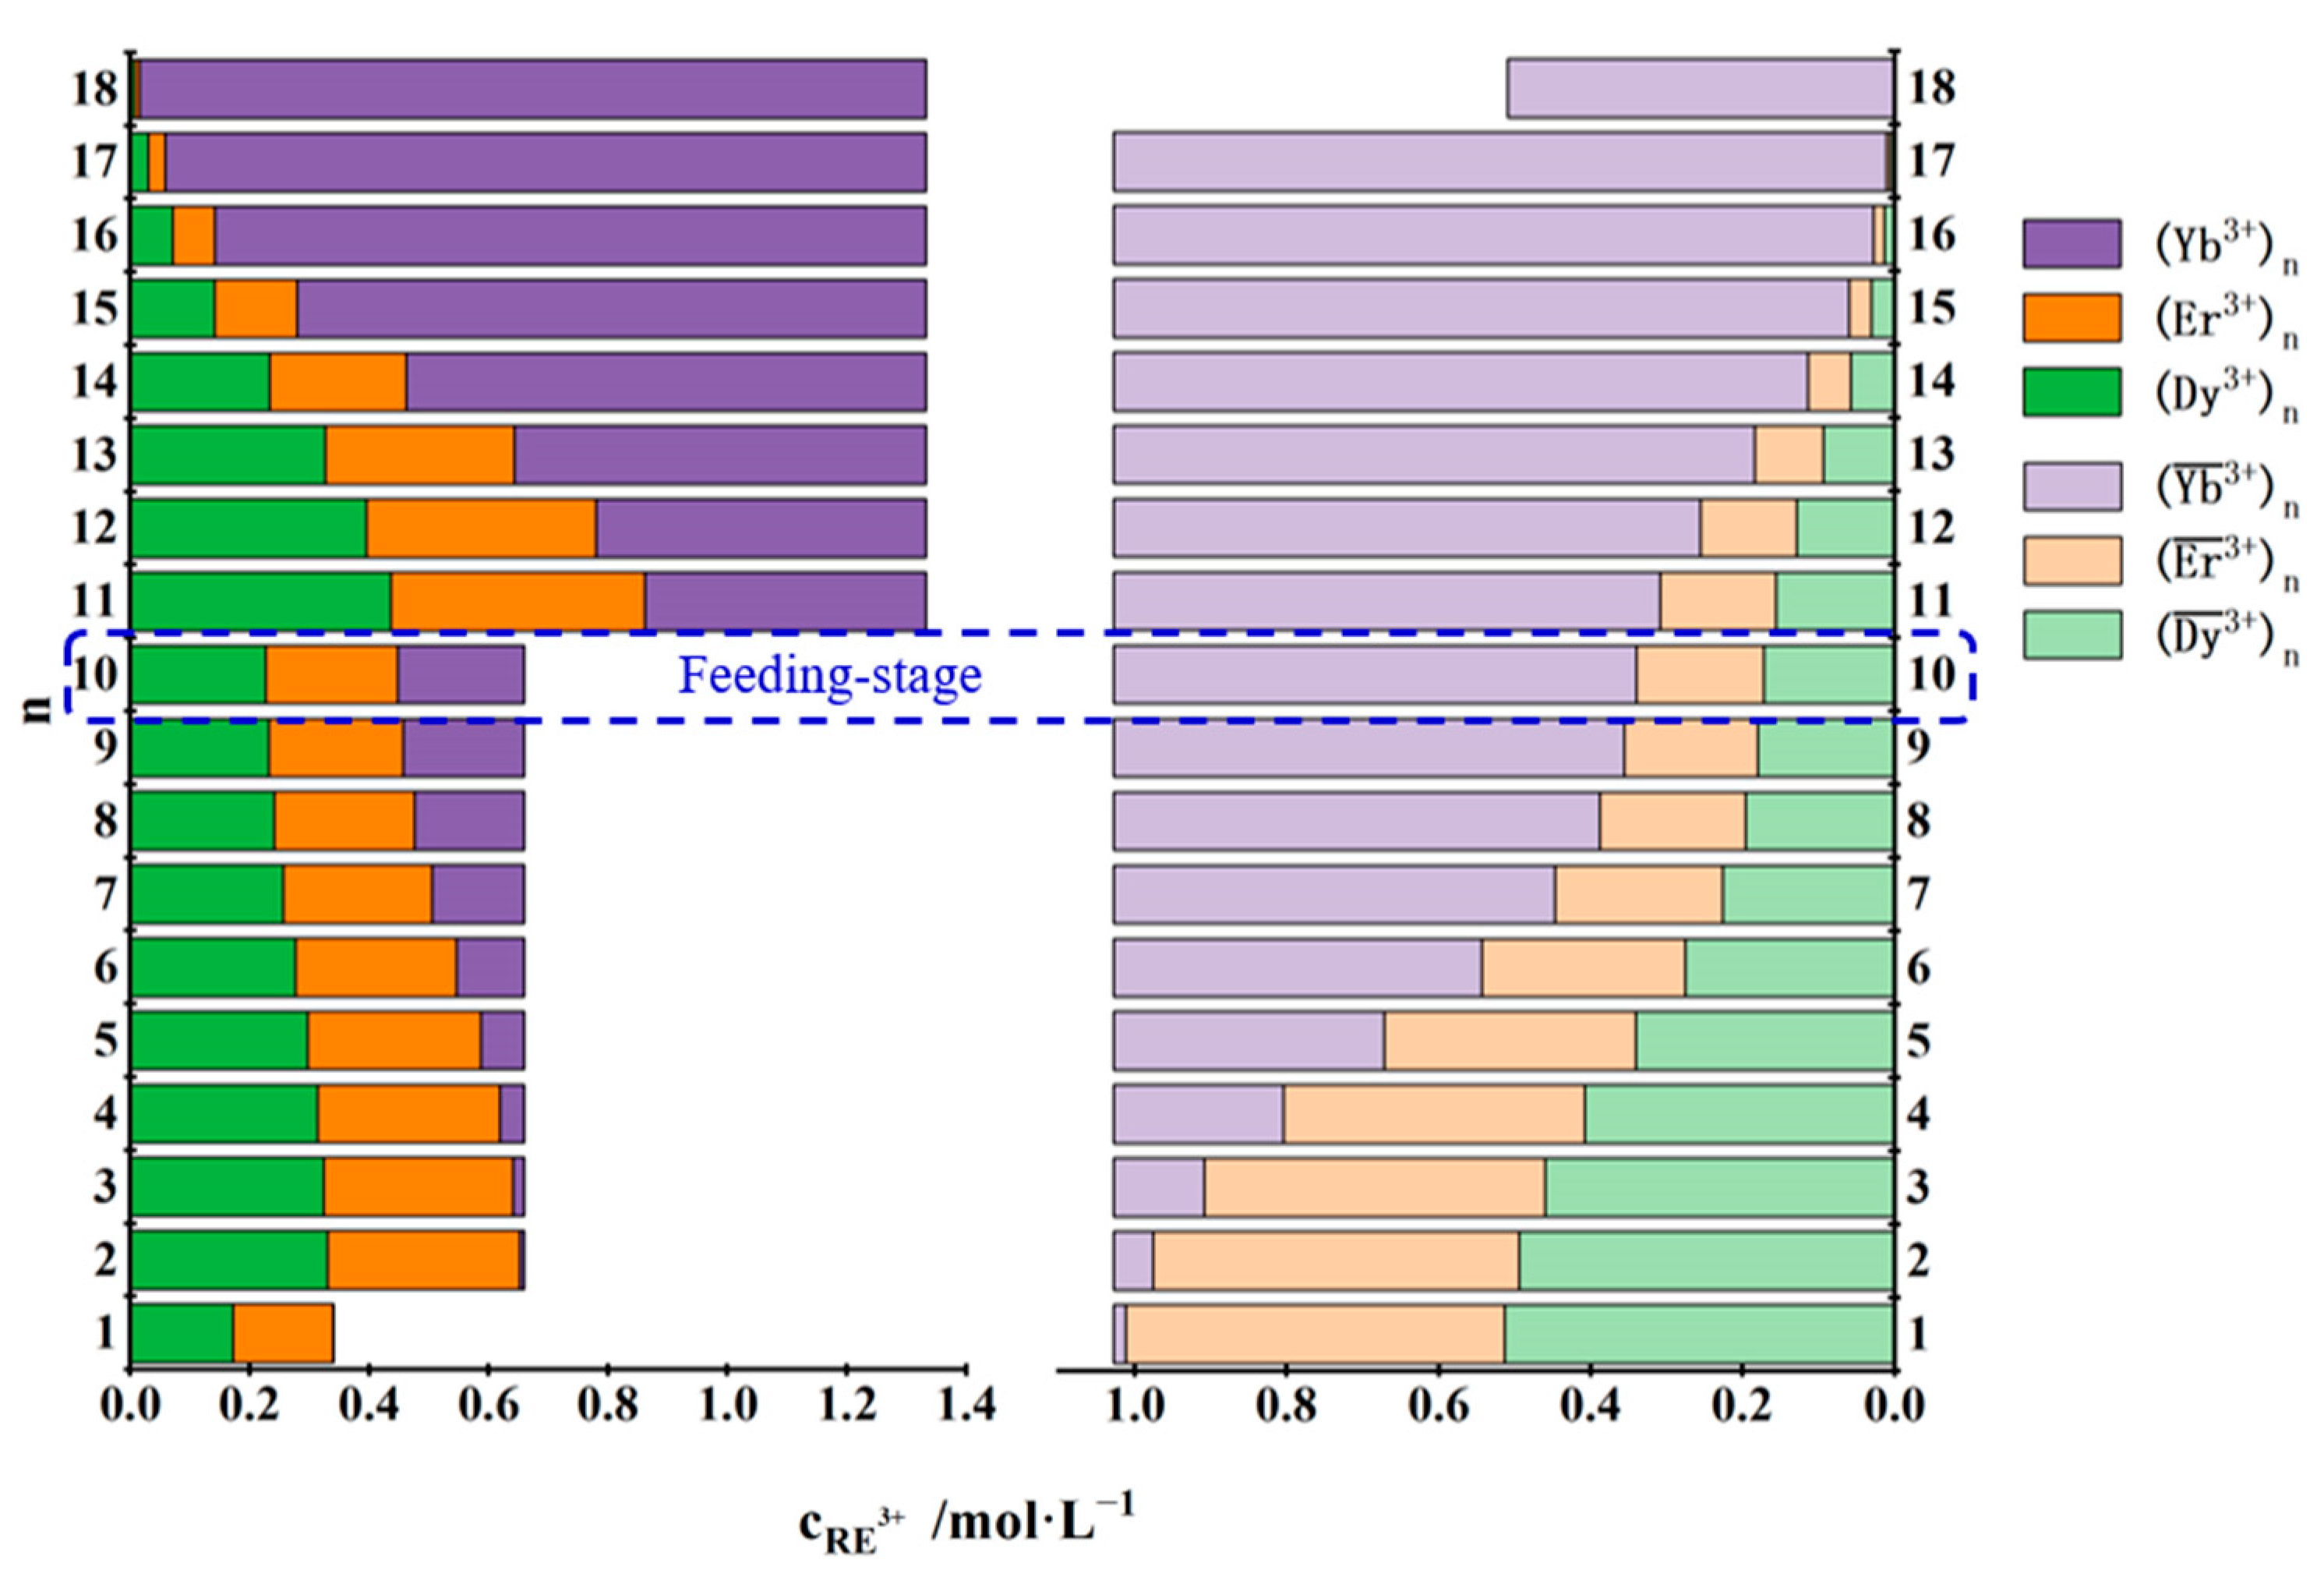
Calculate the flow rate, purity and average extraction ratio of the material in each stage of the fractional extraction step by step by using Equations (18)–(29), shown in Table 3. The variation in REE concentrations in the organic and aqueous phases at each stage is shown in Figure 9. The feed stage was the 10th stage, the 1st stage was the organic phase inlet stage and the aqueous phase outlet stage and the 18th stage was the aqueous phase inlet stage and the organic phase outlet stage. Stages 1 through 10 were extraction sections, and stages 11 through 18 were scrubbing sections. After 18 stages of separation, the Yb3+ product with 99.70% purity and 0.508 mol·L−1 concentration was obtained from the organic phase outlet, and the aqueous solution obtained from the aqueous phase outlet had a total purity of 99.60%, in which the concentrations of Dy3+ and Er3+ were in the order of 0.172 mol·L−1 and 0.168 mol·L−1.
Table 3.
Material-by-stage calculation for TODGA extraction of Dy3+, Er3+ and Yb3+.
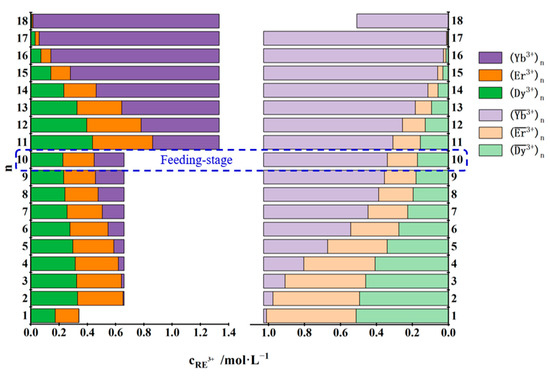
Figure 9.
Calculation of concentration of REEs by stage for TODGA extraction of Dy3+, Er3+ and Yb3+.
3.3.3. Separation of Yb3+ from Dy3+ and Er3+ Mixtures
The concentrations of Dy3+ and Er3+ in the material to be separated were 0.172 mol·L−1 and 0.168 mol·L−1, in that order. The separation objective was to obtain Dy3+ and Er3+ products with 99% purity from the aqueous phase outlet and the organic phase outlet, respectively.
From Figure 5, when the concentration of hydrochloric acid in the aqueous phase is 4 mol·L−1, the easily extractable component A is classified as Er3+ and the difficult extractable component B is Dy3+. The separation factors β:
With Equations (5)–(10), the purification factor of group A and group B was obtained: ; the yields of group A in the organic phase outlet and group B in the aqueous phase outlet: , ; the organic phase outlet and aqueous phase outlet fractions: , .
Since , the extraction is controlled by the scrubbing section, and the optimized extraction ratios were calculated by Equations (30) and (31):
The maximum extraction mass flow and the maximum scrubbing mass flow were calculated by Equations (13) and (14): .
The extraction stage number and scrubbing stage number can be approximated with Equations (15) and (16), , . That is, the extraction stage number = 4 and the scrubbing stage number = 5. The flow ratio can be calculated with Equation (17), .
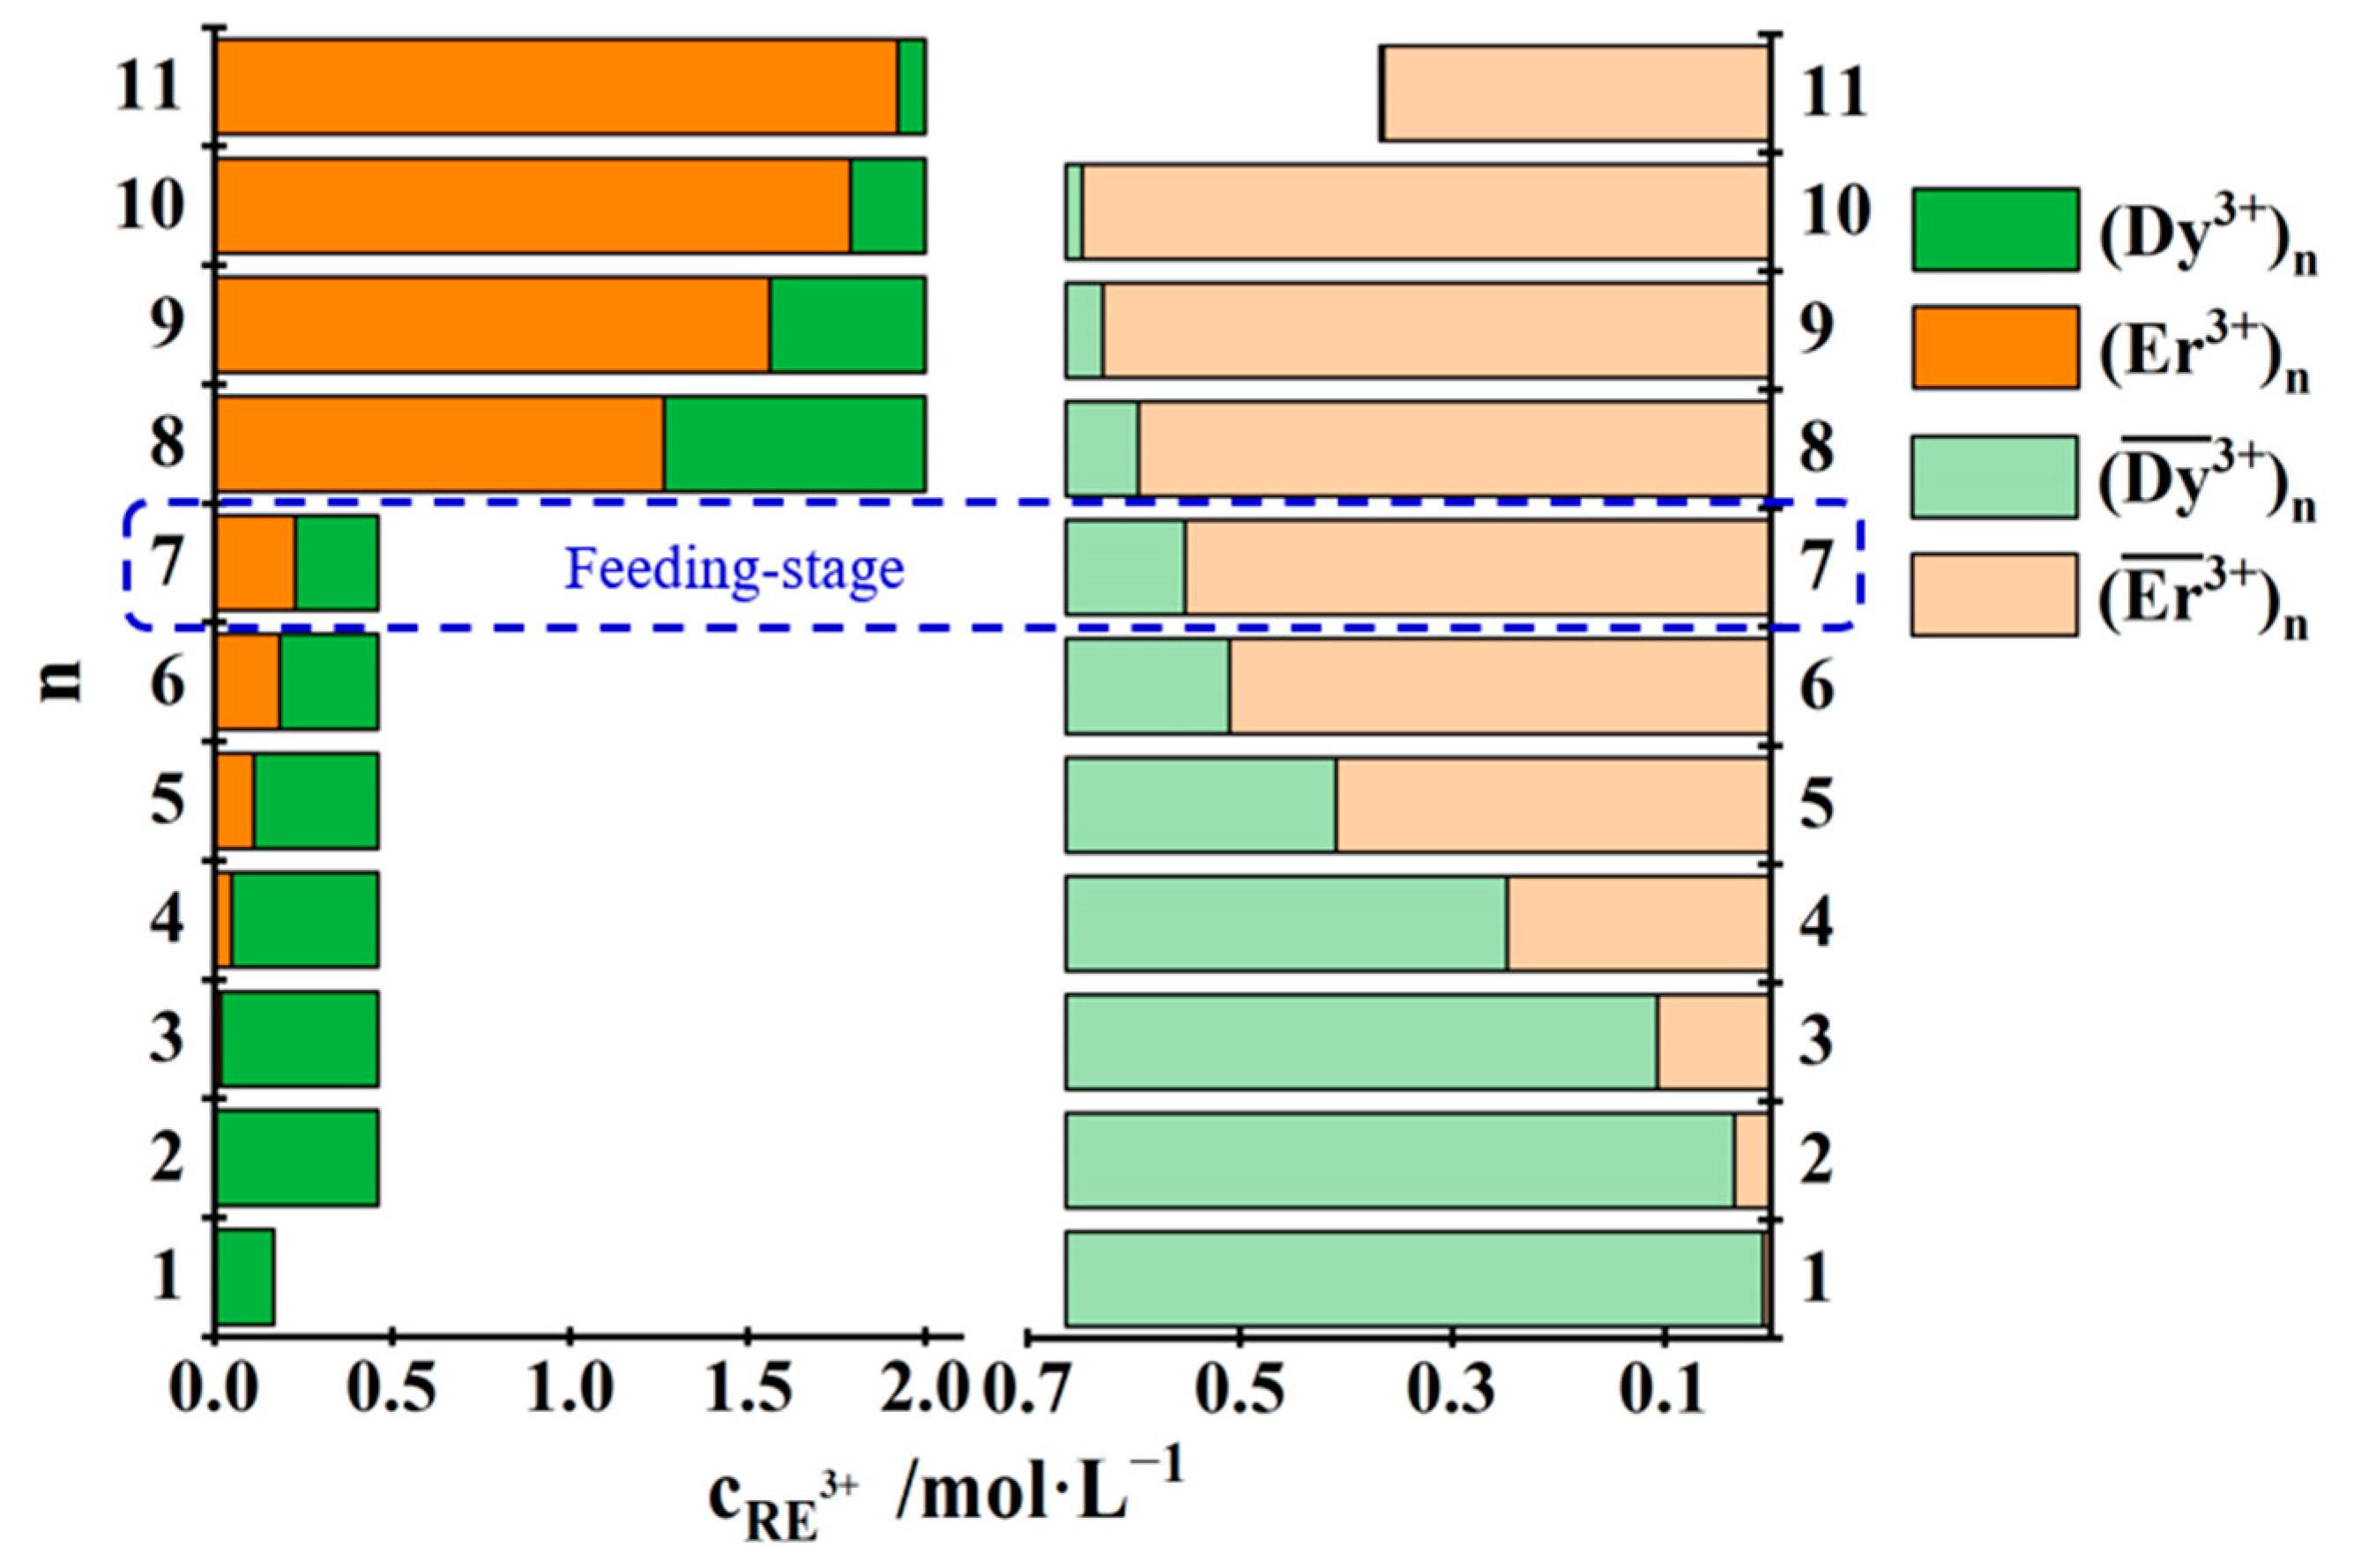
Calculate the flow rate, purity and average extraction ratio of the material in each stage of the fractional extraction step by step by using Equations (18)–(29), shown in Table 4. The variation in REE concentrations in the organic and aqueous phases at each stage is shown in Figure 10. The feed stage was the seventh stage, the first stage was the organic phase inlet stage and the aqueous phase outlet stage and the eleventh stage was the aqueous phase inlet stage and the organic phase outlet stage. Stages 1 through 7 were extraction sections, and stages 8 through 11 were scrubbing sections. After 11 stages of separation, the Er3+ product with 99.20% purity and 0.365 mol·L−1 concentration was obtained from the organic phase outlet, and the Dy3+ product with 99.80% purity and 0.167 mol·L−1 concentration was obtained from the aqueous phase outlet.
Table 4.
Material-by-stage calculation for TODGA extraction of Dy3+ and Er3+.

Figure 10.
Calculation of concentration of REEs by stage for TODGA extraction of Dy3+ and Er3+.
3.4. The Mechanism of Separation of Dy3+, Er3+, Tm3+ and Yb3+ Using TODGA as Extractant
Theoretical calculations of TODGA molecules and its rare earth complexes were carried out using GaussView 5.0 software and Gaussian09 software (B3LYP density-functional approach and 6-31G group hybrid pseudopotential basis group Lanl2dz) to obtain information on molecular structure and molecular energy. The ability of TODGA to separate Dy3+, Er3+, Tm3+ and Yb3+ was evaluated in relation to theoretical knowledge. The energy of the ligand (extractant) molecule, the energy of the REE (III), the energy of complexes of REEs (III) with extractants and the binding energy data in the 1 mol·L−1 HNO3 system are shown in Table 5.
Table 5.
Energies of ligand molecules, REE (III) and complexes of REE (III) with extractants E and binding energies ΔE. Unit: a.u.
From the above calculations, it can be seen that the energies of the complexes formed by TODGA with Dy3+, Er3+, Tm3+ and Yb3+, respectively, increase in order, and the difference in energies between two neighboring complexes are 123.9335, 67.4035 and 70.2155, in that order. The binding energy of Tm–TODGA is the largest of the four complexes and therefore the most stable, easily separating Tm3+ extracted into TODGA from the other three ions.
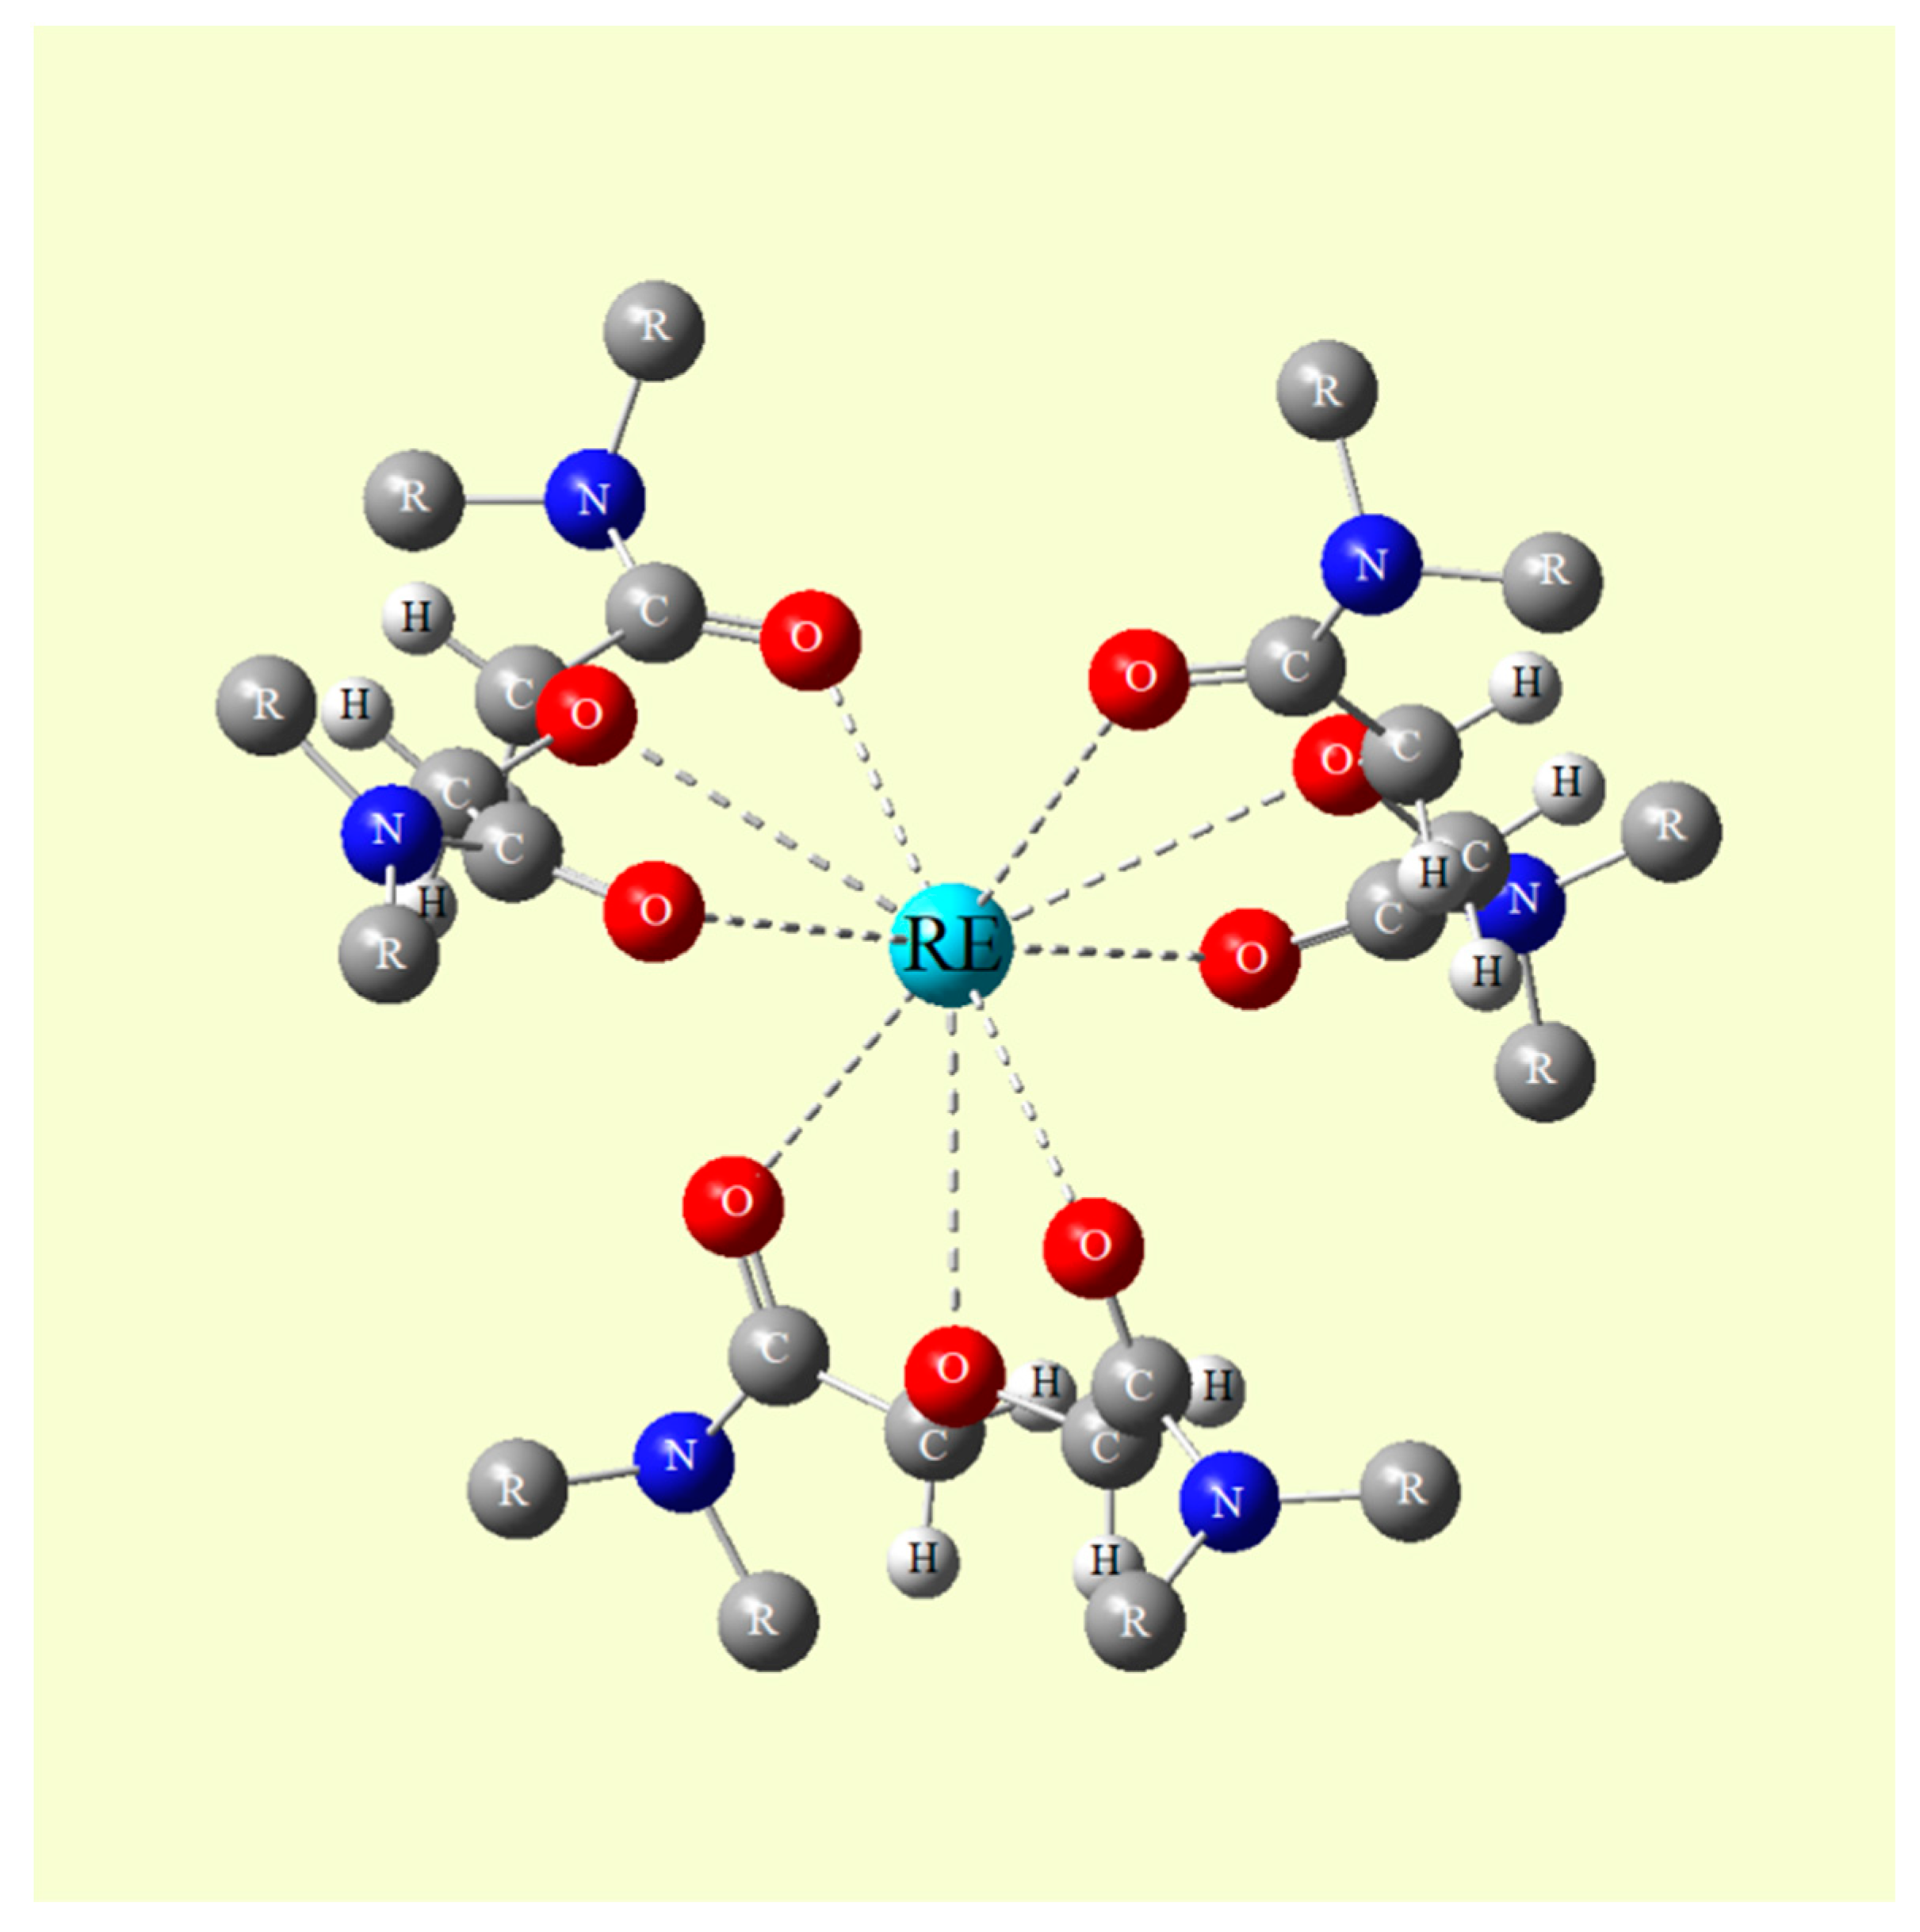
The structural model of the TODGA–REE complex is shown in Figure 11. Each TODGA ligand with an O=Ca-Cb-O-Cb-Ca=O main chain framework acts as a tridentate oxygen donor, in which two carbonyl oxygen atoms and one ether oxygen atom combine with the REE (III) to form a nine-coordination structure with the central metal ion to form six five-membered chelate rings.

Figure 11.
Structural model of TODGA–REE complex.
The bond lengths of Ln–O bonds in the complexes of TODGA with Dy3+, Er3+, Tm3+ and Yb3+ were calculated on the basis of the bond valence model according to Equations (32) and (33) [33].
where Rij and Rik (see Appendix A, Table A1), respectively, are the bond valence parameters for a cation (i) to different anions (j and k); ajk and bjk, respectively, are empirical constants that have been tabulated for each of the twelve (O, S, Se, Te, F, Cl, Br, I, N, P, As, H) anions (see Appendix A, Table A2); dij is the bond length of the nearest neighboring atom; Rij is the bond valence parameter; b = 0.37 Å is an empirical valid constant for all pairs of atoms bonded together; Vi is the total atom valence (or the oxidation state) of i and CN is the coordination number. The results of the calculations are shown in Table 6.
Table 6.
Average bond lengths of Ln–O bonds in different complexes and the difference in bond lengths for different core ions Unit: Å.
As can be seen from Table 6, the bond length of the Tm3+–O bond in the TODGA complex is significantly smaller than that of the other three Ln–Os, and the stability of TODGA-Tm3+ is the strongest among the four complexes, which coincides with the highest binding energy of TODGA–Tm in Table 5, and thus Tm3+ is most easily extracted into the organic phase by TODGA. Meanwhile, the bond length of the Dy3+–O bond is the longest among the four Ln–Os, and the stability of TODGA–Dy3+ is weaker than that of the other three complexes, so Dy3+ is most likely to be scrubbed into the aqueous phase during the extraction process.
4. Conclusions
The following conclusions are drawn from theoretical calculations and structural analysis: (1) The distribution ratios of Dy3+, Er3+, Tm3+ and Yb3+ in the TODGA–kerosene/hydrochloric acid system can be changed by adjusting the hydrochloric acid concentration under different aqueous phase conditions. (2) The mixture containing Tm3+ 0.248 mol·L−1, Yb3+ 0.242 mol·L−1, Dy3+ 0.258 mol·L−1 and Er3+ 0.252 mol·L−1 can be separated by the fractional extraction theory calculation. Single REE products with concentrations of Tm3+ 0.315 mol·L−1, Yb3+ 0.508 mol·L−1, Dy3+ 0.167 mol·L−1 and Er3+ 0.365 mol·L−1 were obtained sequentially. The purity of each product was greater than 99%, and the final yields were 96.98%, 97.56%, 98.24% and 98.18%, in that order. (3) The coordination number of TODGA to form complexes with Dy3+, Er3+, Tm3+ and Yb3+ is 9. The binding energies of the TODGA–RE3+ complexes are ranked from low to high as Er3+< Yb3+< Dy3+< Tm3+ by density functional calculations. The average bond lengths of Ln–O bonds formed by REEs with TODGA in the complexes are ranked from shortest to longest as Tm3+< Er3+< Yb3+< Dy3+.
Author Contributions
Conceptualization, formal analysis, writing—original draft preparation and methodology, Y.B.; writing—review and editing A.G. and L.Q.; validation, Y.W., G.G., W.Z., Y.L., J.Y., X.H. and Y.C. All authors have read and agreed to the published version of the manuscript.
Funding
This work was financially supported by the National Key R&D Program of China (No. 2017YFF0106006) and the Cooperation Projects between Universities and Enterprises (No. 2023-0789).
Data Availability Statement
Data is contained within the article.
Conflicts of Interest
The authors declare no conflicts of interest.
Appendix A
Table A1.
Theoretically deduced Ln–N bond valence parameters RLn–N with various CNs [33]. Unit: Å.
Table A1.
Theoretically deduced Ln–N bond valence parameters RLn–N with various CNs [33]. Unit: Å.
| CN | La | Ce | Pr | Nd | Pm | Sm | Eu | Gd | Tb | Dy | Ho | Er | Tm | Yb | Lu |
|---|---|---|---|---|---|---|---|---|---|---|---|---|---|---|---|
| 6 | 2.303 | 2.255 | 2.256 | 2.227 | 2.214 | 2.201 | 2.161 | 2.139 | 2.124 | 2.106 | 2.138 | 2.053 | 2.079 | 2.067 | 2.060 |
| 7 | 2.243 | 2.206 | 2.199 | 2.201 | 2.180 | 2.158 | 2.066 | 2.154 | 2.121 | 2.095 | 2.047 | 2.080 | 2.068 | 2.041 | 2.018 |
| 8 | 2.222 | 2.236 | 2.184 | 2.185 | 2.173 | 2.160 | 2.144 | 2.115 | 2.098 | 2.101 | 2.117 | 2.084 | 2.067 | 2.049 | 2.054 |
| 9 | 2.261 | 2.244 | 2.224 | 2.177 | 2.169 | 2.161 | 2.165 | 2.160 | 2.137 | 2.138 | 2.126 | 2.101 | 2.087 | 2.109 | 2.082 |
| 10 | 2.260 | 2.240 | 2.218 | 2.221 | 2.200 | 2.178 | 2.197 | 2.174 | 2.179 | 2.147 | 2.148 | 2.134 | 2.139 | 2.114 | 2.084 |
| 11 | 2.303 | 2.266 | 2.225 | 2.331 | 2.289 | 2.246 | 2.215 | 2.184 | 2.181 | 2.165 | 2.154 | 2.139 | 2.127 | 2.120 | 2.098 |
| 12 | 2.316 | 2.321 | 2.246 | 2.297 | 2.280 | 2.262 | 2.258 | 2.208 | 2.211 | 2.196 | 2.185 | 2.173 | 2.158 | 2.155 | 2.132 |
| mean | 2.261 | 2.254 | 2.215 | 2.201 | 2.215 | 2.171 | 2.161 | 2.146 | 2.130 | 2.124 | 2.118 | 2.086 | 2.082 | 2.064 | 2.046 |
Table A2.
Parameters ajk (upper) and bjk (lower) for linear relationship equations among Ln–N, Ln–C, Ln–S, Ln–Cl and Ln–O mean bond valence parameters, respectively [33].
Table A2.
Parameters ajk (upper) and bjk (lower) for linear relationship equations among Ln–N, Ln–C, Ln–S, Ln–Cl and Ln–O mean bond valence parameters, respectively [33].
| k | j | ||||
| O | N | C | S | Cl | |
| O | 0.0 | −0.015 | −0.176 | 0.418 | 0.400 |
| 1.0 | 1.064 | 1.124 | 1.026 | 1.009 | |
| N | 0.045 | 0.0 | −0.142 | 0.457 | 0.437 |
| 0.925 | 1.0 | 1.047 | 0.953 | 0.937 | |
| C | 0.197 | 0.181 | 0.0 | 0.613 | 0.589 |
| 0.871 | 0.933 | 1.0 | 0.897 | 0.882 | |
| S | −0.400 | −0.450 | −0.637 | 0.0 | −0.019 |
| 0.971 | 1.037 | 1.096 | 1.0 | 0.985 | |
| Cl | −0.335 | −0.381 | −0.565 | 0.060 | 0.0 |
| 0.967 | 1.033 | 1.092 | 0.998 | 1.0 | |
Table A3.
List of symbols for cascade extraction calculations.
Table A3.
List of symbols for cascade extraction calculations.
| Symbols | Name | Unit |
|---|---|---|
| Mass flow rate of aqueous phase A | mol·min−1 | |
| Mass flow rate of organic phase A | mol·min−1 | |
| Mass flow rate of A in the aqueous phase feed solution | mol·min−1 | |
| Concentration of A in the aqueous phase feed solution | mol·L−1 | |
| Purification factor of groups A | ||
| Mass flow rate of aqueous phase B | mol·min−1 | |
| Mass flow rate of organic phase B | mol·min−1 | |
| Mass flow rate of B in the aqueous phase feed solution | mol·min−1 | |
| Concentration of B in the aqueous phase feed solution | mol·L−1 | |
| Purification factor of groups B | ||
| Average distribution ratio of component A in extraction section | ||
| Average distribution ratio of component B in extraction section | ||
| Average separation factor in extraction section | ||
| Average separation factor in scrubbing section | ||
| Phase ratio | ||
| Average extraction ratio of component A in extraction section | ||
| Average extraction ratio of component B in extraction section | ||
| Average extraction ratio of component A in scrubbing section | ||
| Average extraction ratio of component B in scrubbing section | ||
| Average mixed extraction ratio in extraction section | ||
| Average mixed extraction ratio in scrubbing section | ||
| Molar fraction of A in the feed solution | ||
| Organic phase outlet fraction | ||
| Molar fraction of B in the feed solution | ||
| Aqueous phase outlet fraction | ||
| Mass flow rate of organic phase feed solution | mol·min−1 | |
| Mass flow rate of aqueous phase feed solution | mol·min−1 | |
| Scrubbing stage number (excluding feed stage) | ||
| Extraction stage number (including feed stage) | ||
| Purity of component A in organic phase export products | ||
| Purity of component B in aqueous phase export products | ||
| Maximum extraction mass flow | mol·min−1 | |
| Volume flow rate of feed solution | ml·min−1 | |
| Volume flow rate of organic solution | ml·min−1 | |
| Volume flow rate of scrubbing solution | ml·min−1 | |
| Maximum scrubbing mass flow | mol·min−1 | |
| Yield of component A | ||
| Yield of component B | ||
| Concentrations of the raffinate aqueous phase | mol·L−1 |
References
- Voncken, J.H.L. The Rare Earth Elements: An Introduction; Springer: New York, NY, USA, 2016. [Google Scholar]
- Lima, I.B.D.; Filho, W.L. Rare Earths Industry: Technological, Economic, and Environmental Implications; Elsevier: New York, NY, USA, 2016. [Google Scholar]
- Goodenough, K.M.; Wall, F. The Rare Earth Elements: Demand, Global Resources, and Challenges for Resourcing Future Generations. Nat. Resour. Res. 2018, 27, 201–216. [Google Scholar] [CrossRef]
- Chen, L.Y.; Deng, B.C.; Kuang, S.T.; Liao, W.P. Efficient extraction and separation of heavy rare earths from chloride medium with N, N′-di(2-ethylhexyl)aminomethyl phosphonic acid mono-2-ethylhexyl ester. Hydrometallurgy 2023, 222, 106173. [Google Scholar] [CrossRef]
- Nemova, G. Radiation-balanced lasers: History, status, potential. Appl. Sci. 2021, 11, 7539. [Google Scholar] [CrossRef]
- Starecki, F.; Braud, A.; Doualan, J.-L.; Ari, J.; Boussard-Pl’edel, C.; Michel, K.; Nazabal, V.; Camy, P. All-optical carbon dioxide remote sensing using rare earth doped chalcogenide fibers. Opt. Lasers Eng. 2019, 122, 328–334. [Google Scholar] [CrossRef]
- Akatsuka, M.; Nakauchi, D.; Kato, T.; Kawaguchi, N.; Yanagida, T. Optical and scintillation properties of YAlO3 doped with rare-earths emitting near-infrared photons. Sens. Mater. 2020, 32, 1373–1380. [Google Scholar] [CrossRef]
- Pinto, I.C.; Rivera, V.A.G.; Falci, R.; Fuertes, V.; LaRochelle, S.; Messaddeq, Y. Tailoring near-infrared luminescence with Er3+/Tm3+/Yb3+ tri-doped tellurite glasses for applications in the C, L and U bands. J. Lumin. 2024, 265, 120206. [Google Scholar] [CrossRef]
- El Ouardi, Y.; Virolainen, S.; Mouele, E.S.M.; Laatikainen, M.; Repo, E.; Laatikainen, K. The recent progress of ion exchange for the separation of rare earths from secondary resources–A review. Hydrometallurgy 2023, 218, 106047. [Google Scholar] [CrossRef]
- Liu, T.C.; Chen, J. Extraction and separation of heavy rare earth elements: A review. Sep. Purif. Technol. 2021, 276, 119263. [Google Scholar] [CrossRef]
- Turra, C. Sustainability of Rare Earth Elements Chain: From Production to Food—A Review. Int. J. Environ. Health Res. 2018, 28, 23–42. [Google Scholar] [CrossRef]
- Krishnamurthy, N.; Gupta, C.K. Extractive Metallurgy of Rare Earth Elements; CRC Press: New York, NY, USA, 2016. [Google Scholar]
- Gschneidner, K.A.; Bünzli, J.C.G.; Pecharsky, V.K. Handbook on the Physics and Chemistry of Rare Earths; Elsevier: New York, NY, USA, 2005. [Google Scholar]
- Kuang, S.T.; Liao, W.P. Progress in the Extraction and Separation of Rare Earths and Related Metals with Novel Extractants: A Review. Sci. China Technol. Sci. 2018, 61, 1319–1328. [Google Scholar] [CrossRef]
- Li, D.Q. Development Course of Separating Rare Earths with Acid Phosphorus Extractants: A Critical Review. J. Rare Earths 2018, 37, 468–486. [Google Scholar] [CrossRef]
- Dong, Y.M.; Sun, X.Q.; Wang, Y.L.; Chai, Y.J. The development of an extraction strategy based on EHEHP-type functional ionic liquid for heavy rare earth element separation. Hydrometallurgy 2015, 157, 256–260. [Google Scholar] [CrossRef]
- Wang, W.; Yang, H.L.; Cui, H.M.; Zhang, D.L.; Liu, Y.; Chen, J. Application of bifunctionalionic liquid extractants [A336][CA-12] and [A336][CA-100] to the lanthanum extraction and separation from rare earths in the chloride medium. Ind. Eng. Chem. Res. 2021, 50, 7534–7541. [Google Scholar] [CrossRef]
- Gupta, C.K.; Krishnamurthy, N. Extractive Metallurgy of Rare-Earths; CRC: Boca Raton, FL, USA, 2004; p. 15. [Google Scholar]
- Abreu, R.D.; Morais, C.A. Study on separation of heavy rare earth elements by solvent extraction with organophosphorus acids and amine reagents. Miner. Eng. 2014, 61, 82–87. [Google Scholar] [CrossRef]
- Zhang, X.F.; Li, D.Q. Extraction of rare-earth ions (III) with bis(2,4,4-trimethylpentyl) phosphinic acid. Chin. J. Appl. Chem. 1993, 10, 72–74. [Google Scholar]
- Zhang, C.; Wang, L.S.; Huang, X.W.; Dong, J.S.; Long, Z.Q.; Zhang, Y.Q. Yttrium extraction from chloride solution with a synergistic system of 2-ethylhexyl phosphonic acid mono-(2-ethylhexyl) ester and bis(2,4,4trimethylpentyl) phosphinic acid. Hydrometallurgy 2014, 147–148, 7–12. [Google Scholar] [CrossRef]
- Wang, X.L.; Li, W.; Li, D.Q. Extraction and stripping of REs using mixtures of acidic phosphorus based reagents. J. Res. 2011, 29, 413–415. [Google Scholar]
- Xiong, Y.; Wang, X.L.; Li, D.Q. Synergistic extraction and separation of heavy lanthanide by mixtures of bis(2,4,4-trimethylpentyl) phosphinic acid and 2-ethylhexyl phosphinic acid mono-2-ethylhexyl ester. Sep. Sci. Technol. 2005, 40, 2325–2336. [Google Scholar] [CrossRef]
- Xiong, Y.; Li, W.; Wu, D.B.; Li, D.Q.; Meng, S.L. Kinetics and mechanism of Yb(III) extraction and separation from Y(III) with mixtures of bis(2,4,4-trimethylpentyl)phosphinic acid and 2-ethylhexyl phosphonic acid mono-2-ethylhexyl ester. Sep. Sci. Technol. 2006, 41, 167–178. [Google Scholar] [CrossRef]
- Li, D.Q.; Wang, X.L.; Meng, S.L.; Li, W. A Kind of Technique with Adding Modifier for Extraction and Separation of REs. Chinese Patent Application No. 200510016682.6, 5 April 2005. [Google Scholar]
- Anderson, J.L.; Armstrong, D.W.; Wei, G.-T. Ionic liquids in analytical chemistry. Anal. Chem. 2006, 78, 2893–2902. [Google Scholar] [CrossRef]
- Sun, X.Q.; Ji, Y.; Hu, F.C.; He, B.; Chen, J.; Li, D.Q. The inner synergistic effect of bifunctional ionic liquid extractant for solvent extraction. Talanta 2010, 81, 1877–1883. [Google Scholar] [CrossRef] [PubMed]
- Sun, X.Q.; Ji, Y.; Liu, Y.; Chen, J.; Li, D.Q. An engineering-purpose preparation strategy for ammonium-type ionic liquid with high purity. AICHE J. 2010, 56, 989–996. [Google Scholar] [CrossRef]
- Liu, Y.H.; Chen, J.; Li, D.Q. Application and perspective of ionic liquids on REs green separation. Sep. Sci. Technol. 2012, 47, 223–232. [Google Scholar] [CrossRef]
- Guo, L.; Chen, J.; Shen, L.; Zhang, J.P.; Zhang, D.L.; Deng, Y.F. Highly selective extraction and separation of REs(III) using bifunctional ionic liquid extractant. ACS Sustain. Chem. Eng. 2014, 2, 1968–1975. [Google Scholar] [CrossRef]
- Kuang, S.T.; Zhang, Z.F.; Li, Y.L.; Wei, H.Q.; Liao, W.P. Extraction and separation of heavy rare earths from chloride medium by α-aminophosphonic acid HEHAPP. J. Rare Earths 2018, 36, 304–310. [Google Scholar] [CrossRef]
- GB/T 18882.1–2008; Chemical Analysis Methods of Mixed Rare Earth Oxide of Ion–Absorpted Type RE Ore—Determination of Fifteen REO Relative Content. Standards Press of China: Beijing, China, 2008.
- Zhang, H.; Zhang, X.; Ma, J.G. Chemical Bonding Characteristics of Lanthanide Complexes: A Case of Valence Study. Adv. Mater. Res. 2013, 634–638, 3–6. [Google Scholar] [CrossRef]

Disclaimer/Publisher’s Note: The statements, opinions and data contained in all publications are solely those of the individual author(s) and contributor(s) and not of MDPI and/or the editor(s). MDPI and/or the editor(s) disclaim responsibility for any injury to people or property resulting from any ideas, methods, instructions or products referred to in the content. |
© 2024 by the authors. Licensee MDPI, Basel, Switzerland. This article is an open access article distributed under the terms and conditions of the Creative Commons Attribution (CC BY) license (https://creativecommons.org/licenses/by/4.0/).