A Comparison of Volatile Organic Compounds in Puerariae Lobatae Radix and Puerariae Thomsonii Radix Using Gas Chromatography–Ion Migration Spectrometry
Abstract
1. Introduction
2. Materials and Methods
2.1. Materials
2.2. Analysis Using GC–IMS
2.3. Data Analysis
3. Results
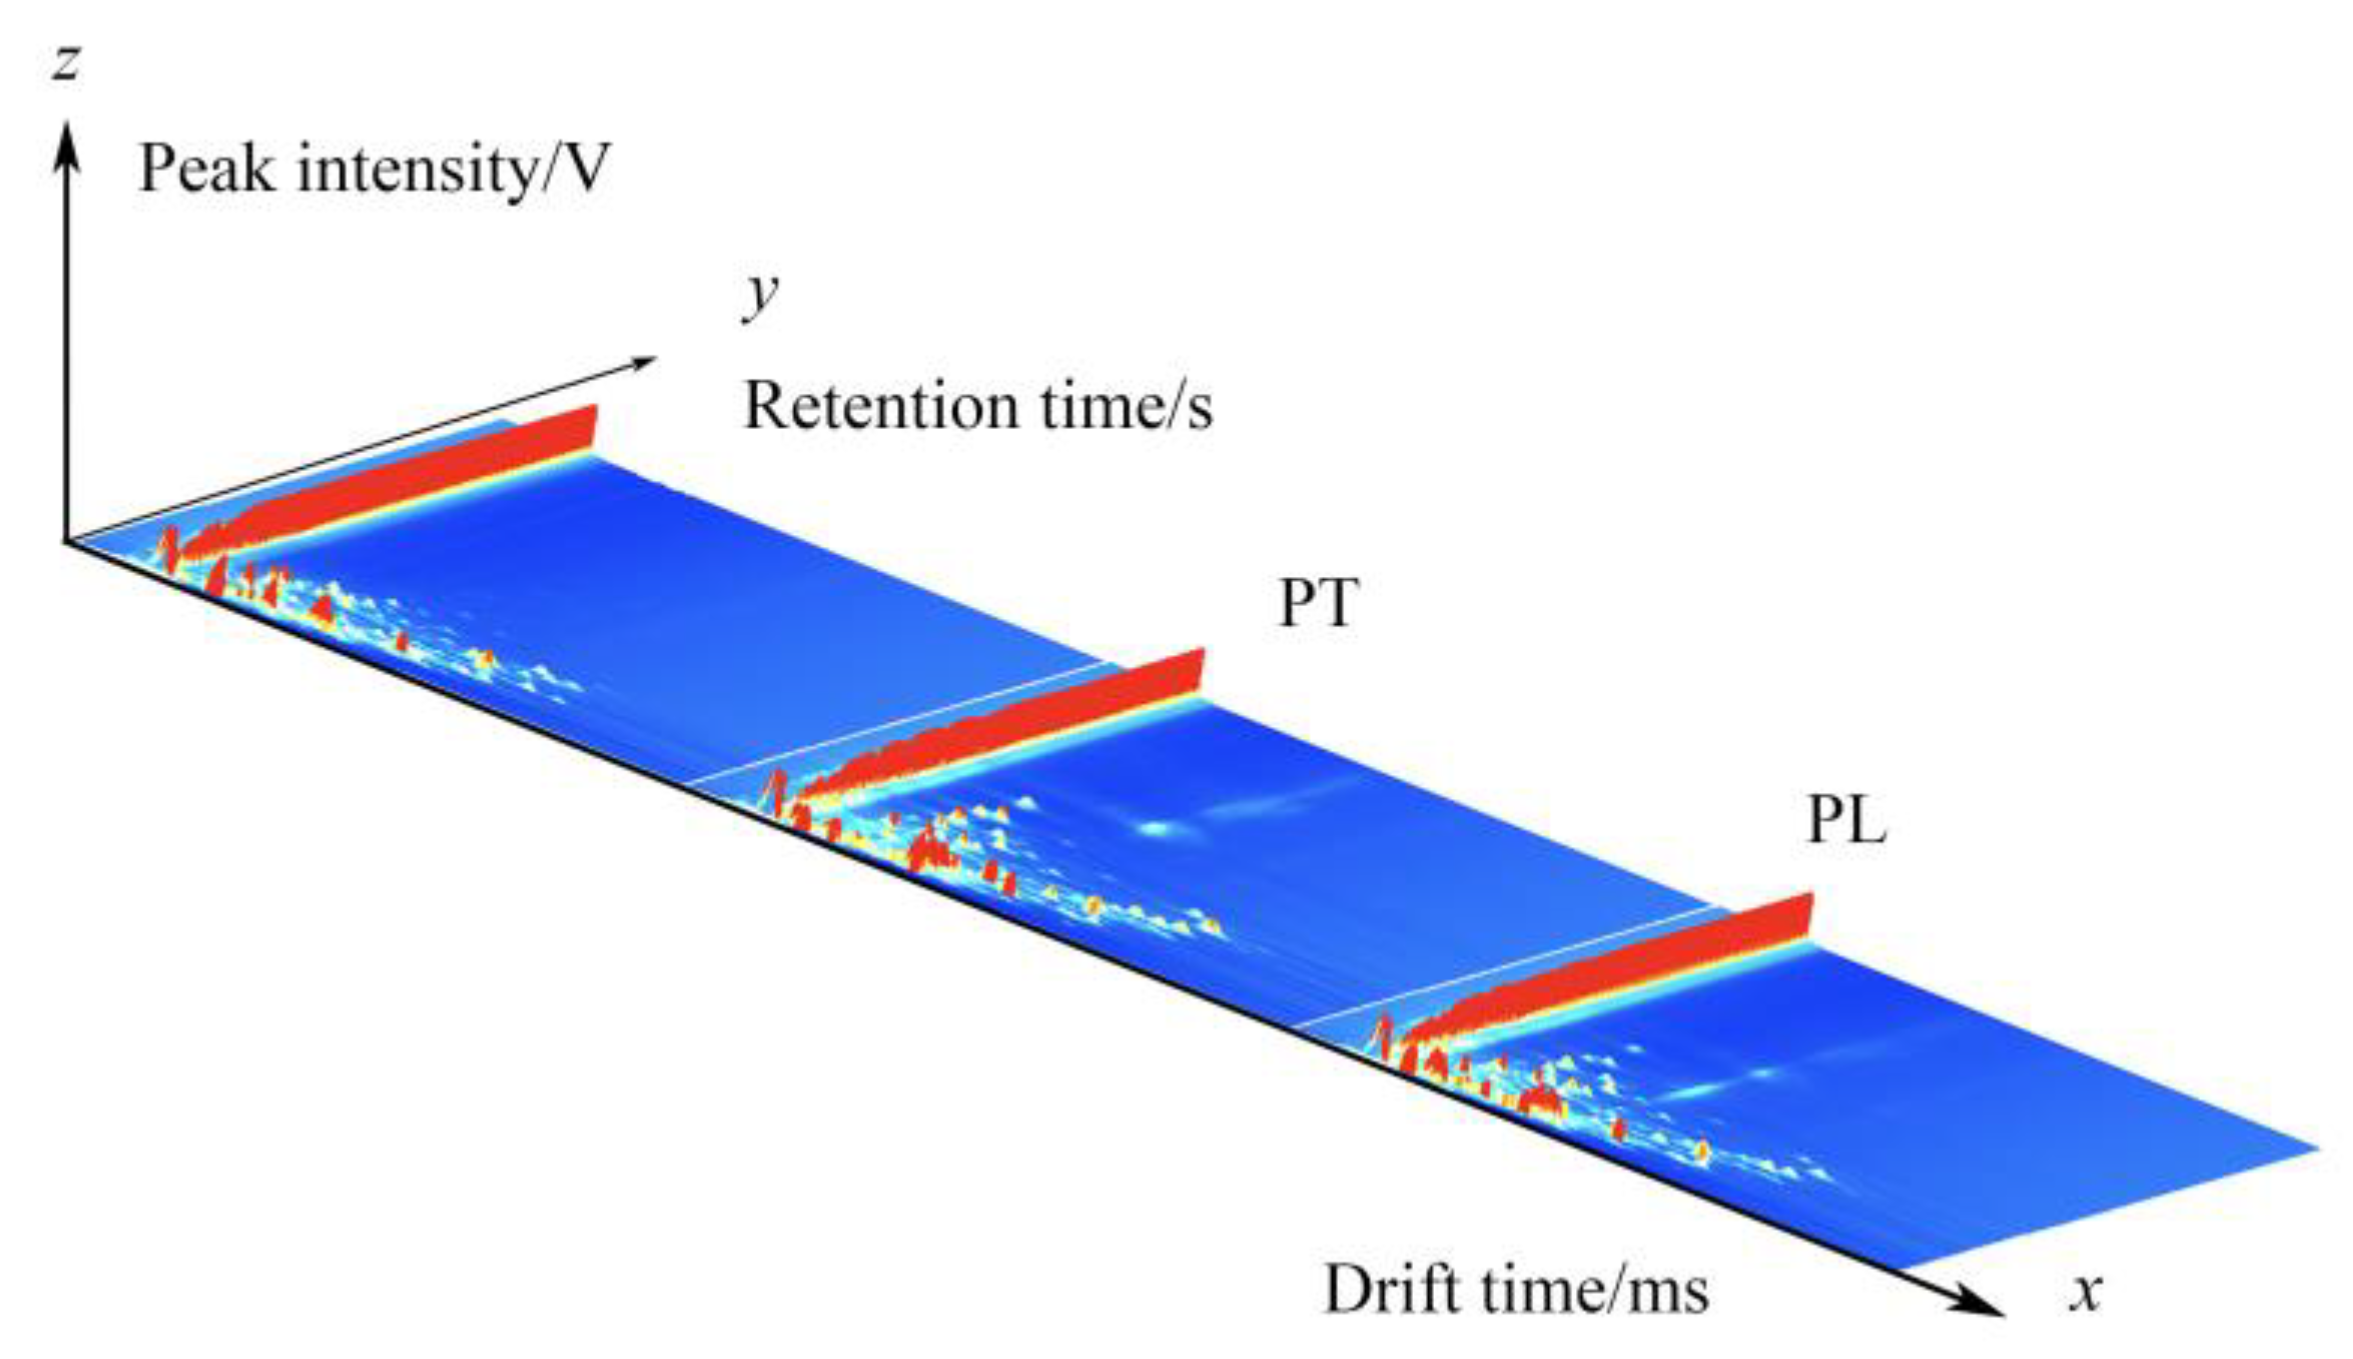
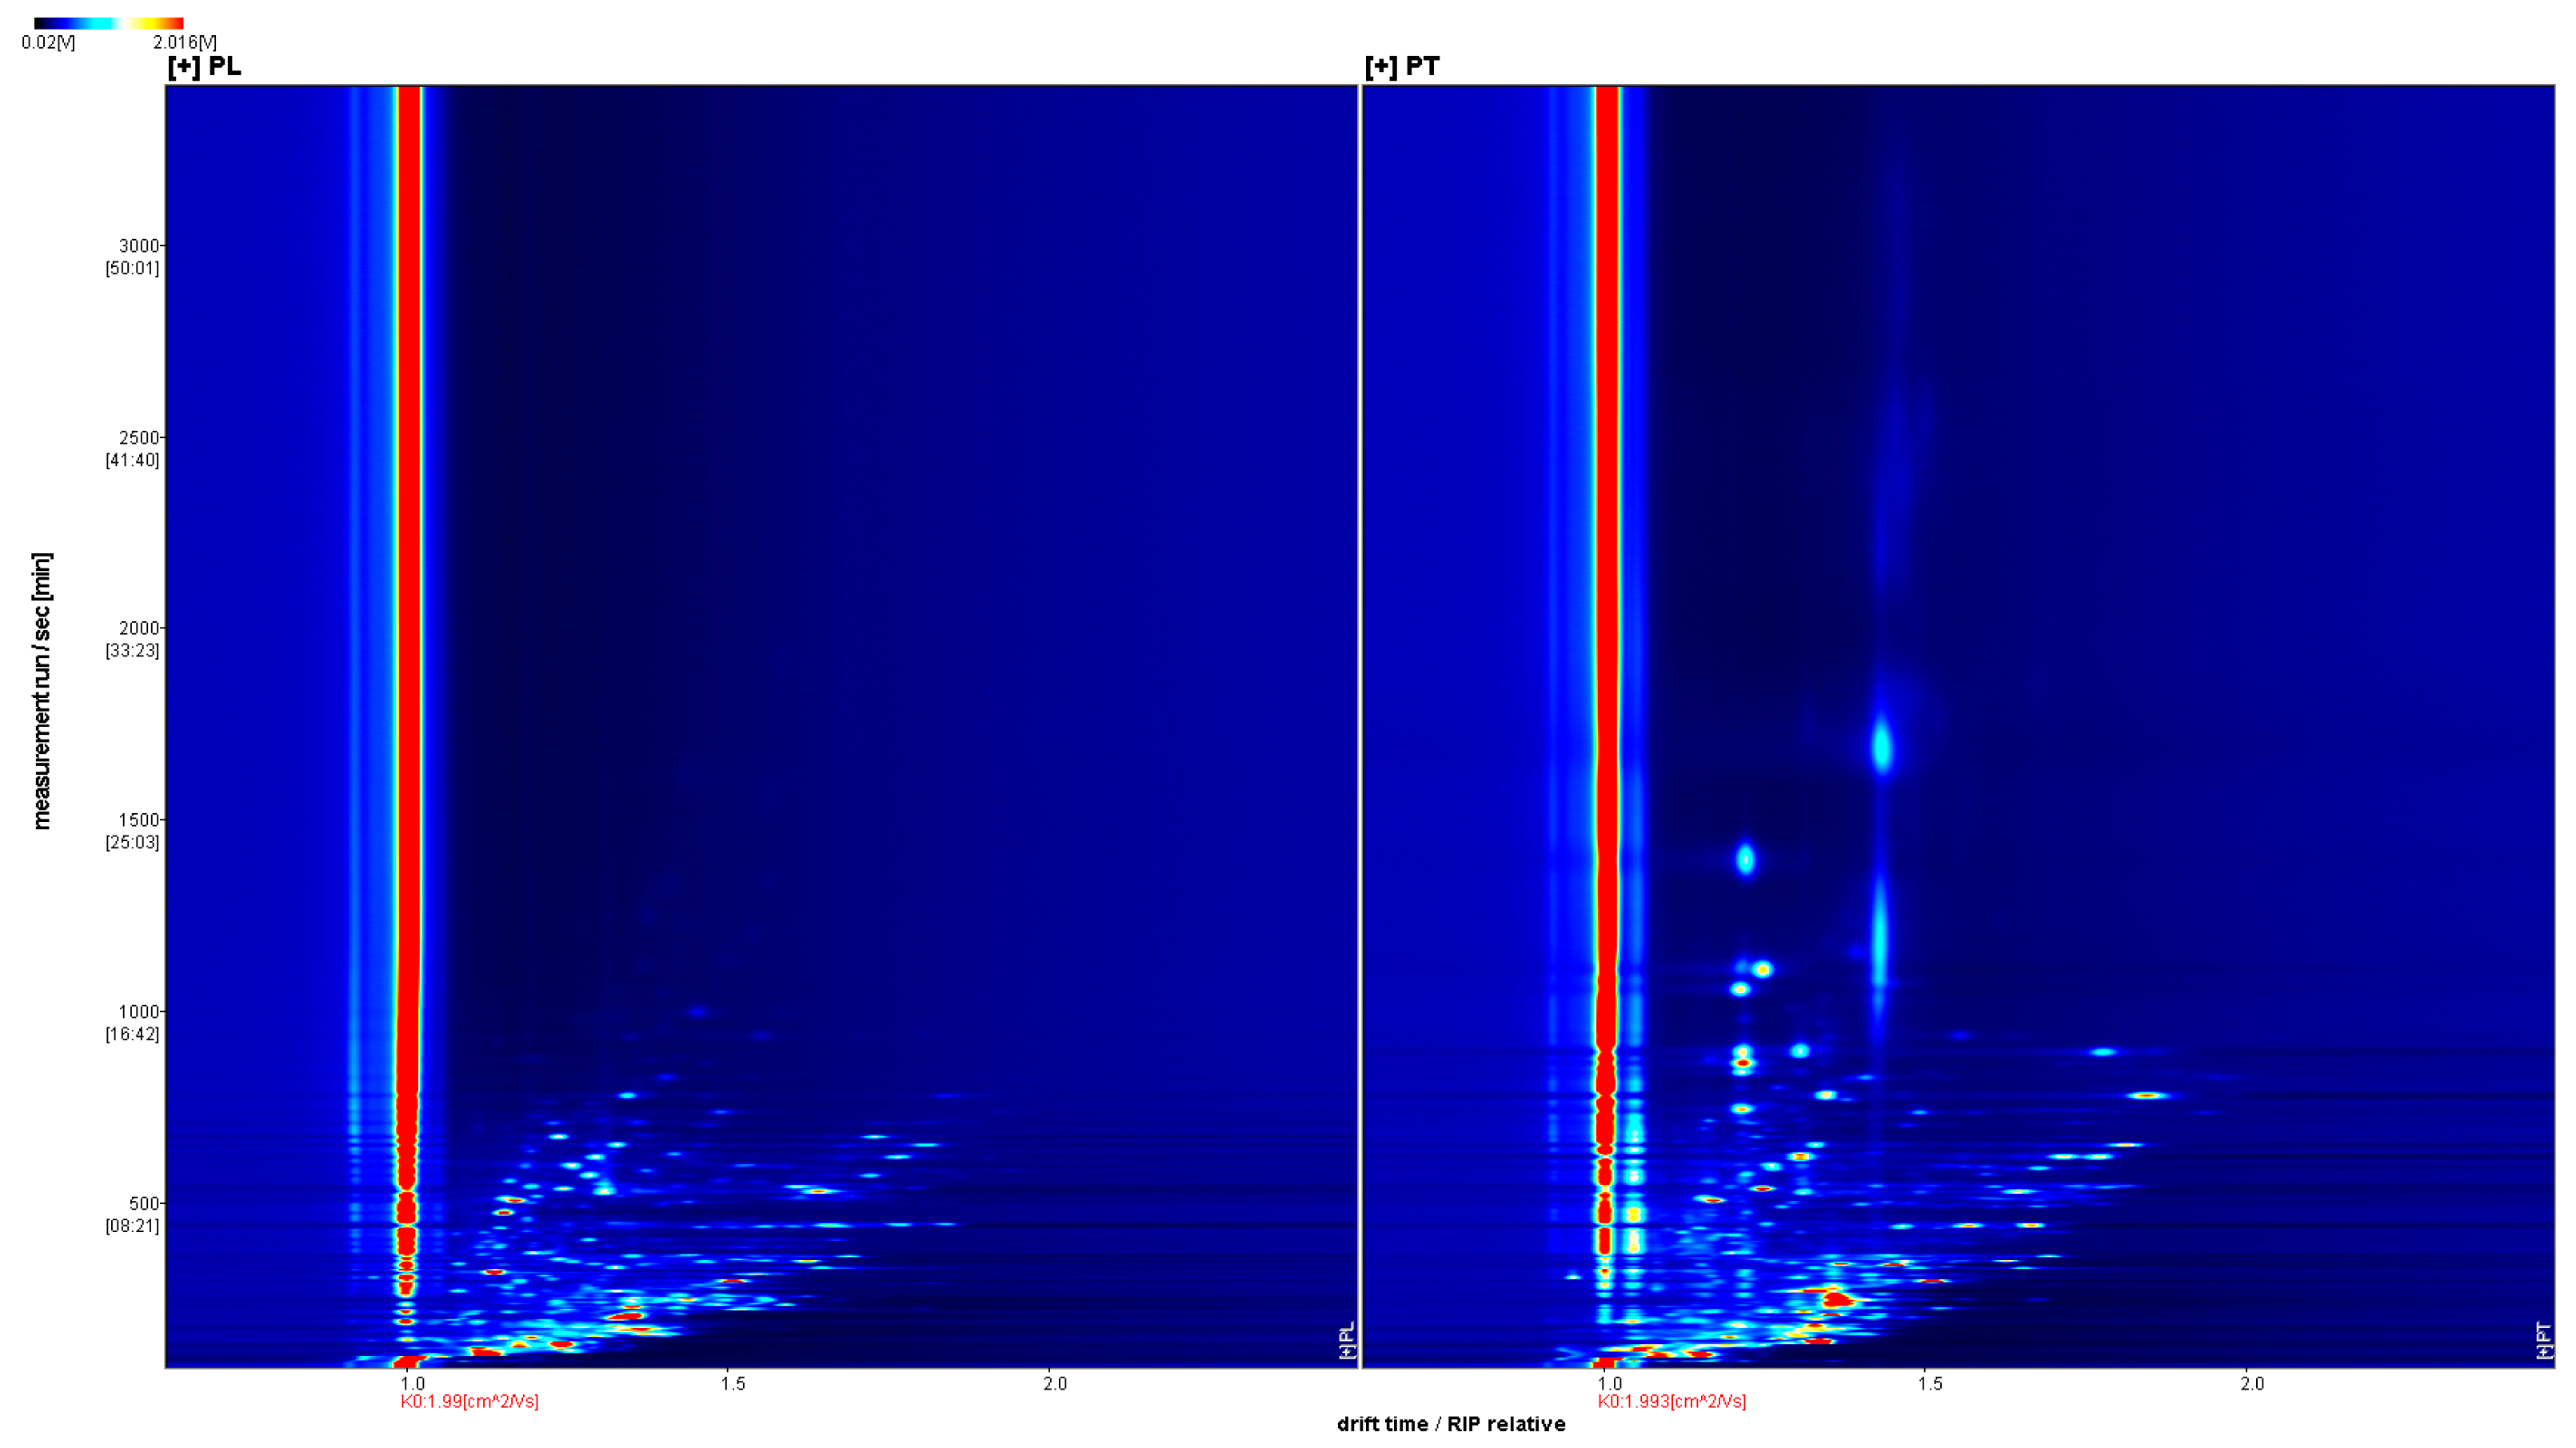
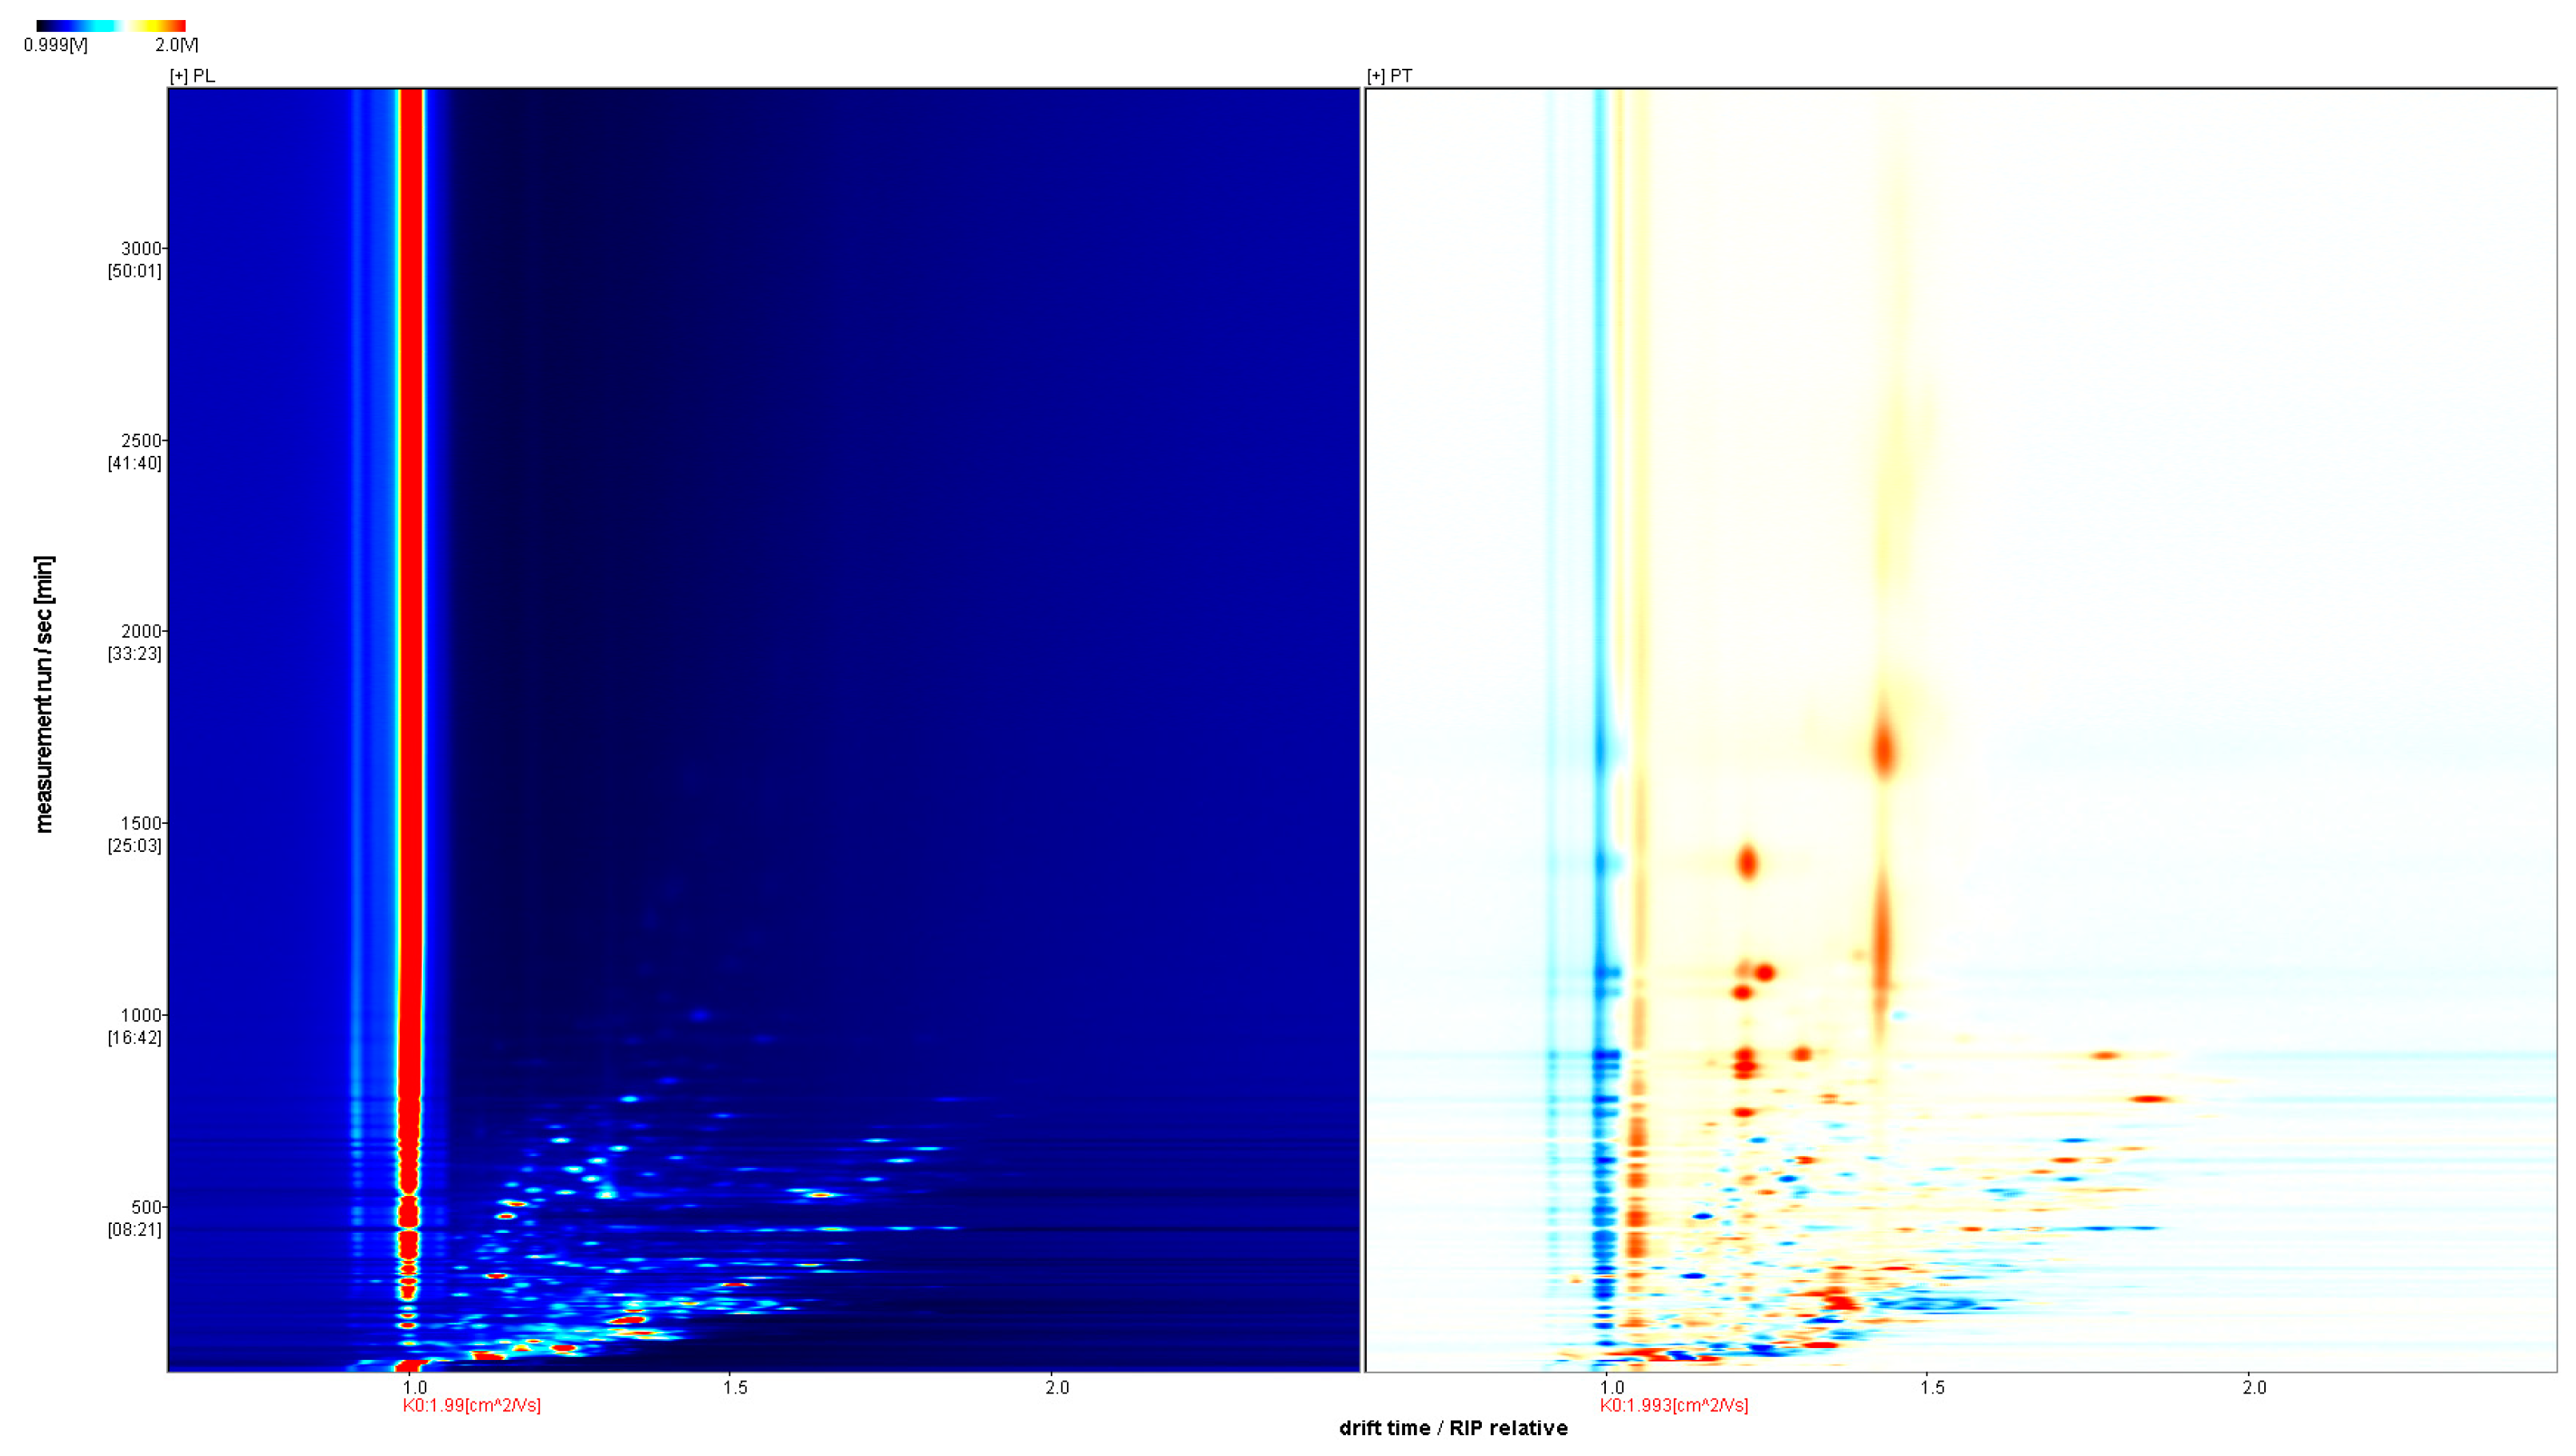
3.1. GC-IMS Analysis of VOCs in PT and PL
3.2. Fingerprints of VOCs in PL and PT
3.3. Identification of VOCs in Different PL and PT
3.4. Chemometrics Analysis
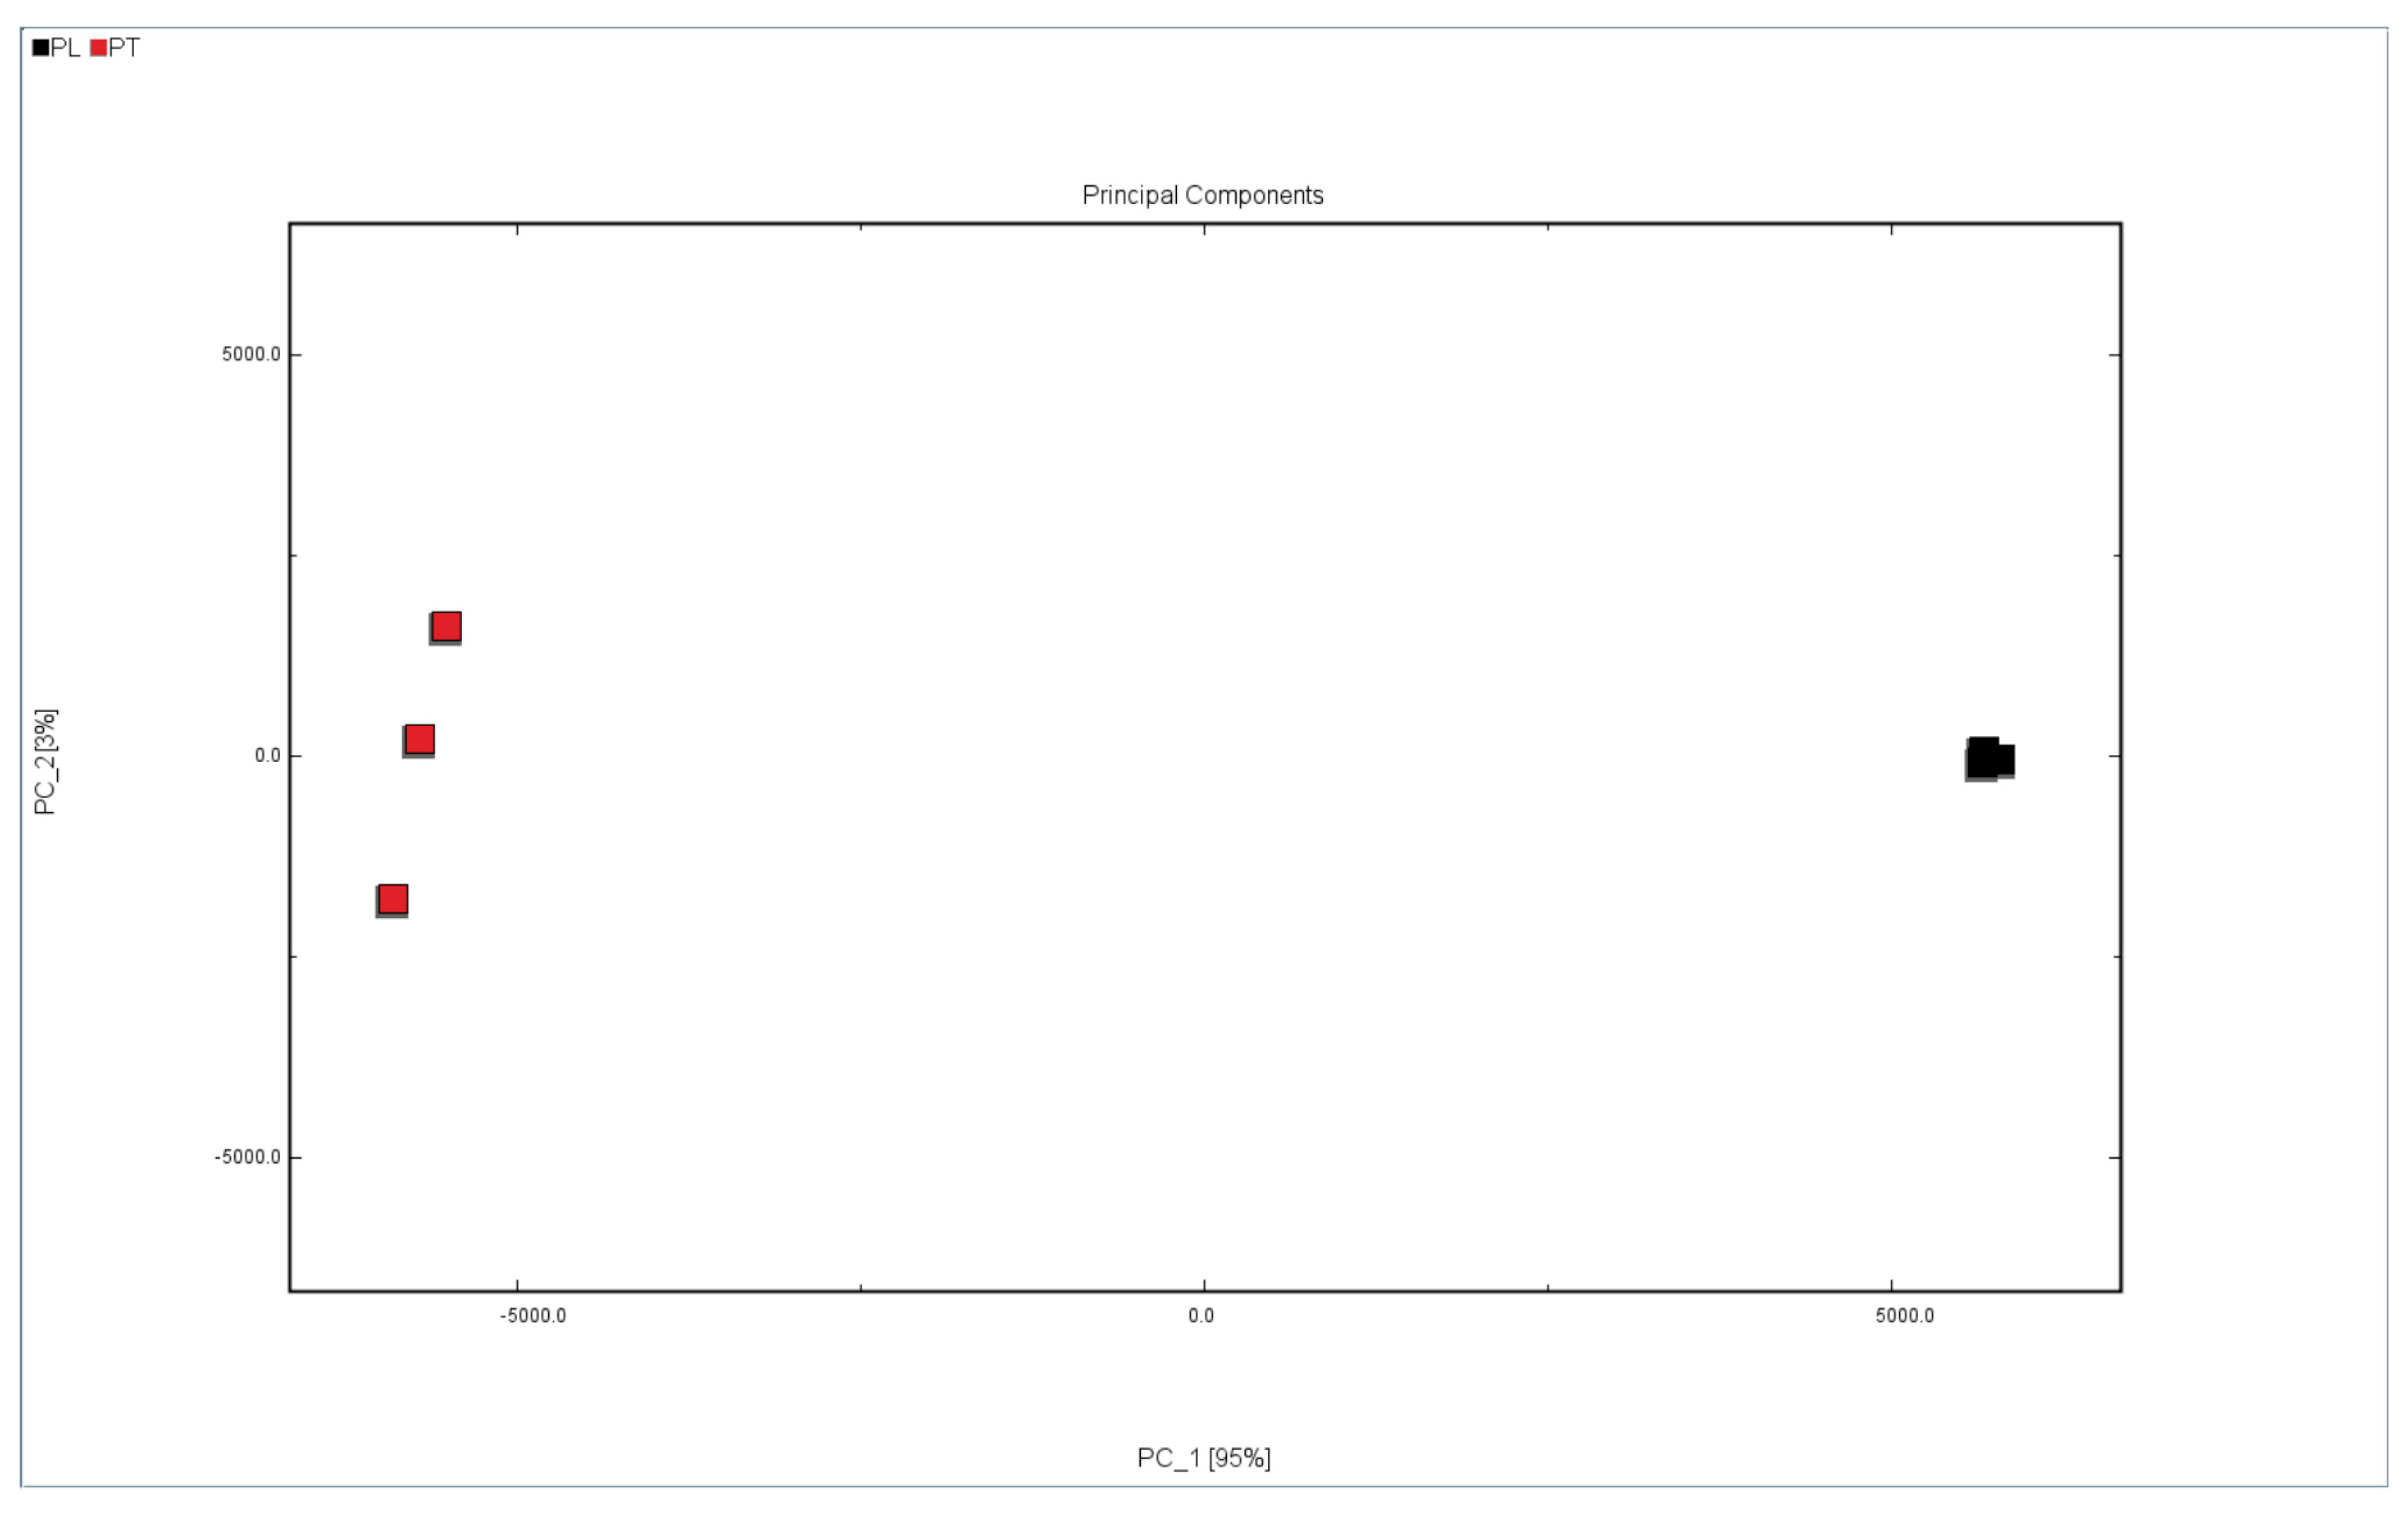
3.4.1. PCA of VOCs in Samples
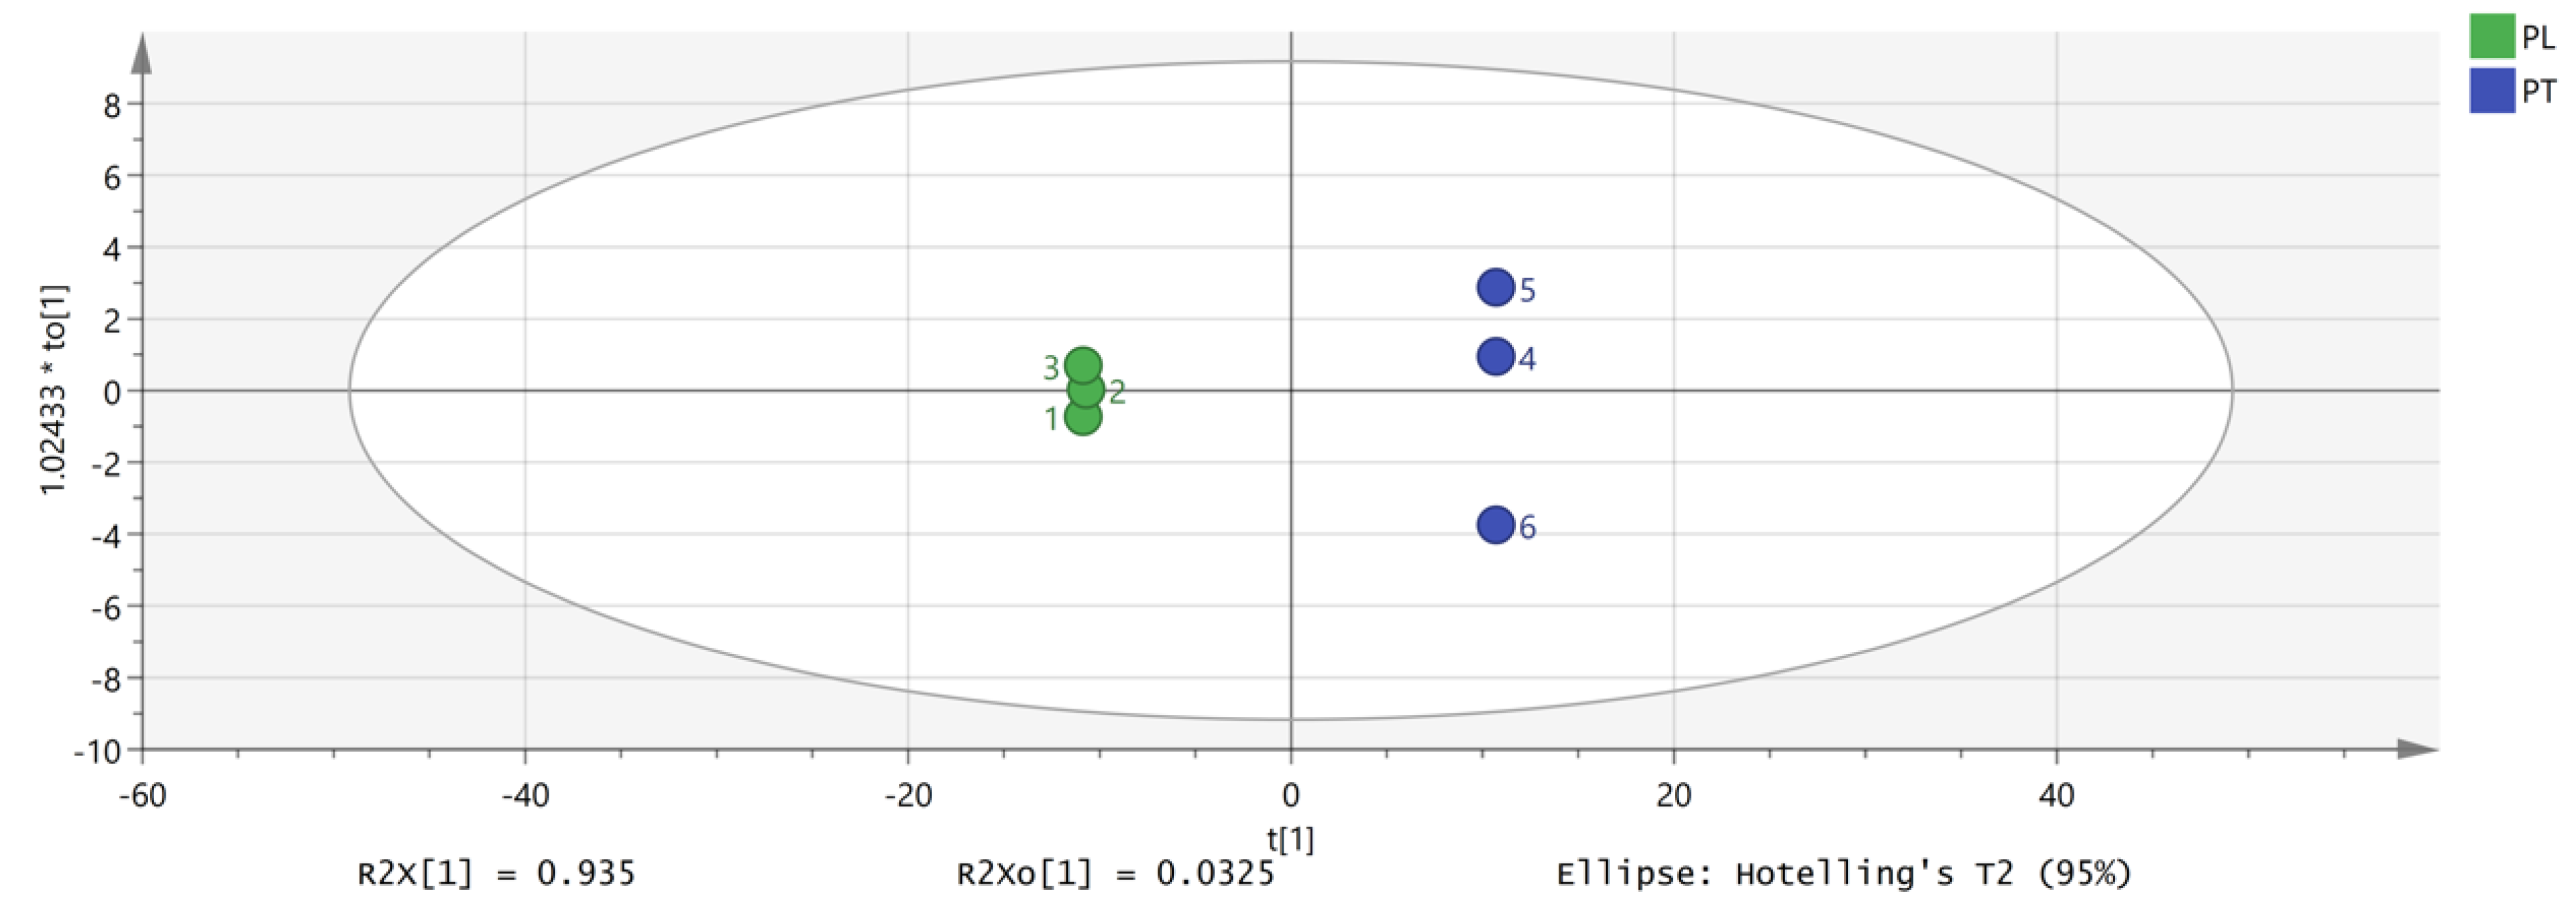
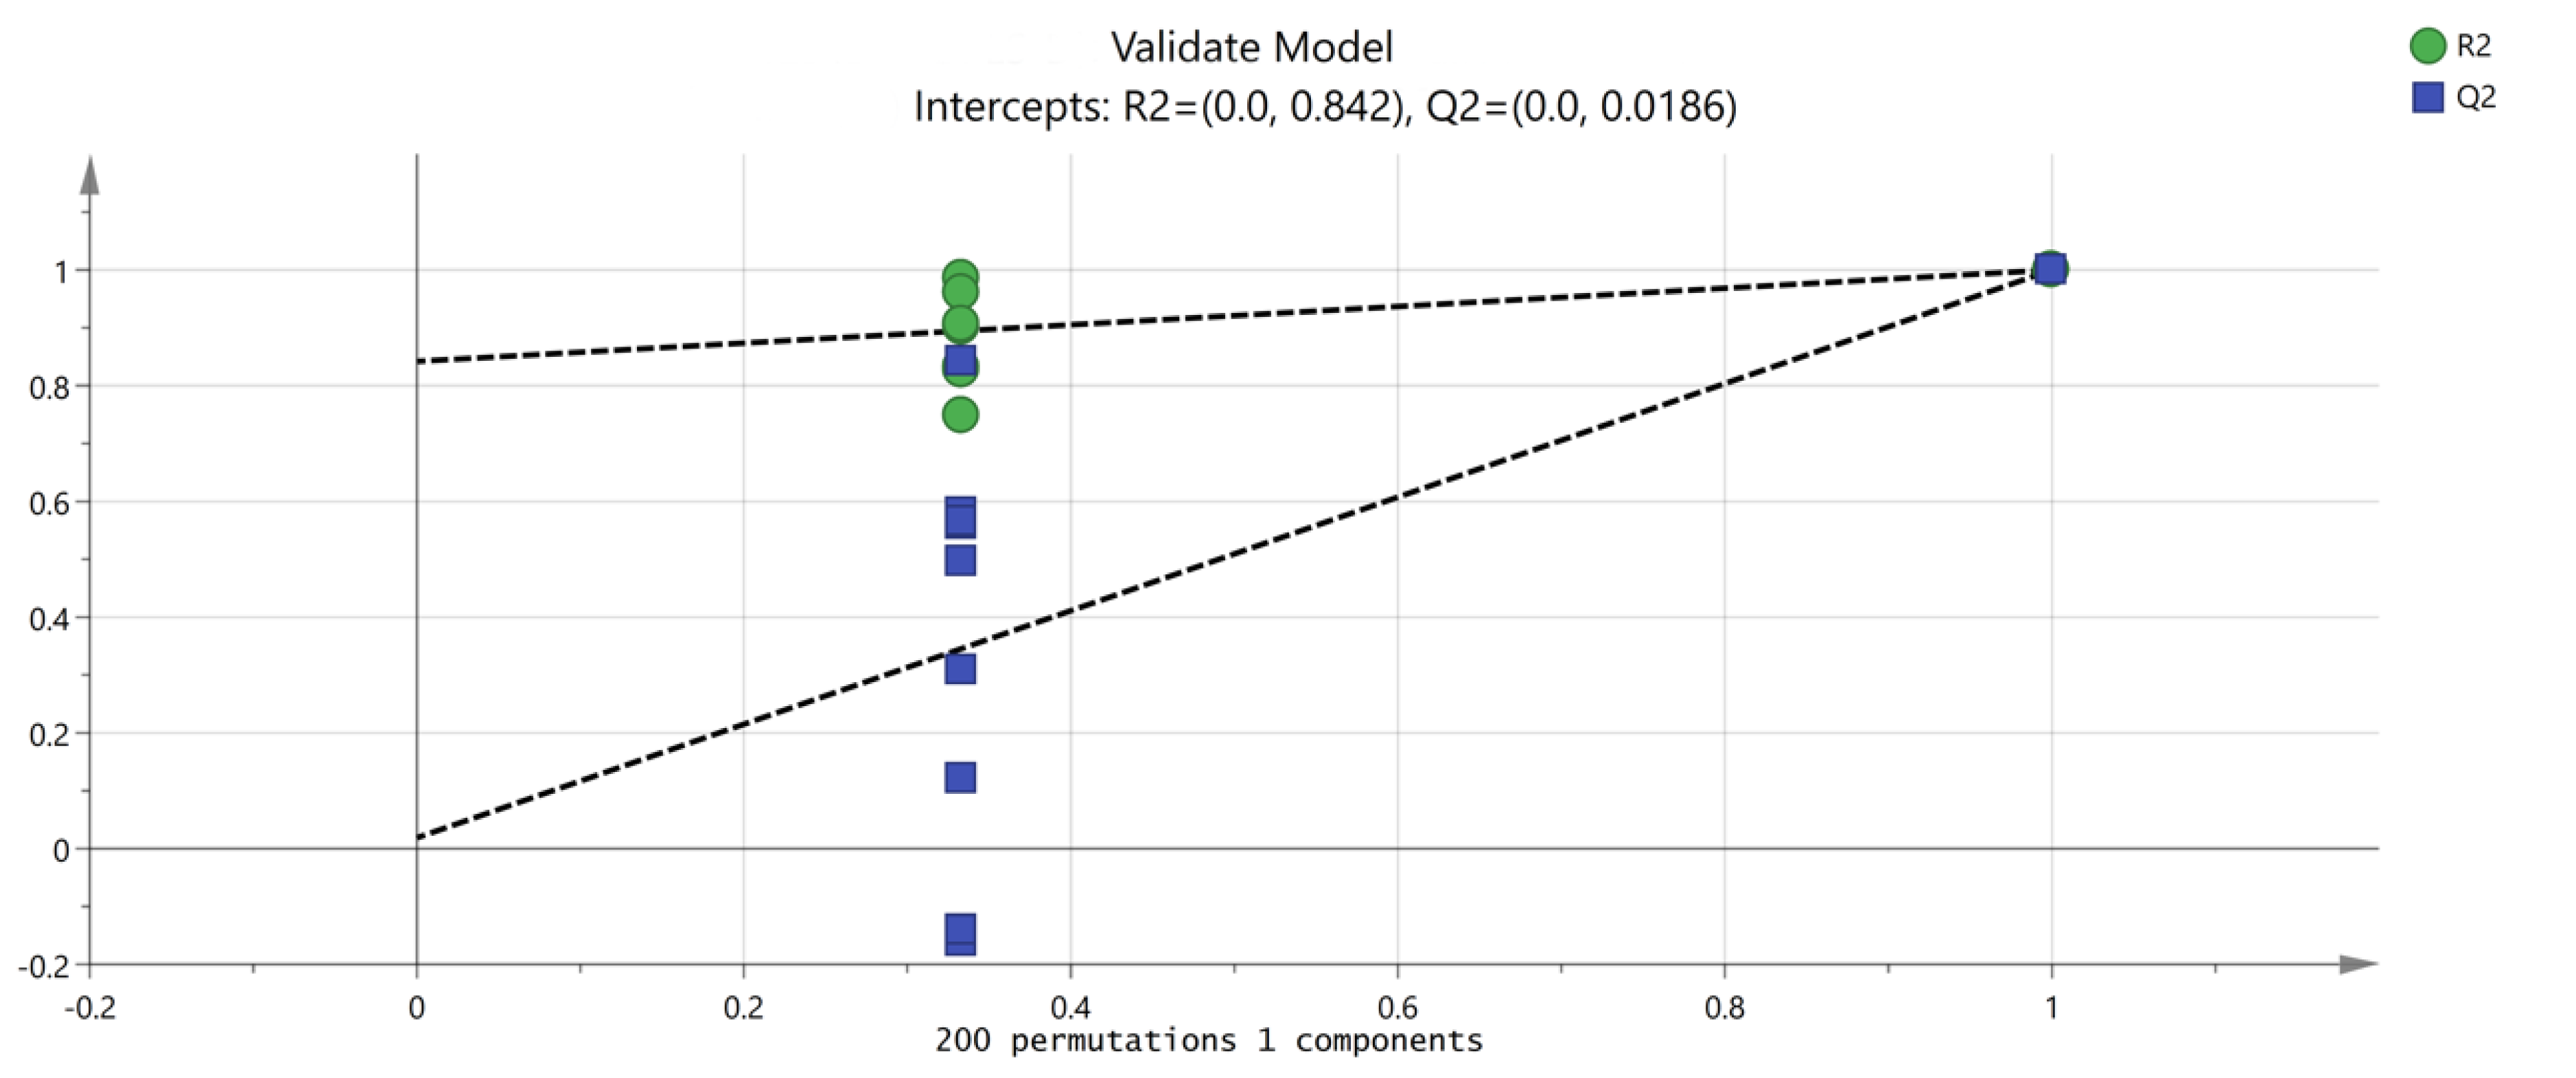
3.4.2. Orthogonal Partial Least Squares Discriminant Analysis (OPLS-DA)
4. Discussion
5. Conclusions
Author Contributions
Funding
Data Availability Statement
Conflicts of Interest
References
- Gudeta, W.F.; Igori, D.; Belete, M.T.; Kim, S.E.; Moon, J.S. Complete genome sequence of pueraria virus A, a new member of the genus Caulimovirus. Arch. Virol. 2022, 6, 1481–1485. [Google Scholar] [CrossRef] [PubMed]
- Wang, S.; Zhang, S.; Wang, S.; Gao, P.; Dai, L. A comprehensive review on Pueraria: Insights on its chemistry and medicinal value. Biomed. Pharmacother. 2020, 131, 110734. [Google Scholar] [CrossRef] [PubMed]
- Committee for the National Pharmacopoeia of P.R. China. Pharmacopoeia of P.R. China, Part I; Beijing Chemical Industry Press: Beijing, China, 2020. [Google Scholar]
- Wu, W.T.; Guo, Z.L.; Ge, S.C.; Kuang, W.L.; Li, W.D.; Wang, S.D.; Liu, P.; Zhou, Z.W.; Zhu, W.F. Pharmacokinetics, pharmacodynamics, and tissue distribution of oral co-loaded puerarin/daidzein mixed micelles in rats. Chin. J. Chin. Mater. Med. 2023, 18, 5068–5077. [Google Scholar] [CrossRef]
- Ding, Z.E.; Wan, X.C. Extraction and separation of dietary fiber from Pueraria. J. Cereals Oils 2004, 4, 38–41. [Google Scholar] [CrossRef]
- Liu, D.; Ma, L.; Zhou, Z.; Liang, Q.; Xie, Q.; Ou, K.; Liu, Y.; Su, Y. Starch and mineral element accumulation during root tuber expansion period of Pueraria thomsonii Benth. Food Chem. 2021, 343, 128445. [Google Scholar] [CrossRef]
- Zhang, J.J.; Chen, M.Q.; JIN, L.B.; Yang, H.L. Research progress of pueraria starch. Guangxi J. Light Ind. 2010, 2, 4–5. [Google Scholar] [CrossRef]
- Zhou, Y.X.; Zhang, H.; Peng, C. Puerarin: A review of pharmacological effects. Phytother. Res. 2014, 7, 961–975. [Google Scholar] [CrossRef]
- Bai, Y.L.; Han, L.L.; Qian, J.H.; Wang, H.Z. Molecular Mechanism of Puerarin Against Diabetes and its Complications. Front. Pharmacol. 2022, 12, 780419. [Google Scholar] [CrossRef]
- Tang, W.; Xiao, L.; Ge, G.; Zhong, M.; Zhu, J.; Qin, J.; Feng, C.; Zhang, W.; Bai, J.; Zhu, X.; et al. Puerarin inhibits titanium particle-induced osteolysis and RANKL-induced osteoclastogenesis via suppression of the NF-κB signaling pathway. J. Cell Mol. Med. 2020, 20, 11972–11983. [Google Scholar] [CrossRef]
- Zhu, G.; Wang, X.; Wu, S.; Li, X.; Li, Q. Neuroprotective effects of puerarin on 1-methyl-4-phenyl-1,2,3,6-tetrahydropyridine induced Parkinson’s disease model in mice. Phytother. Res. 2014, 2, 179–186. [Google Scholar] [CrossRef]
- Hong, X.P.; Chen, T.; Yin, N.N.; Han, Y.M.; Yuan, F.; Duan, Y.J.; Shen, F.; Zhang, Y.H.; Chen, Z.B. Puerarin Ameliorates D-Galactose Induced Enhanced Hippocampal Neurogenesis and Tau Hyperphosphorylation in Rat Brain. J. Alzheimers. Dis. 2016, 2, 605–617. [Google Scholar] [CrossRef] [PubMed]
- Yu, J.; Zhao, L.; Zhang, D.Y.; Zhai, D.X.; Shen, W.; Bai, L.L.; Liu, Y.Q.; Cai, Z.L.; Li, J.; Yu, C.Q. The effects and possible mechanisms of puerarin to treat endometriosis model rats. Evid. Based Complement. Altern. Med. 2015, 2015, 269138. [Google Scholar] [CrossRef] [PubMed]
- Hu, Y.; Li, X.; Lin, L.; Liang, S.; Yan, J. Puerarin inhibits non-small cell lung cancer cell growth via the induction of apoptosis. Oncol. Rep. 2018, 4, 1731–1738. [Google Scholar] [CrossRef] [PubMed]
- Wei, F.; Liu, W.; Yan, H.; Shi, Y.; Zhang, W.J.; Zhang, P.; Cheng, X.L.; Ma, S.C. Analysis of quality and related problems of Chinese medicinal materials and decoction pieces. Chin. J. Pharm. Sci. 2015, 4, 277–283. [Google Scholar] [CrossRef]
- Xiang, G.; Zhou, L.P.; Gui, J.X.; Zhu, J.X. Research progress and prospect of near infrared spectroscopy in consumer products. Infrared 2017, 12, 1–5+12. [Google Scholar] [CrossRef]
- Jiang, R.W.; Lau, K.M.; Lam, H.M.; Yam, W.S.; Leung, L.K.; Choi, K.L.; Waye, M.M.; Mak, T.C.; Woo, K.S.; Fung, K.P. A comparative study on aqueous root extracts of Pueraria thomsonii and Pueraria lobata by antioxidant assay and HPLC fingerprint analysis. J. Ethnopharmacol. 2005, 96, 133–138. [Google Scholar] [CrossRef]
- Li, J.; Yang, M.; Li, Y.; Jiang, M.; Liu, C.; He, M.; Wu, B. Chloroplast genomes of two Pueraria DC. species: Sequencing, comparative analysis and molecular marker development. FEBS Open Bio 2022, 12, 349–361. [Google Scholar] [CrossRef]
- He, S.; Zhang, B.; Dong, X.; Wei, Y.; Li, H.; Tang, B. Differentiation of Goat Meat Freshness Using Gas Chromatography with Ion Mobility Spectrometry. Molecules 2023, 9, 3874. [Google Scholar] [CrossRef]
- Zhou, S.; Feng, D.; Zhou, Y.; Duan, H.; He, Y.; Jiang, Y.; Yan, W. Characteristic Volatile Organic Compound Analysis of Different Cistanches Based on HS-GC-IMS. Molecules 2022, 27, 6789. [Google Scholar] [CrossRef]
- Augustini, A.L.R.M.; Borg, C.; Sielemann, S.; Telgheder, U. Making Every Single Puff Count—Simple and Sensitive E-Cigarette Aerosol Sampling for GCxIMS and GC-MS Analysis. Molecules 2023, 28, 6574. [Google Scholar] [CrossRef]
- Feng, D.; Wang, J.; He, Y.; Ji, X.J.; Tang, H.; Dong, Y.M.; Yan, W.J. HS-GC-IMS detection of volatile organic compounds in Acacia honey powders under vacuum belt drying at different temperatures. Food Sci. Nutr. 2021, 9, 4085–4093. [Google Scholar] [CrossRef]
- Li, M.; Yang, R.; Zhang, H.; Wang, S.; Chen, D.; Lin, S. Development of a flavor fingerprint by HS-GC-IMS with PCA for volatile compounds of Tricholoma matsutake Singer. Food Chem. 2019, 290, 32–39. [Google Scholar] [CrossRef] [PubMed]
- Wang, S.; Chen, H.; Sun, B. Recent progress in food flavor analysis using gas chromatography-ion mobility spectrometry (GC-IMS). Food Chem. 2020, 15, 126158. [Google Scholar] [CrossRef]
- Yuan, J.; Li, H.; Cao, S.; Liu, Z.; Li, N.; Xu, D.; Mo, H.; Hu, L. Monitoring of Volatile Compounds of Ready-to-Eat Kiwifruit Using GC-IMS. Foods 2023, 12, 4394. [Google Scholar] [CrossRef]
- Calle, J.L.P.; Vázquez-Espinosa, M.; Barea-Sepúlveda, M.; Ruiz-Rodríguez, A.; Ferreiro-González, M.; Palma, M. Novel Method Based on Ion Mobility Spectrometry Combined with Machine Learning for the Discrimination of Fruit Juices. Foods 2023, 12, 2536. [Google Scholar] [CrossRef] [PubMed]
- Ruiz, M.J.; Salatti-Dorado, J.A.; Cardador, M.J.; Frizzo, L.; Jordano, R.; Arce, L.; Medina, L.M. Relationship between Volatile Organic Compounds and Microorganisms Isolated from Raw Sheep Milk Cheeses Determined by Sanger Sequencing and GC–IMS. Foods 2023, 12, 372. [Google Scholar] [CrossRef]
- Wu, D.; Xia, Q.; Cheng, H.; Zhang, Q.; Wang, Y.; Ye, X. Changes of Volatile Flavor Compounds in Sea Buckthorn Juice during Fermentation Based on Gas Chromatography–Ion Mobility Spectrometry. Foods 2022, 11, 3471. [Google Scholar] [CrossRef] [PubMed]
- Jiang, H.; Duan, W.; Zhao, Y.; Liu, X.; Wen, G.; Zeng, F.; Liu, G. Development of a Flavor Fingerprint Using HS-GC-IMS for Volatile Compounds from Steamed Potatoes of Different Varieties. Foods 2023, 12, 2252. [Google Scholar] [CrossRef]
- He, J.; Ye, L.; Li, J.; Huang, W.; Huo, Y.; Gao, J.; Liu, L.; Zhang, W. Identification of Ophiopogonis Radix from different producing areas by headspace-gas chromatography-ion mobility spectrometry analysis. J. Food Biochem. 2022, 6, e13850. [Google Scholar] [CrossRef]
- Huang, J.; Ding, S.; Xiong, S.; Liu, Z. The Mediating Effects of Diabetes Distress, Anxiety, and Cognitive Fusion on the Association Between Neuroticism and Fear of Hypoglycemia in Patients with Type 2 Diabetes. Front. Psychol. 2021, 12, 697051. [Google Scholar] [CrossRef]
- Hapunda, G.; Abubakar, A.; Pouwer, F.; Vijver, F. Correlates of fear of hypoglycemia among patients with type 1 and 2 diabetes mellitus in outpatient hospitals in Zambia. Int. J. Diabetes Dev. Ctries. 2020, 4, 619–626. [Google Scholar] [CrossRef]
- Zhang, Q.; Ding, Y.C.; Gu, S.Q.; Zhu, S.C.; Zhou, X.X.; Ding, Y.T. Identification of changes in volatile compounds in dry-cured fish during storage using HS-GC-IMS. Food Res. Int. 2020, 137, 109339. [Google Scholar] [CrossRef] [PubMed]
- Lu, Y. Research on Rapid Identification of TCM Decoction Pieces Based on “Odor” Information Analysis; Chengdu University of Traditional Chinese Medicine: Chengdu, China, 2017. [Google Scholar]
- Liang, T.Y.; Juan, Y.; Hao, D.; Yu, L.M.; Bing, H.; Zeng, X.F. Identification of volatile flavor compounds in Different years of Xinhui orange peel based on GC-IMS. Chin. Condiments 2020, 4, 168–173. [Google Scholar] [CrossRef]
- Yang, B.Y.; Yao, L.; Ji, H.Y.; Jing, Y.Y.; Chen, G.L.; Gang, Z.; Yan, Y.G.; Hu, B.X.; Liang, P. Analysis on the difference of volatile organic compounds VOCs of coltsl nectar before and after moxibustion based on HS-GC-IMS technique. Chin. Herb. Med. 2022, 6, 1854–1861. [Google Scholar]


| Count | Compound | CAS | Molecular Formula | RI | Rt (s) | Dt (RIPrel) | Comment |
|---|---|---|---|---|---|---|---|
| 1 | delta-Decalactone | C705862 | C10H18O2 | 1589.8 | 1686.545 | 1.43476 | |
| 2 | Decanoic acid | C334485 | C10H20O2 | 1516.9 | 1544.131 | 1.56651 | |
| 3 | (E)-2-Undecenal | C53448070 | C11H20O | 1413.4 | 1341.792 | 1.56651 | |
| 4 | (Z)-3-Hexenyl isovalerate | C35154451 | C11H20O2 | 1238.1 | 999.416 | 1.45514 | |
| 5 | 2-Heptylfuran | C3777717 | C11H18O | 1215.1 | 954.414 | 1.40119 | |
| 6 | beta-Citronellol | C106229 | C10H20O | 1205.2 | 935.127 | 1.35083 | |
| 7 | Decanal | C112312 | C10H20O | 1206.2 | 936.964 | 1.55586 | |
| 8 | 2,6-Nonadien-1-ol | C7786449 | C9H16O | 1174.2 | 874.511 | 1.3814 | |
| 9 | Ethyl octanoate | C106321 | C10H20O2 | 1169.3 | 864.971 | 1.47097 | |
| 10 | (E)-2-Nonenal | C18829566 | C9H16O | 1151.6 | 830.265 | 1.40739 | Monomer |
| 11 | (E)-2-Nonenal | C18829566 | C9H16O | 1152.2 | 831.527 | 1.96372 | Dimer |
| 12 | Camphor | C76222 | C10H16O | 1127.7 | 783.568 | 1.34735 | Monomer |
| 13 | Camphor | C76222 | C10H16O | 1128.0 | 784.199 | 1.84539 | Dimer |
| 14 | Phenylethanol | C60128 | C8H10O | 1116.4 | 761.482 | 1.29436 | |
| 15 | Nonanal | C124196 | C9H18O | 1105.5 | 740.324 | 1.49251 | Monomer |
| 16 | Nonanal | C124196 | C9H18O | 1105.5 | 740.324 | 1.93345 | Dimer |
| 17 | Linalool | C78706 | C10H18O | 1099.8 | 729.114 | 1.20504 | |
| 18 | 2-Ethyl-3,5-dimethylpyrazine | C13925070 | C8H12N2 | 1090.6 | 710.618 | 1.23206 | Monomer |
| 19 | (Z)-3-Hexenyl propionate | C33467742 | C9H16O2 | 1091.9 | 713.358 | 1.36119 | |
| 20 | 2-Ethyl-3,5-dimethylpyrazine | C13925070 | C8H12N2 | 1090.6 | 710.618 | 1.73805 | Dimer |
| 21 | 1-Octanol | C111875 | C8H18O | 1087.9 | 705.137 | 1.47079 | |
| 22 | 2,3-Dimethyl-5-ethylpyrazine | C15707343 | C8H12N2 | 1073.2 | 674.995 | 1.24107 | Monomer |
| 23 | 2,3-Dimethyl-5-ethylpyrazine | C15707343 | C8H12N2 | 1073.2 | 674.995 | 1.73655 | Dimer |
| 24 | delta-Hexalactone | C823223 | C6H10O2 | 1083.6 | 696.232 | 1.15249 | |
| 25 | (E)-2-Octenal | C2548870 | C8H14O | 1062.8 | 653.758 | 1.33116 | Monomer |
| 26 | (E)-2-Octenal | C2548870 | C8H14O | 1062.8 | 653.758 | 1.81162 | Dimer |
| 27 | Acetophenone | C98862 | C8H8O | 1061.1 | 650.333 | 1.19153 | |
| 28 | 2,3-Dihydro-4-hydroxy-2,5-dimethyl-3-furanone | C3658773 | C6H8O3 | 1054.9 | 637.628 | 1.19698 | |
| 29 | 2-Ethyl-1-hexanol | C104767 | C8H18O | 1051.3 | 630.284 | 1.4224 | |
| 30 | 2-Phenylacetaldehyde | C122781 | C8H8O | 1036.2 | 599.333 | 1.52577 | Monomer |
| 31 | 2-Phenylacetaldehyde | C122781 | C8H8O | 1036.5 | 599.858 | 1.25729 | Dimer |
| 32 | Methyl heptanoate | C106730 | C8H16O2 | 1030.3 | 587.268 | 1.37645 | |
| 33 | 1.8-Cineole | C470826 | C10H18O | 1023.9 | 574.043 | 1.28893 | Monomer |
| 34 | 1.8-Cineole | C470826 | C10H18O | 1023.9 | 574.043 | 1.72454 | Dimer |
| 35 | Trimethylpyrazine | C14667551 | C7H10N2 | 1016.8 | 559.507 | 1.16495 | |
| 36 | (E,E)-2,4-Heptadienal | C4313035 | C7H10O | 1009.7 | 544.971 | 1.19845 | Monomer |
| 37 | (E,E)-2,4-Heptadienal | C4313035 | C7H10O | 1009.9 | 545.49 | 1.61061 | Dimer |
| 38 | Hexanoic acid | C142621 | C6H12O2 | 1003.3 | 531.992 | 1.31071 | Monomer |
| 39 | Hexanoic acid | C142621 | C6H12O2 | 1003.3 | 531.992 | 1.64244 | Dimer |
| 40 | 2-Pentylfuran | C3777693 | C9H14O | 1006.9 | 539.26 | 1.24872 | |
| 41 | 2,4-Heptadienal | C5910850 | C7H10O | 997.8 | 520.571 | 1.20683 | Monomer |
| 42 | 2,4-Heptadienal | C5910850 | C7H10O | 998.0 | 521.09 | 1.61899 | Dimer |
| 43 | 2,4,6-Trimethylpyridine | C108758 | C8H11N | 995.5 | 516.418 | 1.15322 | |
| 44 | 6-Methyl-5-hepten-2-one | C110930 | C8H14O | 991.0 | 508.935 | 1.17184 | |
| 45 | 2-Octanol | C123966 | C8H18O | 988.4 | 504.689 | 1.44167 | |
| 46 | 1-Octen-3-one | C4312996 | C8H14O | 981.4 | 493.365 | 1.27916 | Monomer |
| 47 | 1-Octen-3-ol | C3391864 | C8H16O | 971.4 | 477.086 | 1.15651 | |
| 48 | 4,5-Dihydro-3(2H)-thiophenone | C1003049 | C4H6OS | 962.1 | 461.87 | 1.19024 | |
| 49 | Benzaldehyde | C100527 | C7H6O | 947.6 | 438.16 | 1.14731 | Monomer |
| 50 | Benzaldehyde | C100527 | C7H6O | 947.8 | 438.514 | 1.46313 | Dimer |
| 51 | (E)-2-Heptenal | C18829555 | C7H12O | 952.2 | 445.591 | 1.66244 | Dimer |
| 52 | 3-Methylbutyl propanoate | C105680 | C8H16O2 | 953.9 | 448.422 | 1.84641 | |
| 53 | Dihydro-5-methyl-2(3H)-furanone | C108292 | C5H8O2 | 940.5 | 426.482 | 1.12278 | |
| 54 | Methyl hexanoate | C106707 | C7H14O2 | 928.4 | 406.869 | 1.28653 | Monomer |
| 55 | Methyl hexanoate | C106707 | C7H14O2 | 928.8 | 407.425 | 1.67625 | Dimer |
| 56 | 2,3-Dimethylpyrazine | C5910894 | C6H8N2 | 925.4 | 401.866 | 1.12795 | |
| 57 | 2,5-Dimethylpyrazine | C123320 | C6H8N2 | 915.3 | 385.36 | 1.11464 | |
| 58 | Ethylpyrazine | C13925003 | C6H8N2 | 919.9 | 392.988 | 1.15016 | |
| 59 | 2,6-Dimethylpyrazine | C108509 | C6H8N2 | 915.2 | 385.167 | 1.14652 | |
| 60 | 2-Butoxyethanol | C111762 | C6H14O2 | 907.1 | 372.015 | 1.1975 | |
| 61 | (E,E)-2,4-Hexadienal | C142836 | C6H8O | 905.1 | 368.815 | 1.12104 | |
| 62 | Heptanal | C111717 | C7H14O | 901.9 | 363.483 | 1.35407 | Monomer |
| 63 | Heptanal | C111717 | C7H14O | 901.9 | 363.483 | 1.6939 | Dimer |
| 64 | 2-Acetylfuran | C1192627 | C6H6O2 | 903.6 | 366.327 | 1.44145 | |
| 65 | Pentanoic acid | C109524 | C5H10O2 | 897.5 | 356.374 | 1.23876 | Monomer |
| 66 | Pentanoic acid | C109524 | C5H10O2 | 897.3 | 356.018 | 1.51063 | Dimer |
| 67 | 2-Heptanone | C110430 | C7H14O | 892.9 | 348.909 | 1.26061 | Monomer |
| 68 | Cyclohexanone | C108941 | C6H10O | 892.7 | 348.553 | 1.46815 | |
| 69 | 2-Heptanone | C110430 | C7H14O | 893.4 | 349.62 | 1.62351 | Dimer |
| 70 | (Z)-4-Heptenal | C6728310 | C7H12O | 898.6 | 358.151 | 1.14288 | |
| 71 | gamma-Butyrolactone | C96480 | C4H6O2 | 887.8 | 343.221 | 1.08341 | Monomer |
| 72 | gamma-Butyrolactone | C96480 | C4H6O2 | 887.8 | 343.221 | 1.29945 | Dimer |
| 73 | 1-Hexanol | C111273 | C6H14O | 878.4 | 333.623 | 1.32615 | Monomer |
| 74 | 1-Hexanol | C111273 | C6H14O | 878.8 | 333.979 | 1.64535 | Dimer |
| 75 | 2-Methyl-3-furanthiol | C28588741 | C5H6OS | 866.6 | 321.537 | 1.13803 | |
| 76 | Isovaleric acid | C503742 | C5H10O2 | 857.6 | 312.295 | 1.2157 | |
| 77 | (E)-2-Hexen-1-ol | C928950 | C6H12O | 862.5 | 317.271 | 1.5434 | |
| 78 | (E)-2-Hexenal | C6728263 | C6H10O | 843.7 | 298.076 | 1.17808 | Monomer |
| 79 | (E)-2-Hexenal | C6728263 | C6H10O | 844.0 | 298.431 | 1.50942 | Dimer |
| 80 | Ethyl 2-methylbutanoate | C7452791 | C7H14O2 | 849.3 | 303.763 | 1.22784 | |
| 81 | 2-Methyl-2-pentenal | C623369 | C6H10O | 826.7 | 280.657 | 1.16109 | Monomer |
| 82 | 2-Methyl-2-pentenal | C623369 | C6H10O | 826.7 | 280.657 | 1.49486 | Dimer |
| 83 | Furfural | C98011 | C5H4O2 | 819.7 | 273.548 | 1.08098 | Monomer |
| 84 | Furfural | C98011 | C5H4O2 | 819.7 | 273.548 | 1.33101 | Dimer |
| 85 | 2-Hexanone | C591786 | C6H12O | 809.0 | 262.528 | 1.19143 | Monomer |
| 86 | Dihydro-2-methyl-3(2H)furanone | C3188009 | C5H8O2 | 807.9 | 261.462 | 1.42567 | |
| 87 | 2-Hexanone | C591786 | C6H12O | 809.7 | 263.239 | 1.50092 | Dimer |
| 88 | Butyl acetate | C123864 | C6H12O2 | 805.1 | 258.618 | 1.62836 | |
| 89 | 4-Methyl-3-penten-2-one | C141797 | C6H10O | 796.4 | 249.731 | 1.44267 | |
| 90 | 1-Pentanol | C71410 | C5H12O | 767.6 | 225.559 | 1.51549 | |
| 91 | 3-Methyl-2-butenal | C107868 | C5H8O | 775.7 | 231.246 | 1.35164 | |
| 92 | (E)-2-Pentenal | C1576870 | C5H8O | 745.3 | 209.918 | 1.35164 | |
| 93 | 3-Hydroxy-2-butanone | C513860 | C4H8O2 | 728.2 | 197.93 | 1.07394 | Monomer |
| 94 | 1-Penten-3-one | C1629589 | C5H8O | 705.6 | 182.083 | 1.32811 | |
| 95 | 2-Pentanone | C107879 | C5H10O | 692.3 | 172.762 | 1.3669 | |
| 96 | Propanoic acid | C79094 | C3H6O2 | 701.1 | 178.976 | 1.27192 | |
| 97 | 1-Butanol | C71363 | C4H10O | 662.0 | 160.022 | 1.37359 | |
| 98 | 2,3-Pentadione | C600146 | C5H8O2 | 651.4 | 155.983 | 1.29466 | |
| 99 | 3-Methylbutanal | C590863 | C5H10O | 638.4 | 151.011 | 1.19835 | |
| 100 | Acetic acid | C64197 | C2H4O2 | 634.4 | 149.458 | 1.15019 | |
| 101 | Butanal | C123728 | C4H8O | 620.6 | 144.175 | 1.1114 | |
| 102 | 2-Butanone | C78933 | C4H8O | 589.7 | 132.368 | 1.24517 | |
| 103 | Acetone | C67641 | C3H6O | 525.5 | 107.821 | 1.1221 | |
| 104 | 1-Propanol | C71238 | C3H8O | 571.8 | 125.532 | 1.1114 | |
| 105 | Ethyl acetate | C141786 | C4H8O2 | 619.7 | 143.865 | 1.3348 | |
| 106 | 2-Butanol | C78922 | C4H10O | 601.9 | 137.029 | 1.33747 | |
| 107 | 2-Methylpropanoic acid | C79312 | C4H8O2 | 788.3 | 241.431 | 1.36155 | |
| 108 | 3-Hydroxy-2-butanone | C513860 | C4H8O2 | 729.9 | 199.173 | 1.32944 | Dimer |
| 109 | Pentanal | C110623 | C5H10O | 712.6 | 187.055 | 1.20638 | |
| 110 | Propanal | C123386 | C3H6O | 517.3 | 104.714 | 1.15822 | |
| 111 | 3-Methyl-1-pentanol | C589355 | C6H14O | 853.3 | 307.925 | 1.30403 | |
| 112 | 2,6-Dimethylpyridine | C108485 | C7H9N | 884.9 | 340.195 | 1.45516 | |
| 113 | gamma-Decalactone | C706149 | C10H18O2 | 2242.0 | 2960.963 | 1.45582 | |
| 114 | beta-Caryophyllene | C87445 | C15H24 | 1960.3 | 2410.574 | 1.45774 | |
| 115 | (E,E)-alpha-Farnesene | C502614 | C15H24 | 1837.5 | 2170.534 | 1.44026 | |
| 116 | Geranyl acetate | C105873 | C12H20O2 | 1440.1 | 1394.063 | 1.22263 | |
| 117 | (E,E)-2,4-Decadienal | C25152845 | C10H16O | 1317.5 | 1154.45 | 1.39648 | |
| 118 | Thymol | C89838 | C10H14O | 1294.4 | 1109.284 | 1.24831 | |
| 119 | Geraniol | C106241 | C10H18O | 1268.2 | 1058.254 | 1.21258 | |
| 120 | Nerol | C106252 | C10H18O | 1228.2 | 980.031 | 1.22169 | |
| 121 | alpha-Terpineol | C98555 | C10H18O | 1186.1 | 897.749 | 1.21972 | Monomer |
| 122 | alpha-Terpineol | C98555 | C10H18O | 1186.4 | 898.355 | 1.30566 | Dimer |
| 123 | alpha-Terpineol | C98555 | C10H18O | 1186.4 | 898.355 | 1.78253 | Trimer |
| 124 | 4-Terpinenol | C562743 | C10H18O | 1170.9 | 868.05 | 1.21804 | |
| 125 | Citronelal | C106230 | C10H18O | 1158.8 | 844.413 | 1.21804 | |
| 126 | Methyl salicylate | C119368 | C8H8O3 | 1174.9 | 875.93 | 1.1658 | |
| 127 | 2,3-Diethyl-5-methylpyrazine | C18138040 | C9H14N2 | 1138.3 | 804.41 | 1.27364 | |
| 128 | Linalool | C78706 | C10H18O | 1107.9 | 745.013 | 1.21804 | |
| 129 | (Z)-6-Nonenal | C2277192 | C9H16O | 1093.7 | 716.947 | 1.16944 | |
| 130 | Linalool oxide | C60047178 | C10H18O2 | 1083.0 | 695.065 | 1.2611 | |
| 131 | 2-Methylphenol | C95487 | C7H8O | 1067.1 | 662.538 | 1.11611 | |
| 132 | beta-Ocimene | C13877913 | C10H16 | 1033.1 | 592.989 | 1.68091 | |
| 133 | Limonene | C138863 | C10H16 | 1025.8 | 578.047 | 1.22338 | |
| 134 | Methyl 3-(methylthio)propionate | C13532188 | C5H10O2S | 1025.0 | 576.309 | 1.60088 | |
| 135 | Octanal | C124130 | C8H16O | 1010.9 | 547.468 | 1.42572 | |
| 136 | alpha-Terpinene | C99865 | C10H16 | 1011.2 | 548.163 | 1.7398 | |
| 137 | (Z)-3-Hexenyl acetate | C3681718 | C8H14O2 | 1009.1 | 543.875 | 1.78589 | |
| 138 | Dimethyl trisulfide | C3658808 | C2H6S3 | 987.7 | 503.647 | 1.29904 | |
| 139 | 1-Heptanol | C111706 | C7H16O | 985.3 | 499.658 | 1.40408 | Monomer |
| 140 | 1-Octen-3-one | C4312996 | C8H14O | 981.8 | 494.006 | 1.67918 | Dimer |
| 141 | (E)-2-Heptenal | C18829555 | C7H12O | 952.9 | 446.797 | 1.25569 | Monomer |
| 142 | beta-Pinene | C127913 | C10H16 | 971.6 | 477.383 | 1.22734 | |
| 143 | 1-Heptanol | C111706 | C7H16O | 985.5 | 499.99 | 1.77422 | Dimer |
| 144 | 3-Hepten-2-one | C1119444 | C7H12O | 935.4 | 418.205 | 1.204 | |
| 145 | alpha-Pinene | C80568 | C10H16 | 939.9 | 425.519 | 1.30737 | Monomer |
| 146 | alpha-Pinene | C80568 | C10H16 | 940.3 | 426.184 | 1.68418 | Dimer |
| 147 | 2-Methylbutanoic acid | C116530 | C5H10O2 | 870.2 | 325.194 | 1.22302 | |
| 148 | Isomenthone | C491076 | C10H18O | 1149.4 | 826.025 | 1.33262 | |
| 149 | Hexanal | C66251 | C6H12O | 799.2 | 252.51 | 1.56289 |
Disclaimer/Publisher’s Note: The statements, opinions and data contained in all publications are solely those of the individual author(s) and contributor(s) and not of MDPI and/or the editor(s). MDPI and/or the editor(s) disclaim responsibility for any injury to people or property resulting from any ideas, methods, instructions or products referred to in the content. |
© 2024 by the authors. Licensee MDPI, Basel, Switzerland. This article is an open access article distributed under the terms and conditions of the Creative Commons Attribution (CC BY) license (https://creativecommons.org/licenses/by/4.0/).
Share and Cite
Mao, Y.; Zhu, L.; Fu, F.; Zhu, L.; Chen, J.; Liu, J.; Huang, D.; Lei, C. A Comparison of Volatile Organic Compounds in Puerariae Lobatae Radix and Puerariae Thomsonii Radix Using Gas Chromatography–Ion Migration Spectrometry. Separations 2024, 11, 31. https://doi.org/10.3390/separations11010031
Mao Y, Zhu L, Fu F, Zhu L, Chen J, Liu J, Huang D, Lei C. A Comparison of Volatile Organic Compounds in Puerariae Lobatae Radix and Puerariae Thomsonii Radix Using Gas Chromatography–Ion Migration Spectrometry. Separations. 2024; 11(1):31. https://doi.org/10.3390/separations11010031
Chicago/Turabian StyleMao, Yingchao, Lingfeng Zhu, Fuhua Fu, Lijun Zhu, Jiajing Chen, Jing Liu, Dan Huang, and Chang Lei. 2024. "A Comparison of Volatile Organic Compounds in Puerariae Lobatae Radix and Puerariae Thomsonii Radix Using Gas Chromatography–Ion Migration Spectrometry" Separations 11, no. 1: 31. https://doi.org/10.3390/separations11010031
APA StyleMao, Y., Zhu, L., Fu, F., Zhu, L., Chen, J., Liu, J., Huang, D., & Lei, C. (2024). A Comparison of Volatile Organic Compounds in Puerariae Lobatae Radix and Puerariae Thomsonii Radix Using Gas Chromatography–Ion Migration Spectrometry. Separations, 11(1), 31. https://doi.org/10.3390/separations11010031


