Article

Air-Purge Regenerative Direct Air Capture Using an Externally Heated and Cooled Temperature-Swing Adsorber Packed with Solid Amine

1
Graduate School of Natural Science and Technology, Kanazawa University, Kanazawa 920-1192, Japan
2
Faculty of Mechanical Engineering, Institute of Science and Engineering, Kanazawa University, Kanazawa 920-1192, Japan
3
Institute for Frontier Science Initiative, Kanazawa University, Kanazawa 920-1192, Japan
*
Author to whom correspondence should be addressed.
Separations 2023, 10(7), 415; https://doi.org/10.3390/separations10070415
Submission received: 10 June 2023 / Revised: 13 July 2023 / Accepted: 19 July 2023 / Published: 21 July 2023
(This article belongs to the Topic Carbon Capture Science & Technology (CCST))

Abstract

:
CO2 capture from air is crucial in achieving negative emissions. Based on conventional or newly developed high-enriching processes, we investigated the rough enrichment of CO2 from air via an externally heated or cooled adsorber (temperature-swing adsorption, TSA), along with air purge using double-pipe heat exchangers packed with low-volatility polyamine-loaded silica. A simple adsorption–desorption cycle was attempted in a TSA experiment, by varying the temperature from 20 °C to 60 °C using moist air, yielding an average CO2 concentration of product gas that was ~17 times higher than the feed air, but the CO2 recovery rate was poor. A double-step adsorption process was applied to increase CO2 adsorption and recovery simultaneously. In this process, substantial-CO2-concentration gas was used as the product gas, and the remaining gas was used as the reflux feed gas for adsorber. This method can provide a product gas with ~100 times higher CO2 concentration than raw gas, with a recovery ratio ~60% under the shortest adsorption/desorption time and the longest refluxing time of cycle operation. Therefore, the refluxing step significantly helped to enhance CO2 capture via adsorption from elevated-CO2-concentration recirculating gas. With this CO2 concentration, the product gas can serve as the CO2 supplement for the growing plant processes.

1. Introduction

The use of fossil fuels in various applications has increased the concentration of CO2 in atmospheric air from 325 to 410 parts per million (ppm) over the last 50 years. Consequently, in the coming decades, global temperature is expected to be 1.5 °C higher than pre-industrial levels [1,2]. To combat this global concern, governments are actively implementing policies that are aimed at limiting CO2 outflow and striving for net-zero CO2 emissions. Moreover, approximately 800 GtCO2 emissions need to be avoided between now and 2050, and 120–160 GtCO2 will have to be sequestered to achieve the said emission reductions during this period [3]. Until recently, only emissions from industries that release high CO2 concentrations were considered for CO2 capture. However, their emissions account for only 50% of the total amount of greenhouse gases emitted into the atmosphere. The remaining proportion consists of distributed emissions, including those from vehicle exhaust, agriculture, and habitation [4].
Capturing CO2 directly from the ambient air (direct air capture, DAC) is a widely used process for solving the issue of distributed CO2 emissions and managing CO2 buildup from past outgassing. The main challenge for capturing CO2 at ultralow concentrations is energy consumption. Temperature-swing adsorption (TSA) using solid adsorbents is a promising technique to overcome this challenge, as it can operate with a low-temperature heat source using either solar or waste heat energy [5]. Furthermore, this process has substantially low environmental impacts.
To reduce the energy required for CO2 capture from air, there is a need to enhance natural-CO2 removal techniques. Afforestation and reforestation are simple methods for removing CO2 from air, but they cannot handle the rising anthropogenic emissions. Enhanced weathering and ocean alkalinity enhancement can also be used to reduce CO2 concentrations in atmospheric air. However, these methods are rarely implemented, due to their poor commercial viability and potential risks [6]. Bioenergy with carbon capture and storage (BECCS) has been introduced for CO2 emission reduction. However, enhancing BECCS plants requires large amounts of land and water and, thus, may affect food security [7]. In this context, improving the CO2 separation performance of the TSA process, operated with a low-grade heat source, can contribute to energy savings in CO2 emission treatment.
In the TSA process, the trade-off between the regeneration temperature of the adsorbent and separation performance is a major challenge. To overcome this challenge, numerous studies have focused on improving adsorbent capacity. Among various adsorbents, solid amine adsorbents are viable for DAC, due to their comparatively high specific CO2 capacities and adsorption rates at ultradilute CO2 concentrations [8]. Moreover, a specific system of adsorption processes and operational conditions are required for the optimum performance of the adsorbents. Nevertheless, only a few studies have considered the design of adsorption process and operational conditions of TSA in the DAC field.
Generally, air or inert-gas purge is applied for regenerating the adsorbent process in conventional or direct-heating TSA. In such processes, a large amount of purge gas is supplied to the adsorber to increase the temperature of adsorbent within a short time, thereby decreasing the CO2 concentration at the regeneration outlet. To reduce the flow rate of the purge and cycle time, electric-swing adsorption (ESA), temperature-vacuum-swing adsorption (TVSA), and indirect heating using hollow-fiber adsorbents or heat exchangers have been investigated [9,10,11,12]. ESA and TVSA cannot be used with low-grade heat sources, as they consume large amounts of electricity during the heating and depressurizing processes. Furthermore, using hollow-fiber adsorbents in the TSA process lowers the cycle time to less than 4 min [13]. However, the pressure drop of a hollow-fiber adsorbent bed is higher than that of a compact heat exchanger; hence, preparing the adsorbent bed requires expertise [14]. A simple way to prepare adsorbers is to use heat exchangers packed with an adsorbent for the indirect heating and cooling of TSA; this can reduce the adsorber heating time and the amount of purge gas.
In addition to improving the heat transfer in the adsorber, multiple cycle steps and operating multiple adsorbers are employed to improve the TSA performance for regeneration at low temperatures. Ntiamoah et al. applied a three-step cycle, including adsorption, hot-gas purge, and cooling steps, to a single adsorber to separate CO2 from flue gas [15]. They achieved more than a 91% CO2 concentration of product gas and a maximum CO2 recovery of 55.5%, using a regeneration temperature of 150 °C. Masuda et al. used two adsorbers for a two-stage CO2 separation process from post-combustion [16]. Air purge under a regeneration temperature of 80 °C yielded a maximum CO2 concentration of 95% in the product gas and an overall recovery ratio of 60%. Multiple steps of adsorption processes under swing temperatures have been reported in the DAC [17,18]. However, these studies employed a vacuum step to improve the separation performance. To date, applying air purge for the regeneration process in the multiple-stage process using multiple adsorbers for CO2 capture from the air has not been studied.
To develop a system for adsorption processes using low-grade heat sources for DAC, this study aimed to investigate the design of cycle operations required for CO2 separation from wet ambient air, using an externally heated and cooled TSA-packed adsorbent in a heat exchanger. Here, a double-tube heat exchanger filled with a functionalized polyamine adsorbent, which has not yet been commercialized, was used as the adsorber. This process improved the CO2 separation from wet air via a regeneration process at a temperature of 60 °C with air purge. Regardless of the vacuum processes, multistage processes and multiple adsorbers were combined. This study investigated (i) the difference in separation performance between a simple adsorption–desorption process and multistage processes and (ii) the effect of different durations of cycle steps, feed gas, and purge gas on CO2 purity and the recovery ratio. The design of the TSA cycle in this study would produce the product gas, which could be used for microbial and algae cultivation for food and fuel and in greenhouses.

2. Experimental Methods

2.1. Adsorbent Packed Column

The studied material was a functionalized polyamine adsorbent derived from a previous study [19]. The adsorbent particle had a diameter of approximately 0.6 mm and could be regenerated at a moderate temperature of 60 °C, which is the maximum regenerated temperature that the adsorbent can withstand.
Figure 1 shows a schematic of the reactor. The adsorbent was packed in the copper tube serving as the inner pipe of the double-pipe heat exchanger for applying both sorption steps. Glass wool was inserted into both ends of the adsorbent section to provide a flexible space for changing the adsorbent volume. A filter was placed outside each piece of glass wool to stabilize the position of the adsorbent. Indirect heat transfer was applied during adsorption and desorption by circulating cooling and hot water, respectively. The feed and purge gases had opposite directions, and the desorption outlet was placed at the bottom of the reactor. If the regeneration outlet gas contains a large amount of water vapor, it tends to condense. Setting the desorption outlet at the bottom of the adsorber prevents condensate from flowing back into the adsorber, because the condensate is discharged by gravity. Moreover, an electric heating cable was applied to avoid this condensation at the regeneration outlet.

2.2. Breakthrough Curves of the Adsorbent

Breakthrough curve experiments were conducted to determine the effectiveness of the adsorption and desorption processes. In the experiments, 1.36 g (2.1 mL) of the adsorbent was packed in a copper tube (outer diameter: 6.35 mm; inner diameter: 4.57 mm), which served as the inner pipe of the double-pipe heat exchanger. A standard gas with a CO2 concentration of 400 ppm was used as the feed gas at a flow rate of 3.9 L STP/min for adsorption at 20 °C. Desorption was performed at 60 °C with a purge-air flow rate of 0.04 L STP/min. The dew-point temperature (Td) of both inlet gases was controlled at −50 °C (dry condition), −5 °C, 0 °C, 5 °C, and 8 °C.
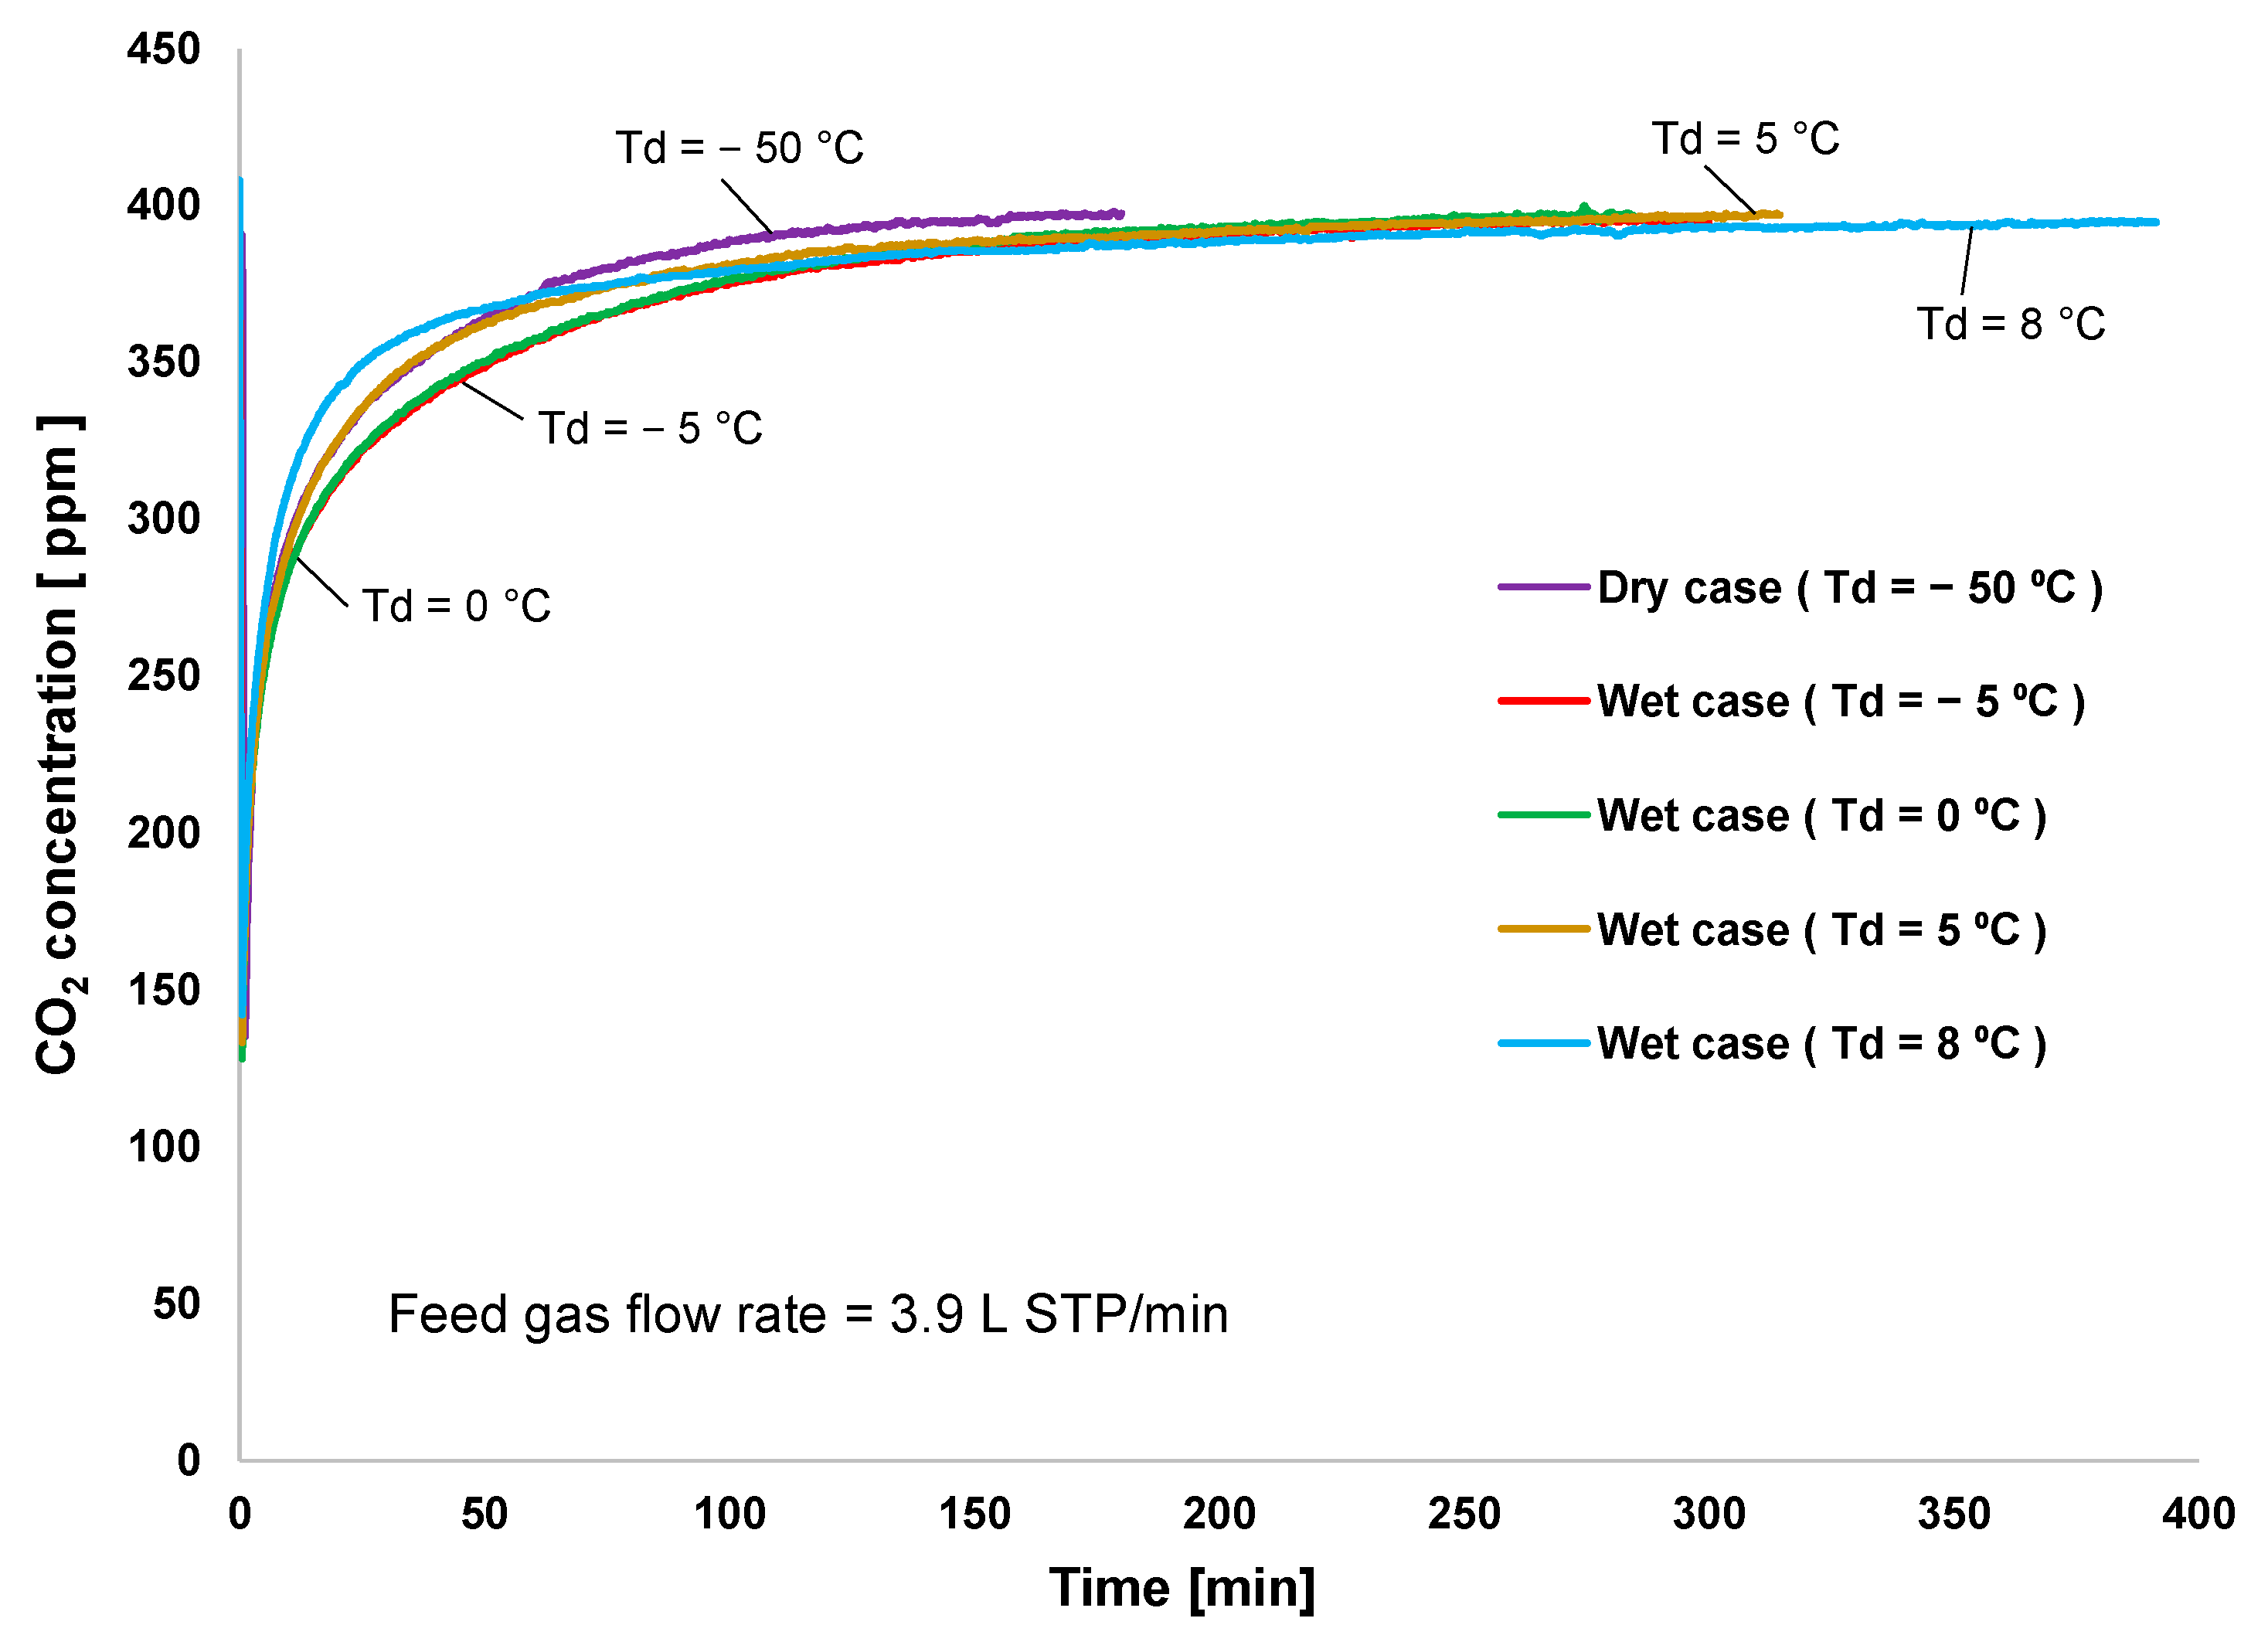
Figure 2 shows the CO2 adsorption rate at different levels of humidity applied to the feed gas. Additionally, the packed adsorbent was tested, starting with a dry condition and followed by a wet condition with Td = 5 °C, 0 °C, 8 °C, and −5 °C. The adsorption breakthrough started immediately after the completion of the preregeneration process. Since the adsorbent temperature was controlled by cooling and heating water, it was stabilized for only 1 min. The result indicated that low-humidity condition significantly increased the CO2 adsorption rate during the first 100 min, as observed at Td of −5 °C and 0 °C. However, high humidity (the case of Td = 8 °C) was responsible for the lowest adsorption rate in the first 60 min and longest adsorption cycle time. This indicated that CO2/H2O adsorption selectivity decreases when moisture is oversupplied to the feed gas. However, because amine adsorbents increased CO2 adsorption capacity under wet conditions, although there was no competition between CO2 and water adsorption under dry conditions, the dry adsorption was saturated first.
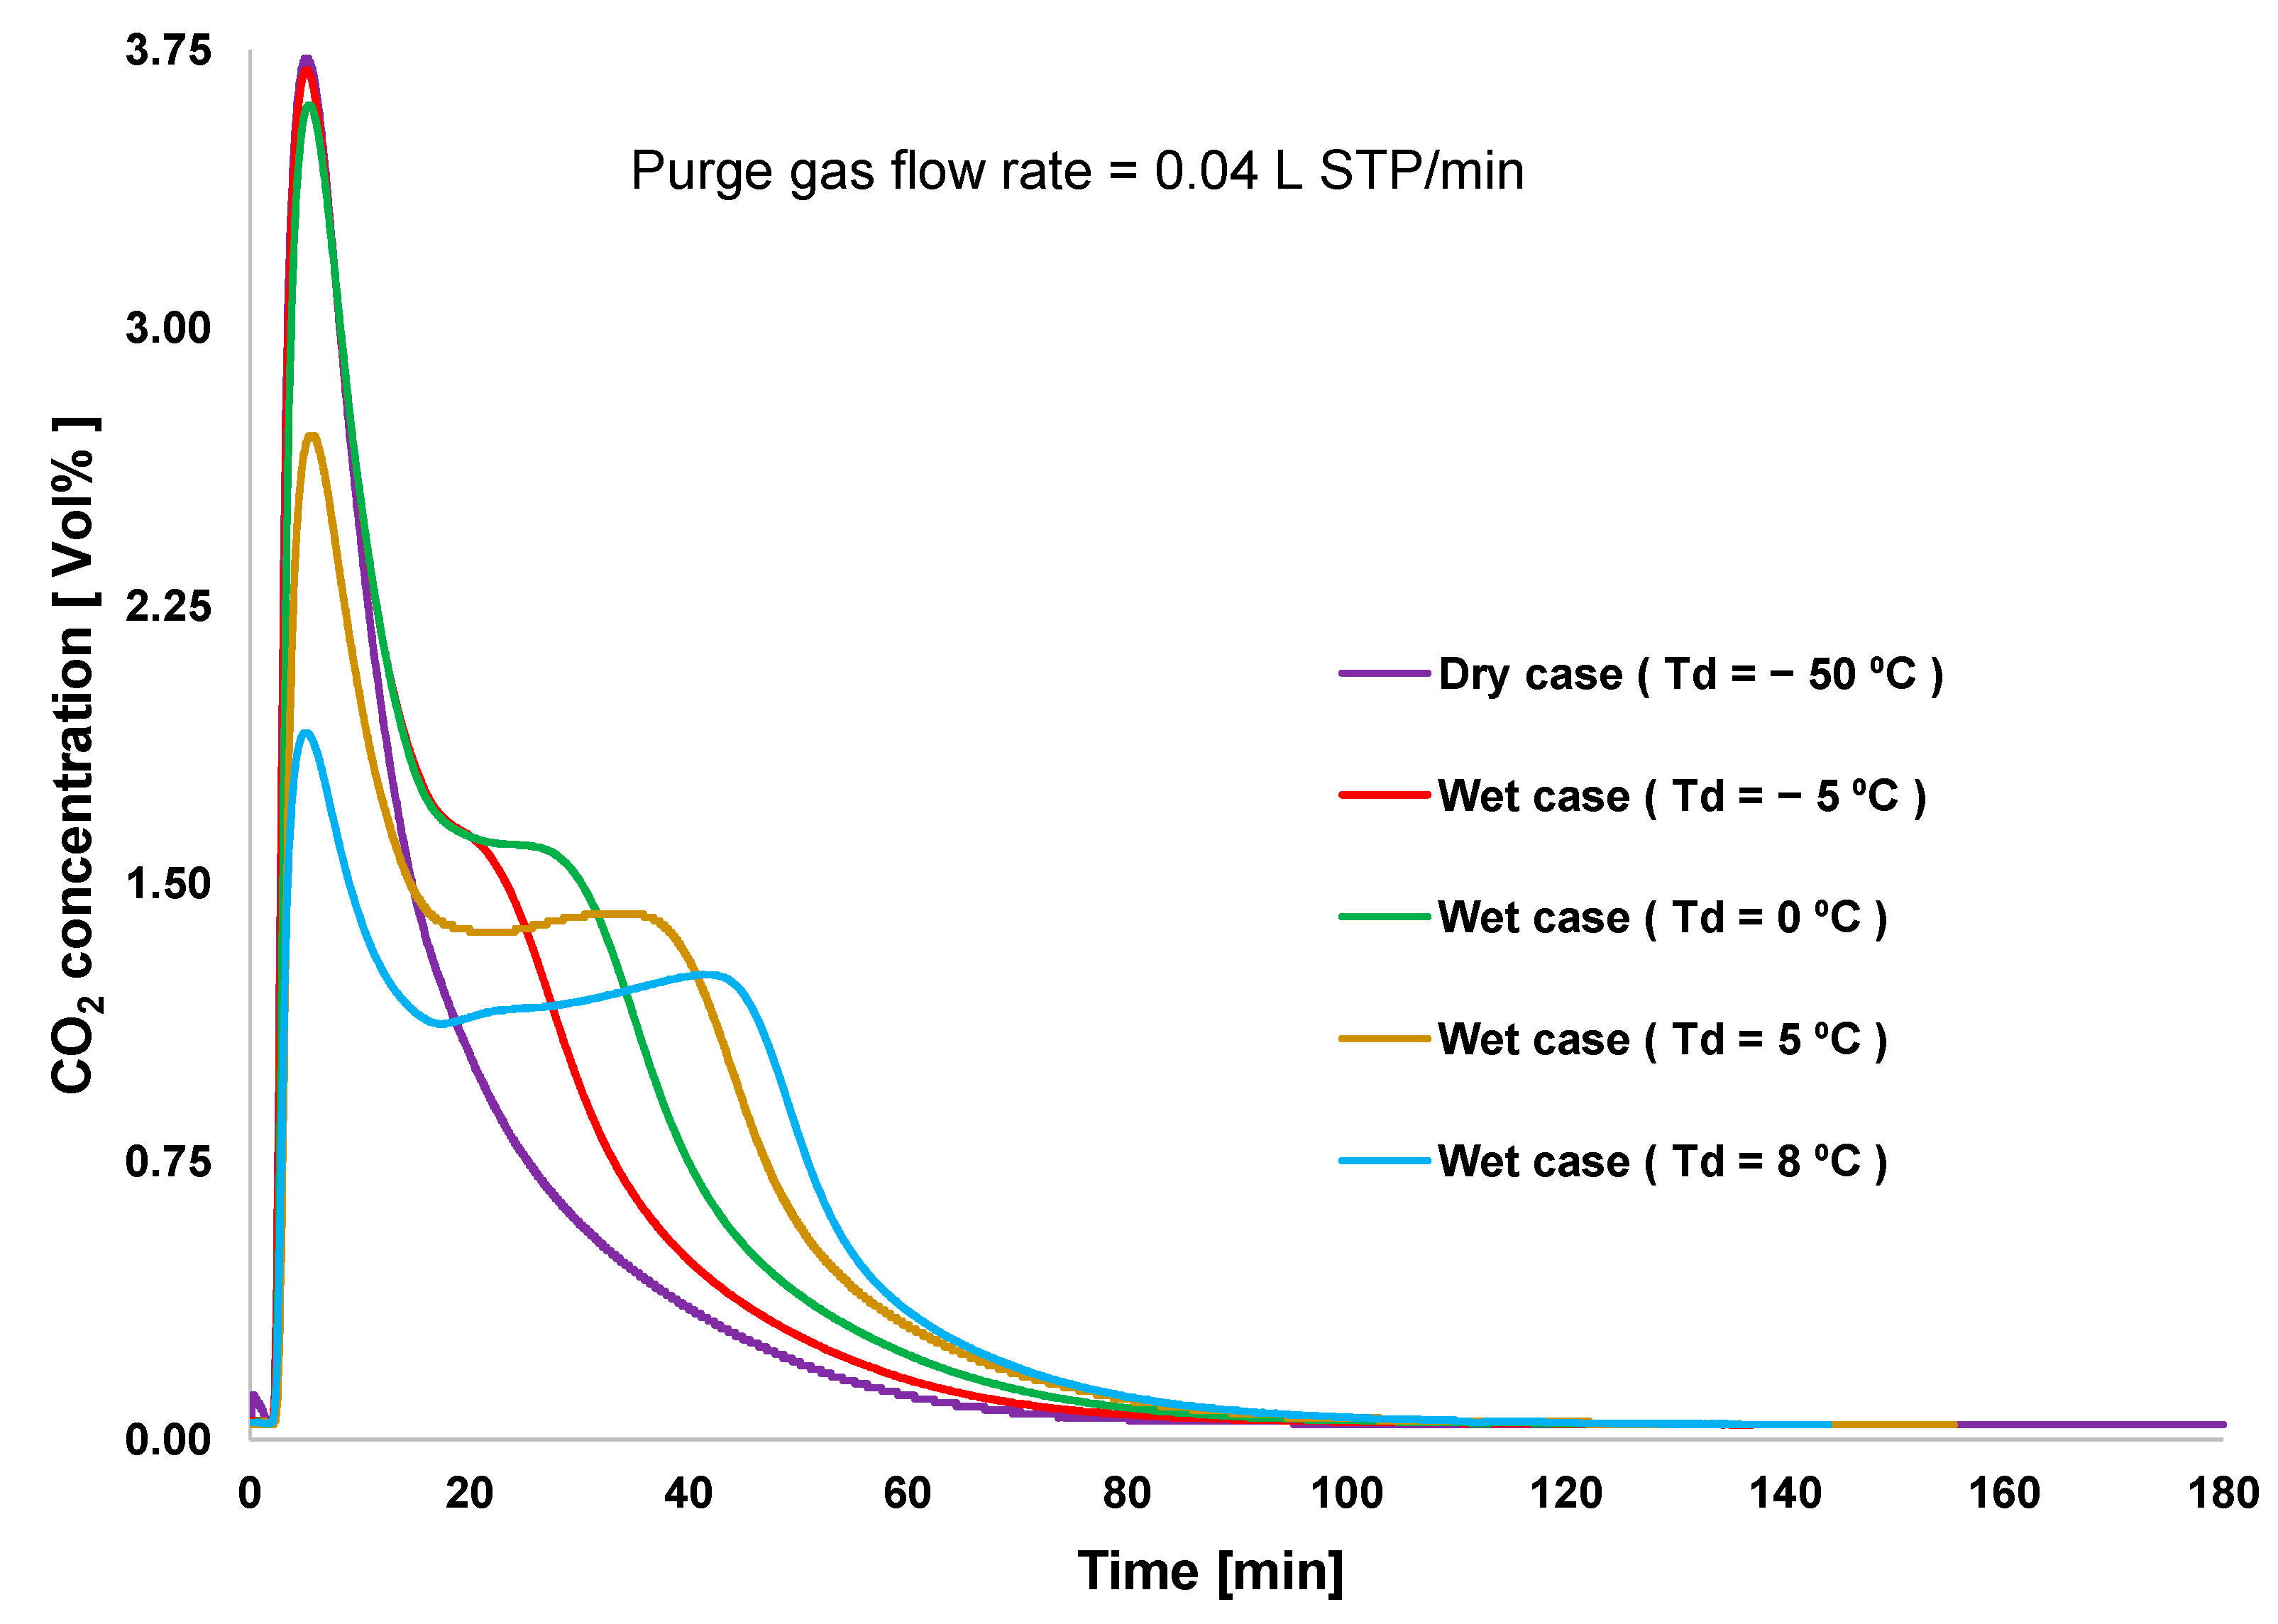
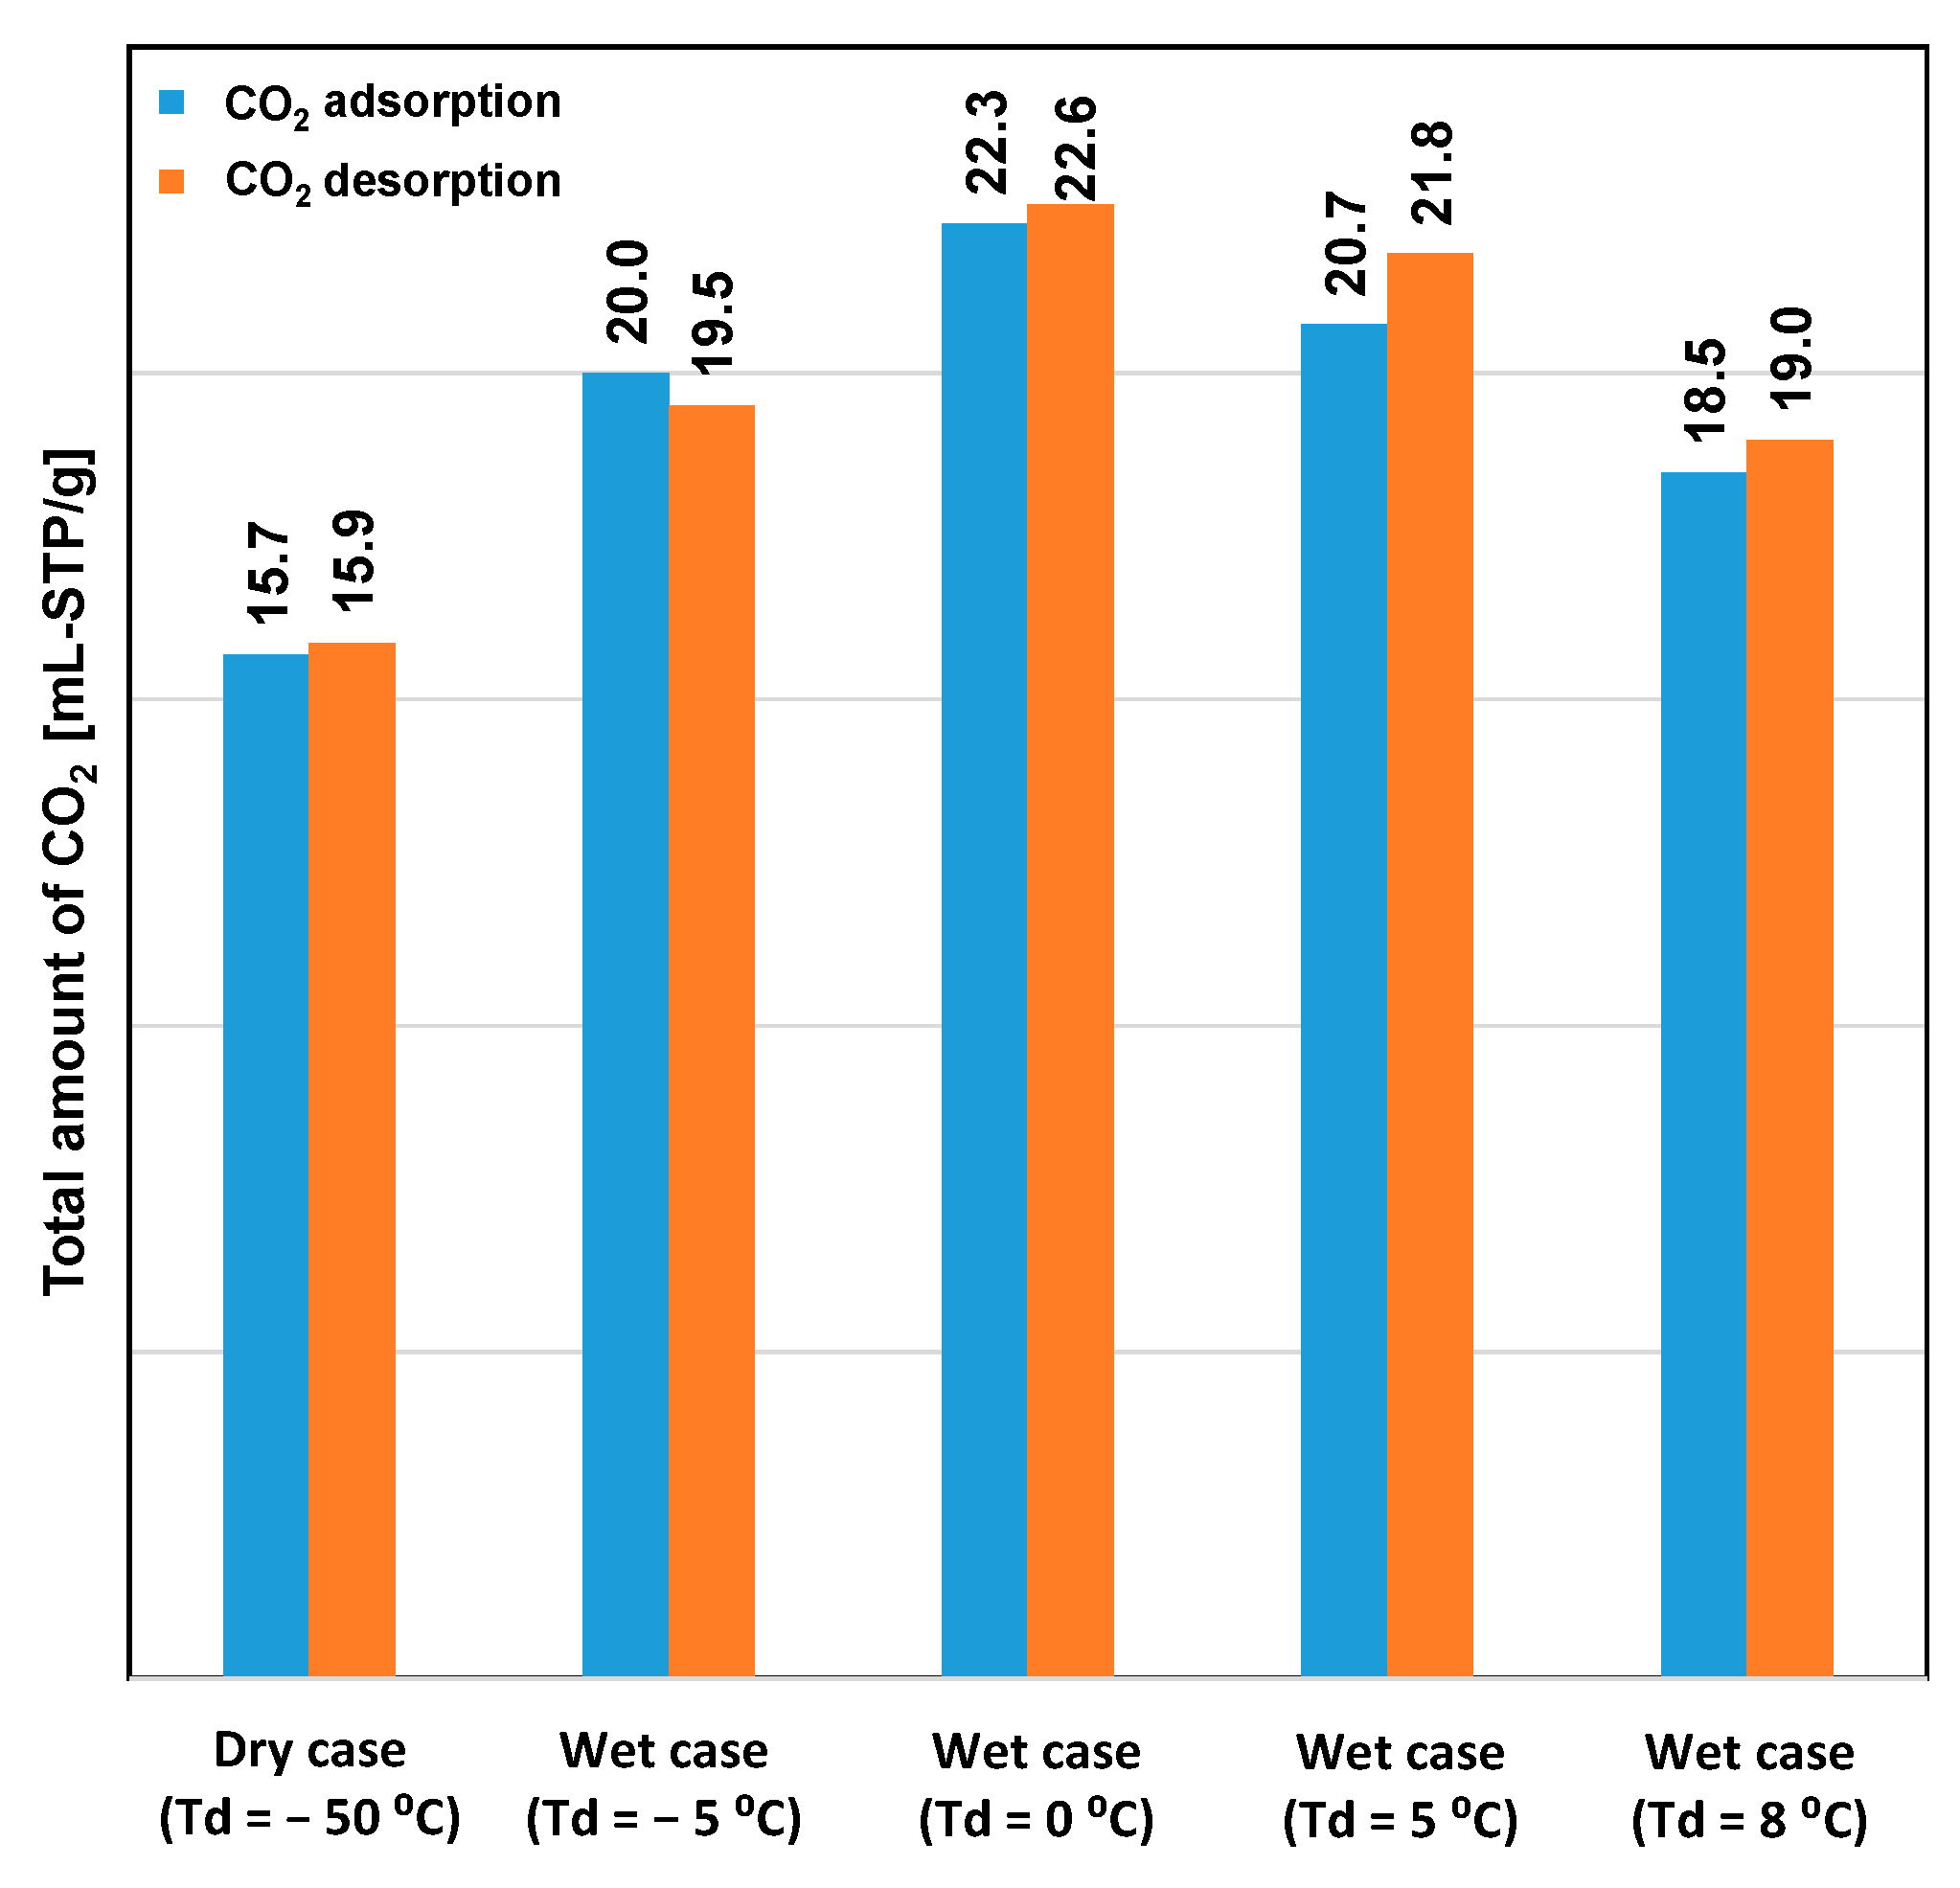
Figure 3 shows the performance of CO2 desorption breakthroughs for the various adsorption cases. Desorption occurred immediately after the saturation of CO2 adsorption. The highest CO2 desorption rate was obtained under dry conditions, although the lowest amount of CO2 uptake was also obtained under this condition, as shown in Figure 4. Even though high humidity in the feed gas reduced the rate of CO2 adsorption, the overall amount of adsorbed CO2 remained significantly higher than that under dry conditions. This indicated that amine reacts with CO2 to form carbamates, and these carbamates continue to react with CO2 to form bicarbonate species in the presence of moisture. However, high humidity causes the oversaturation of the materials with water, which could block CO2 access to the amine group [20]. Hence, the case of Td = 0 °C showed the highest adsorption capacity. The error between the amounts of CO2 adsorbed and desorbed for each case was smaller than 5%. Furthermore, this error was caused by the slight variations in the CO2 concentration in the feed gas and by error in converting data between the data logger and CO2 analyzer. The total amount of CO2 adsorbed did not decrease according to the sequence of the experiment. This revealed that the variation of the amount of CO2 adsorbed is completely influenced by the humidity conditions, rather than by amine oxidation or degradation of the adsorbent.
Figure 3 shows that the absence of moisture allows adsorbents to desorb CO2 rapidly, because the supplied heat is consumed only for the CO2 desorption process. The second peak in the desorption curve was observed in all wet conditions. An increase in the humidity of the feed gas reduced the first peak and increased the second peak of the desorption curve. The heat supplied for the desorption process was partially consumed during water desorption, resulting in the reduced first peak of the CO2 desorption rate. An increase in the second peak of CO2 desorption was attributed to the completion of the decomposition of bicarbonate species.

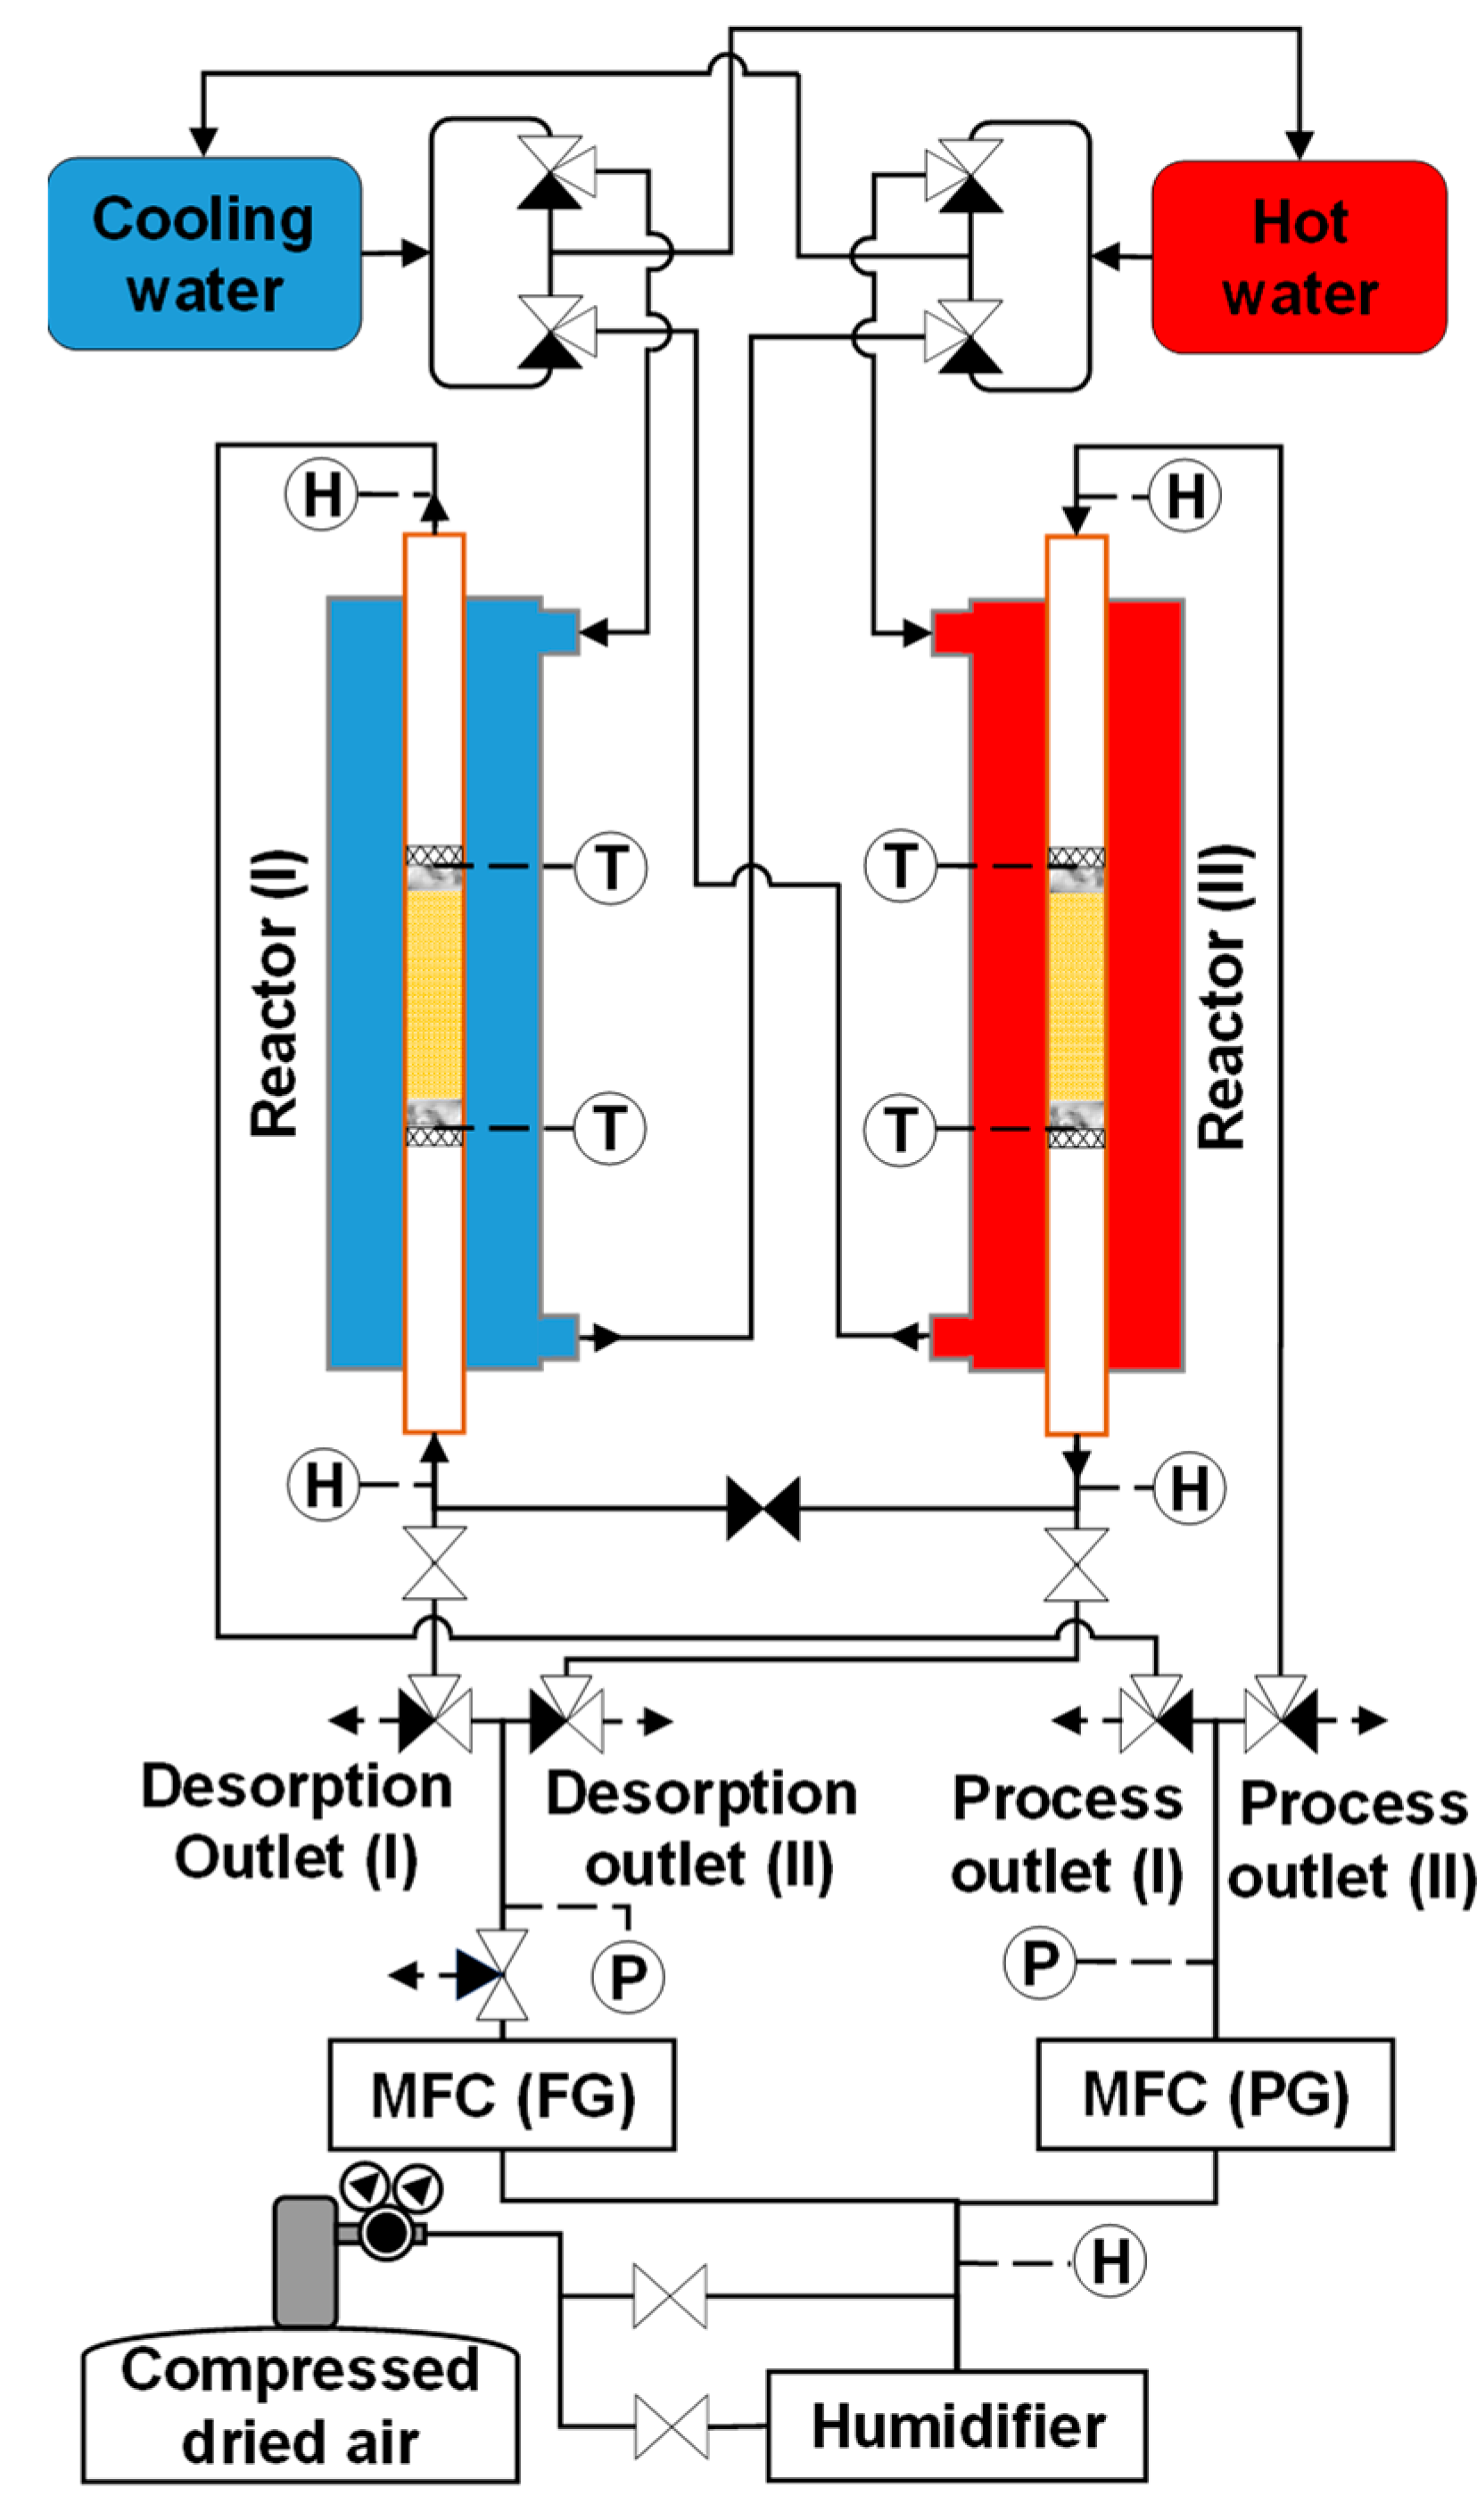
2.3. Experimental Apparatus and Conditions for Simple Adsorption–Desorption Cycle

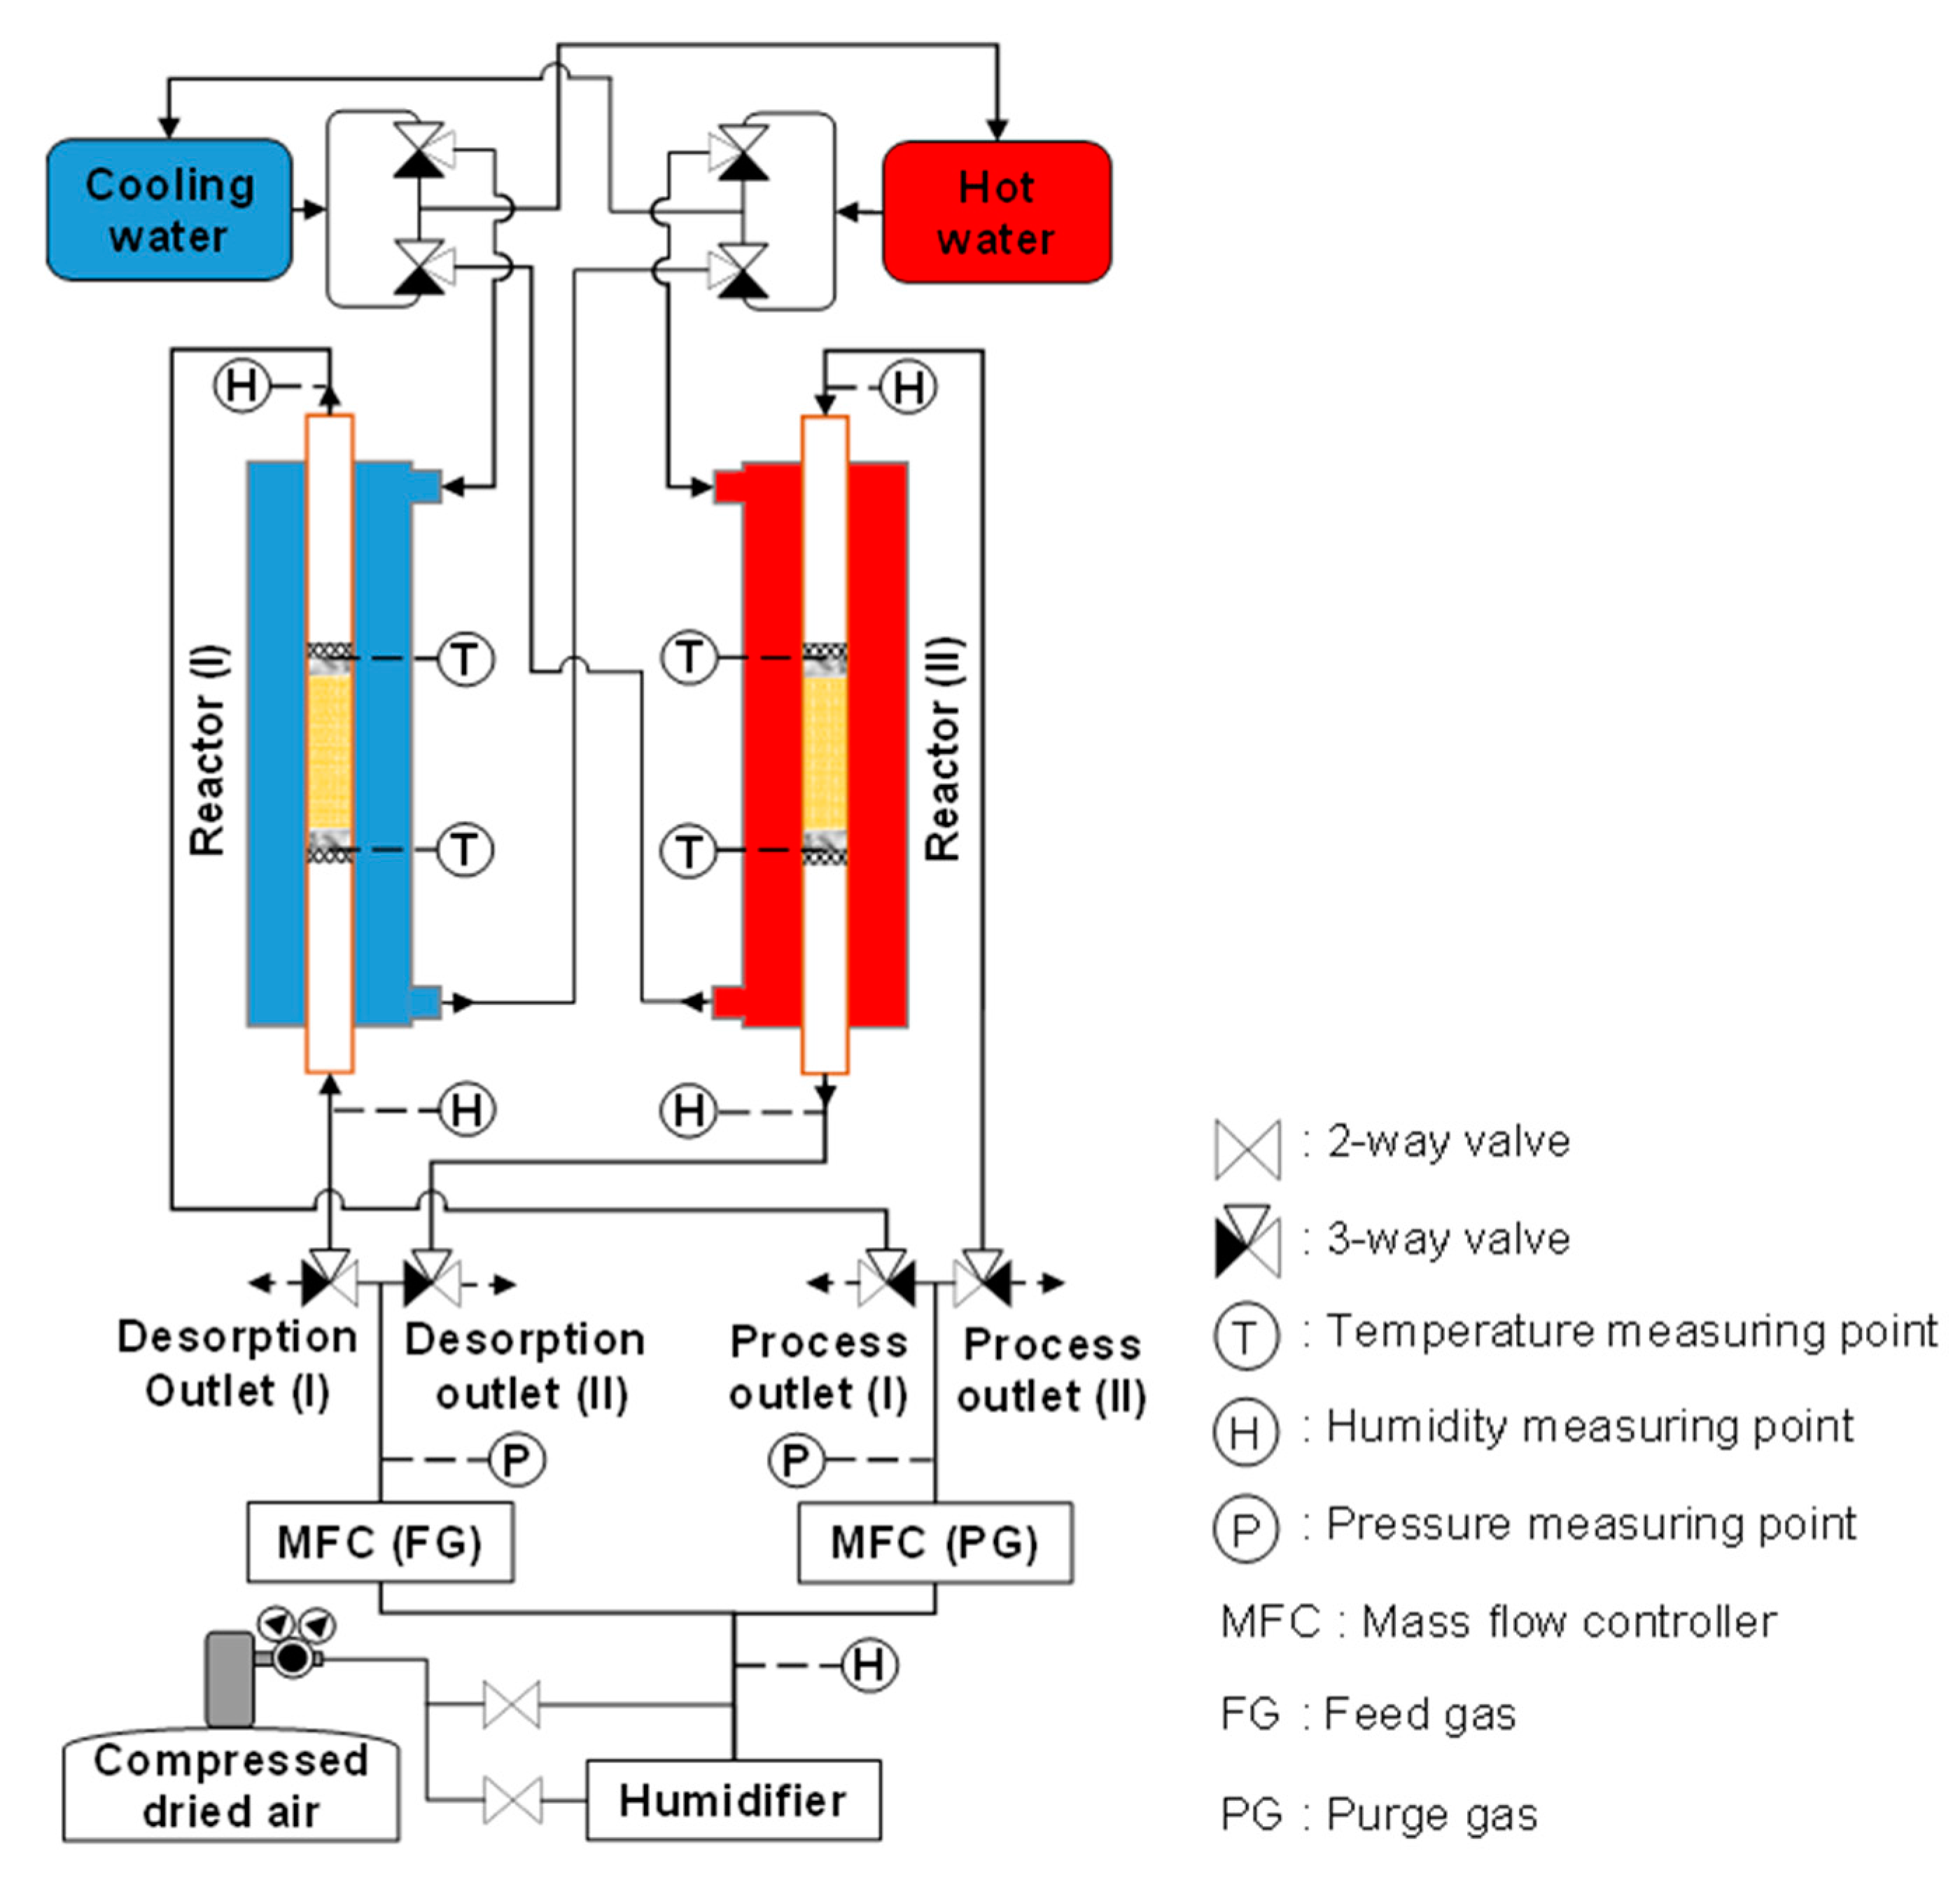
To investigate the cycle operation, the copper tube (outer diameter: 8 mm, inner diameter: 7 mm, as indicated in Figure 1) used as the inner pipe of the heat exchanger was filled with 3.24 g (5 mL) of the adsorbent. The flow rate of both inlet gases increased proportionally with an increase in the adsorbent amount. As shown in Figure 5, the apparatus supported two reactors: one for adsorption and the other for desorption. Thus, the simultaneous use of both reactors for the same case study accelerated the confirmation of experimental results. The entire system combined two water circulations (hot water and cooling water) and two gas flows (process gas and regeneration gas). Eight three-way valves alternatingly supplied the cooling water and process gas to the adsorption reactor and the hot water and regeneration gas to the desorption reactor. A membrane humidifier (HFB-02-100/BNP, AGC Engineering Co., Ltd., Chiba, Japan) was used to control the amount of moisture in the gas, and the Td of the gas was checked at the humidifier outlet using a humidity sensor (Vaisala Co., Ltd., HMP, Vantaa, Finland) at a pressure slightly higher than atmospheric pressure. The flow rates of the feed and purge gases were controlled using mass flow controllers (Azbil Co., Ltd., MQV0500, Tokyo, Japan; Horiba STEC Co., Ltd., SEC-E40, Kyoto, Japan, respectively). Pressure indicators (Nidec Co., Ltd., PA-750, Kyoto, Japan) were placed at the outlets of both mass flow controllers to determine the inlet pressures during adsorption and desorption. Moreover, four humidity sensors were installed at the gas inlets and outlets of both reactors to monitor the varying moisture levels of the gases after they passed through the adsorbent column during both steps. Thermocouples were inserted into the adsorbent column to confirm the sorption temperatures. The outlet flow rates during sorption and the CO2 concentrations were checked using dry-type gas flowmeters (Shinagawa Co., Ltd., DC1, Tokyo, Japan) and CO2 concentration analyzers (Shimadzu Co., Ltd., CGT-7100, Kyoto, Japan), respectively. Before measurement, the CO2-concentration-measurement device was calibrated using CO2 and N2 as the standard gases. A data logger (Graphtec, GL820, Yokohama, Japan) was used to record the measured data. The reactors and the tubes and fittings of the gas and water systems were covered with a thermal isolation material.
The simple adsorption–desorption cycle was conducted under the conditions in Table 1. For each reactor, desorption immediately started after adsorption stopped. Moreover, the simple adsorption–desorption cycle was operated in two scenarios. In the first scenario, the adsorption and desorption periods were equal. In the second scenario, desorption was longer than adsorption, the duration of which was 5 min. After completing one scenario, the tested adsorbent was replaced with a new one. Furthermore, wet adsorption and desorption were chosen to investigate the cycle time of operation, because dry air rarely occurs in the actual atmosphere. To avoid condensation at the regeneration outlet when supplying highly humid feed gas to the adsorption step, humid air with a Td of 5 °C (approximate relative humidity at the adsorption temperature = 35%, 8644 ppmv) was used as the feed and purge gases. The CO2 concentration of the applied air was slightly inconsistent (420–500 ppm). After the quasi-steady state, the desorption outlet gas was collected in an aluminum bag to check its CO2 concentration, and the required data were recorded.

2.4. Experimental Apparatus and Conditions for Double-Step Adsorption

The feed and purge gas pipeline systems of the simple adsorption–desorption cycle were modified to support the refluxing step in the double-step adsorption process. During refluxing, the regeneration gas (whose CO2 concentration was greatly higher than that of the room air) from the desorption column flowed into the adsorber. In this modification, three two-way valves and one three-way valve were added to the system, as shown in Figure 6. A two-way valve was placed along the pipe connecting the desorption outlets of both adsorbers. Two other two-way valves were installed before the two sampling points of the desorbed gas. A three-way valve was placed at the outlet of the mass flow controller of the feed gas to release the feed gas during refluxing.
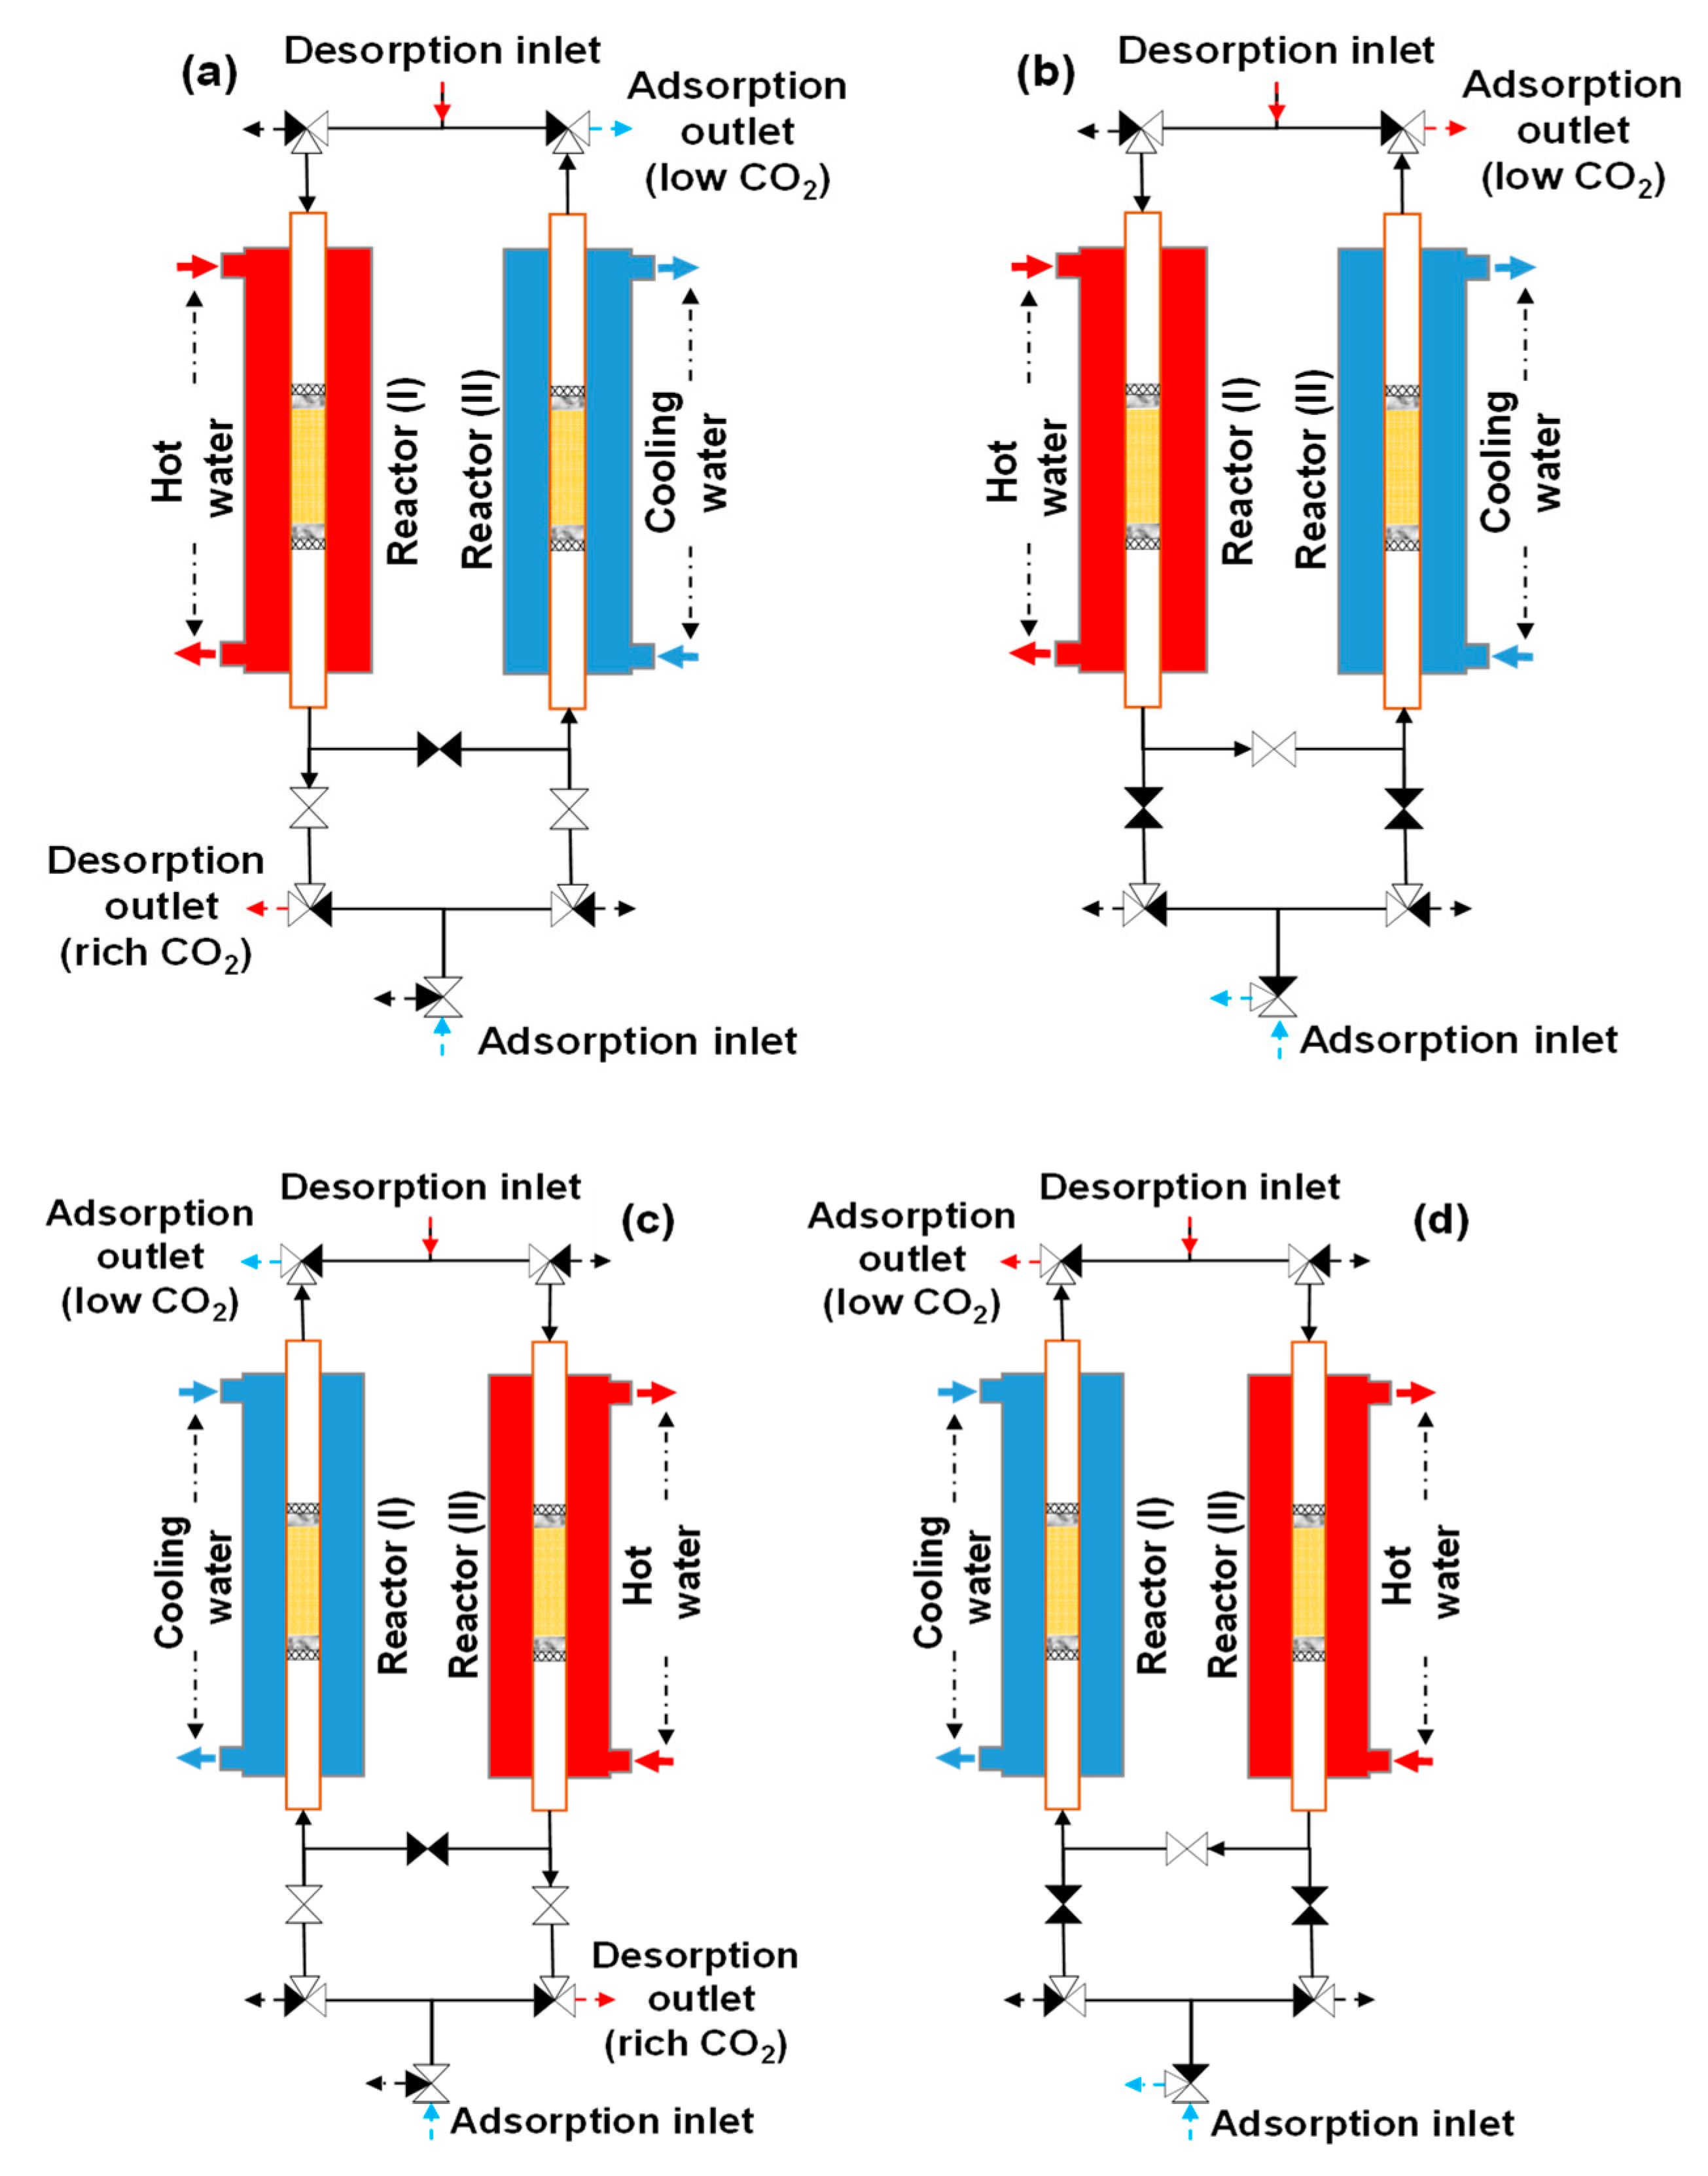
The loop of the double-step adsorption procedure is illustrated in Figure 7. As seen in Figure 7a, hot water and purge gas were supplied to reactor I for desorption, while cooling water and feed gas were transferred into reactor II for adsorption. In this step, the substantial-CO2-concentration gas at the desorption outlet of reactor I was collected as the product gas. As shown in Figure 7b, refluxing began immediately after the ambient air (feed gas) was discharged into reactor II. Simultaneously, the desorption outlets of both reactors were connected, and the regeneration gas of reactor I was refluxed to reactor II for secondary adsorption. Then, the regeneration outlets of both reactors were disconnected. In the next step, as shown in Figure 7c, the experimental system worked in reverse to the procedure in Figure 7a. During this step, the substantial-CO2-concentration gas regenerated from reactor II was collected as the product gas. Figure 7d presents the last step of the loop. The feed gas was released from the system to terminate the step in Figure 7c, and both reactors were joined again at the desorption outlet. Then, the working process in Figure 7b was reversed. The experimental conditions are described in Table 2. The double-step adsorption comprised three scenarios: scenario 1 (from RUN11-1 to 13-4), scenario 2 (from RUN14-1 to 16-4), and scenario 3 (from RUN17-1 to 19-4). Because the tested adsorbent was replaced with a new adsorbent, the decrease in the adsorbent’s performance was not investigated in this study. Therefore, the duration for which the adsorbent can maintain the operation is not indicated by the experiment.

2.5. Performance Indices

The performance of the cycle operation time was mainly indexed by the CO2 concentration and the CO2 recovery ratio of the desorption outlet gas, R C O 2 . This ratio is determined by the following equation:
R C O 2 % = V C O 2 D O G V C O 2 F G × 100
where V C O 2 F G and V C O 2 D O G are the volumes of CO2 in the feed gas and the desorption outlet gas, respectively.

3. Results and Discussion

3.1. Influence of Half-Cycle Time on Performance of Simple Adsorption–Desorption Cycle

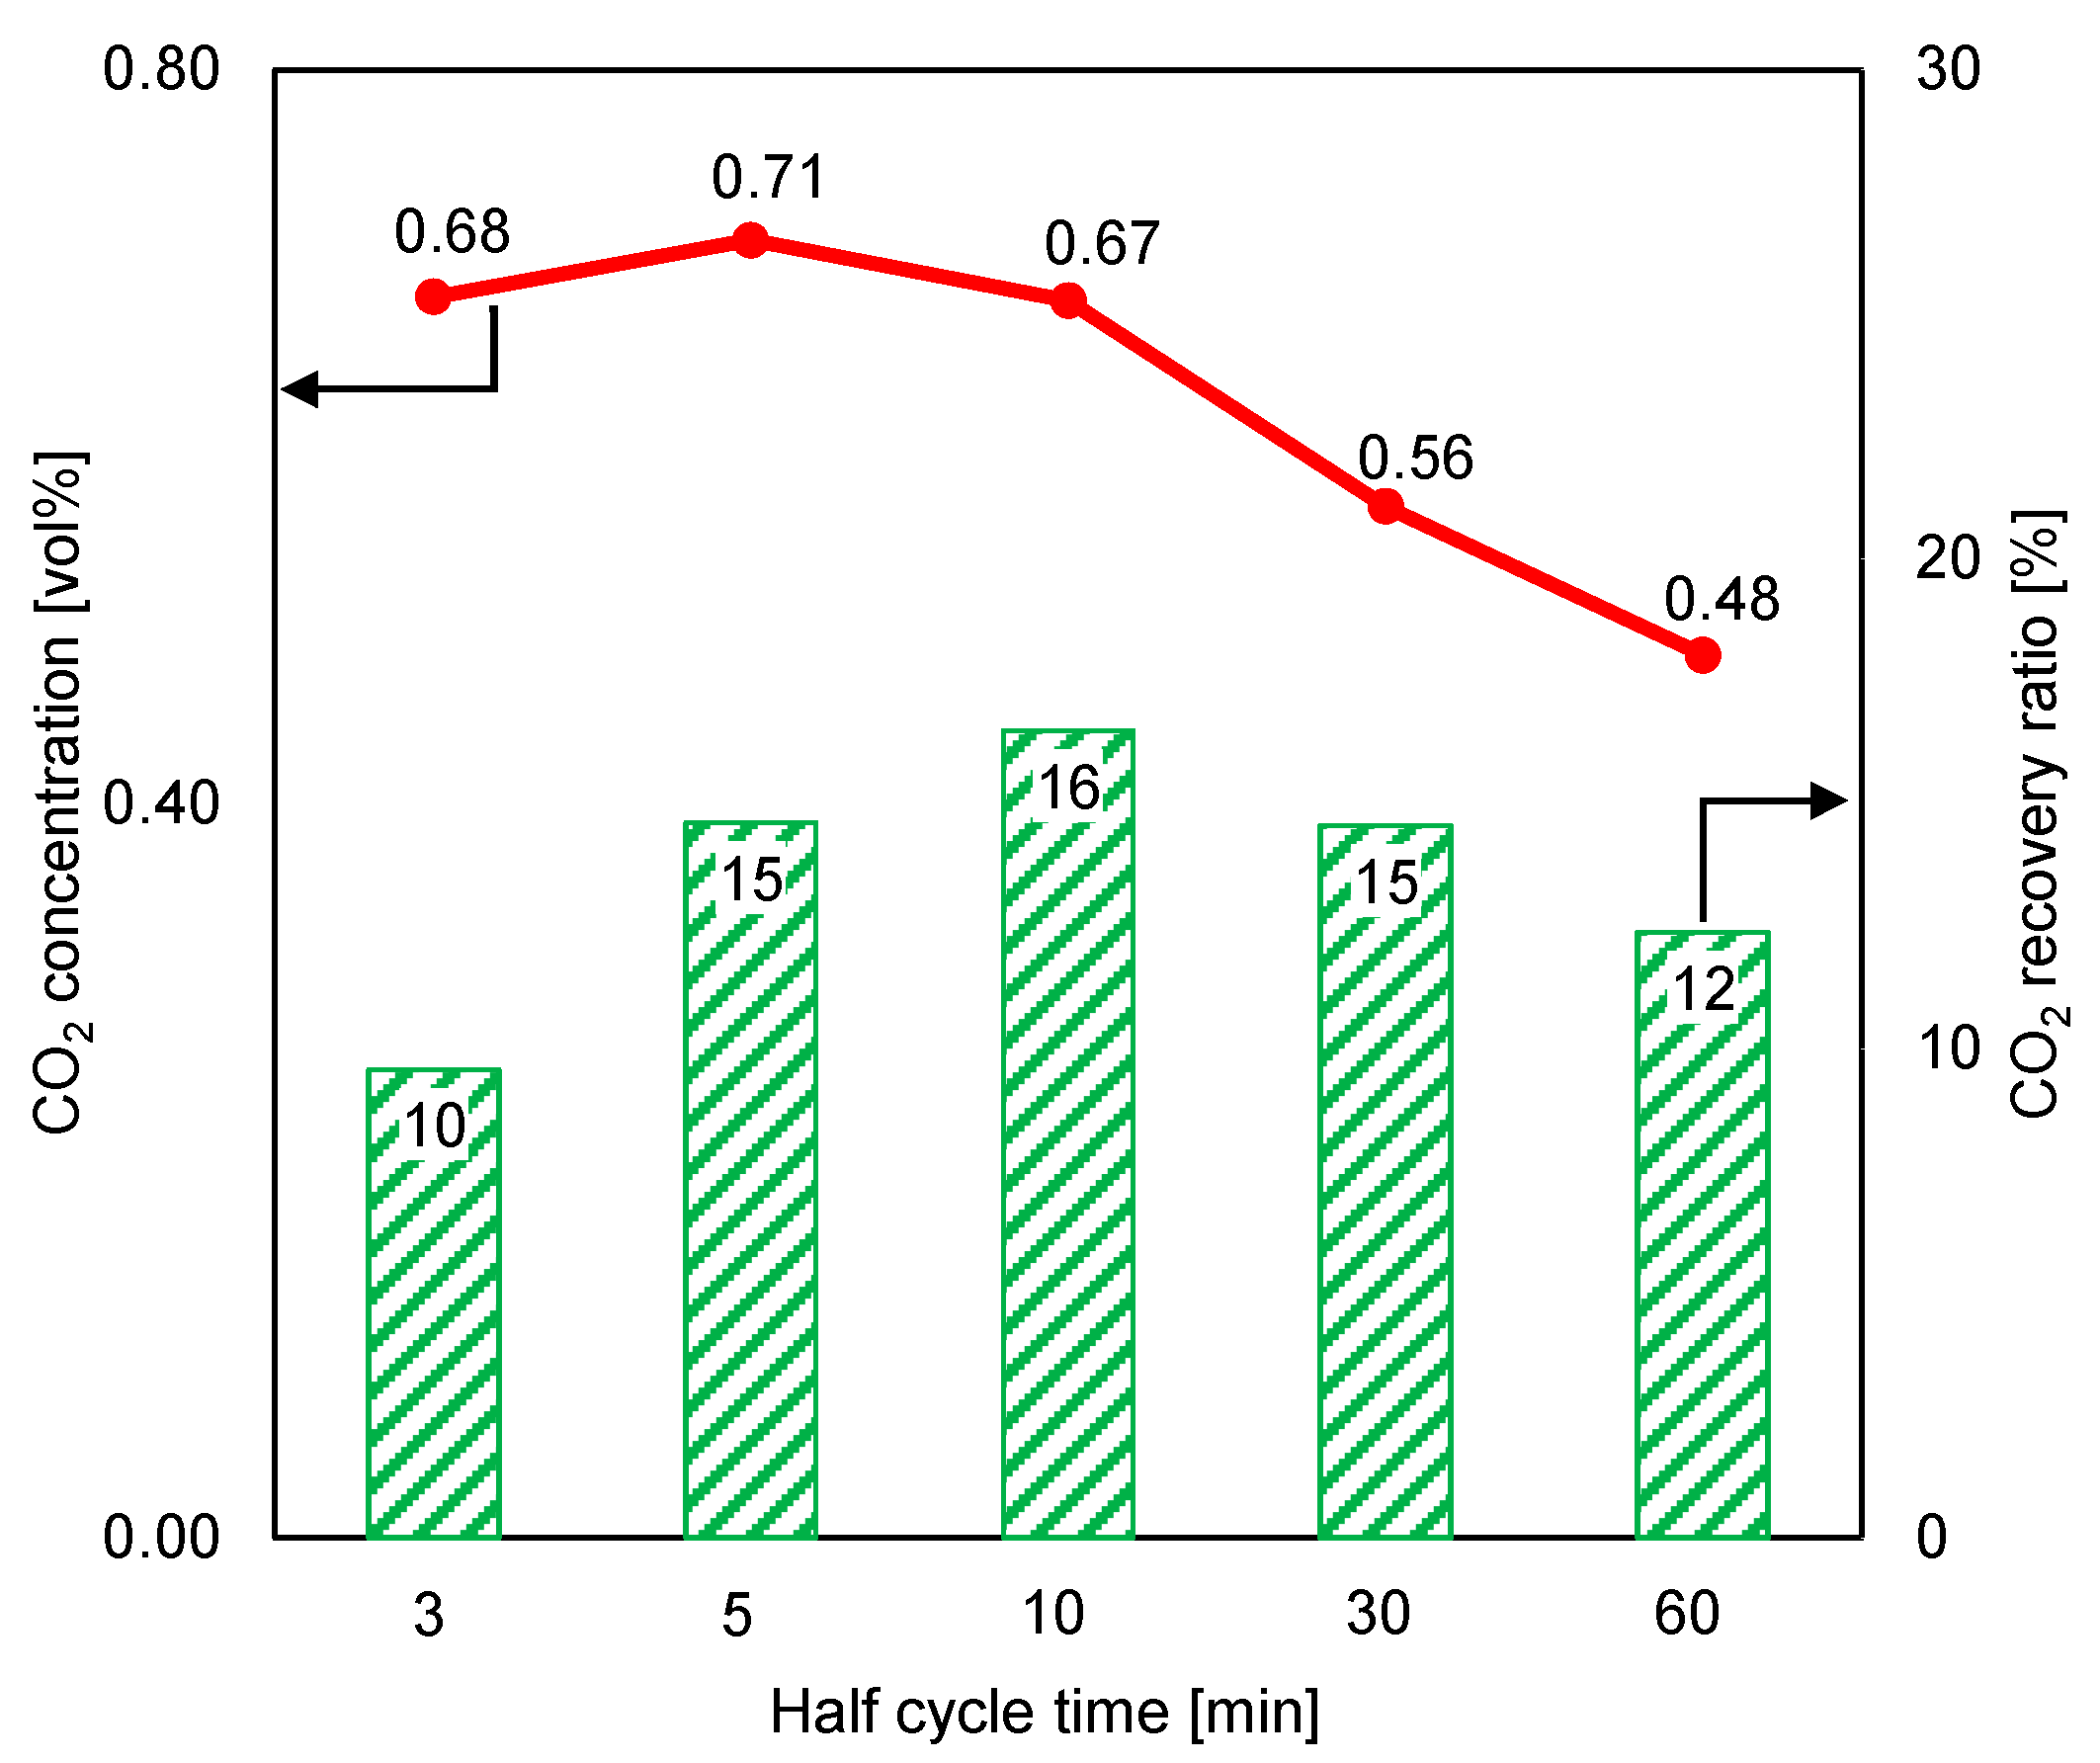
The small size of the adsorbent and the high flow rate of the supplied feed gas led to a high adsorption inlet pressure of approximately 120 kPa, but the desorption inlet pressure was low (about 1 kPa), due to the small amount of the supplied purge gas. As shown in Figure 8, a short cycle time considerably increased the CO2 concentration at the desorption outlet. However, the CO2 recovery ratio in a short desorption period was poor, despite an increase in the CO2 concentration of the product gas in this case. When the cycle time was under 10 min, the increasing CO2 concentration at the desorption outlet could not overcome the reducing volume of the regeneration gas to stabilize the CO2 recovery ratio. Under these experimental conditions, the maximum CO2 concentration in the adsorbent material was almost 17 times higher than that in the ambient air, but the CO2 recovery ratio was low.
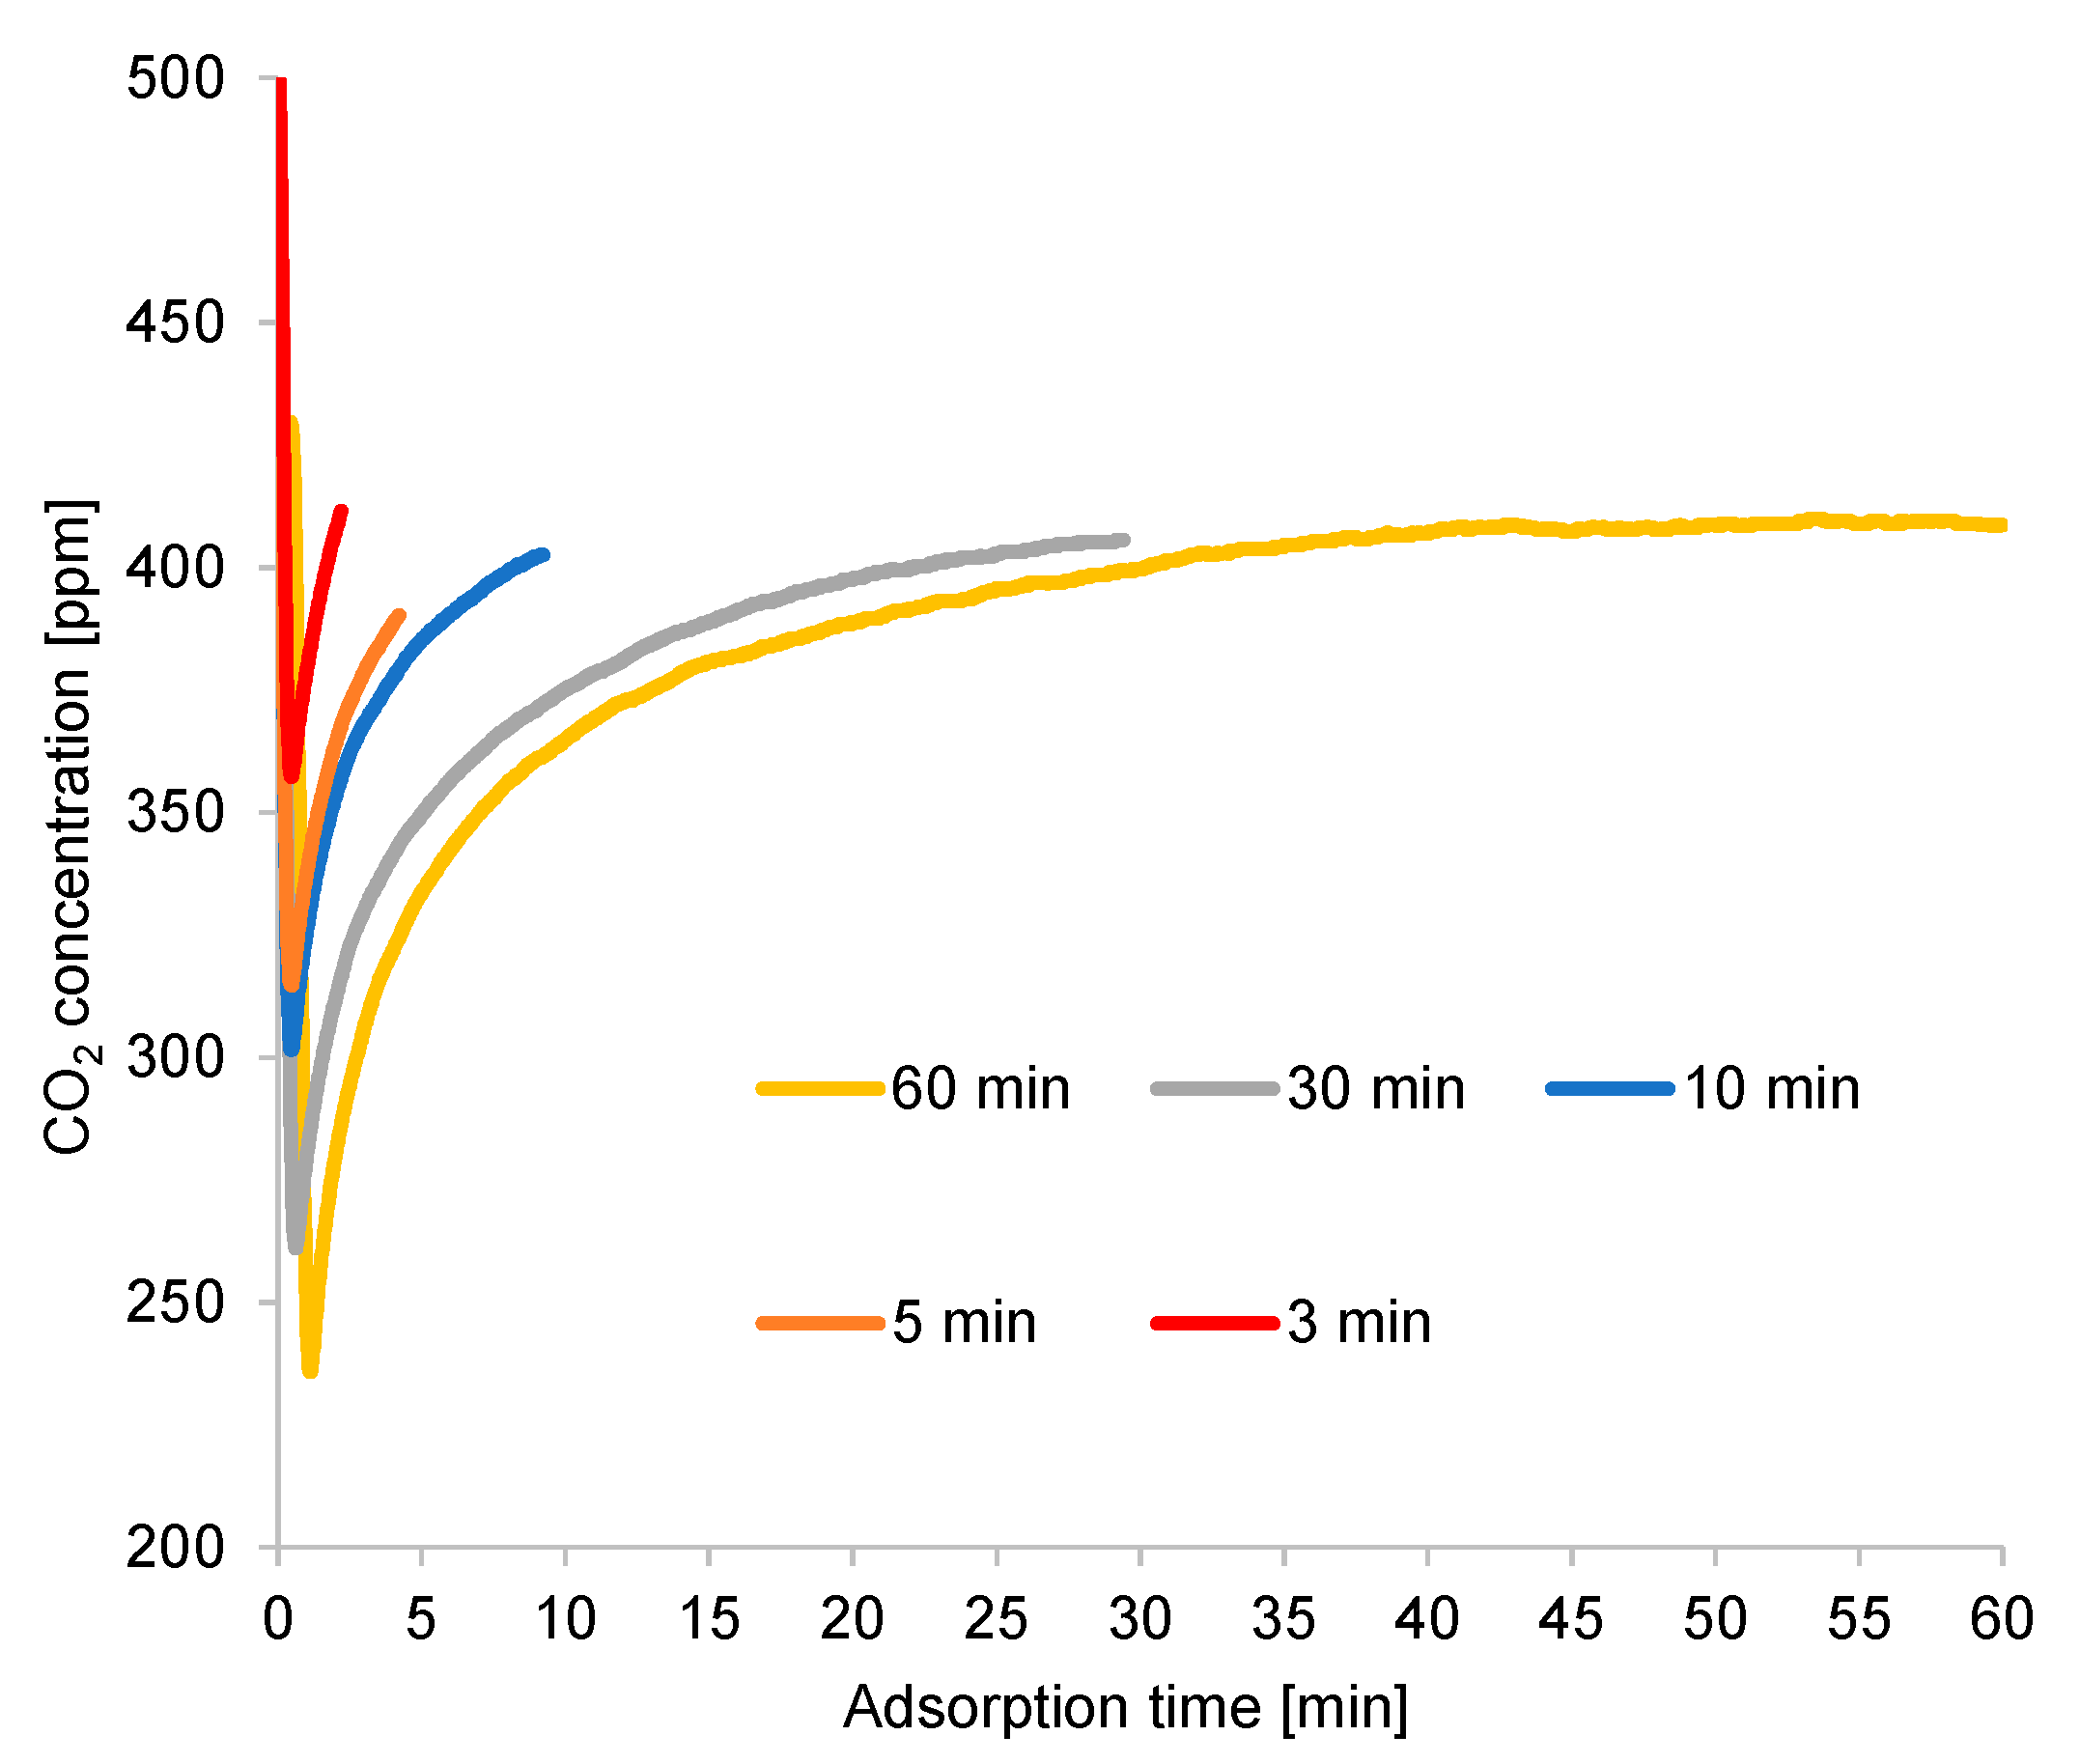
The rapid adsorption in this experiment was attributed to the high flow rate of the feed gas, as indicated in Figure 9, yielding the optimal CO2 concentration in a short cycle time. Thus, the flow rate of the feed gas may have affected the cycle time. However, such an extremely short cycle time was insufficient for the adsorbent to regenerate CO2. Despite the fast adsorption, the CO2 recovery ratio was low, due to the high flow rate of the feed gas (approximately 100 times that of the purge gas). This also compromised the CO2 capture over a prolonged cycle time. Moreover, highly prolonged adsorption time decreased the adsorption ratio before the end of adsorption; hence, the CO2 recovery ratio reduced considerably. In addition, the amount of packed adsorbent could not completely adsorb the CO2 contained in the feed gas during the extended adsorption period.
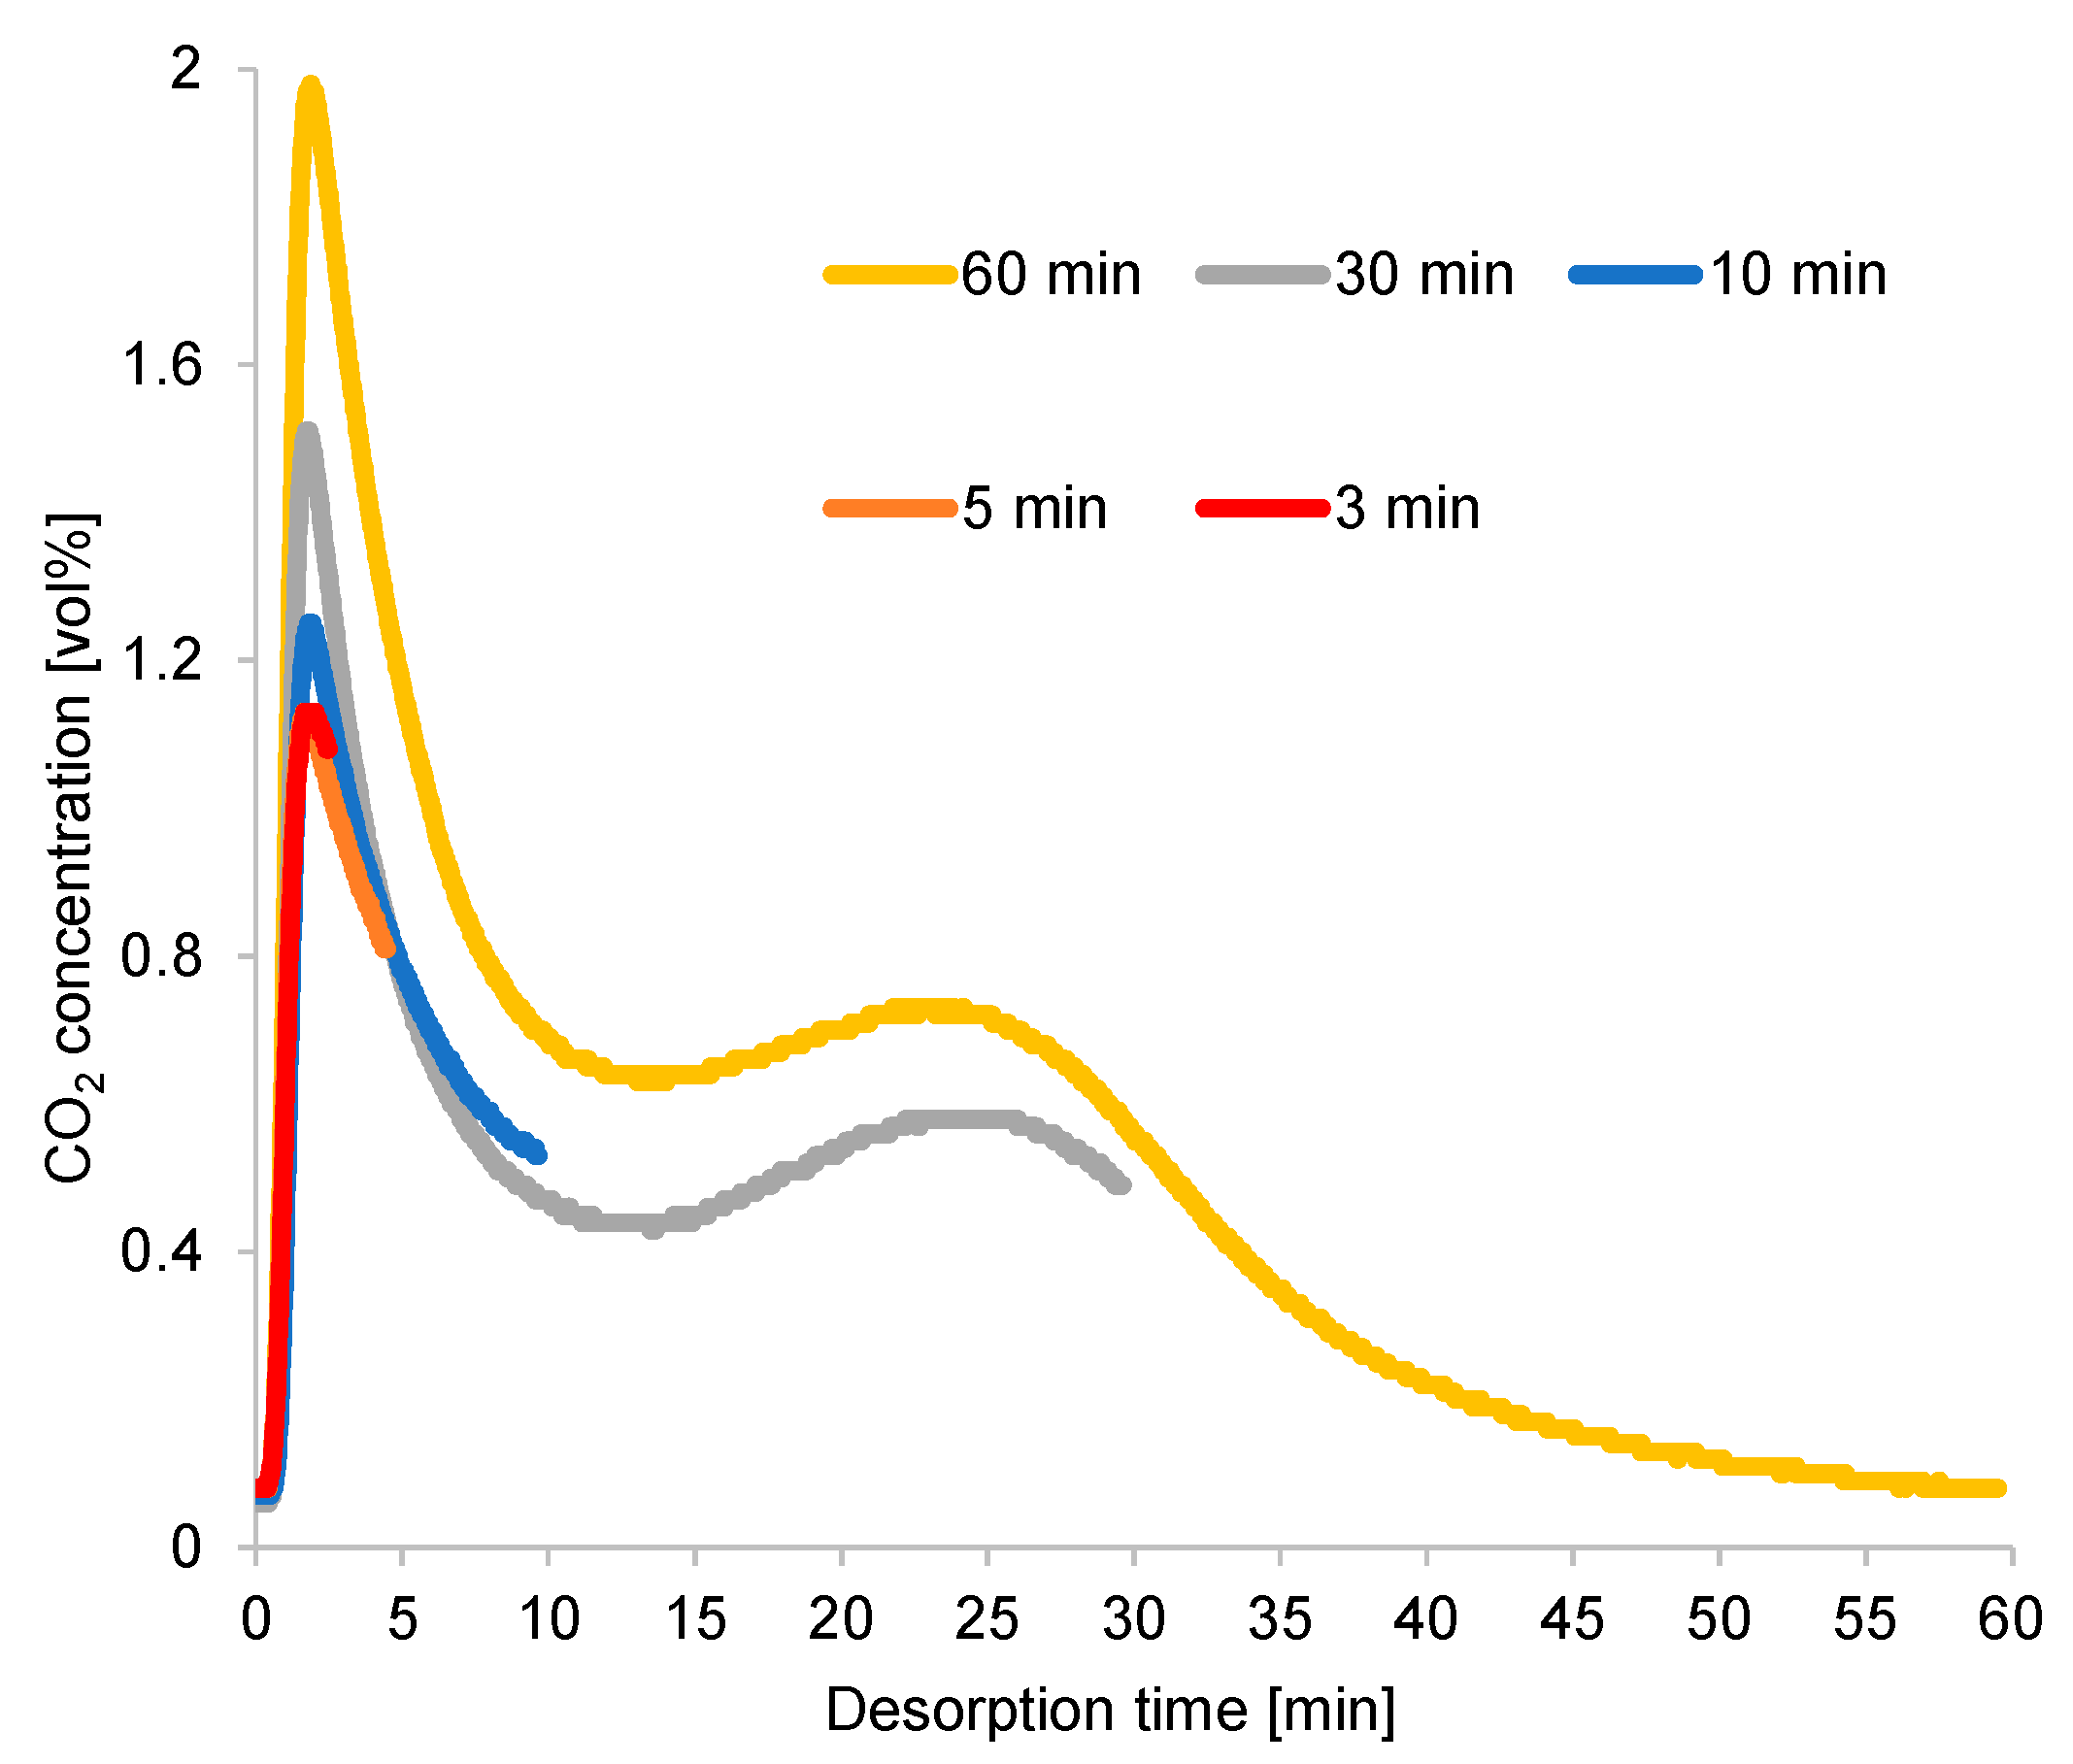
A longer cycle time extended the regeneration process and provided a higher CO2-concentration peak, as illustrated in Figure 10. However, the CO2 concentration rapidly declined from its peak, diluting the CO2 in the desorption gas. Moreover, the excessively high purge gas flow rate contributed to the CO2 dilution under long cycle times. Under an exceedingly short cycle time, the regeneration process terminated around the time when the CO2 concentration at desorption outlet was at its peak, resulting in high CO2 concentration at the desorption outlet under a short cycle time. The second peak of CO2 concentration continued to appear under a long cycle time, although the diameter of the inner tube of the double-pipe heat exchanger increased proportionally with the amount of adsorbent used in this case, which was higher than that used for the breakthrough curve experiment. Thus, the second peak was attributed to the adsorbent’s performance, rather than to the effect of a specific reactor design.
Furthermore, the CO2 recovery ratio result at a short cycle time was unfavorable, as shown in Figure 8. This result was attributed to the reading error of the mass flowmeter (the measurement of total regeneration outlet gas volume). Nevertheless, because the CO2 concentration in the desorption outlet was lower than 0.80% (the volume of CO2 in the product gas was very small compared to the total volume), the peak and variation trend of the recovery ratio remained similar to those shown in Figure 8, even though the estimated total volume of regeneration outlets (the estimation is based on the amount of supplied inlet air for regeneration per each cycle time) was used in the CO2 recovery ratio calculation. In this regard, the total gas volume was almost the same between the regeneration inlet and the regeneration outlet.

3.2. Effect of Extending Regeneration Time beyond Adsorption Time

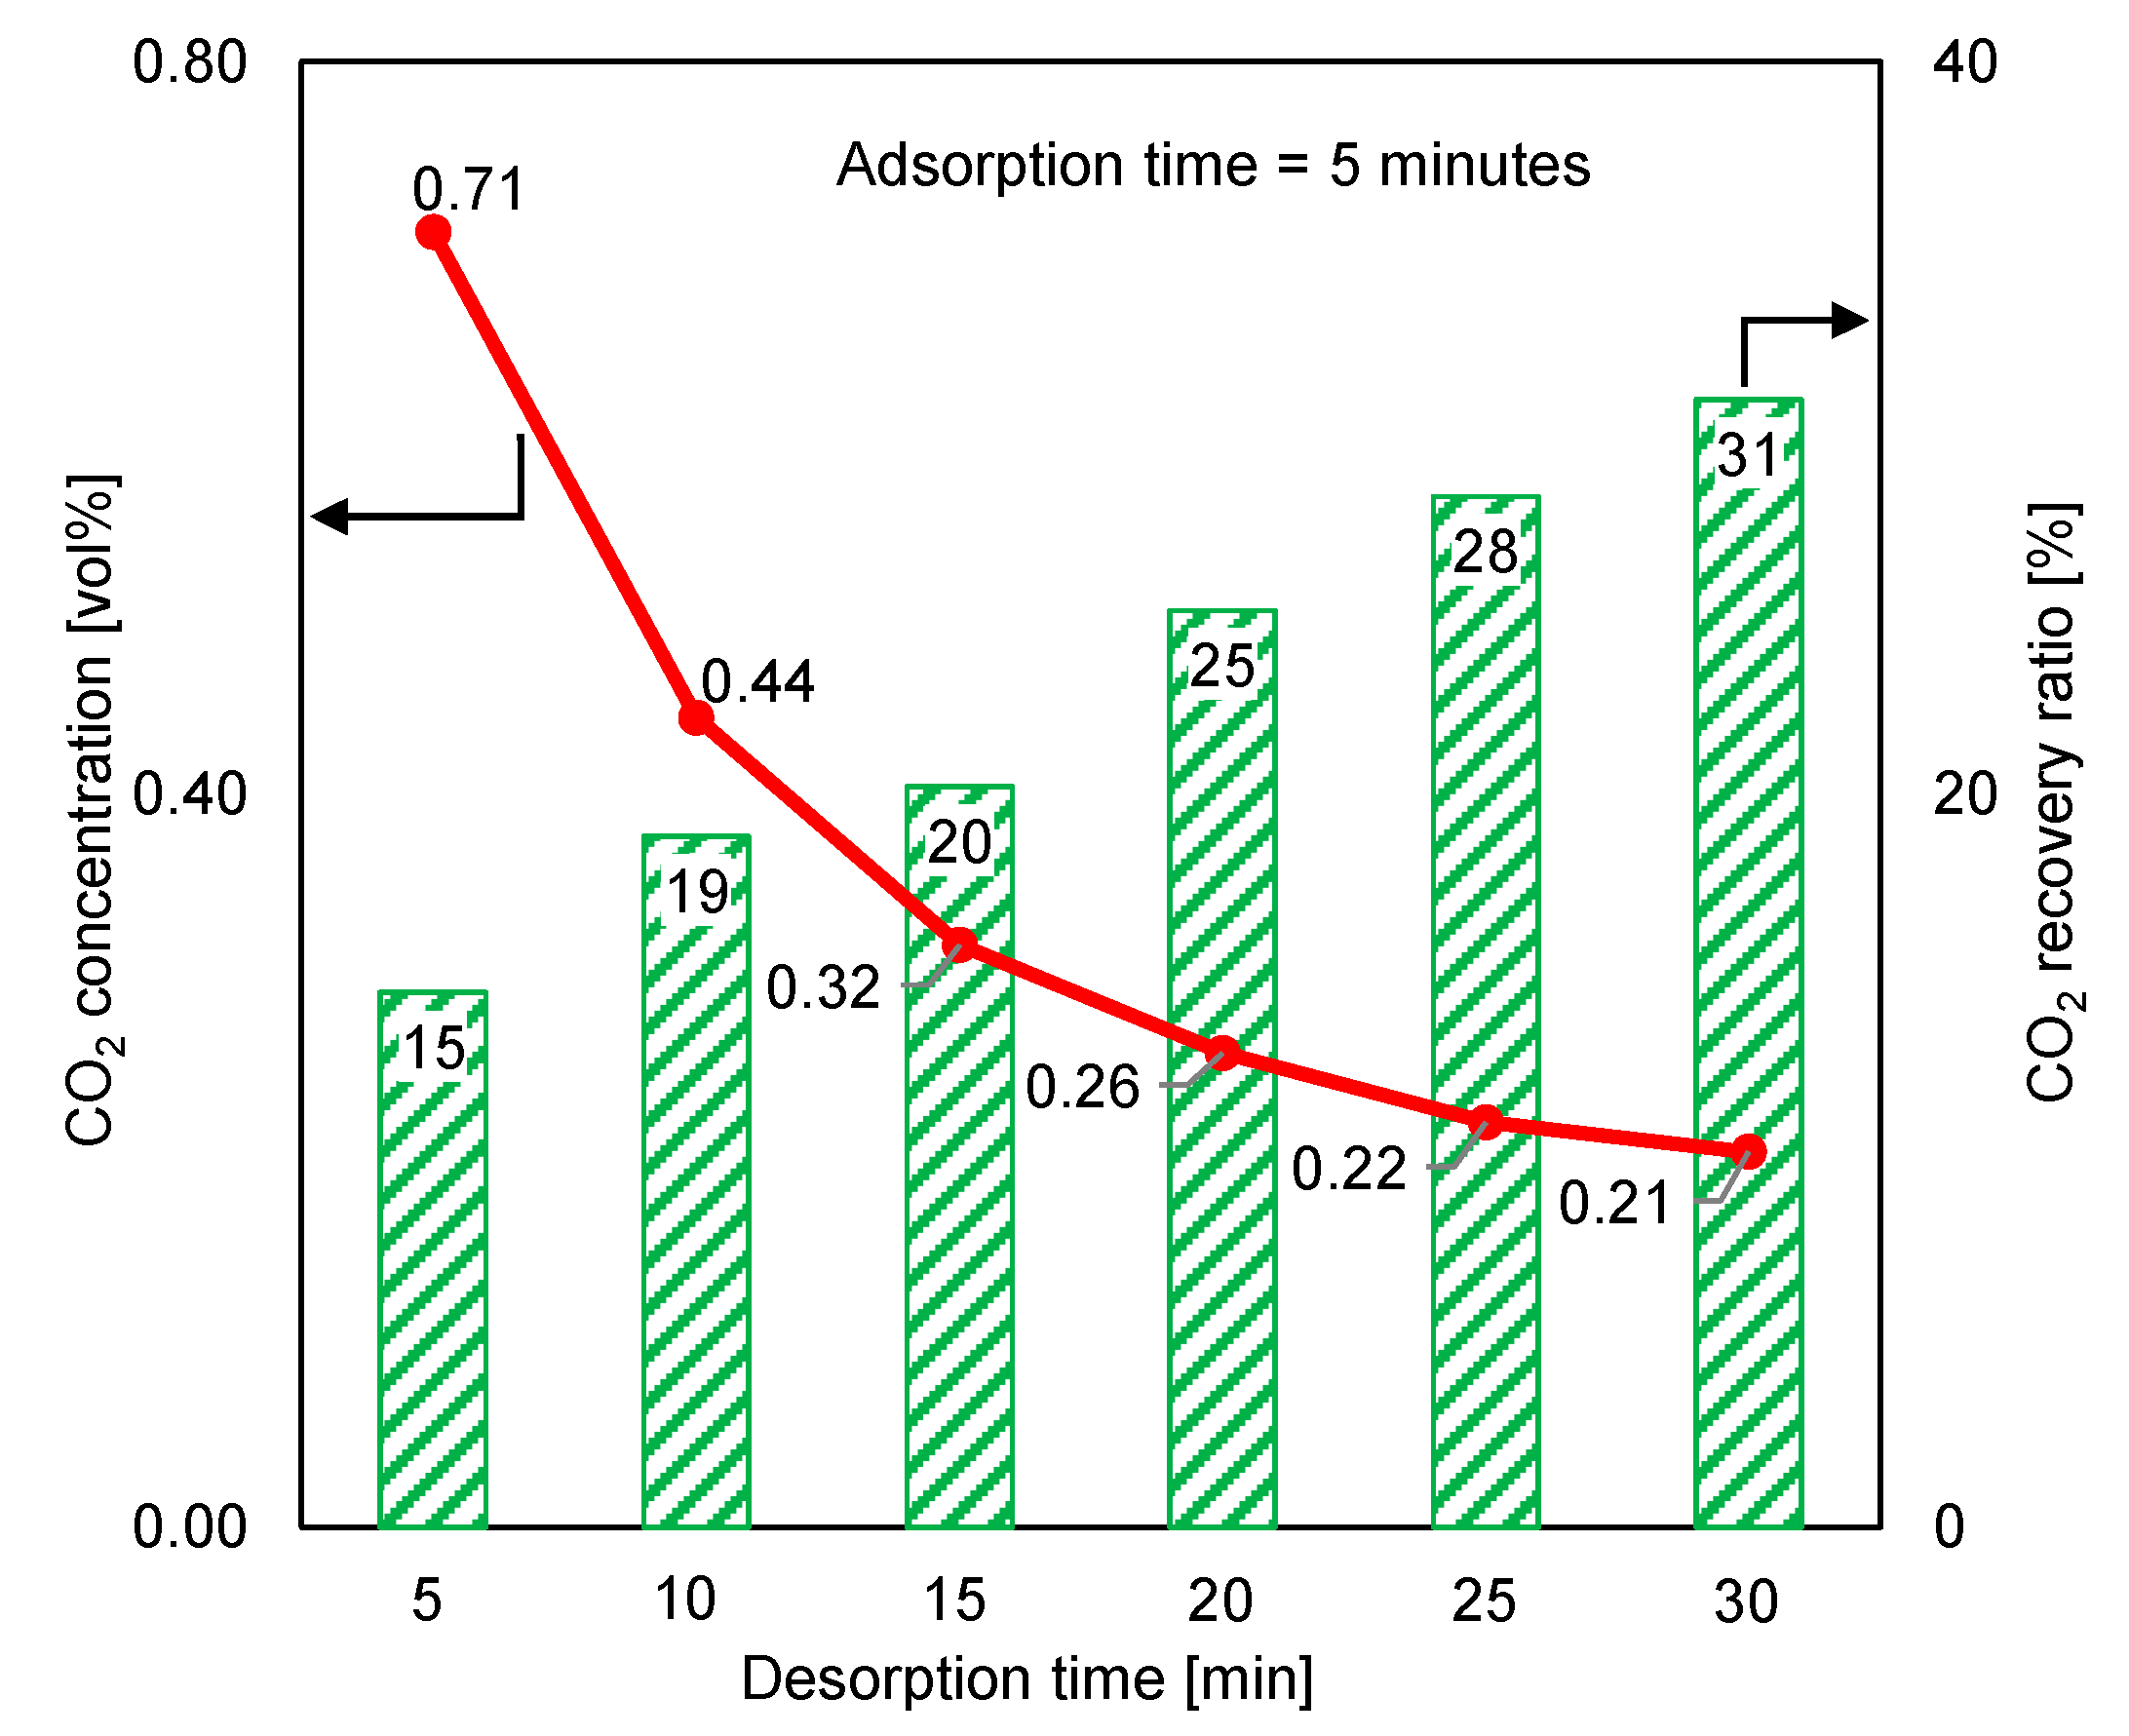
The desorption time was extended beyond the adsorption duration to identify the effect of complete regeneration on the desorption outlet CO2 concentration and the CO2 recovery ratio. Figure 11 depicts the variations in the desorption outlet CO2 concentration and the CO2 recovery ratio under a 5 min adsorption time and a longer desorption period. The CO2 concentration and CO2 recovery ratio varied in opposite directions. When the desorption time was 30 min, the CO2 concentration decreased three times, while the recovery ratio increased two times. Because the purge gas significantly decreased the CO2 concentration following the extended desorption time, reducing the purge-gas flow rate may have minimized the decrease in CO2 concentration. Additionally, reducing the purge-gas flow rate could have resulted in a slight decrease in the CO2 recovery ratio.

3.3. Double-Step Adsorption

The result of the simple adsorption–desorption cycle suggested that regeneration was a control step of the cycle operation. As mentioned in Section 3.2, the CO2 concentration at the desorption outlet could be significantly concentrated by shortening the cycle, but this greatly decreased the CO2 recovery ratio. The simple adsorption–desorption cycle could not overcome the fluctuation in the time profile of the desorption outlet CO2 concentration, as illustrated in Figure 10, to increase CO2 concentration and recovery, simultaneously. The first peak of the desorption outlet CO2 concentration could potentially be used as the product gas. The second peak of the CO2 concentration at the desorption outlet could be used to enhance the first peak, resulting in an enrichment of the CO2 concentration of the product gas. Therefore, we suggest a method that divides the adsorption gas over time, with the substantial-CO2-concentration gas serving as the product gas and the remaining portion serving as the reflux feed gas to the adsorber. This method can improve CO2 adsorption and recovery, simultaneously.

3.4. Influence of Cycle Operation on the Performance of Double-Step Adsorption

The CO2 concentrations at the desorption outlet of both reactors during double-step adsorption were checked. The result was deemed acceptable when the difference between the two concentrations was lower than or equal to 5%. Figure 12 shows the effect of adsorption/desorption (ads/des) and refluxing time variations on the time-averaged regeneration outlet CO2 concentrations and the CO2 recovery ratios of both reactors. The best performance belonged to the shortest adsorption/desorption time, which matched the longest refluxing time. Exceedingly long adsorption/desorption times allowed the adsorbent to adsorb more CO2, but more purge air was added into the product gas, thereby diluting the CO2 concentration of the product gas. Moreover, since the amount of feed gas was 100 times that of the purge gas, the greatly prolonged adsorption period decreased the CO2 recovery ratio. Because increasing the CO2 concentration in the feed gas theoretically increases the adsorption capacity, the adsorption from the elevated-CO2-concentration refluxing gas was a control step of the cycle. Hence, extending the refluxing period crucially increased the CO2 concentration at the desorption outlet and the CO2 recovery ratio. When the adsorption/desorption time equaled the refluxing time, the CO2 concentrations of the product gases were almost identical, but the highest CO2 recovery ratio occurred under 5 min adsorption/desorption and 5 min refluxing. Thus, setting equal periods of adsorption/desorption and refluxing had less influence on the CO2 concentration of the product gas, whereas significant variation in the CO2 concentration was observed when reflux time was extended beyond the adsorption/desorption time, and maximizing the CO2 recovery ratio required an appropriate cycle-operation time for a particular amount of supplied feed and purge gas.

3.5. Influence of Regeneration Air Flow Rate

Figure 13 depicts the variations in the desorption outlet CO2 concentration and CO2 recovery ratio at a purge gas flow rate of 0.045 L STP/min. Compared with Figure 12, in Figure 13, when half of the regeneration air that was supplied for the experiment in Figure 12 was reduced, the desorption outlet CO2 concentration in each case, as shown in Figure 13, increased by more than 40%. However, the low purge gas flow rate was insufficient for the regeneration of the adsorbent; hence, the CO2 recovery ratio decreased. When the purge gas flow rate was reduced, the longest desorption time yielded a higher increase rate in CO2 concentration and a lower decrease rate in the CO2 recovery ratio than the shortest desorption time. Thus, regeneration was slowed by the reduction in the regeneration air flow rate.

3.6. Influence of Feed Gas Flow Rate

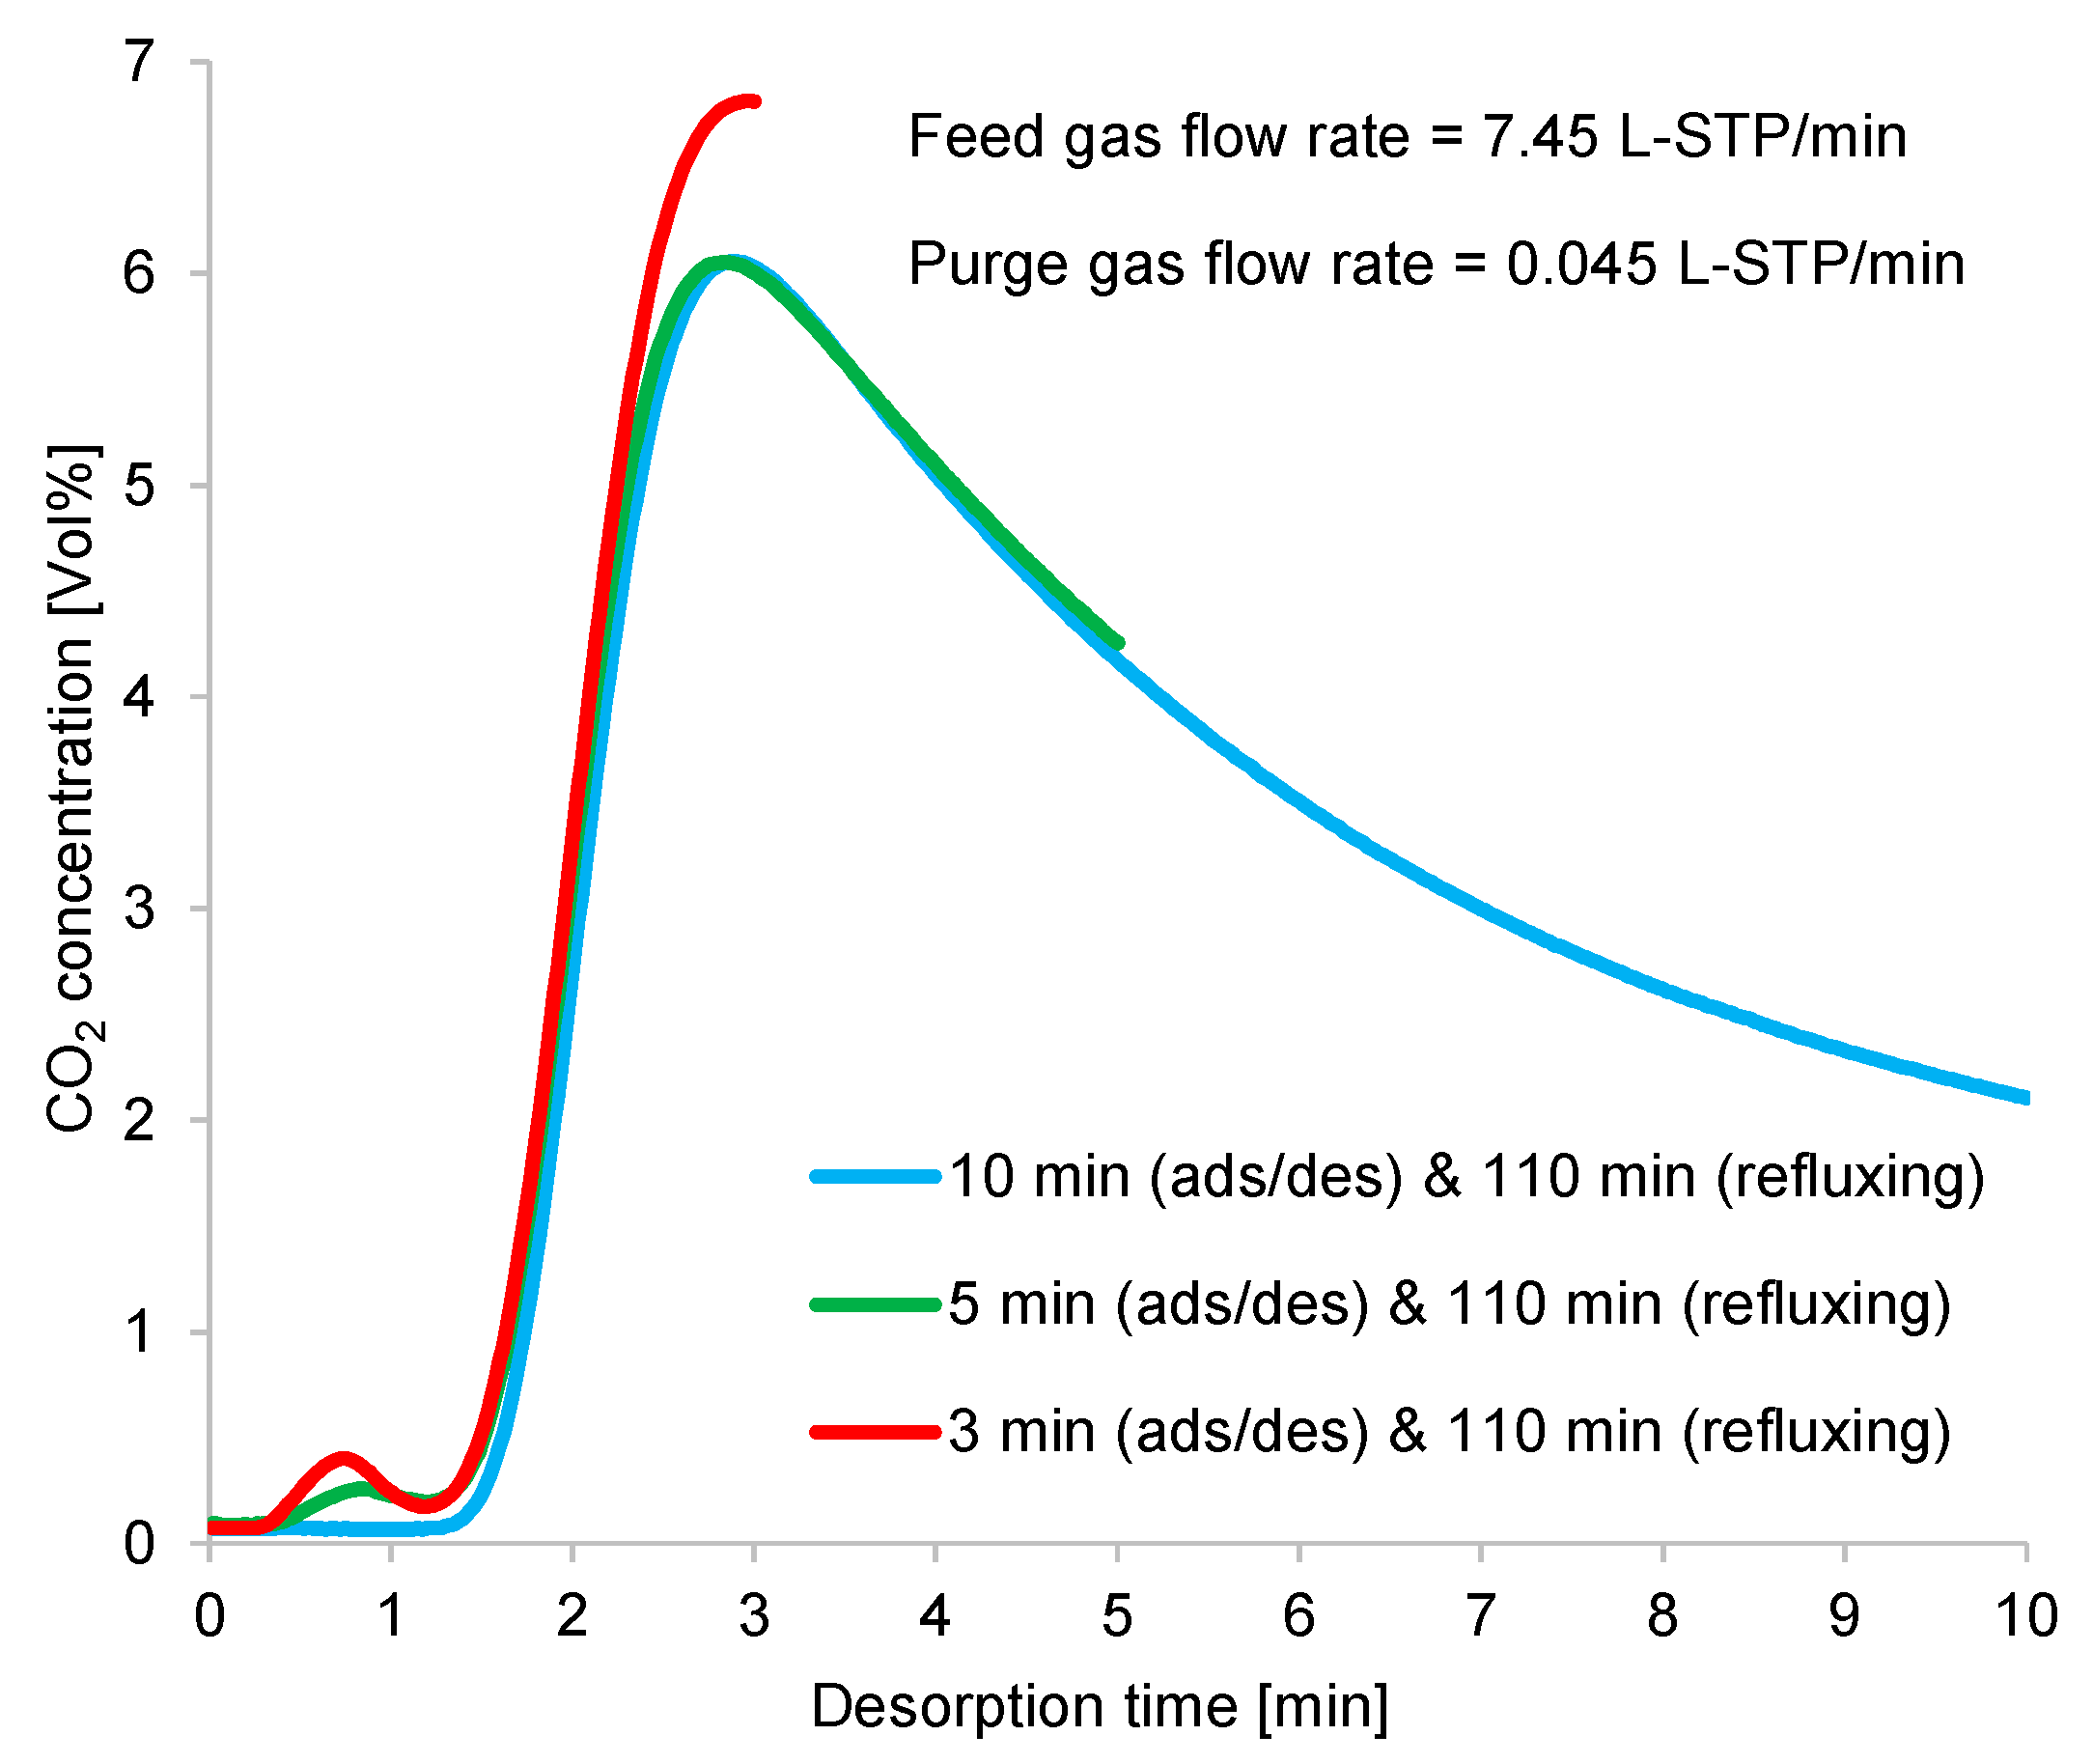
The supplied feed gas flow rate was reduced by 20% to clarify the excess supplied feed gas, as discussed in Section 3.1. The CO2 concentrations at desorption outlet and CO2 recovery ratios at a feed gas flow rate of 7.45 L STP/min and a purge gas flow rate of 0.045 L STP/min are illustrated in Figure 14. According to Figure 13 and Figure 14, this reduction in the feed gas flow rate decreased the CO2 concentration at the regeneration outlet by less than 5%. Nevertheless, the CO2 recovery ratio increased by approximately 15%. Additionally, the adsorption pressure inlet reduced from approximately 120 kPa to 85 kPa. In double-step adsorption, the second step (adsorption from elevated-CO2-concentration refluxing gas) played a more important role in enhancing adsorption capacity than the first step (adsorption from CO2 in air). Therefore, despite the 20% reduction in the feed gas, the CO2 concentration of the product gas remained almost stable.
The time profiles of the CO2 concentrations at the adsorption and desorption outlets are shown in Figure 15 and Figure 16, respectively, to gain more insight into the above results. According to these figures, the outlet gas needed 2 min to reach the detector; hence, the CO2 concentrations of the gases remaining at the pipe inlet of the CO2 analyzer were detected. Although the time profiles contained measurement delays, the averaged concentrations were accurate, as the regeneration outlet gases were collected into sample bags near the desorption outlet of the column to check their average CO2 concentrations. Thus, the dilution of the regeneration outlet CO2 concentration caused by the remaining gas in the pipeline was negligible. Figure 15 shows a zoomed-in view of the starting state of the CO2 concentration profile, revealing the variation of the CO2 concentration at the adsorption outlet during the first 15 min. At the adsorption/desorption time, the adsorbent adsorbed the CO2 from ambient air at a high flow rate; as a result, the CO2 concentration at adsorption outlet increased rapidly. Afterward, this adsorbent captured the CO2 from the low-flow-rate elevated-CO2-concentration regeneration gas refluxed from the other column; consequently, almost all the CO2 contained in the refluxing gas was adsorbed.
As shown in Figure 16, at the beginning of desorption, the CO2 flow rate profile narrowed and rose, indicating rapid desorption. The regeneration outlet CO2-concentration profile showed that the optimum average CO2 concentration was obtained from the shorter adsorption/desorption time, as discussed in Section 3.1.
During the refluxing step, the CO2 concentration in the refluxing gas varied, following the fluctuation behavior of the time profiles of CO2 desorption shown in Figure 10. Moreover, the adsorption capacity of the adsorbent greatly depended on the CO2 concentration in the adsorption inlet gas. Despite the constant refluxing duration, the CO2 concentration sent to the adsorber during this step differed, as it depended on the variations in the adsorption/desorption time. As shown in Figure 16, a short adsorption/desorption time allowed the adsorber to capture less CO2 from the room air, but the adsorber could adsorb CO2 of the highest concentration from the refluxing gas. Given a longer adsorption/desorption time, the adsorber captured more CO2 from the room air, but the adsorber adsorbed a low concentration of CO2 from the refluxing gas when the refluxing step began. Furthermore, an extended refluxing time enabled the adsorber to capture more CO2 from the second peak of CO2 regeneration, as indicated by the time profile in Figure 10. Therefore, the peak in the time profile of the desorption outlet CO2 concentration shown in Figure 16 varied with the refluxing time. Nevertheless, the influence of adsorbed moisture remaining in the adsorbent at the peak of the regeneration outlet CO2 concentration required investigation.

4. Conclusions

The capture of CO2 from ambient air using a functionalized polyamine-impregnated solid adsorbent was investigated via TSA equipped with indirect heating and cooling to evaluate the possibility of integrating this capture method into waste heat or solar energy operation. An adsorption process was developed, and its separation performance was assessed under different cycle-operation times, regeneration air-flow rates, and feed air-flow rates. The focus was on achieving a high regeneration outlet CO2 concentration and CO2 recovery ratio. The conclusions are summarized as follows:
  • The adsorption step consumed a much shorter time than the desorption step, which indicated that the cycle operation was controlled by the latter. Shortening the cycle time greatly concentrated the CO2 at the desorption outlet, due to the rapid CO2 desorption rate, but the CO2 recovery ratio decreased significantly because the total amount of regeneration air per cycle time was much smaller than that of feed air. Hence, a trade-off existed between the regeneration outlet CO2 concentration and the CO2 recovery ratio.
  • The proposed double-step adsorption process simultaneously improved CO2 adsorption and recovery. This method divided desorption gas over time, with high-CO2-concentration gas serving as the product gas and the remaining portion serving as the reflux feed gas to the adsorber. In this case, minimizing the adsorption/desorption time and prolonging the refluxing time significantly improved CO2 separation. Refluxing played a crucial role in enhancing CO2 capture because of the adsorption from high-CO2-concentration recirculation gas. Furthermore, a lower regeneration air flow rate during desorption increased the CO2 concentration.
In future studies, the influence of adsorbed moisture on CO2 regeneration behavior must be clarified. Additionally, the development of a continuous adsorption process will be considered.

Author Contributions

Investigation, Methodology, Data curation, Writing—original draft, H.V.; Writing—review and editing, Y.O. and T.T.; Conceptualization, Supervision, A.K. All authors have read and agreed to the published version of the manuscript.

Funding

This research was funded by [New Energy and Industrial Technology Development Organization] grant number [JPNP18016].

Data Availability Statement

Research data can be provided as needed.

Acknowledgments

This work is based on results obtained from a project, JPNP18016, commissioned by the New Energy and Industrial Technology Development Organization (NEDO). The authors would like to thank Enago (www.enago.jp) for the English language review.

Conflicts of Interest

The authors declare no conflict of interest.

References

  1. Houghton, J.T. Intergovernmental Panel on Climate Change. In Climate Change 2001: The Scientific Basis; Cambridge University Press: Cambridge, UK, 2001. [Google Scholar]
  2. Masson-Delmotte, V.; Zhai, P.; Pirani, A.; Connors, S.L.; Péan, C.; Berger, S.; Caud, N.; Chen, Y.; Goldfarb, L.; Gomis, M.I.; et al. Working Group I Contribution to the Sixth Assessment Report of the Intergovernmental Panel on Climate Change Edited by. 2021. Available online: www.ipcc.ch (accessed on 2 March 2022).
  3. Mac Dowell, N.; Fennell, P.; Shah, N.; Maitland, G.C. The role of CO2 capture and utilization in mitigating climate change. Nat. Clim. Chang. 2017, 7, 243–249. [Google Scholar] [CrossRef] [Green Version]
  4. Seipp, C.A.; Williams, N.J.; Kidder, M.K.; Custelcean, R. CO2 Capture from Ambient Air by Crystallization with a Guanidine Sorbent. Angew. Chem. 2016, 129, 1062–1065. [Google Scholar] [CrossRef]
  5. Joss, L.; Gazzani, M.; Mazzotti, M. Rational design of temperature swing adsorption cycles for post-combustion CO2 capture. Chem. Eng. Sci. 2016, 158, 381–394. [Google Scholar] [CrossRef]
  6. Bach, L.T.; Gill, S.J.; Rickaby, R.E.M.; Gore, S.; Renforth, P. CO2 Removal with Enhanced Weathering and Ocean Alkalinity Enhancement: Potential Risks and Co-benefits for Marine Pelagic Ecosystems. Front. Clim. 2019, 1, 7. [Google Scholar] [CrossRef] [Green Version]
  7. Smith, P.; Davis, S.J.; Creutzig, F.; Fuss, S.; Minx, J.; Gabrielle, B.; Kato, E.; Jackson, R.B.; Cowie, A.; Kriegler, E.; et al. Biophysical and economic limits to negative CO2 emissions. Nat. Clim. Chang. 2015, 6, 42–50. [Google Scholar] [CrossRef] [Green Version]
  8. Varghese, A.M.; Karanikolos, G.N. CO2 capture adsorbents functionalized by amine—Bearing polymers: A review. Int. J. Greenh. Gas Control. 2020, 96, 103005. [Google Scholar] [CrossRef]
  9. Zhao, Q.; Wu, F.; Men, Y.; Fang, X.; Zhao, J.; Xiao, P.; Webley, P.A.; Grande, C.A. CO2 capture using a novel hybrid monolith (H-ZSM5/activated carbon) as adsorbent by combined vacuum and electric swing adsorption (VESA). Chem. Eng. J. 2019, 358, 707–717. [Google Scholar] [CrossRef]
  10. Jiang, N.; Shen, Y.; Liu, B.; Zhang, D.; Tang, Z.; Li, G.; Fu, B. CO2 capture from dry flue gas by means of VPSA, TSA and TVSA. J. CO2 Util. 2019, 35, 153–168. [Google Scholar] [CrossRef]
  11. Hoysall, D.C.; Determan, M.D.; Garimella, S.; Lenz, R.D.; Leta, D.P. Optimization of Carbon Dioxide Capture Using Sorbent-Loaded Hollow-Fiber Modules. Int. J. Greenh. Gas Control. 2018, 76, 225–235. [Google Scholar] [CrossRef]
  12. Zainol, N.I.; Osaka, Y.; Tsujiguchi, T.; Kumita, M.; Kodama, A. Separation and enrichment of CH4 and CO2 from a dry biogas using a thermally regenerative adsorbent-packed heat exchanger. Adsorption 2019, 25, 1159–1167. [Google Scholar] [CrossRef]
  13. Rezaei, F.; Subramanian, S.; Kalyanaraman, J.; Lively, R.P.; Kawajiri, Y.; Realff, M.J. Modeling of rapid temperature swing adsorption using hollow fiber sorbents. Chem. Eng. Sci. 2014, 113, 62–76. [Google Scholar] [CrossRef]
  14. Masuda, S.; Osaka, Y.; Tsujiguchi, T.; Kodama, A. Carbon dioxide recovery from a simulated dry exhaust gas by an internally heated and cooled temperature swing adsorption packed with a typical hydrophobic adsorbent. Sep. Purif. Technol. 2021, 284, 120249. [Google Scholar] [CrossRef]
  15. Ntiamoah, A.; Ling, J.; Xiao, P.; Webley, P.A.; Zhai, Y. CO2 capture by temperature swing adsorption: Use of hot CO2-rich gas for regeneration. Ind. Eng. Chem. Res. 2016, 55, 703–713. [Google Scholar] [CrossRef]
  16. Masuda, S.; Osaka, Y.; Tsujiguchi, T.; Kodama, A. High-purity CO2 recovery following two-stage temperature swing adsorption using an internally heated and cooled adsorber. Sep. Purif. Technol. 2023, 309, 123062. [Google Scholar] [CrossRef]
  17. Sinha, A.; Darunte, L.A.; Jones, C.W.; Realff, M.J.; Kawajiri, Y. Systems Design and Economic Analysis of Direct Air Capture of CO2 through Temperature Vacuum Swing Adsorption Using MIL-101(Cr)-PEI-800 and mmen-Mg2(dobpdc) MOF Adsorbents. Ind. Eng. Chem. Res. 2017, 56, 750–764. [Google Scholar] [CrossRef]
  18. Stampi-Bombelli, V.; van der Spek, M.; Mazzotti, M. Analysis of direct capture of CO2 from ambient air via steam-assisted temperature–vacuum swing adsorption. Adsorption 2020, 26, 1183–1197. [Google Scholar] [CrossRef]
  19. Fujiki, J.; Chowdhury, F.A.; Yamada, H.; Yogo, K. Highly efficient post-combustion CO2 capture by low-temperature steam-aided vacuum swing adsorption using a novel polyamine-based solid sorbent. Chem. Eng. J. 2017, 307, 273–282. [Google Scholar] [CrossRef]
  20. Goeppert, A.; Czaun, M.; May, R.B.; Prakash, G.K.S.; Olah, G.A.; Narayanan, S.R. Carbon Dioxide Capture from the Air Using a Polyamine Based Regenerable Solid Adsorbent. J. Am. Chem. Soc. 2011, 133, 20164–20167. [Google Scholar] [CrossRef] [PubMed]
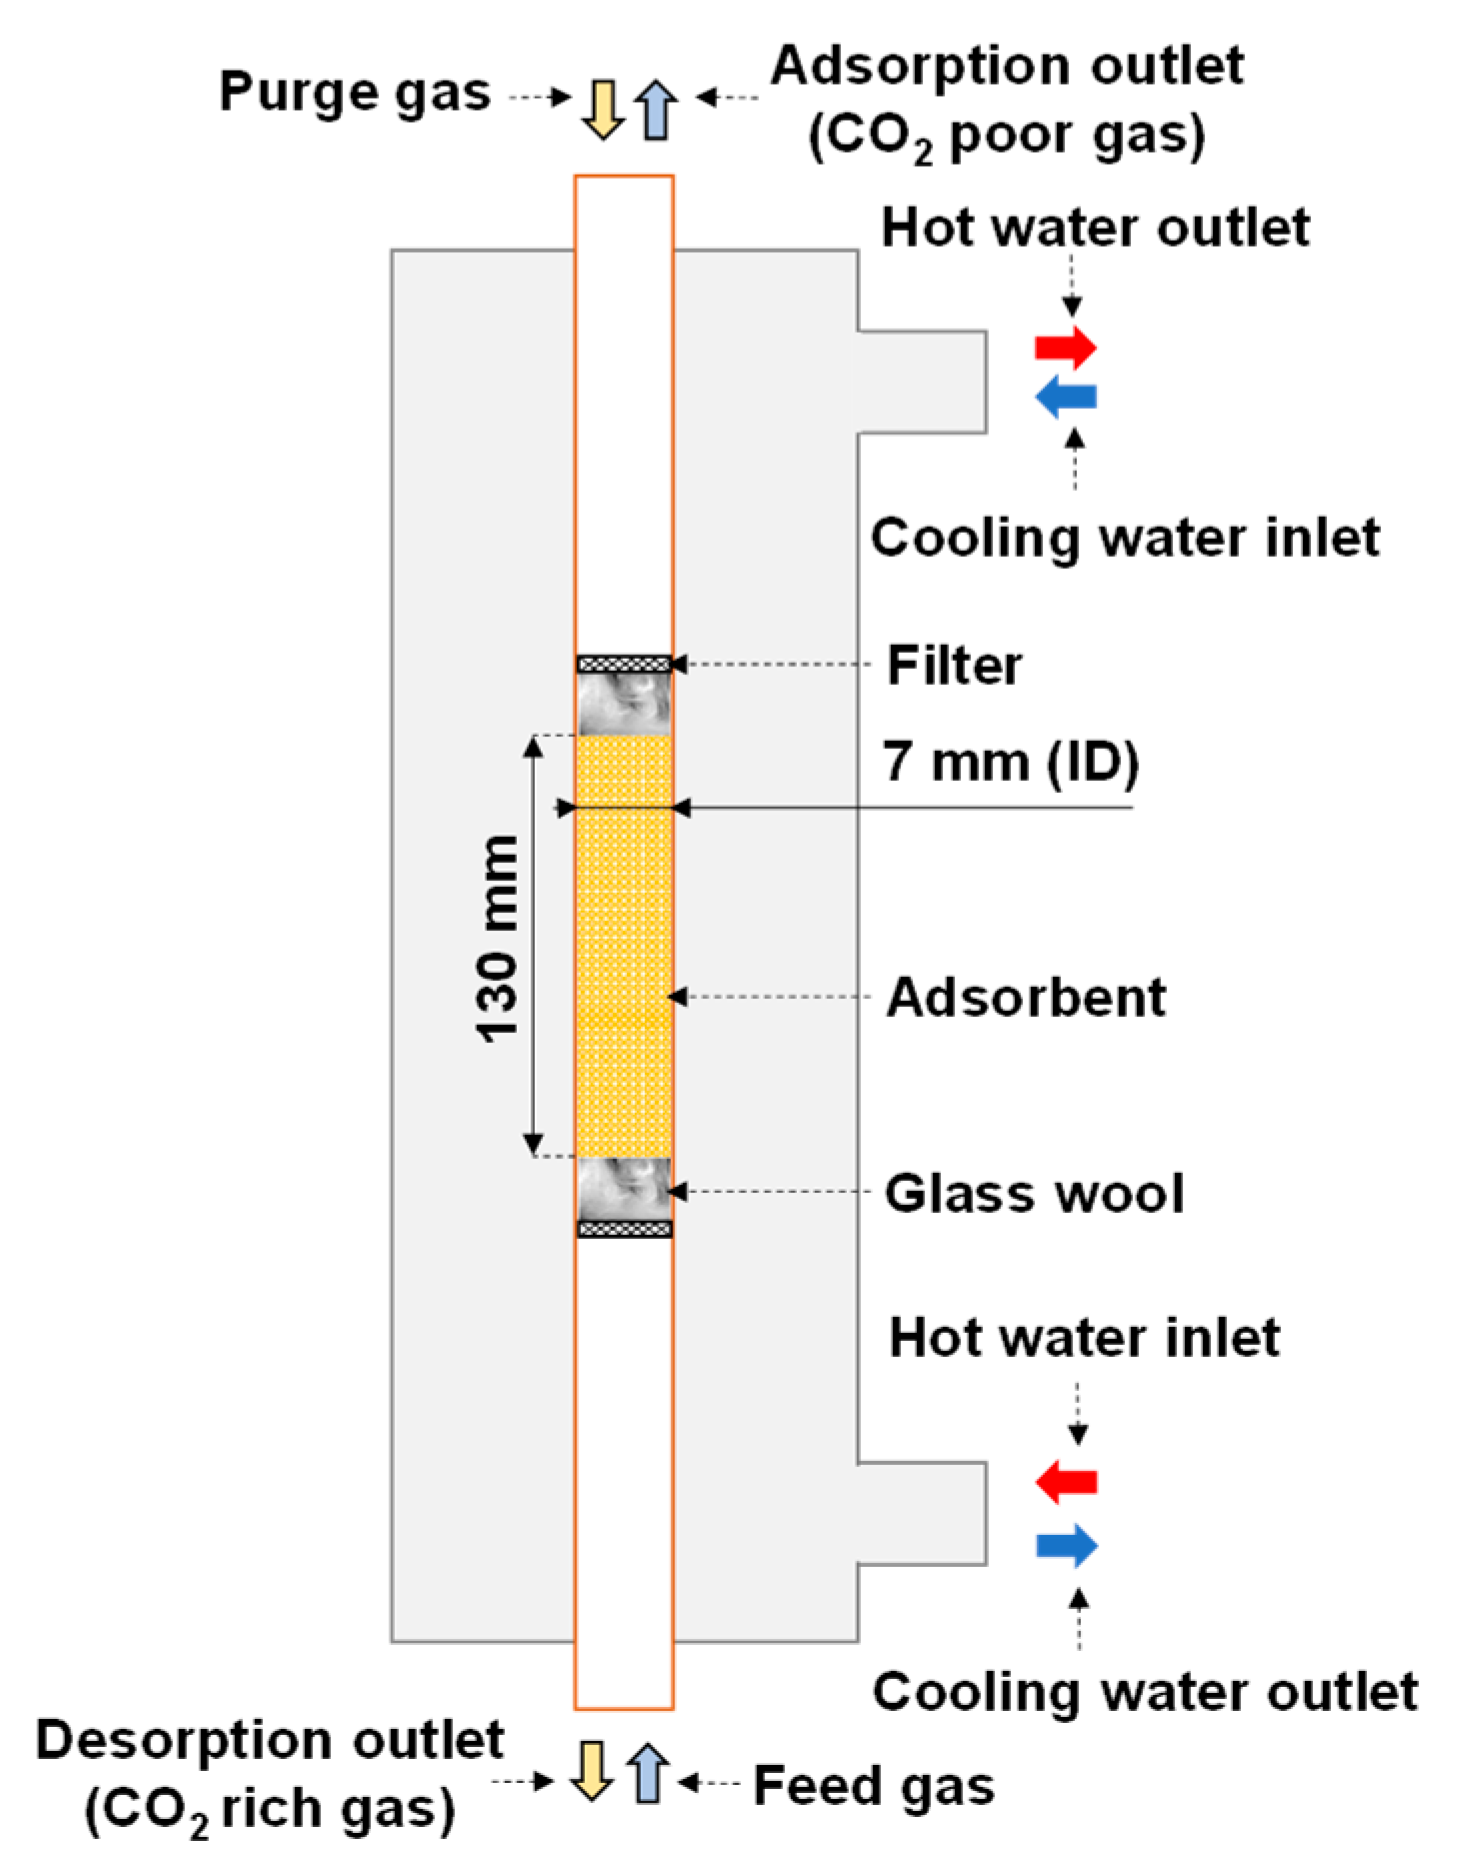
Figure 1. Schematic of double-pipe heat exchanger (reactor).
Separations 10 00415 g001
Figure 2. Breakthrough curve of CO2 adsorption.
Separations 10 00415 g002
Figure 3. Breakthrough curves of CO2 desorption.
Separations 10 00415 g003
Figure 4. Total amounts of CO2 adsorbed and desorbed, as obtained from the breakthrough curves.
Separations 10 00415 g004
Figure 5. Schematic of experimental apparatus for simple adsorption–desorption cycle.
Separations 10 00415 g005
Figure 6. Schematic of experimental apparatus for double-step adsorption.
Separations 10 00415 g006
Figure 7. Experimental procedure for double-step adsorption: (a) reactor I (desorption) and reactor II (adsorption), (b) refluxing desorption gas from reactor I to II, (c) reactor I (adsorption) and reactor II (desorption), and (d) refluxing desorption gas from reactor II to I.
Separations 10 00415 g007
Figure 8. Influence of cycle time on time-averaged CO2 concentrations at desorption outlet and CO2 recovery ratios (RUN#:1-5).
Separations 10 00415 g008
Figure 9. Time profiles of adsorption outlet CO2 concentrations (RUN#:1-5).
Separations 10 00415 g009
Figure 10. Time profiles of CO2 concentrations at desorption outlet (RUN#:1-5).
Separations 10 00415 g010
Figure 11. Effect of extending regeneration time beyond adsorption time on time-averaged CO2 concentrations at desorption outlet and CO2 recovery ratios (RUN#:2, 6-10).
Separations 10 00415 g011
Figure 12. Influence of adsorption/desorption and refluxing times on time-averaged CO2 concentrations at desorption outlet and CO2 recovery ratios.
Separations 10 00415 g012
Figure 13. Influence of regeneration air flow rate on time-averaged CO2 concentrations at desorption outlet and CO2 recovery ratios.
Separations 10 00415 g013
Figure 14. Influence of feed gas flow rate on time-averaged CO2 concentrations at desorption outlet and CO2 recovery ratios.
Separations 10 00415 g014
Figure 15. Time profiles of CO2 concentrations at adsorption outlet in double-step adsorption.
Separations 10 00415 g015
Figure 16. Time profiles of CO2 concentrations at desorption outlet in double-step adsorption.
Separations 10 00415 g016
Table 1. Experimental conditions for simple adsorption–desorption cycle.
RUN# Step Temperature
(°C)
Air Flow Rate
(L STP/min)
Air Humidity
Dew Point (°C)
Time
(min)
1Adsorption
Desorption
20
60
9.3
0.09
53
3
2Adsorption
Desorption
20
60
9.3
0.09
55
5
3Adsorption
Desorption
20
60
9.3
0.09
510
10
4Adsorption
Desorption
20
60
9.3
0.09
530
30
5Adsorption
Desorption
20
60
9.3
0.09
560
60
6Adsorption
Desorption
20
60
9.3
0.09
55
10
7Adsorption
Desorption
20
60
9.3
0.09
55
15
8Adsorption
Desorption
20
60
9.3
0.09
55
20
9Adsorption
Desorption
20
60
9.3
0.09
55
25
10Adsorption
Desorption
20
60
9.3
0.09
55
30
Table 2. Experimental conditions for double-step adsorption.
RUN# Step Temperature
( °C )
Air Flow Rate
(L STP/min)
Air Humidity
Dew Point ( °C )
Time
(min)
11-1Adsorption
Desorption
Refluxing
20
60
60 & 20
9.3
0.09
0.09
53
3
3
11-2Adsorption
Desorption
Refluxing
20
60
60 & 20
9.3
0.09
0.09
53
3
30
11-3Adsorption
Desorption
Refluxing
20
60
60 & 20
9.3
0.09
0.09
53
3
55
11-4Adsorption
Desorption
Refluxing
20
60
60 & 20
9.3
0.09
0.09
53
3
110
12-1Adsorption
Desorption
Refluxing
20
60
60 & 20
9.3
0.09
0.09
55
5
5
12-2Adsorption
Desorption
Refluxing
20
60
60 & 20
9.3
0.09
0.09
55
5
30
12-3Adsorption
Desorption
Refluxing
20
60
60 & 20
9.3
0.09
0.09
55
5
55
12-4Adsorption
Desorption
Refluxing
20
60
60 & 20
9.3
0.09
0.09
55
5
110
13-1Adsorption
Desorption
Refluxing
20
60
60 & 20
9.3
0.09
0.09
510
10
10
13-2Adsorption
Desorption
Refluxing
20
60
60 & 20
9.3
0.09
0.09
510
10
30
13-3Adsorption
Desorption
Refluxing
20
60
60 & 20
9.3
0.09
0.09
510
10
55
13-4Adsorption
Desorption
Refluxing
20
60
60 & 20
9.3
0.09
0.09
510
10
110
14-1Adsorption
Desorption
Refluxing
20
60
60 & 20
9.3
0.045
0.045
53
3
3
14-2Adsorption
Desorption
Refluxing
20
60
60 & 20
9.3
0.045
0.045
53
3
30
14-3Adsorption
Desorption
Refluxing
20
60
60 & 20
9.3
0.045
0.045
53
3
55
14-4Adsorption
Desorption
Refluxing
20
60
60 & 20
9.3
0.045
0.045
53
3
110
15-1Adsorption
Desorption
Refluxing
20
60
60 & 20
9.3
0.045
0.045
55
5
5
15-2Adsorption
Desorption
Refluxing
20
60
60 & 20
9.3
0.045
0.045
55
5
30
15-3Adsorption
Desorption
Refluxing
20
60
60 & 20
9.3
0.045
0.045
55
5
55
15-4Adsorption
Desorption
Refluxing
20
60
60 & 20
9.3
0.045
0.045
55
5
110
16-1Adsorption
Desorption
Refluxing
20
60
60 & 20
9.3
0.045
0.045
510
10
10
16-2Adsorption
Desorption
Refluxing
20
60
60 & 20
9.3
0.045
0.045
510
10
30
16-3Adsorption
Desorption
Refluxing
20
60
60 & 20
9.3
0.045
0.045
510
10
55
16-4Adsorption
Desorption
Refluxing
20
60
60 & 20
9.3
0.045
0.045
510
10
110
17-1Adsorption
Desorption
Refluxing
20
60
60 & 20
7.45
0.045
0.045
53
3
3
17-2Adsorption
Desorption
Refluxing
20
60
60 & 20
7.45
0.045
0.045
53
3
30
17-3Adsorption
Desorption
Refluxing
20
60
60 & 20
7.45
0.045
0.045
53
3
55
17-4Adsorption
Desorption
Refluxing
20
60
60 & 20
7.45
0.045
0.045
53
3
110
18-1Adsorption
Desorption
Refluxing
20
60
60 & 20
7.45
0.045
0.045
55
5
5
18-2Adsorption
Desorption
Refluxing
20
60
60 & 20
7.45
0.045
0.045
55
5
30
18-3Adsorption
Desorption
Refluxing
20
60
60 & 20
7.45
0.045
0.045
55
5
55
18-4Adsorption
Desorption
Refluxing
20
60
60 & 20
7.45
0.045
0.045
55
5
110
19-1Adsorption
Desorption
Refluxing
20
60
60 & 20
7.45
0.045
0.045
510
10
10
19-2Adsorption
Desorption
Refluxing
20
60
60 & 20
7.45
0.045
0.045
510
10
30
19-3Adsorption
Desorption
Refluxing
20
60
60 & 20
7.45
0.045
0.045
510
10
55
19-4Adsorption
Desorption
Refluxing
20
60
60 & 20
7.45
0.045
0.045
510
10
110
Disclaimer/Publisher’s Note: The statements, opinions and data contained in all publications are solely those of the individual author(s) and contributor(s) and not of MDPI and/or the editor(s). MDPI and/or the editor(s) disclaim responsibility for any injury to people or property resulting from any ideas, methods, instructions or products referred to in the content.