Abstract
Amitriptyline residue released into the aquatic ecosystem can have detrimental consequences on marine organisms and human wellbeing via consumption of polluted water. With a uniquely large surface area and abundant functionalities, graphene oxide adsorption offers a remediation solution for such water pollution. This study focused on synthesizing a novel graphene-based adsorbent via ice-templating of boron-doped graphene substrate. The batch adsorption performance of the as-synthesized adsorbent was explored by central composite design (CCD), while its potential large-scale application was evaluated with a packed-bed column study. The CCD optimized conditions of 12.5 mg dosage, 32 min adsorption time, 30 °C operating temperature and 70 ppm concentration produced the highest removal efficiency of 87.72%. The results of the packed-bed study indicated that continuous adsorption of amitriptyline was best performed at a graphene bed of 3.5 cm in height, with 100 ppm of the pharmaceutical solution flowing at 2 mL/min. Furthermore, the breakthrough curve was effectively portrayed by the Log Bohart–Adams model. The as-synthesized adsorbent showed a high regeneration potential using ethanol eluent via multiple adsorption–desorption cycles. The results suggest the boron-doped graphene adsorbent in packed-bed as a highly effective system to remediate amitriptyline in an aqueous environment.
1. Introduction
Pharmaceuticals are emerging pollutants that are increasingly being identified in the aquatic ecosystem owing to the growing consumption of medicinal products in recent years. The presence of such medicinal by-products in water sources is a serious concern as they can detrimentally impact the oceanic life and other organisms—specifically, amitriptyline (AMI) which is a tricyclic antidepressant (TCA) commonly applied for treating mental disorders (depression and anxiety) and other illnesses (migraine attack, nerve and back pain) [1]. While it can be effective for some individuals, over-exposure to AMI can cause unusual behaviour patterns, growth and hatching periods of some marine organisms, as well as pathological modifications in various living tissues [2]. Because its half-life ranges from 10 to 28 h in the human body, AMI is typically excreted along with urine and faeces in both pristine and metabolized forms [3]. The strong chemical structure and stable melting point confer AMI with unique resistivity against degradation under ambient conditions [4]. Consequently, traces of AMI have been detected in various watercourses located in China [5], United States [6], Canada [7], United Kingdom [8] and France [9] over the past 12 years.
Among multiple wastewater treatment techniques, adsorption is a promising remediation method for pharmaceutical wastewater owing to its high versatility and removal efficiency. It is a sustainable technique with a low energy requirement and high availability of a variety of adsorbents including biomass [10], activated carbon [11], biochar [12], zeolite [13] and graphene-based materials [14]. Lately, graphene oxide (GO) has been identified as the new generation of adsorbent for treating pharmaceutical wastewater owing to its ultra-high surface area and copious oxygen-rich sites (carboxyl, carbonyl, epoxyl and hydroxyl). Converting two-dimensional (2D) GO into a three-dimensional (3D) structure can create interconnected layers of GO macrostructure, thus resolving the water dispersity issue of the nanomaterial [15]. The 3D configuration can also enhance the adsorption feasibility of GO via prevention of aggregation and increased porosity, hence facilitating pollutant transfer into the GO active sites.
Three-dimensional GO adsorbents have versatile applications in wastewater remediation because of their large surface area, distinctive pore distribution and low interfacial tension [16,17]. However, pure 3D GO adsorbents have low structural stability and tend to disintegrate in aquatic medium. To overcome this constraint, the crosslinking method can be applied to enhance the structural and adsorption characteristics of the 3D GO [18]. Croscarmellose sodium (CCS), derived from citric acid, is a green and sustainable crosslinking agent that can effectively bridge the GO sheets. The active group of CCS (hydroxyl) can react with those of GO (carboxyl and hydroxyl) via hydrogen interactions to form a CCS-reinforced 3D GO adsorbent that is eco-friendly and non-toxic [19].
In addition, functionalization of the graphene structure with heteroatoms, such as nitrogen, sulphur, phosphorus and boron, can further improve the adsorption capability of the 3D GO adsorbent. The incorporation of heteroatoms into the GO lattice enables customization of the adsorbent properties. Specifically, boron possessing an atomic structure similar to carbon can cause lattice distortion and alteration of graphitization degree, electronic and mechanical properties [20]. For instance, oxytetracycline was removed by both GO and boron-doped reduced GO (B-rGO), amounting to 86% and 100% removal efficiencies, respectively [21]. The elimination of functional groups in the B-rGO caused a greater polarization of the π system, leading to relatively strong π–π and electron–donor–acceptor (EDA) interactions, thus enhancing the adsorption capacity of B-rGO. To date, there are no published data on the elimination of AMI by B-doped GO-based adsorbent.
Although the majority of GO adsorption studies were based on batch mode, it is not favorable for treating large volumes of wastewater [22]. A continuous adsorption mode, such as fixed-bed column, is a more practical approach. Fixed-bed column adsorption is typically applied in the industry owing to its cost-effectiveness, flexibility in continuous operation and ease of upscaling. To evaluate the column parameters, the experimental breakthrough data can be fitted to dynamic column correlations such as the Bohart–Adams, Thomas, and Yoon–Nelson models [23]. There are very limited published data on the adsorption of pharmaceuticals onto fixed-bed columns; for instance, tetracycline adsorption onto biochar fixed-bed columns [24], metformin onto silica-alumina composite fixed-bed columns [25], and diclofenac and naproxen onto sugarcane ash-polyethylene terephthalate fixed-bed columns [26].
In this project, an innovative boron-grafted 3D GO adsorbent crosslinked with CCS (3D/BGO) was prepared for the adsorptive removal of AMI in aquatic systems. The interactive impacts of adsorption parameters (adsorbent dosage, AMI concentration, temperature and initial pH) and the optimized parameters for the highest AMI adsorption were established by central composite design (CCD) as it can provide accurate predictions of linear and quadratic interactive impacts [27]. A packed-bed column study was also executed to assess the 3D/BGO potential in continuous adsorption of wastewater, whereby the influences of adsorbent height, inlet flowrate and concentration were investigated. The novel AMI-3D/BGO continuous adsorption system was further assayed by regressing the laboratory acquired data to several theoretical adsorption models.
2. Materials and Methods
2.1. Materials
The research materials were acquired from various suppliers as follows: graphite and CCS (C8H16NaO8, 263.20 g/mol, 99%) from Sigma Aldrich, Darmstadt, Germany; AMI hydrochloride (98%) from Tokyo Chemical Industry, Tokyo, Japan; potassium permanganate (KMnO4, 98%), sodium nitrate (NaNO3), hydrochloric acid (HCl, 37%) and sodium hydroxide (NaOH, 99%) from R&M, Subang Jaya, Malaysia; sulphuric acid (H2SO4, 98%), hydrogen peroxide (H2O2, 30%), boric acid (H3BO3, 99%), acetonitrile (HPLC grade) and formic acid (HPLC grade) from Fisher Scientific, Fair Lawn, NJ, USA. All chemical reagents used were of analytical grade, unless otherwise stated. These materials were applied in the experiments without any further purification.
2.2. Preparation of GO
The preparation of GO was based on the improved Hummers technique involving the oxidation of graphite powder by concentrated H2SO4 and KMnO4 [28]. Concisely, 46 mL of concentrated H2SO4 was added to 2 g of graphite and 1 g of NaNO3 placed initially in a glass flask. Agitation of the mixture was performed for 150 min while the solution was maintained below 6 °C in a cooler bath. Then, 6 g of KMnO4 was introduced into the mixture with continuous agitation for another 60 min. The temperature of the suspension was increased to 35 °C and 92 mL of deionized water was added into the mixture. Next, 280 mL of deionized water was introduced under mechanical stirring for 30 min. For termination of the reaction, 20 mL of H2O2 solution was introduced under continuous stirring for 30 min. The final product formed was filtered and washed repeatedly with 0.1 mol/L HCl solution and deionized water until a pH of 7 was detected. The GO flakes collected were dried at 55 °C for 24 h.
2.3. Preparation of 3D/BGO Adsorbent
The 3D/BGO adsorbent was prepared by ultrasonically dispersing 1 g of GO in 250 mL of H3BO3 solution for 120 min. The mixture was poured into a reflux flask for treatment at 90 °C, overnight. The unreacted H3BO3 was washed using deionized water via centrifuge and the synthesized BGO was dried at 60 °C. Thereafter, 0.1 g of dried BGO was dispersed in 50 mL of deionized water. Then, 1 g of CCS was added into the mixture and it was mechanically stirred for 12 h. The homogenous mixture was frozen and then freeze dried overnight to produce the desired adsorbent, labelled as 3D/BGO.
2.4. Characterization Tests
The surface structural properties of GO, BGO, and 3D/BGO were evaluated by a field-emission scanning electron microscope (FESEM, Quanta 400F, Amsterdam, Netherland), while the elemental composition was determined by an energy-dispersive X-ray spectroscope (EDX, Oxford-Instruments INCA 400, Oxford, UK). The 3D/BGO adsorbent was subjected to thermogravimetric analysis (TGA, Mettler Toledo, Greifensee, Switzerland) to determine its thermal features. The chemical active groups in the 3D/BGO adsorbent were identified by a Fourier transform infrared spectroscope (FTIR, Spectrum RXI Perkin Elmer, MA, USA). The FTIR spectrum of the adsorbent was detected and recorded in the IR ranging from 4000 to 400 cm−1 at an image resolution of 2 cm−1. The chemical state of elements and bonds of functional groups were evaluated by an X-ray photoelectron spectroscope (XPS, Axis Ultra DLD, Kratos/Shimadzu, Kyoto, Japan) fitted with a focused monochromatic AlKα source (hν = 1486.68 eV, 400 μm spot size).
2.5. HPLC Analysis
Initially, an AMI starting solution of 500 ppm was made by mixing 255 mg of AMI hydrochloride in 500 mL of ultrapure water. The starting AMI solution was subsequently diluted to the required working concentrations for the adsorption tests.
The sample solution after each adsorption test was collected and passed through a polytetrafluoroethylene (PTFE) membrane syringe filter (45 μm pore size). The filtrate was collected in a 2 mL screw-neck vial. The AMI concentration in the collected sample solutions was measured by high-performance liquid chromatography (HPLC 1260, Agilent Technologies, Santa Clara, CA, USA) with an ultra-violet (UV) detector and C18 sampling column (4.6 × 100 mm and 3.5 μm pore size, Zorbax Eclipse Plus C18, Agilent Technologies, Santa Clara, CA, USA). The analysis temperature was 40 °C and the detection wavelength was 250 nm. The mobile phase contained 60% acetonitrile and 40% of 0.1% formic acid.
The removal efficiency (R, %) of 3D/BGO was calculated based on Equation (1).
where = equilibrium AMI concentration (ppm) and = initial AMI concentration (ppm).
2.6. CCD Experimental Design and Modeling
The empirical model representing AMI adsorption onto the 3D/BGO adsorbent was formed based on interactive influences of process variables. As such, a four-factor and five-level CCD with a single response was employed, whereby the variables were dosage (A, mg), contact time (B, min), initial AMI concentration (C, ppm) and temperature (D, °C), while removal efficiency (R, %), was the responding parameter in this study. The randomized runs of experimental design generated according to the CCD model are depicted in Table 1. The relationship between R and the independent variables was determined by correlating the experimental data to a polynomial mathematical equation. The significance of the generated model and its term was determined by analysis of variance (ANOVA) based on the probability value (p-value) and Fisher’s test value (F-value) at a confidence level of p < 0.05. Moreover, the accuracy and predictability of the model were assayed by lack-of-fit criterion, correlation coefficient (R2), adjusted R2, predicted R2, adequate precision, and normalized residue plots.

Table 1.
CCD matrix for AMI uptake by 3D/BGO.
2.7. Fixed-Bed Adsorption Tests
The fixed-bed adsorption of AMI was performed in a borosilicate glass column of 10 mm internal diameter and 300 mm in length. At first, the column was filled with a specific mass of 3D/BGO adsorbent to achieve the desired bed depth. To prevent any loss of the adsorbent and to ensure uniform liquid flow, the 3D/BGO bed was sandwiched between two layers of glass beads, each layer about 1 cm high. Thereafter, an AMI solution of known inlet concentration was continuously fed into the column. At specific time intervals, the sample effluent was collected at the bottom of the column which was then detected by the HPLC for AMI concentration measurement. The influence of bed depth on continuous AMI adsorption was examined at 3–3.5 cm beds corresponding to 0.1–0.125 g of the adsorbent. The influences of inlet AMI concentration and flowrate were assayed at 50–100 ppm and 2–3 mL/min, respectively.
2.8. Column Adsorption Modeling
The column adsorption performance was represented by a curve of concentration at specific time to initial concentration ratio (Ct/C0) against the operational time (t, min). The essential parameters for the column were breakthrough time (tb), exhaustion time (te) and the shape of the dynamic curve. The values of tb and te were established by examining the breakthrough curve to locate the points at which Ct/C0 reached 0.05 and 0.95, respectively.
The amount of AMI adsorbed by the 3D/BGO bed (mads, mg) and the adsorption capacity of the column (q, mg/g) are expressed by Equations (2) and (3).
where Q = feed flowrate (mL/min) and m = mass of 3D/BGO adsorbent (mg).
Three continuous adsorption models were chosen to correlate the column performance of the 3D/BGO adsorbent, and these included the Thomas, Yoon–Nelson and Bohart–Adams models. Furthermore, modified adsorption models involving a logarithm transformation of the original equations were also applied to correlate the experimental breakthrough data. It has been reported that the use of such modified models can provide a better regression of breakthrough curves, particularly those with an asymmetric pattern, as well as a more accurate prediction of tb and te [29]. Hence, to improve the data fitting, the log Thomas, log Yoon–Nelson and log Bohart–Adams models (Table 2) were applied.
Table 2.
Fixed-bed models.
2.9. Regeneration Test
The reuse potential of the 3D/BGO adsorbent was evaluated by performing several consecutive adsorption and desorption tests. The initial adsorption was performed by contacting 10 mg of 3D/BGO with 50 mL AMI solution for 4 h at 30 °C. The AMI-containing 3D/BGO adsorbent was subsequently eluted with deionized water to eliminate any loose AMI residue. Thereafter, 50 mL of ethanol was introduced to the saturated adsorbent and the suspension was stirred for 4 h to eluate the AMI molecules. The regenerated 3D/BGO adsorbent was then treated with deionized water and reapplied in a subsequent adsorption test.
3. Results and Discussion
3.1. Characterization of GO
3.1.1. FESEM Analysis
The FESEM characterization was executed to establish the morphological property of the as-synthesized adsorbent. The acquired FESEM images are depicted in Figure 1a,b for GO and BGO, respectively. In comparison with GO, the surface of BGO is less smooth, with more cracks and tiny protruding surfaces possibly formed during the synthesis steps of exfoliation and doping with boric acid. These unique surface features could augment the adsorbent exposed area, potentially enhancing the uptake of AMI [31]. Figure 1c,d illustrate the 3D/BGO before and after AMI adsorption, respectively. It could be seen that the structure of 3D/BGO appeared as thin sheets with wrinkled edges intertwined into a macrostructure of irregular interlayer spacing. The irregular bridging of BGO layers created a relatively robust porous adsorbent containing open channels and pores. The uniquely created surface morphology might cause more AMI molecules to transport into the inner structure of the 3D/BGO adsorbent, hence increasing the adsorption capacity. The FESEM observation of the as-synthesized adsorbent indicated that CCS and the ice-templating method were successfully applied to transform 2D GO into 3D BGO adsorbent doped with boron atoms. Further surface modification occurred after the adsorption of AMI, as illustrated in Figure 1d, whereby the adsorbent surface became smoother with lesser wrinkled edges owing to the interaction with AMI molecules.
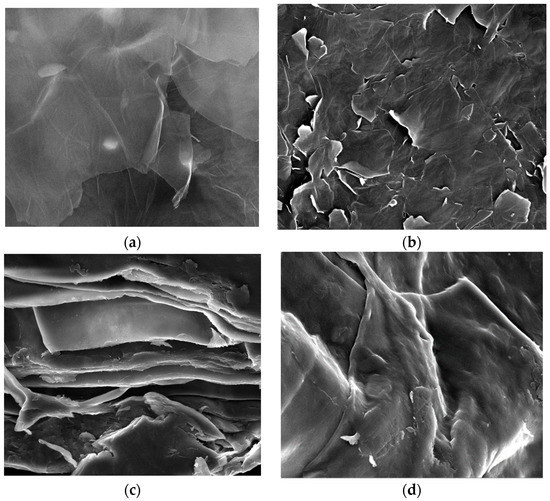
Figure 1.
FESEM images for (a) GO (×50,000), (b) BGO (×50,000), and (c) 3D/BGO before (×2500) and (d) after (×2500) AMI adsorption (×magnifications).
3.1.2. EDX Analysis
The chemical constituents of GO, BGO, and 3D/BGO were studied using EDX and the results are reflected in Figure 2 and Table 3. The existence of carbon (C), oxygen (O), and boron (B) in the samples was confirmed by the various elemental % shown in Table 3, while the successful grafting of boron into the GO structure was supported by the boron peak appearing in the EDX spectra (Figure 2). Furthermore, the intercalation of CCS within the adsorbent was also confirmed by a sodium (Na) peak located in the EDX spectrum of 3D/BGO (Figure 2b). The composition of boron before adsorption (12.92%) and after adsorption (12.64%) remained almost constant, indicating that boron was firmly integrated within the adsorbent, without any significant amount leaching out during adsorption. Interestingly, a comparison between the C/O ratio of GO (1.87) and that of BGO (3.72) suggested that the oxygen reduction could be due to the substitution of oxygen by boron during the doping formulation stage [32]. Moreover, the marked increase in carbon after adsorption (52.71% to 72.52%) indicated the successful adsorption of AMI onto the adsorbent active sites.
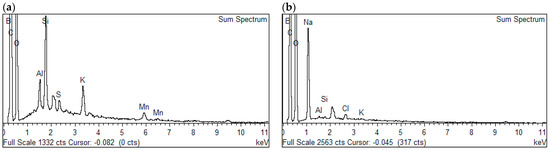
Figure 2.
EDX spectra of (a) BGO and (b) 3D/BGO.
Table 3.
Elemental compositions of GO and boron-doped GO.
3.1.3. TGA
TGA is a useful technique for investigating the thermal decomposition behaviour of an adsorbent. The thermal decomposition plot of the 3D/BGO adsorbent is shown in Figure 3. The thermogram for 3D/BGO consisted of four major steps, wherein the first step (37–106 °C) was the removal of moisture of approximately 12.5 wt%. The second and third steps (106–809 °C) involved the devolatilization of 3D/BGO. In the second step from 106 to 316 °C, the thermal degradation of oxygenated groups and depolymerization of functional groups including the glycosidic chain and carboxyl groups of CCS [33] occurred, while further volatile matter was decomposed in the third step (316–809 °C). The existence of this step in the thermogram for 3D/BGO implied that CCS was incorporated into the adsorbent. The total volatile matter in the adsorbent was approximately 62.3 wt%. In the final step, negligible weight loss was experienced and the sample weight became constant at 960 °C. As compared with GO, 3D/BGO has better thermal stability with a higher moisture content and final weight [34]. Therefore, the incorporation of boron into the graphene lattices enhanced the thermal stability of the 3D GO structure.
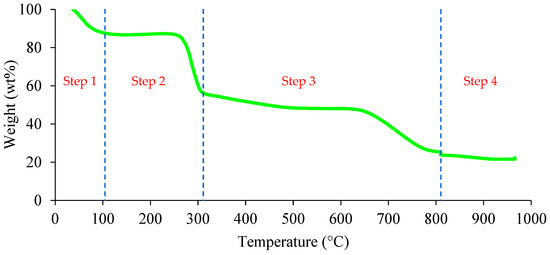
Figure 3.
TGA plot of 3D/BGO.
3.1.4. FTIR Analysis
To determine the chemical functional groups of the 3D/BGO adsorbent, FTIR spectra were measured for the adsorbent before and after the adsorption of AMI. Figure 4 displays the FTIR spectrum, while the identification of peaks is shown in Table 4. From these results, it could be observed that the 3D/BGO adsorbent consisted of numerous oxygenated active groups that could act as the binding sites for AMI. The major decrease in the peak at 3218 cm−1 and its movement to 3205 cm−1 after adsorption suggested that the O–H stretching was impacted by AMI attachment [35]. There were also minor changes in the FTIR peaks at 2921 and 1583 cm−1 after AMI adsorption, which were related to C–H and C=C stretching, respectively [36,37]. However, major differences in the FTIR peaks were observed at these wavenumbers: 1414, 1324, 1056 and 1022 cm−1, assigned to O–H bending and C–O stretching [38]. The shifting and disappearance of these peaks could be due to the interaction of these oxygen-rich groups with AMI molecules. Clearly, the adsorption of AMI was affected by oxygen-containing functional groups, specifically hydroxyl and carboxyl, which were the primary active sites for adsorption.
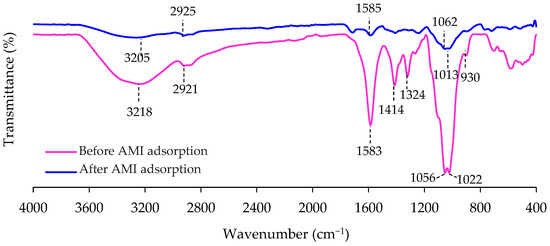
Figure 4.
FTIR spectra of 3D/BGO before and after AMI adsorption.
Furthermore, the peaks between 930 and 1284 cm−1 were attributed to stretching of several single bonds such as C–N, C–B and B–O, and residue C–O formed after doping of GO with boron [39]. After AMI adsorption, these peaks have disappeared and shifted, implying the role of boron-based groups in immobilizing AMI adsorbates. Because hydroxyl, carboxyl and boron-based groups were the main functional groups affected by the AMI sequestration, it can be inferred that the adsorption process occurred via the interaction of AMI with the 3D/BGO chemical active groups [40].
Table 4.
Identification of FTIR peaks for 3D/BGO adsorbent before and after AMI adsorption.
Table 4.
Identification of FTIR peaks for 3D/BGO adsorbent before and after AMI adsorption.
| Wavenumber Range (cm−1) | Bond | Wavenumber (cm−1) | Reference | |
|---|---|---|---|---|
| Before Adsorption | After Adsorption | |||
| 3200–3550 | O–H stretching | 3218 | 3205 | [39,41,42] |
| 2840–3000 | C–H stretching | 2921 | 2925 | |
| 1566–1650 | C=C stretching | 1583 | 1585 | |
| 395–1440 | O–H bonding | 1414 | - | |
| 1310–1390 | O–H bending | 1324 | - | |
| 1300–1000 | C–O stretching | 1056 | 1062 | |
| 1022 | 1013 | |||
| 930–1284 | C–N, C–B, B–O stretching | 930 | - | |
3.1.5. XPS Analysis
The chemical state of elemental species and functional group bonds of GO and 3D/BGO were studied by XPS. Figure 5 represents the deconvoluted XPS spectra for GO (C1s and O1s) and 3D/BGO (C1s, O1s, and B1s).
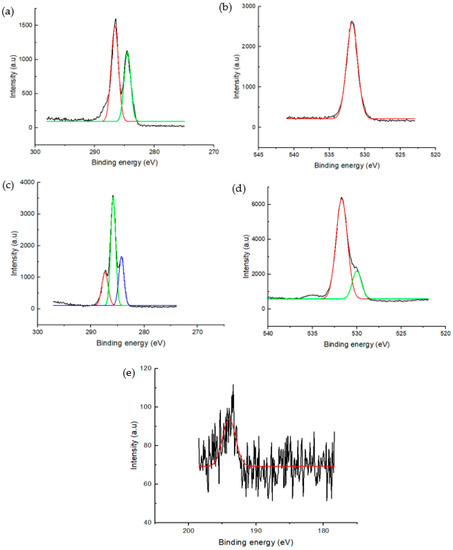
Figure 5.
Deconvoluted XPS spectra for (a) C1s and (b) O1s spectra of GO, and (c) C1s, (d) O1s, and (e) B1s spectra of 3D/BGO.
As shown in Figure 5, both GO and 3D/BGO exhibited functional groups comprising carbon and oxygen, while boron-based functional groups were found in 3D/BGO. Hence, the results confirmed the successful doping of boron into GO. Moreover, the peak intensity of O1s was the highest, followed by that of C1s and B1s. This suggested that the primary functional groups of 3D/BGO were contributed by oxygen-containing groups, followed by carbonaceous and boron-based groups.
The deconvoluted C1s spectra revealed that GO possessed functional groups of C–C and C–O corresponding to binding energies of 284.10 and 286.31 eV, respectively [43]. Similarly, the 3D/BGO adsorbent exhibited carbonaceous functional groups such as the COOH (288.2 eV), C–C (285.77 eV) and C–O groups (284.25 eV) [44]. The O1s spectra shown in Figure 5b,d revealed that GO possessed the O–C groups (531.75 eV) while 3D/BGO contained the O–C and O=C groups, as evident by the peaks at 531.65 and 530.01 eV, respectively [43]. The B1s spectra revealed that the 3D/BGO adsorbent has a characteristic peak at 193.10 eV upon deconvolution, and this was ascribed to the presence of BCO2 groups [45]. This study indicated the presence of bonding between boron, oxygen and carbon atoms, thus initiating the AMI adsorption mechanism through interactions with boron–oxygen–carbon groups in 3D/BGO.
3.2. CCD Model Generation
3.2.1. Model Verification
The generated CCD model representing AMI adsorption onto 3D/BGO is shown in Equation (4), which expresses R (%) as a function of dosage (A), contact time (B), AMI concentration (C), and temperature (D) in actual units. The interactive effects between the adsorption factors and response were analyzed by ANOVA and the obtained findings are summarized in Table 5. The calculated absolute residues ranged from 0.064 to 5.490. The results indicated that the predicted data (Rpred) were well correlated to the actual experimental data (Ract), as illustrated in Figure 6a, which proved the validity of the generated model.
Table 5.
ANOVA for model development of AMI adsorption onto 3D/BGO.
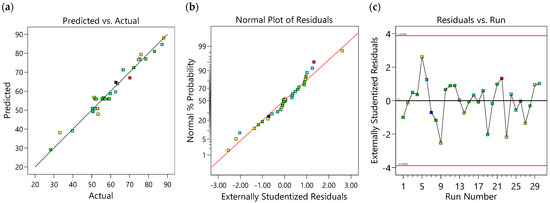
Figure 6.
(a) Predicted vs. actual, (b) normal plot of residuals, and (c) residual vs. run plots.
The significance of the model and each model term was ascertained based on the p-value, F-value, coefficient of variance (C.V.), adequate precision, and R2, which are tabulated in Table 5. A p-value < 0.05 indicates the statistical significance of the model term at a 95% confidence limit, and terms with smaller p-values have higher significance in the model. As could be seen from Table 5, the model and A, B, C, C2, and D2 terms were statistically significant. The C.V. value of 6.32%, which is lower than 10%, indicates the repeatability of the model. Additionally, a desired ratio of adequate precision greater than 4 signifies a higher ratio of response signal to noise. Here, the adequate precision for this model was 21.70 and, as such, the model could be used for navigation of the design space.
The low F-value (F-value = 1.61) implies that the lack of fit is not significant relative to the pure error. Hence, the model had a good fit to the experimental response. The high R2 value (0.9640) suggested that this model could explain 96.40% of the total deviation. The values of adjusted R2 (0.9304) and predicted R2 (0.8294) were close to R2, with a mere difference of 0.0336 and 0.1346, respectively. This implies that each term was significant in the generated model.
The adequacy of the model can be further validated by diagnostic plots such as the normal percentage distribution versus externally studentized residues (Figure 6b). The linear pattern of the plot showed low variance, which suggested goodness of fit of the predicted model and confirmed that normally distributed error terms existed [46]. Therefore, the model could be used to describe the adsorption of AMI onto 3D/BGO without model reduction. Figure 6c delineates the residual vs. run plot for the adsorption of AMI onto the 3D/BGO adsorbent. The externally studentized residuals were randomly distributed for all experimental runs. It was also observed that the residual magnitudes fell within the limits. The magnitude of the residual of each experiment allows the identification of potential outliers when the magnitude surpasses the general threshold of ±4% standard deviation. As there were no outliers found, the model was deemed accurate for the adsorption of AMI onto the 3D/BGO adsorbent.
3.2.2. Response Surface Analysis and Process Optimization
Three-dimensional response surface plots were used to assess the simultaneous effects of two factors on R (%), while the other two factors were kept at their optimum conditions. The surface response plots for the interactions between dosage (A, mg), time (B, min), initial concentration (C, ppm) and temperature (D, °C) are depicted in Figure 7.
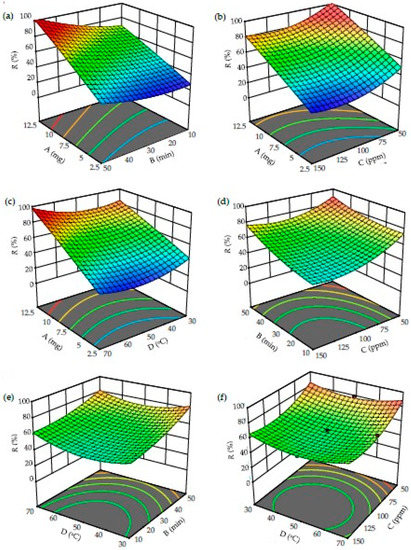
Figure 7.
Three-dimensional surface plots from the CCD model: Effect of (a) dosage and contact time, (b) dosage and concentration, (c) dosage and temperature, (d) time and concentration, (e) temperature and time, and (f) temperature and concentration for AMI removal by 3D/BGO.
As illustrated in Figure 7a–c, increasing A resulted in an increase in R for all cases. This increasing trend could be caused by the increased number of active sites for adsorption, leading to higher removal of AMI [47]. In Figure 7a, R was increased when both A and B were increased. Based on Figure 7b, a higher value of R was attained when there was an increase in A and a decrease in C. Figure 7c demonstrates a substantial increase in R as both A and D were incremented. Overall, a higher R could be achieved when A > 7.5 mg, C < 150 ppm, B > 30 min, and D < 70 °C.
The impacts of B on the adsorption of AMI onto the 3D/BGO adsorbent are shown in Figure 7a,d,e. In all cases, R demonstrated an increasing trend as B was increased. The chances of successful attachment on the sorption sites were higher when the contact period was longer, thus improving the overall removal performance. Therefore, based on these plots, the contact time suggested for the best AMI removals by 3D/BGO was B > 30 min.
The interactive plots of C with other parameters are depicted in Figure 7b,d,f. The parameter C imposed a negative impact on the adsorption of AMI. The reducing pattern in R could be due to the saturation of limited active sorption sites by AMI at higher concentrations. The response surface plots also revealed that the higher R occurred at A > 12.5 mg, C < 150 ppm, B > 10 min, and D < 70 °C.
The simultaneous impacts of D with other parameters are shown in Figure 7c,e,f. According to Figure 7c, R was maximized when D > 50 °C and A > 7.5 mg. However, Figure 7e,f shows that R exhibited an increment in two divergent temperature regions, specifically at both lower (30 °C) and higher temperatures (70 °C). Generally, D demonstrated minimal influence on R within the range of temperatures in this study. Hence, the desirable conditions to obtain a high R were A > 7.5 mg, C < 90 ppm, B > 10 min, and 30 °C > D > 70 °C.
The adsorption of AMI onto the 3D/BGO adsorbent was optimized by Derringer’s desirability function (di) using R (%) as the response. Based on the multivariate optimization algorithm, the optimization criteria were set to within the study ranges for adsorbent dosage (A), contact time (B) and concentration (C), with a minimized level of temperature (D) to maximize the R. The optimum parameters were determined as follows: A = 12.5 mg, C = 70 ppm, D = 30 °C, and B = 32 min, with the highest di (1) obtained along with a removal efficiency of 87.72%. The results predicted from the model were validated by triplicate experiments under these optimum conditions. The experimental validation highlighted an error deviation of 2.32% between the predicted R and measured R at the optimum conditions, which indicated the high accuracy of the optimization model.
3.3. Fixed-Bed Column Studies
3.3.1. Effect of Column Parameters
There are several column parameters that could affect AMI adsorption onto the fixed-bed column, and these include influent concentration, bed height and feed flowrate. The effect of influent concentration was investigated at 50 and 100 ppm. The results of altering the influent concentration are depicted in Figure 8a and Table 6. The tb of both concentrations were around 10 min; however, the te was shortened from 1410 to 1290 min as the influent concentration was increased from 50 to 100 ppm. This observation could be explained by the higher concentration facilitating the transport of AMI into the 3D/BGO adsorbent, leading to the earlier saturation of the column [30]. The amount of AMI adsorbed by the 3D/BGO bed was increased from 30.86 to 55.90 mg with the increasing AMI concentration. A higher influent concentration created a stronger driving force to enhance the AMI uptake by the 3D/BGO bed. Thus, the adsorption capacity (q) was increased at a higher influent concentration.
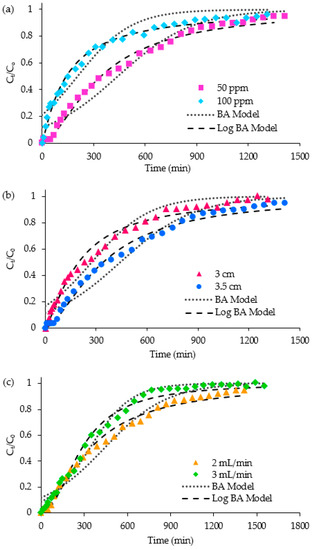
Figure 8.
Breakthrough curve at varying (a) influent concentration, (b) bed height, and (c) feed flowrate.
Table 6.
Column data for 3D/BGO adsorbent.
The continuous AMI adsorption was conducted at different bed heights of 3 and 3.5 cm, where the other column parameters were kept constant (concentration of 50 ppm and flowrate of 2 mL/min). The breakthrough curve of the taller bed portrayed a more gradual curve, indicating a broadened mass transfer zone (MTZ), as shown in Figure 8b. The te extended from 1310 to 1410 min. The difference between tb and te, namely the length of MTZ, was elongated owing to the greater bed height. Thus, using a taller bed, a large quantity of AMI solution could be treated. As shown in Table 6, bed heights of 3 and 3.5 cm corresponded to 30.86 and 45.66 mg of 3D/BGO, respectively, explaining that more AMI could be adsorbed at greater bed heights. More adsorbent (0.125 g) was included in the greater bed height, providing a larger surface area and more sorption sites for the removal of AMI. As the bed height was increased, the interaction duration between the adsorbent and the adsorbate increased, thus leading to better adsorption. The adsorption capacity was improved from 308.57 mg/g at 3 cm to 365.32 mg/g at 3.5 cm (Table 6).
In addition, the effect of feed flowrate was analyzed at different feed flowrates of 2 and 3 mL/min, while keeping the concentration fixed at 50 ppm, bed height at 3.5 cm, and dosage at 0.125 g. The dynamic adsorption data as tabulated in Table 6 show that the amount of AMI adsorbed was decreased from 51.73 to 45.66 mg as the feed flowrate was reduced from 3 to 2 mL/min. The breakthrough curves in Figure 8c indicated that the MTZ of a higher flowrate was broadened with a tb of 10 min and te of 1550 min. Both tb and te were increased from 20 to 10 min and 1410 to 1550 min, respectively. Likewise, the adsorption capacity showed an upward trend (365.32 to 413.83 mg/g) as the flowrate was increased from 2 to 3 mL/min.
On the whole, it was found that the column adsorption capacity for AMI was enhanced at a higher inlet concentration, bed height and feed flowrate. As in Table 6, a maximum adsorption capacity of 447.24 mg/g was achieved at a column height of 3.5 cm, concentration of 100 ppm and feed flowrate of 2 mL/min (Case 2).
3.3.2. Breakthrough Curve Modelling
The non-linear Thomas, Yoon–Nelson and Bohart–Adams models were used to fit the breakthrough data obtained at different inlet concentrations, bed heights and feed flowrates. These corresponding models were then compared to their logarithm transformation models, as demonstrated in Figure 8, with the variables summarized in Table 7. The modified models, namely, the Log Thomas, Log Yoon–Nelson and Log Bohart–Adams models, were found to be capable of providing robust fitting to different sets of studies with reasonable values of the residual root mean square error (RRMSE).
Table 7.
Parameters of fixed-bed models at various column conditions.
For the Bohart–Adams model and its modified logarithm form consisting of similar parameters, the rate coefficient (kBA) values were higher when the flowrate was increased, but the concentration and dosage were decreased. The larger value of kBA indicated the faster rate of AMI uptake due to the lower resistance of diffusion. Comparing the two equations of Bohart–Adams models, the overall R2 values of Log Bohart–Adams are greater than those of Bohart–Adams. However, as the R2 value lacked sufficient validation for distinguishing between non-linear models, RRMSE was supplemented as a proof of the standard error of the residuals. Generally, a smaller value of RRMSE denotes a better fit for the curve. It was determined that the RRMSE for the Bohart–Adams model was higher, indicating that it had higher deviation of the data points from the fitted curve. As shown in Figure 8, the modification of the Bohart–Adams model has enhanced the ability to fit the asymmetric breakthrough curves, thus providing a more reliable estimation of tb and te.
With the dosage of 3D/BGO adsorbent included in the system, both Thomas and its modified models were selected for data fitting. The Thomas rate coefficient (kTH) is an empirical parameter based on an ideal surface reaction mechanism [22]. The kTH values, as summarized in Table 7, were generally higher when the flowrate was increased, but the concentration and dosage were decreased. The kTH values signified a greater AMI adsorption rate in the reaction. In contrast, the q0 values increased when the flowrate was decreased, but the concentration and dosage were increased.
Overall, the column data were better represented by the modified models of logarithm transformation [29]. The Log Bohart–Adams model has effectively portrayed the asymmetric breakthrough curves for the adsorption at different column parameters, as shown in Figure 8a–c. Generally, a higher adsorption capacity and longer breakthrough time were achievable using a longer bed and lower initial concentration.
3.4. Regeneration
The costs of developing new adsorbents and disposal of spent adsorbents are the major factors governing the viability of the adsorption process [48]. Hence, regeneration of spent adsorbents can assist in minimizing cost and pollution. Generally, an eluting agent is applied to break the bonds between the adsorbent and adsorbate during regeneration [49]. In this study, pure ethanol was applied to regenerate the 3D/BGO adsorbent. The AMI adsorption efficiency of the 3D/BGO adsorbent for four adsorption cycles is demonstrated in Figure 9. Ethanol showed high removal efficiencies for the second and third adsorption cycle of 81.37% and 55.51%, respectively. Therefore, ethanol was a promising desorbing agent to remove AMI from the 3D/BGO adsorbent owing to its high regeneration efficiency.
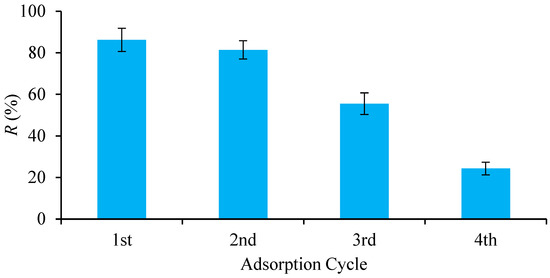
Figure 9.
Removal efficiency of 3D/BGO at the first, second, third, and fourth cycle.
After four cycles, however, the adsorption efficiency of AMI using ethanol eluent decreased from 86.20% to 24.33%. The decreasing efficiency might be due to the loss of the 3D/BGO adsorbent in small fragments during the adsorption–desorption study. Furthermore, the decreasing trend could also be attributed to the un-eluted AMI that was chemically bound onto 3D/BGO surfaces as well as the poisoning effect from the alcohol-based eluting agent [50]. Nonetheless, this study suggested that, overall, the adsorbent was a viable adsorbent for capturing AMI in contaminated water while preserving 86.20% of its initial adsorption capacity.
4. Conclusions
This work comprehensively assessed the applicability of a new 3D/BGO adsorbent for AMI adsorption, synthesized via the ice-templating assisted boron functionalization. From the characterization study, the favorability of 3D/BGO as a suitable adsorbent for AMI with a highly porous structure and abundant oxygenated functional groups was demonstrated. Based on ANOVA, it was determined that AMI concentration, time and dosage exerted crucial roles in optimizing the removal efficiency. The optimized AMI removal rate was 87.72%, attained at an adsorbent dosage of 12.5 mg, initial concentration of 70 ppm, contact time of 32 min and temperature of 30 °C. The recyclability of 3D/BGO adsorbent was highlighted by its high effectiveness using ethanol as the eluting agent. In the context of continuous adsorption, an adsorption capacity of 447.24 mg/g was achieved at a bed height of 3.5 cm, influent concentration of 100 ppm and feed flowrate of 2 mL/min. The modified log Bohart–Adams successfully portrayed the asymmetric breakthrough curves for 3D/BGO fixed-bed adsorption of AMI. The results of this study strongly recommend the utilization of 3D/BGO in a continuous fixed-bed mode, indicating its potential application in practical wastewater treatment. Conclusively, this research has successfully synthesized an effective new adsorbent, namely the 3D/BGO adsorbent, for the adsorptive removal of pharmaceutical pollutant from wastewater.
Author Contributions
Conceptualization, W.T.T. and L.Y.L.; methodology, W.T.T.; software, J.C.; validation, B.Y.Z.H.; formal analysis, J.E.Y.; investigation, W.T.T. and J.C.; resources, S.G.; data curation, J.C.; writing—original draft preparation, W.T.T.; writing—review and editing, S.G. and L.Y.L.; visualization, J.E.Y.; supervision, L.Y.L.; project administration, L.Y.L.; funding acquisition, L.Y.L. All authors have read and agreed to the published version of the manuscript.
Funding
This research was funded by the Ministry of Higher Education (MOHE) Malaysia under the grant number FRGS/1/2020/STG05/UNIM/02/2.
Data Availability Statement
The data presented in this study are available on request from the corresponding author.
Acknowledgments
The authors are thankful to the Ministry of Higher Education (MOHE) Malaysia for providing the financial support towards this work under the Fundamental Research Grant Scheme (FRGS/1/2020/STG05/UNIM/02/2).
Conflicts of Interest
The authors declare no conflict of interest.
References
- Umaharan, T.; Sivayokan, S.; Sivansuthan, S. Amitriptyline Dependence and Its Associations: A Case Report and Literature Review. Case Rep. Psychiatry 2021, 2021, 6647952. [Google Scholar] [CrossRef] [PubMed]
- Shi, Y.; Chen, C.; Wu, X.; Han, Z.; Zhang, S.; Chen, K.; Qiu, X. Exposure to amitriptyline induces persistent gut damages and dysbiosis of the gut microbiota in zebrafish (Danio rerio). Comp. Biochem. Physiol. C Toxicol. Pharmacol. 2022, 260, 109417. [Google Scholar] [CrossRef] [PubMed]
- Gupta, S.K.; Shah, J.C.; Hwang, S.S. Pharmacokinetic and pharmacodynamic characterization of OROS and immediate-release amitriptyline. Br. J. Clin. Pharmacol. 1999, 48, 71–78. [Google Scholar] [CrossRef] [PubMed]
- Castillo-Zacarías, C.; Barocio, M.E.; Hidalgo-Vázquez, E.; Sosa-Hernández, J.E.; Parra-Arroyo, L.; López-Pacheco, I.Y.; Barceló, D.; Iqbal, H.N.M.; Parra-Saldívar, R. Antidepressant drugs as emerging contaminants: Occurrence in urban and non-urban waters and analytical methods for their detection. Sci. Total Environ. 2021, 757, 143722. [Google Scholar] [CrossRef] [PubMed]
- Shi, Y.; Chen, C.; Han, Z.; Chen, K.; Wu, X.; Qiu, X. Combined exposure to microplastics and amitriptyline caused intestinal damage, oxidative stress and gut microbiota dysbiosis in zebrafish (Danio rerio). Aquat. Toxicol. 2023, 260, 106589. [Google Scholar] [CrossRef]
- Ebele, A.J.; Abou-Elwafa Abdallah, M.; Harrad, S. Pharmaceuticals and personal care products (PPCPs) in the freshwater aquatic environment. Emerg. Contam. 2017, 3, 1–16. [Google Scholar] [CrossRef]
- Mohiuddin, I.; Bhogal, S.; Grover, A.; Malik, A.K.; Aulakh, J.S. Simultaneous determination of amitriptyline, nortriptyline, and clomipramine in aqueous samples using selective multi-template molecularly imprinted polymers. Environ. Nanotechnol. Monit. Manag. 2021, 16, 100527. [Google Scholar] [CrossRef]
- Baker, D.R.; Kasprzyk-Hordern, B. Spatial and temporal occurrence of pharmaceuticals and illicit drugs in the aqueous environment and during wastewater treatment: New developments. Sci. Total Environ. 2013, 454–455, 442–456. [Google Scholar] [CrossRef]
- Togola, A.; Budzinski, H. Multi-residue analysis of pharmaceutical compounds in aqueous samples. J. Chromatogr. A 2008, 1177, 150–158. [Google Scholar] [CrossRef]
- Nordin, A.H.; Norfarhana, A.S.; Noor, S.F.M.; Paiman, S.H.; Nordin, M.L.; Husna, S.M.N.; Ilyas, R.A.; Ngadi, N.; Bakar, A.A.; Ahmad, Z.; et al. Recent Advances in Using Adsorbent Derived from Agricultural Waste for Antibiotics and Non-Steroidal Anti-Inflammatory Wastewater Treatment: A Review. Separations 2023, 10, 300. [Google Scholar] [CrossRef]
- Köpping, I.; McArdell, C.S.; Borowska, E.; Böhler, M.A.; Udert, K.M. Removal of pharmaceuticals from nitrified urine by adsorption on granular activated carbon. Water Res. X 2020, 9, 100057. [Google Scholar] [CrossRef]
- Tee, W.T.; Hiew, B.Y.Z.; Thangalazhy-Gopakumar, S.; Gan, S.; Lee, L.Y. Biochar as a remediation solution for pharmaceutical-contaminated wastewater. In BioChar: Applications for Bioremediation of Contaminated Systems; De Gruyter: Berlin, Germany, 2022; p. 373. [Google Scholar]
- Sarti, E.; Chenet, T.; Stevanin, C.; Costa, V.; Cavazzini, A.; Catani, M.; Martucci, A.; Precisvalle, N.; Beltrami, G.; Pasti, L. High-Silica Zeolites as Sorbent Media for Adsorption and Pre-Concentration of Pharmaceuticals in Aqueous Solutions. Molecules 2020, 25, 3331. [Google Scholar] [CrossRef] [PubMed]
- Lee, X.J.; Chemmangattuvalappil, N.; Lee, L.Y. Adsorptive removal of salicylic acid from aqueous solutions using new graphene-based nanosorbents. Chem. Eng. Trans. 2015, 45, 1387–1392. [Google Scholar] [CrossRef]
- Hiew, B.Y.Z.; Tee, W.T.; Loh, N.Y.L.; Lai, K.C.; Hanson, S.; Gan, S.; Thangalazhy-Gopakumar, S.; Lee, L.Y. Synthesis of a highly recoverable 3D MnO2/rGO hybrid aerogel for efficient adsorptive separation of pharmaceutical residue. J. Environ. Sci. 2022, 118, 194–203. [Google Scholar] [CrossRef] [PubMed]
- Qiu, P.; Wang, S.; Tian, C.; Lin, Z. Adsorption of low-concentration mercury in water by 3D cyclodextrin/graphene composites: Synergistic effect and enhancement mechanism. Environ. Pollut. 2019, 252, 1133–1141. [Google Scholar] [CrossRef]
- Bashir, S.; Hina, M.; Iqbal, J.; Rajpar, A.H.; Mujtaba, M.A.; Alghamdi, N.A.; Wageh, S.; Ramesh, K.; Ramesh, S. Fundamental Concepts of Hydrogels: Synthesis, Properties, and Their Applications. Polymers 2020, 12, 2702. [Google Scholar] [CrossRef]
- Ayouch, I.; Kassem, I.; Kassab, Z.; Barrak, I.; Barhoun, A.; Jacquemin, J.; Draoui, K.; Achaby, M.E. Crosslinked carboxymethyl cellulose-hydroxyethyl cellulose hydrogel films for adsorption of cadmium and methylene blue from aqueous solutions. Surf. Interfaces 2021, 24, 101124. [Google Scholar] [CrossRef]
- Tee, W.T.; Loh, N.Y.L.; Hiew, B.Y.Z.; Chiu, W.S.; Khiew, P.S.; Thangalazhy-Gopakumar, S.; Gan, S.; Lee, L.Y. Design and development of a high-performance 3D graphene system for adsorptive removal of organic toxins from wastewater: Mechanisms and process optimization. Chem. Eng. Res. Des. 2023, 195, 132–150. [Google Scholar] [CrossRef]
- Tee, W.T.; Loh, N.Y.L.; Lai, K.C.; Hiew, B.Y.Z.; Gan, S.; Lee, L.Y. Application of 3D heteroatom-doped graphene in adsorptive removal of water pollutants: Review on hydrothermal synthesis and its influencing factors. Sep. Purif. Technol. 2023, 320, 124072. [Google Scholar] [CrossRef]
- El Hadki, A.; Ulucan-Altuntas, K.; El Hadki, H.; Ustundag, C.B.; Kabbaj, O.K.; Dahchour, A.; Komiha, N.; Zrineh, A.; Debik, E. Removal of oxytetracycline by graphene oxide and Boron-doped reduced graphene oxide: A combined density function Theory, molecular dynamics simulation and experimental study. FlatChem 2021, 27, 100238. [Google Scholar] [CrossRef]
- Patel, H. Fixed-bed column adsorption study: A comprehensive review. Appl. Water Sci. 2019, 9, 45. [Google Scholar] [CrossRef]
- Solgi, M.; Steiger, B.G.K.; Wilson, L.D. A Fixed-Bed Column with an Agro-Waste Biomass Composite for Controlled Separation of Sulfate from Aqueous Media. Separations 2023, 10, 262. [Google Scholar] [CrossRef]
- Yu, F.; Pan, J.; Li, Y.; Yang, Y.; Zhang, Z.; Nie, J.; Ma, J. Batch and continuous fixed-bed column adsorption of tetracycline by biochar/MOFs derivative covered with κ-carrageenan/calcium alginate hydrogels. J. Environ. Chem. Eng. 2022, 10, 107996. [Google Scholar] [CrossRef]
- Hethnawi, A.; Alnajjar, M.; Manasrah, A.D.; Hassan, A.; Vitale, G.; Jeong, R.; Nassar, N.N. Metformin Removal from Water Using Fixed-bed Column of Silica-Alumina Composite. Colloids Surf. A Physicochem. Eng. Asp. 2020, 597, 124814. [Google Scholar] [CrossRef]
- Américo-Pinheiro, J.H.P.; Salomão, G.R.; Moreno Paschoa, C.V.; Cruz, I.A.; Isique, W.D.; Romanholo Ferreira, L.F.; Torres, N.H.; Bilal, M.; Iqbal, H.M.N.; Sillanpää, M.; et al. Effective adsorption of diclofenac and naproxen from water using fixed-bed column loaded with composite of heavy sugarcane ash and polyethylene terephthalate. Environ. Res. 2022, 211, 112971. [Google Scholar] [CrossRef]
- Lee, X.J.; Hiew, B.Y.Z.; Lai, K.C.; Tee, W.T.; Thangalazhy-Gopakumar, S.; Gan, S.; Lee, L.Y. Applicability of a novel and highly effective adsorbent derived from industrial palm oil mill sludge for copper sequestration: Central composite design optimisation and adsorption performance evaluation. J. Environ. Chem. Eng. 2021, 9, 105968. [Google Scholar] [CrossRef]
- Zaaba, N.I.; Foo, K.L.; Hashim, U.; Tan, S.J.; Liu, W.-W.; Voon, C.H. Synthesis of Graphene Oxide using Modified Hummers Method: Solvent Influence. Procedia Eng. 2017, 184, 469–477. [Google Scholar] [CrossRef]
- Apiratikul, R.; Chu, K.H. Improved fixed bed models for correlating asymmetric adsorption breakthrough curves. J. Water Process. Eng. 2021, 40, 101810. [Google Scholar] [CrossRef]
- Lai, K.C.; Hiew, B.Y.Z.; Tee, W.T.; Thangalazhy-Gopakumar, S.; Gan, S.; Lee, L.Y. Usage of a new macro-hierarchical graphene sponge in batch adsorption and packed column configuration for efficient decontamination of cadmium in aqueous environment. J. Environ. Chem. Eng. 2021, 9, 106057. [Google Scholar] [CrossRef]
- Loo, S.L.; Vásquez, L.; Athanassiou, A.; Fragouli, D. Polymeric Hydrogels—A Promising Platform in Enhancing Water Security for a Sustainable Future. Adv. Mater. Interfaces 2021, 8, 2100580. [Google Scholar] [CrossRef]
- Boateng, E.; Dondapati, J.S.; Thiruppathi, A.R.; Chen, A. Significant enhancement of the electrochemical hydrogen uptake of reduced graphene oxide via boron-doping and decoration with Pd nanoparticles. Int. J. Hydrog. Energy 2020, 45, 28951–28963. [Google Scholar] [CrossRef]
- Qiu, X.; Cai, H.; Fang, X.; Zheng, J. The improved thermal oxidative stability of silicone rubber by incorporating reduced graphene oxide: Impact factors and action mechanism. Polym. Compos. 2018, 39, 1105–1115. [Google Scholar] [CrossRef]
- Ngidi, N.P.D.; Ollengo, M.A.; Nyamori, V.O. Tuning the properties of boron-doped reduced graphene oxide by altering the boron content. New J. Chem. 2020, 44, 16864–16876. [Google Scholar] [CrossRef]
- Fan, X.; Cai, C.; Gao, J.; Han, X.; Li, J. Hydrothermal reduced graphene oxide membranes for dyes removing. Sep. Purif. Technol. 2020, 241, 116730. [Google Scholar] [CrossRef]
- Chintalapudi, K.; Pannem, R.M.R. The effects of Graphene Oxide addition on hydration process, crystal shapes, and microstructural transformation of Ordinary Portland Cement. J. Build. Eng. 2020, 32, 101551. [Google Scholar] [CrossRef]
- Khushbu; Jindal, R. Sodium Alginate and Chitosan Based Amphoteric Nanocomposites Modified with Graphene Oxide and Bentonite as an Efficient Adsorbent for Both Anionic and Cationic Dyes. J. Polym. Environ. 2023, 31, 264–286. [Google Scholar] [CrossRef]
- Aliyev, E.; Filiz, V.; Khan, M.M.; Lee, Y.J.; Abetz, C.; Abetz, V. Structural Characterization of Graphene Oxide: Surface Functional Groups and Fractionated Oxidative Debris. Nanomaterials 2019, 9, 1180. [Google Scholar] [CrossRef]
- Viji, A.; Balachandran, V.; Babiyana, S.; Narayana, B.; Salian, V.V. FT-IR and FT-Raman investigation, quantum chemical studies, molecular docking study and antimicrobial activity studies on novel bioactive drug of 1-(2,4-Dichlorobenzyl)-3-[2-(3-(4-chlorophenyl)-5-(4-(propan-2-yl)phenyl-4,5-dihydro-1H-pyrazol-1-yl]-4-oxo-4,5-dihydro-1,3-thiazol-5(4H)-ylidence]-2,3-dihydro-1H-indol-2-one. J. Mol. Struct. 2020, 1215, 128244. [Google Scholar] [CrossRef]
- Ahmad, S.Z.N.; Wan Salleh, W.N.; Ismail, A.F.; Yusof, N.; Mohd Yusop, M.Z.; Aziz, F. Adsorptive removal of heavy metal ions using graphene-based nanomaterials: Toxicity, roles of functional groups and mechanisms. Chemosphere 2020, 248, 126008. [Google Scholar] [CrossRef]
- Hiew, B.Y.Z.; Lee, L.Y.; Lee, X.J.; Gan, S.Y.; Thangalazhy-Gopakumar, S.; Lim, S.S.; Pan, G.T.; Yang, T.C.K. Adsorptive removal of diclofenac by graphene oxide: Optimization, equilibrium, kinetic and thermodynamic studies. J. Taiwan Inst. Chem. Eng. 2019, 98, 150–162. [Google Scholar] [CrossRef]
- Lai, K.C.; Lee, L.Y.; Hiew, B.Y.Z.; Thangalazhy-Gopakumar, S.; Gan, S. Facile synthesis of xanthan biopolymer integrated 3D hierarchical graphene oxide/titanium dioxide composite for adsorptive lead removal in wastewater. Bioresour. Technol. 2020, 309, 123296. [Google Scholar] [CrossRef]
- Xu, H.; Li, G.; Li, J.; Chen, C.; Ren, X. Interaction of Th(IV) with graphene oxides: Batch experiments, XPS investigation, and modeling. J. Mol. Liq. 2016, 213, 58–68. [Google Scholar] [CrossRef]
- Altuntepe, A.; Zan, R. Permanent Boron Doped Graphene with high Homogeneity using Phenylboronic Acid. J. Mol. Struct. 2021, 1230, 129629. [Google Scholar] [CrossRef]
- Sahoo, M.; Sreena, K.P.; Vinayan, B.P.; Ramaprabhu, S. Green synthesis of boron doped graphene and its application as high performance anode material in Li ion battery. Mater. Res. Bull. 2015, 61, 383–390. [Google Scholar] [CrossRef]
- Karri, R.R.; Tanzifi, M.; Tavakkoli Yaraki, M.; Sahu, J.N. Optimization and modeling of methyl orange adsorption onto polyaniline nano-adsorbent through response surface methodology and differential evolution embedded neural network. J. Environ. Manag. 2018, 223, 517–529. [Google Scholar] [CrossRef] [PubMed]
- Azman, A.; Ngadi, N.; Khairunnisa Awg Zaini, D.; Jusoh, M.; Mohamad, Z.; Arsad, A. Effect of Adsorption Parameter on the Removal of Aspirin Using Tyre Waste Adsorbent. Chem. Eng. Trans. 2019, 72, 157–162. [Google Scholar] [CrossRef]
- Momina; Shahadat, M.; Isamil, S. Regeneration performance of clay-based adsorbents for the removal of industrial dyes: A review. RSC Adv. 2018, 8, 24571–24587. [Google Scholar] [CrossRef] [PubMed]
- Patel, H. Review on solvent desorption study from exhausted adsorbent. J. Saudi Chem. Soc. 2021, 25, 101302. [Google Scholar] [CrossRef]
- Abu Alwan, R.; Zhuman, B.; Kumar, M.; Arafat, H.A.; AlNashef, I. Mussel-inspired polydopamine functionalized with ionic liquid as a novel, eco-efficient adsorbent for the selective removal of anionic pollutants from aqueous solutions. Chem. Eng. J. 2023, 454, 140498. [Google Scholar] [CrossRef]


Disclaimer/Publisher’s Note: The statements, opinions and data contained in all publications are solely those of the individual author(s) and contributor(s) and not of MDPI and/or the editor(s). MDPI and/or the editor(s) disclaim responsibility for any injury to people or property resulting from any ideas, methods, instructions or products referred to in the content. |
© 2023 by the authors. Licensee MDPI, Basel, Switzerland. This article is an open access article distributed under the terms and conditions of the Creative Commons Attribution (CC BY) license (https://creativecommons.org/licenses/by/4.0/).