Abstract
In the last decade, research has shown that most diseases are associated with organelle dysfunction in which metabolites play a crucial role or indicate specific processes. Peroxisomes are cellular organelles attracting an increasing amount of attention and are now recognized as essential players in physiological conditions and diseases. However, a limited amount of research focuses on isolating the organelles and studying their properties and the diseases resulting from organelle dysfunction. All methods for isolating peroxisomes are based on fresh tissue samples. To the best of our knowledge, this is the first work in which peroxisomes have been isolated from frozen rat liver. In our work, we isolated peroxisomes from frozen rat liver at −80 °C and evaluated the separation success and degree of purification of isolated peroxisomes by measuring the relative specific activity, purification fold, and percentage yield (Y%) of organelle marker enzymes in the isolated fractions. The percentage of protein distribution and density was also estimated. Our results showed that the purified peroxisome fraction (F3-peroxisome) had significantly higher relative specific activity, as well as the highest purification fold and percentage yield of catalase compared with the enzyme markers of other organelles in the postnuclear supernatant (PNS), postmitochondrial supernatant (PMS), and light mitochondria–peroxisome (LM-P) fractions. In addition, the percentage of protein distribution was significantly lower in the F3-peroxisome fraction compared with PNS, PMS, and LM-P fractions while the percentage of protein distribution and density of the F3-peroxisome fraction after iodixanol centrifugation were significantly higher than those of the F1 and F2 fractions. The present work demonstrates the possibility of isolating peroxisomes from frozen liver samples efficiently, which could pave the way for further research in the future on other subcellular organelles from frozen samples.
1. Introduction
Metabolomics, the comprehensive analysis of metabolites in a biological sample, is an emerging technology that holds promise for precision medicine [1]. It has become a beneficial technology for early diagnosis and pathogenesis research, and the discovery of therapeutic targets in various diseases is an emerging tool that provides promising information for the practice of precision medicine [1,2,3,4]. Body fluids, cells, and tissues are commonly used samples in metabolomics, but organelles such as mitochondria, lysosomes, peroxisomes, etc., have received little attention [5]. Since a cell consists of several organelles and cytoplasm, the metabolites in the individual organelles constitute only a small part of the whole cell. It follows that the changes in cell/tissue metabolomics that we observe in certain pathological conditions are an averaged result of metabolic changes in different organelles and cytoplasm and that it is difficult for cell/tissue metabolomics to detect significant changes in the biological processes that occur in individual organelles [6,7]. Therefore, the metabolic shifts we observe at the cell/tissue level may be underestimated because the opposing changes in the various organelles neutralize each other [8].
The isolation of subcellular compartments such as organelles to analyze their function or content is used in many biomedical assays [9]. Subcellular proteomics, in which subcellular components are isolated before proteomic analysis is performed, is helpful in characterizing organelles and understanding the mechanisms of protein transport and organelle biosynthesis. The purity of the samples to be analyzed is critical for interpreting the results in proteomics technology [10]. The analysis of subcellular fractions generated during isolation reduces the complexity of the samples to be analyzed and should provide more information about the smaller protein components that would otherwise not be detected [11].
Peroxisomes are cellular organelles that range in diameter from 0.2 to 1.0 µm and one or two to several hundred peroxisomes are found in virtually all eukaryotic cells [12]. Peroxisomes have different metabolic functions in almost all eukaryotic cells, including the α- and β-oxidation of fatty acids, biosynthesis of bile acids and ether phospholipids, cholesterol metabolism, and metabolism of reactive oxygen species [13,14]. Peroxisomes contain over 50 enzymes that perform numerous biological functions and are actively involved in apoptosis, innate immunity, and inflammation [15]. Since peroxisomes play a vital role in metabolism, any decrease in peroxisome function leads to severe peroxisomal disease. Recently, it has become increasingly clear that impairment of peroxisomal functions contributes to numerous and widespread diseases such as cancer, diabetes, viral infections, and neurodegeneration [16].
The isolation of peroxisomes is an essential technology for characterizing the components in peroxisomes and their function. Unfortunately, peroxisomes constitute only a small percentage of the volume of liver and kidney cells, where they are most abundant. However, highly purified peroxisomes can be obtained from rat liver by classical methods, including mild homogenization of the tissue, differential centrifugation, and density gradient centrifugation [17].
The separation of peroxisomes from rat liver was not a spontaneous idea. Rat liver was the source of the fractions De Duve and colleagues used for the first biochemical characterization of peroxisomes [18,19]. In 1968, Leighton and colleagues performed the procedures for isolating peroxisomes from rat liver [20]. However, with the development of science and equipment over time, the technique of peroxisome isolation has improved.
Up until now, all methods for isolating peroxisomes have depended on fresh tissue samples. The only study that isolated peroxisomes from frozen liver samples was carried out in 1992 by Alvarez et al. [21]. The study focused on isolating peroxisomes from the frozen liver biopsies of human specimens. In their study, they successfully isolated peroxisomes from frozen liver samples, and the properties of peroxisomes were studied and analyzed. Except for this study, there are no previous studies or information on the isolation of organelles from frozen samples.
While there are studies that have been able to separate and study organelles other than the peroxisome from frozen samples, such as the nucleus [22] and mitochondria [23,24,25], little is known about the separation of the peroxisome from frozen samples, which may have discouraged researchers from experimenting on this important organelle. This led us to think about the possibility of separating the peroxisome from frozen rat liver samples, based on the research by Alvarez et al. [21] who were able to separate the peroxisome, but from frozen human biopsy of liver samples. Separating peroxisomes from fresh samples directly after the animal is sacrificed is quite challenging. The separation process requires a long time and several pieces of equipment that could be difficult to manage [26,27]. Moreover, storing the isolated peroxisomes could compromise their biological integrity and biochemical function, whereas storing the entire organ can help preserve the organelles intact, which is the motive of our study. In the absence of research that addresses the separation of peroxisomes from frozen samples, researchers resort to the preservation and freezing of samples immediately after the animal is sacrificed to study some of the peroxisome features at a later time by other methods that do not require previous separation steps such as genetic evaluation.
In this work, the peroxisomes were isolated from rat livers frozen at −80 °C using the classical separation method based on three steps (1) mild homogenization of the tissue with a Potter–Elvenheijm homogenizer at low speeds, (2) a series of differential centrifugations leading to peroxisome-enriched fraction, and (3) a final centrifugation step using an iodixanol density gradient. Subsequently, the integrity of the isolation and purification procedure was evaluated by biochemical characterization of marker enzymes of purified peroxisomes and other organelles, such as mitochondria, microsomes, and lysosomes that may be present with purified peroxisomes. Unlike most previous references which used devices to prepare continuous iodixanol gradient media [26,28] that may not be available in all laboratories, in our protocol, we were able to create a loading system that allows the researcher to prepare continuous iodixanol gradient media from a discontinuous one, and we supported this with illustrations. This is the first protocol that describes and details the steps for the separation of peroxisomes from frozen rat liver samples. As recent literature lacks modern and replicable protocols for peroxisome separation, this protocol aims to fill this gap in the hopes of aiding future researchers interested in peroxisome separation to obtain the best results.
2. Materials and Methods
2.1. Chemicals
OptiPrep 60% (w/v) iodixanol density gradient medium was purchased from Sigma-Aldrich (St. Louis, MO, USA). 3-(N-morpholino) propanesulfonic acid (MOPS) and Ethylenediaminetetraacetic acid (EDTA) were purchased from Beijing Solarbio Science and Technology Co., Ltd., Beijing, China, and from Sigma (St. Louis, MO, USA). Sucrose, sodium hydroxide NaOH and ethanol were purchased from commercial sources. All chemicals used were of analytical grade.
2.2. Equipment
Refrigerated low- and high-speed centrifuge (HERMLE Labortechnik GmbH, Gosheim, Germany), digital refractometer (ATAGO RX-5000α, Tokyo, Japan), ultracentrifuge and fixed angle rotor (Himac-CP100WX, P80AT-0135 rotor, Tokyo, Japan), Potter–Elvehjem tissue Homogenizer with a loose-fitting pestle (clearance 0.1–0.15 mm, vol. 30 mL) were used, as well as quick seal polyallomer tubes (39 mL, Beckman Coulter, Brea, CA, USA).
2.3. Animals and Liver Samples
Six male Wistar rats, seven weeks old, weighing (200 ± 10) g, were obtained from the animal house of King Fahad Medical Research Center (KFMRC), Jeddah, Saudi Arabia. The study was approved by the Ethics Committee of King Abdulaziz University (Approval No. 518-20) and conducted according to the rules and regulations of the Animal Care and Use Committee at (KFMRC). The rats were starved overnight, anesthetized with isoflurane (initiated with 5% isoflurane and maintained with 3% in 2 L/min oxygen flow in a sealed container), and sacrificed by decapitation. The abdominal cavity was then opened, and the liver was removed, rinsed with 0.9% NaCl, weighed, frozen, and stored at −80 °C.
2.4. Preparation of Iodixanol Density Gradient Layers
The isolation of peroxisome depends on the successful preparation of a continuous iodixanol gradient media from a discontinuous one. To do that, there are many methods to prepare it. One of these methods is the freeze–thawing method [26,29]. Here, we prepared discontinuous iodixanol gradient media and froze it until use in the last step of peroxisome isolation.
Before starting the isolation steps, the iodixanol density gradient layers must be prepared. First, 20%, 40%, and 50% (w/v) iodixanol gradient solutions were prepared by mixing the following stock solutions in the volume ratios of 60% w/v iodixanol, diluent (6 mM EDTA, 30 mM MOPS, 0.6% ethanol adjusted to pH 7.2 with 1 M NaOH), 1 M sucrose, and distilled water as described in Table 1 [30]. We prepared a loaded system by using a 10-mL syringe, a 20 g needle, and 100 μL glass microcapillary pipettes as described in the method in [31]. Then, these gradient layers (20%, 40%, and 50%) were created by sequentially adding each layer from the lowest percentage of iodixanol (20%) to the highest (50%).

Table 1.
Preparation of iodixanol gradient solutions layer.
As shown in Figure 1, the plunger of the syringe was removed, and the 20 g needle was attached to the 10 mL syringe. Then, the microcapillary glass pipette was inserted into the lumen of the microcapillary tube. Finally, the microcapillary glass pipette was inserted into the top of the sealed ultracentrifuge tube until the microcapillary reached the bottom. This creates the syringe–microcapillary system into which the density gradient layers are poured. The density gradient was poured from the least dense (20%) to the densest (50%) layer using the syringe microcapillary system, allowing the layers to flow into the tube below the previous layer. The layers ran by gravity into the bottom of the centrifuge tube. Sequentially, 12, 12, and 9 mL of the 20%, 40%, and 50% iodixanol dilutions were layered, respectively. The result is a discontinuous density gradient consisting of three layers. The discontinuous gradient was frozen in liquid nitrogen and stored at −80 °C until use.
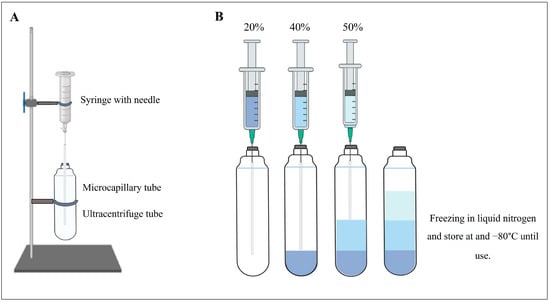
Figure 1.
Preparation of discontinuous iodixanol gradient. (A) Syringe–microcapillary-loaded system. (B) Create the iodixanol gradient by sequentially adding each layer from the lowest percent of iodixanol (20%) to the highest (50%).
2.5. Peroxisome Isolation
The protocol we used to isolate peroxisomes is based on the method of Graham and Islinger with some modifications [26,28,30]. The protocol for isolation and purification of peroxisomes is carried out in three steps: (1) homogenization of the liver tissue with a Potter–Elvenheijm homogenizer at low speeds, (2) subcellular fractionation by differential centrifugation to produce a light mitochondrial–peroxisome fraction, and (3) the final centrifugation step using an iodixanol density gradient. Figure 2 summarizes the three steps of the separation process, which are explained in detail below.
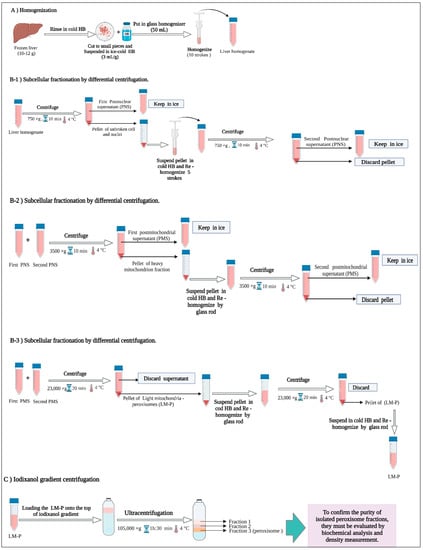
Figure 2.
Purification scheme for the isolation of peroxisomes.
2.5.1. Homogenization
The frozen liver samples (10 to 12 g) were rinsed with cold homogenization buffer (HB) (sucrose 0.25 M, 1 mM EDTA, 5 mM MOPS, 0.1% ethanol, adjusted to pH 7.2 with 1 M NaOH) and quickly cut into pieces of approximately 2.5 mm3. Then, the liver pieces were suspended in ice-cold HB at a ratio of 3 mL/g tissue. It was very important to pre-cool all the glassware, solutions, and equipment to a temperature of 4 °C and keep them on ice throughout the process. After that, the suspended liver pieces were homogenized with a Potter–Elvehjem tissue homogenizer and a loose-fitting pestle with 10 strokes at 4 °C (Figure 2).
2.5.2. Subcellular Fractionation of Liver Homogenate by Differential Centrifugation
Peroxisomes are the densest organelles among subcellular organelles and one of the main components of the light mitochondrial fraction obtained from a homogenate by differential centrifugation. As with most subcellular organelles, techniques for the isolation of peroxisomes have been developed primarily through work with rat livers. The “classical” differential centrifugation method consists of the following four steps: nuclear pellet: 600 to 1000× g for 10 min; heavy mitochondrial pellet: 3000 to 4000× g for 10 min; and light mitochondrial fraction: 15,000 to 25,000× g for 20 min [28]. In this step, the liver homogenate will be fractionated according to sedimentation rate to produce nuclei, heavy mitochondria (HM), light mitochondria (LM), and light mitochondria–peroxisome (LM-P), in which the peroxisome will be purified by iodixanol gradient ultracentrifugation [28]
The homogenate was centrifuged at 750× g for 10 min at 4 °C at a low speed to pellet and remove unbroken hepatocytes, cell debris, blood cells, and nuclei. Then, the postnuclear supernatant (PNS) was kept on ice, and the pellet was resuspended in approximately 10 mL of HB and re-homogenized for a second time with 5 strokes at 4 °C and centrifuged at 750× g for 10 min at 4 °C. In this step, we obtained the second postnuclear supernatant. The two postnuclear supernatants were combined and centrifuged at 3500× g for 10 min at 4 °C by using a high-speed centrifuge to pellet the heavy mitochondria, which were mainly composed of large mitochondria, large microsomal sheets, and some residual nuclei. The pellet was drained from the postmitochondrial supernatant (PMS). This PMS was kept on ice while the pellet was resuspended in HB with a glass rod without disturbing the blood pellet stuck at the bottom of the tube and centrifuged again at 3500× g for 10 min at 4 °C in a high-speed centrifuge to obtain a second PMS. The two PMS were combined from both runs and centrifuged at 23,000× g for 20 min at 4 °C in a 50 mL polycarbonate tube using a high-speed centrifuge to pellet the light mitochondria–peroxisome (LM-P). The supernatant was removed, including the fluffy reddish layer that was on top of the pellet, and this pellet LM-P was also resuspended and stirred with a glass rod until a homogeneous suspension was obtained, and the HB was adjusted to 3 mL/g pellet. The resuspended pellet was recentrifuged at 23,000× g for 20 min at 4 °C, and the supernatant was removed again to obtain the final pellet LM-P, which was resuspended in HB as described above (3 mL/g pellet) for further separation by iodixanol density gradient ultracentrifugation (Figure 2).
2.5.3. Isolation of Peroxisomes by Iodixanol Gradient Centrifugation
The frozen discontinuous iodixanol gradient was thawed at room temperature at the final step of subcellular fractionation when prepared previously to generate a continuous iodixanol gradient by diffusion properties. To isolate peroxisomes from the light mitochondrial fraction, 8 mL of LM-P fraction was layered on the iodixanol gradients (Figure 3), and the remaining volume of the sealed ultracentrifuge tube was filled with HB, sealed, and ultracentrifuged for 1 h:30 min at 105,000× g at 4 °C (Figure 2).
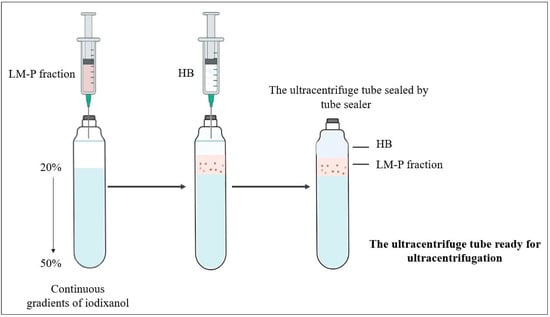
Figure 3.
Loading the light mitochondria–peroxisome layer (LM-P) on the top of the continuous iodixanol gradient before the ultracentrifugation step. Change seal to sealed.
After ultracentrifugation, three narrow but distinct bands were seen near the bottom of the tube. The peroxisomes formed a band close to the bottom of the gradient. To collect the individual fractions, the tubes were punctured with a needle attached to a syringe and aspirated band by band (see Figure 4). One to three milliliters of fractions were collected from the bottom for biochemical studies.
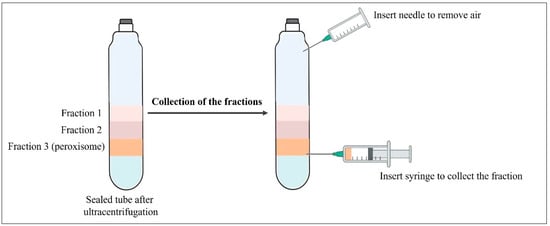
Figure 4.
Collection of fractions from the sealed tube.
2.6. Enzyme Assays
Using the iodixanol gradient centrifugation did not affect enzyme activity in the separated fractions [30]. The fractions could be used directly to perform standard spectrophotometric procedures. If it was essential to remove the gradient medium, the fractions were resuspended in an appropriate buffer after diluting with an equal volume of buffer and pelleting at 30,000× g for 10 min [30]. The degree of purification of peroxisomes can be evaluated by comparing the protein content and marker enzymes of the organelles, including catalase (peroxisomal marker), cytochrome c oxidase (mitochondrial marker), esterase (microsomal marker), and acid phosphatase (lysosomal marker). Using the marker enzymes and protein, we can measure some properties of the enzymes, such as the relative specific activity, percentage of protein distribution, purification fold, and recovery yield %. The protein was measured by the Bradford method [32], using bovine serum albumin (BSA) as the standard, catalase [33], cytochrome c oxidase [34], esterase [35], and acid phosphatase [36].
2.7. Determination of the Density of Purified Peroxisomal Fraction
Due to the large density difference between the peroxisomes and the other organelles, separation can be easily accomplished using iodixanol gradients [28]. The density of the fractions was measured using a refractometer.
2.8. Statistical Analysis
The data were analyzed by using GraphPad Prism 8 (GraphPad Inc., La Jolla, CA, USA). Data are shown as the mean ± standard error of the mean (mean ± SEM). The one-way ANOVA was used to assess the difference between different fractions, followed by Turkey’s post hoc test. Differences with p < 0.05 were statistically significant.
3. Results
After subcellular fractionation of the liver homogenate by differential centrifugation, we obtained three fractions PNS, PMS, and LM-P. In addition, three other fractions (F1, F2, and F3-peroxisome) were obtained after loading and centrifugation of the LM-P iodixanol gradient. Previous studies found that the peroxisomal fraction was the lowest and densest layer in the tube after ultracentrifugation [26,27]. To confirm this, the purity of the isolated peroxisomal fraction (F3-peroxisome) must be verified. To achieve this, it was necessary to compare the organelle marker enzymes in the fractions we obtained during the separation processes in both subcellular fractionation and iodixanol gradient centrifugation. Therefore, the F3-peroxisome fraction was first compared with PNS, PMS, and LM-P to ensure the success of the subcellular separation procedure and then compared with F1 and F2 to verify the success of the iodixanol gradient separation.
As mentioned in the Materials and Methods section, the degree of purification of peroxisomes depends on the degree of contamination with other organelles. In addition, the composition of PNS, PMS, LM-P, F1, F2, and F3-peroxisomal fractions was determined based on the percentage distribution and the relative specific activity of the marker enzymes.
As illustrated in Figure 5, the F3-peroxisomal fraction exhibited a significant increase (p < 0.05) in the relative specific activity of catalase compared with PNS, PMS, and LM-P fractions. Furthermore, there was a significant decrease (p < 0.05) in the relative specific activity of cytochrome c oxidase, acid phosphatase, and esterase in the F3-peroxisome fraction compared with the PNS and PMS fractions. Notably, the F3-peroxisomal fraction had a lower specific activity of cytochrome c oxidase, acid phosphatase, and esterase than LM-P without a significant difference. Furthermore, the percentage of protein distribution in F3-peroxisome was significantly decreased (p < 0.05) compared with PNS, PMS, and LM-P fractions (Figure 5).
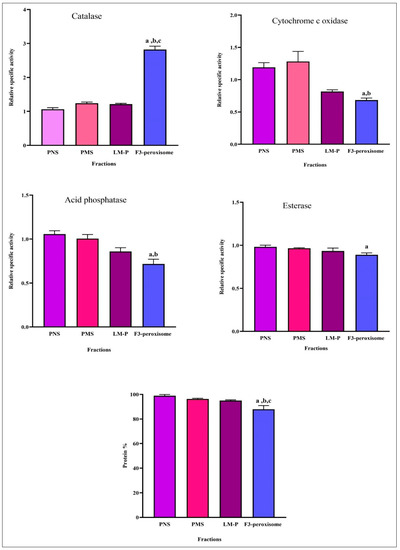
Figure 5.
The relative specific activity of organelle marker enzymes and percentage of protein distribution in fractions. Postnuclear supernatant (PNS); postmitochondrial supernatant (PMS); light mitochondria containing peroxisomes (LM-P); fraction 3-peroxisome (F3-peroxisome). Data are expressed as means ± SEM, n = 6. a: p < 0.05 F3-peroxisome vs. PNS; b: p < 0.05 F3-peroxisome vs. PMS; c: p < 0.05 F3-peroxisome vs. LM-P. Relative specific activity: % of specific activity in the fraction/% of the protein in the same fraction; protein %: protein content of each fraction/total protein of the homogenate multiplied by 100.
Additionally, as shown in Figure 6, the F3-peroxisomal fraction was significantly increased (p < 0.05) in the relative specific activity of catalase compared with F1 and significantly decreased (p < 0.05) in the relative specific activity of cytochrome c oxidase, acid phosphatase, and esterase compared with F1. However, no significant difference was observed in the percentage of protein distribution between F1, F2, and the F3-peroxisome.
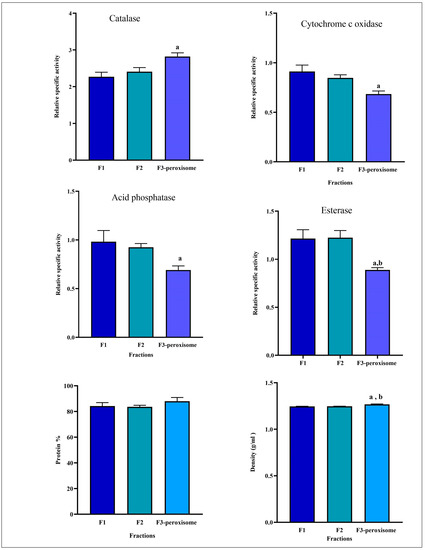
Figure 6.
The relative specific activity of organelles marker enzymes, percentage of protein distribution, and density of fractions obtained from the iodixanol gradient centrifugation step. Fraction one (F1); fraction two (F2); fraction 3-peroxisome (F3-peroxisome). Data are expressed as means ± SEM, n = 6. a: p < 0.05 F3-peroxisome vs. F1; b: p < 0.05 F3-peroxisome vs. F2. Relative specific activity: % of specific activity in the fraction/% of the protein in the same fraction; Protein %: protein content of each fraction/total protein of the homogenate multiplied by 100.
After the purification steps, the purification fold was used to measure the increase in enzyme purity. As shown in Table 2, the purification fold of catalase was 1.00 in the homogenate and then increased significantly (p < 0.05) to 1.06, 1.17, 1.18, and 2.24 in the PNS, PMS, and LM-P fractions and in the F3-peroxisome after subcellular fractionation and iodixanol centrifugation, respectively. This means that the F3-peroxisomal fraction showed the highest purification fold of catalase compared with the other fractions. However, the degree of purification of cytochrome c oxidase, acid phosphatase, and esterase gradually decreased in the PNS, PMS, LM-P, and F3-peroxisomal fractions during subcellular fractionation and iodixanol centrifugation. Moreover, F3-peroxisome had a significant reduction (p < 0.05) in the purification fold of cytochrome c oxidase and acid phosphatase compared to the other fractions.
Table 2.
Properties of organelle marker enzymes in the fraction obtained by both subcellular fractionation and iodixanol gradient centrifugation.
Percentage yield (Y%) is one of the purification parameters that measures the enzyme activity that was conserved in the purified sample. Table 2 shows the Y% of catalase, cytochrome c oxidase, acid phosphatase, and esterase in the PNS, PMS, and LM-P fractions and F3 peroxisome fractions. Before the purification steps, the Y% of enzymes in the homogenate (H) was 100%, but this value may be increased or decreased depending on the enzyme to be separated and the separation method used. In this protocol, the Y% of catalase was significantly increased in the F3-peroxisomal fraction compared to the homogenate and the other fractions (p < 0.05). At the same time, the Y% of cytochrome c oxidase, acid phosphatase and esterase were significantly decreased (p < 0.05).
Iodixanol is a density gradient medium (density of 1.32 g/mL) used to isolate organelles, macromolecules, viruses, or cells. In this protocol, iodixanol was used as a density gradient to isolate and purify peroxisomes. As illustrated in Figure 6, the F3-peroxisomal fraction was the densest fraction after ultracentrifugation. The F3-peroxisome density was 1.26, while the F1 and F2 densities were 1.24 and 1.25, respectively. Thus, the density of the F3-peroxisome was significantly increased (p < 0.05) compared to the F1 and F2 fractions.
4. Discussion
Peroxisomes are the main metabolic organelles that contain many biochemical processes and metabolic pathways that help eukaryotic organisms perform various physiological functions [37]. Any reduction in those functions leads to severe peroxisomal diseases. Recently, it has become increasingly clear that impairment of peroxisomal functions contributes to many widespread diseases such as cancer, viral infections, diabetes, and neurodegeneration [16]. The isolation of peroxisomes is an essential technology for characterizing the components of peroxisomes and their function. Most eukaryotic cells contain peroxisomes as cellular organelles and are found in high density in the liver and the kidneys [15]. Since 1986, all peroxisome isolation procedures have been performed on fresh organs (especially rat liver) [26,27,28,30]. In this protocol, we isolated peroxisomes from frozen rat liver for the first time. Our protocol for isolation and purification of peroxisomes from the frozen liver was based on two main steps: subcellular fractionation by differential centrifugation and iodixanol density gradient centrifugation, which follows previous protocols, with some significant modifications [27,28]. The objective of this protocol is to purify peroxisomes without detectable contamination by other organelles such as mitochondria, microsomes, and lysosomes.
The relative specific activity of the marker enzymes was used to determine the purity of the peroxisomal fraction [17]. Catalase is the classical marker enzyme of peroxisomes that decomposes H2O2 and is the most common protein in the peroxisome matrix [38,39].
As shown in Figure 5 and Figure 6, the relative specific activity of catalase was significantly increased in the purified fraction (F3-peroxisome) compared with the other fractions (PNS, PMS LM -P, F1, and F2) obtained by differential centrifugation and iodixanol density gradient centrifugation. On the other hand, the relative specific activity of cytochrome c oxidase, acid phosphatase, and esterase, which are markers for mitochondria, lysosomes, and microsomes, respectively, was significantly decreased in the F3-peroxisome. In addition, the protein distribution in the fractions was reduced after fractionation and centrifugation, and the final protein percentage was significantly reduced in the F3-peroxisome compared with PNS and PMS LM-P, indicating that the separation and purification process was successful. It is noteworthy that the F3-peroxisome had a higher protein level than F1 and F2, which can be due to the use of iodixanol that increases the density of the peroxisome, and subsequently lead to the concentration of the catalase (the abundant protein in the peroxisome). Based on the protein distribution and relative specific activity, we can conclude that the F3-peroxisome is the purest fraction, which has a large number of peroxisomes compared to the other fractions, and these results are in agreement with the results of other studies [28,30,40].
After the purification steps, the purification fold was used to measure the increase in enzyme purity, with increasing values indicating increasing purity [41]. In our result, we found that the purification fold of the catalase enzyme was significantly increased after the last purification step, especially in the F3-peroxisomal fraction, while it was significantly reduced in PNS and PMS LM-P. Moreover, the purification fold of cytochrome c oxidase, acid phosphatase, and esterase decreased at each step of isolation and purification in all fractions, including PNS, PMS LM-P, and F3-peroxisome. This suggests that catalase was the purest enzyme in all the fractions, especially in the F3-peroxisome, which is consistent with a previous study [42]
To assess the quality of the preparation and the reproducibility of the procedure, it is important to calculate the recovery and purity of the peroxisomes based on an assay of their marker enzymes [17,20]. The quantity of recovered protein or enzyme obtained is essential when evaluating the effectiveness of enzyme purification. Therefore, the research goal is to preserve as much of the target protein as possible. One of the purification characteristics is percentage recovery yield, which estimates how much enzyme activity was obtained in the purified sample. The recovery yield of catalase gradually increased with each step and fraction, while it gradually decreased for cytochrome c oxidase, acid phosphatase, and esterase. F3-peroxisome had the highest percentage of recovery yield compared to PNS and PMS LM-P.
As mentioned previously, peroxisomes are the densest organelles located near the bottom of the gradients [26]. In this protocol, iodixanol was the gradient medium used to increase the intensity of the peroxisome [26,27]. In iodixanol, peroxisomes are the densest organelles in the light mitochondrial fraction and are easily separated from other components (lysosomes, mitochondria, etc.). In our results, the density of the F3-peroxisome fraction was significantly increased compared to the fractions F1 and F2 after the iodixanol gradient centrifugation step, which is in agreement with previous studies [26,27,30,40].
5. Conclusions
From the profiles of the marker enzymes, the main peroxisomal fraction (F3-peroxisome) contains very little contamination from other subcellular fractions. These data conclusively demonstrate that frozen liver samples can serve as an alternative for the isolation of peroxisomes. In general, it is also possible to isolate other subcellular organelles from frozen samples using the procedure described here. These isolated peroxisomes can be used to study peroxisomal abnormalities and can also be used for basic biological and medical studies. Shortcomings of this protocol include the lengthy procedure and the high level of accuracy required for the loading system to manually prepare the continuous iodixanol gradient media from the discontinuous one.
Author Contributions
Conceptualization, H.G., L.B., M.A.-t. and S.A.; methodology, H.G., L.B., M.A.-t. and S.A.; software, M.A.-t.; validation, H.G. and L.B.; formal analysis, H.G., L.B. and M.A.-t.; investigation, L.B. and M.A.-t.; data curation, L.B. and M.A.-t.; writing—original draft preparation, M.A.-t.; writing—review and editing, H.G. and L.B.; supervision, H.G. and L.B. All authors have read and agreed to the published version of the manuscript.
Funding
This research received no external funding.
Institutional Review Board Statement
The study protocol was approved by the biomedical ethics research committee (approval No. 518-20, approval on 11 October 2020) at King Abdulaziz University and followed the rules and regulations of the Animal Care and Use Committee at the KFMRC, which complied with the “System of Ethics of Research on Living Creatures” guidelines prepared by King Abdulaziz City for Science and Technology and were approved by Royal Decree No. M/59, dated 24 August 2010.
Informed Consent Statement
Not applicable.
Data Availability Statement
Not applicable.
Acknowledgments
The authors would like to thank Badrah S. Algamdi, Head of the Pre-Clinical Research Unit at the King Fahad Medical Research Center, Jeddah, for their infrastructure and support. We would also like to thank the staff of King Fahd Medical Research Center, KAU, Jeddah, KSA, for their technical support.
Conflicts of Interest
The authors declare no conflict of interest.
References
- Clish, C.B. Metabolomics: An emerging but powerful tool for precision medicine. Mol. Case Stud. 2015, 1, a000588. [Google Scholar] [CrossRef] [PubMed]
- Zhang, F.; Zhang, Y.; Zhao, W.; Deng, K.; Wang, Z.; Yang, C.; Ma, L.; Openkova, M.S.; Hou, Y.; Li, K. Metabolomics for biomarker discovery in the diagnosis, prognosis, survival and recurrence of colorectal cancer: A systematic review. Oncotarget 2017, 8, 35460. [Google Scholar] [CrossRef] [PubMed]
- MacMullan, M.A.; Dunn, Z.S.; Graham, N.A.; Yang, L.; Wang, P. Quantitative proteomics and metabolomics reveal biomarkers of disease as potential immunotherapy targets and indicators of therapeutic efficacy. Theranostics 2019, 9, 7872. [Google Scholar] [CrossRef] [PubMed]
- Bernatchez, J.A.; McCall, L.-I. Insights gained into respiratory infection pathogenesis using lung tissue metabolomics. PLoS Pathog. 2020, 16, e1008662. [Google Scholar] [CrossRef]
- Qin, S.; Zhang, Y.; Tian, Y.; Xu, F.; Zhang, P. Subcellular metabolomics: Isolation, measurement, and applications. J. Pharm. Biomed. Anal. 2022, 210, 114557. [Google Scholar] [CrossRef]
- Cowman, A.F.; Healer, J.; Marapana, D.; Marsh, K. Malaria: Biology and disease. Cell 2016, 167, 610–624. [Google Scholar] [CrossRef] [PubMed]
- Abu-Remaileh, M.; Wyant, G.A.; Kim, C.; Laqtom, N.N.; Abbasi, M.; Chan, S.H.; Freinkman, E.; Sabatini, D.M. Lysosomal metabolomics reveals V-ATPase-and mTOR-dependent regulation of amino acid efflux from lysosomes. Science 2017, 358, 807–813. [Google Scholar] [CrossRef]
- Wellen, K.E.; Snyder, N.W. Should we consider subcellular compartmentalization of metabolites, and if so, how do we measure them? Curr. Opin. Clin. Nutr. Metab. Care 2019, 22, 347. [Google Scholar] [CrossRef]
- Satori, C.P.; Kostal, V.; Arriaga, E.A. Review on recent advances in the analysis of isolated organelles. Anal. Chim. Acta 2012, 753, 8–18. [Google Scholar] [CrossRef] [PubMed]
- Kikuchi, M.; Hatano, N.; Yokota, S.; Shimozawa, N.; Imanaka, T.; Taniguchi, H. Proteomic analysis of rat liver peroxisome: Presence of peroxisome-specific isozyme of Lon protease. J. Biol. Chem. 2004, 279, 421–428. [Google Scholar] [CrossRef]
- Hanson, B.J.; Schulenberg, B.; Patton, W.F.; Capaldi, R.A. A novel subfractionation approach for mitochondrial proteins: A three-dimensional mitochondrial proteome map. Electrophoresis 2001, 22, 950–959. [Google Scholar] [CrossRef] [PubMed]
- Fujiki, Y.; Bassik, M.C. A new paradigm in catalase research. Trends Cell Biol. 2021, 31, 148–151. [Google Scholar] [CrossRef]
- Antonenkov, V.D.; Grunau, S.; Ohlmeier, S.; Hiltunen, J.K. Peroxisomes are oxidative organelles. Antioxid. Redox Signal. 2010, 13, 525–537. [Google Scholar] [CrossRef]
- Cai, M.; Sun, X.; Wang, W.; Lian, Z.; Wu, P.; Han, S.; Chen, H.; Zhang, P. Disruption of peroxisome function leads to metabolic stress, mTOR inhibition, and lethality in liver cancer cells. Cancer Lett. 2018, 421, 82–93. [Google Scholar] [CrossRef]
- Vasko, R. Peroxisomes and kidney injury. Antioxid. Redox Signal. 2016, 25, 217–231. [Google Scholar] [CrossRef]
- Zalckvar, E.; Schuldiner, M. Beyond rare disorders: A new era for peroxisomal pathophysiology. Mol. Cell 2022, 82, 2228–2235. [Google Scholar] [CrossRef] [PubMed]
- Imanaka, T.; Shimozawa, N. Peroxisomes: Biogenesis, Function, and Role in Human Disease; Springer: Singapore, 2020. [Google Scholar]
- Baudhuin, P.; Beaufay, H.; de Duve, C. Combined biochemical and morphological study of particulate fractions from rat liver: Analysis of preparations enriched in lysosomes or in particles containing urate oxidase, D-amino acid oxidase, and catalase. J. Cell Biol. 1965, 26, 219–243. [Google Scholar] [CrossRef]
- De Duve, C.; Baudhuin, P. Peroxisomes (microbodies and related particles). Physiol. Rev. 1966, 46, 323–357. [Google Scholar] [CrossRef]
- Leighton, F.; Poole, B.; Beaufay, H.; Baudhuin, P.; Coffey, J.W.; Fowler, S.; De Duve, C. The large-scale separation of peroxisomes, mitochondria, and lysosomes from the livers of rats injected with Triton WR-1339: Improved isolation procedures, automated analysis, biochemical and morphological properties of fractions. J. Cell Biol. 1968, 37, 482–513. [Google Scholar] [CrossRef] [PubMed]
- Alvarez, A.; Hidalgo, U.; Kawada, M.E.; Munizaga, A.; Zúñiga, A.; Ibánez, L.; Koenig, C.S.; Santos, M.J. Isolation of peroxisomes from frozen human liver samples. Anal. Biochem. 1992, 206, 147–154. [Google Scholar] [CrossRef]
- Strzelecki, M.; Yin, K.; Talavera-López, C.; Martinez-Jimenez, C.P. Isolation of Nuclei from Flash-frozen Liver Tissue for Single-cell Multiomics. JoVE J. Vis. Exp. 2022, 190, e64792. [Google Scholar]
- Sunitha, B.; Gayathri, N.; Kumar, M.; Keshava Prasad, T.S.; Nalini, A.; Padmanabhan, B.; Srinivas Bharath, M.M. Muscle biopsies from human muscle diseases with myopathic pathology reveal common alterations in mitochondrial function. J. Neurochem. 2016, 138, 174–191. [Google Scholar] [CrossRef] [PubMed]
- Acin-Perez, R.; Benador, I.Y.; Petcherski, A.; Veliova, M.; Benavides, G.A.; Lagarrigue, S.; Caudal, A.; Vergnes, L.; Murphy, A.N.; Karamanlidis, G. A novel approach to measure mitochondrial respiration in frozen biological samples. EMBO J. 2020, 39, e104073. [Google Scholar] [CrossRef]
- Osto, C.; Benador, I.Y.; Ngo, J.; Liesa, M.; Stiles, L.; Acin-Perez, R.; Shirihai, O.S. Measuring mitochondrial respiration in previously frozen biological samples. Curr. Protoc. Cell Biol. 2020, 89, e116. [Google Scholar] [CrossRef]
- Islinger, M.; Abdolzade-Bavil, A.; Liebler, S.; Weber, G.; Völkl, A. Assessing heterogeneity of peroxisomes: Isolation of two subpopulations from rat liver. In Liver Proteomics; Springer: New York, NY, USA, 2012; pp. 83–96. [Google Scholar]
- Manner, A.; Islinger, M. Isolation of peroxisomes from rat liver and cultured hepatoma cells by density gradient centrifugation. In Peroxisomes; Springer: Berlin/Heidelberg, Germany, 2017; pp. 1–11. [Google Scholar]
- Graham, J. Isolation of peroxisomes from tissues and cells by differential and density gradient centrifugation. Curr. Protoc. Cell Biol. 2000, 6, 3.6.1–3.6.22. [Google Scholar] [CrossRef]
- Graham, J. Preparation of preformed iodixanol gradients. Sci. World J. 2002, 2, 1351–1355. [Google Scholar] [CrossRef] [PubMed]
- Graham, J. Purification of peroxisomes in a preformed iodixanol gradient in a fixed-angle rotor. Sci. World J. 2002, 2, 1526–1539. [Google Scholar] [CrossRef]
- Reid, C.A.; Lipinski, D.M. Small and micro-scale recombinant adeno-associated virus production and purification for ocular gene therapy applications. In Retinal Gene Therapy; Springer: Berlin/Heidelberg, Germany, 2018; pp. 19–31. [Google Scholar]
- Bradford, M.M. A rapid and sensitive method for the quantitation of microgram quantities of protein utilizing the principle of protein-dye binding. Anal. Biochem. 1976, 72, 248–254. [Google Scholar] [CrossRef]
- Baudhuin, P. [36] Isolation of rat liver peroxisomes. In Methods in Enzymology; Elsevier: Amsterdam, The Netherlands, 1974; Volume 31, pp. 356–368. [Google Scholar]
- Cooperstein, S.; Lazarow, A. A microspectrophotometric method for the determination of cytochrome oxidase. J. Biol. Chem. 1951, 189, 665–670. [Google Scholar] [CrossRef]
- Amar-Costesec, A.; Beaufay, H.; Wibo, M.; Thinès-Sempoux, D.; Feytmans, E.; Robbi, M.; Berthet, J. Analytical study of microsomes and isolated subcellular membranes from rat liver: II. Preparation and composition of the microsomal fraction. J. Cell Biol. 1974, 61, 201–212. [Google Scholar] [CrossRef]
- Bergmeyer, H.U. Standardization of enzyme assays. Clin. Chem. 1972, 18, 1305–1311. [Google Scholar] [CrossRef]
- Berger, J.; Dorninger, F.; Forss-Petter, S.; Kunze, M. Peroxisomes in brain development and function. Biochim. Biophys. Acta BBA Mol. Cell Res. 2016, 1863, 934–955. [Google Scholar] [CrossRef] [PubMed]
- Lee, J.N.; Dutta, R.K.; Maharjan, Y.; Liu, Z.-Q.; Lim, J.-Y.; Kim, S.-J.; Cho, D.-H.; So, H.-S.; Choe, S.-K.; Park, R. Catalase inhibition induces pexophagy through ROS accumulation. Biochem. Biophys. Res. Commun. 2018, 501, 696–702. [Google Scholar] [CrossRef] [PubMed]
- Nitta, Y.; Muraoka-Hirayama, S.; Sakurai, K. Catalase is required for peroxisome maintenance during adipogenesis. Biochim. Biophys. Acta BBA Mol. Cell Biol. Lipids 2020, 1865, 158726. [Google Scholar] [CrossRef] [PubMed]
- Van Veldhoven, P.P.; Baumgart, E.; Mannaerts, G.P. Iodixanol (Optiprep), an improved density gradient medium for the iso-osmotic isolation of rat liver peroxisomes. Anal. Biochem. 1996, 237, 17–23. [Google Scholar] [CrossRef]
- Islam, M.; Parveen, F.; Hossain, K.; Khatun, S.; Karim, M.R.; Kim, G.; Absar, N.; Haque, M.S. Purification and biochemical characterization of lipase from the dorsal part of Cirrhinus reba. Thai J. Agric. Sci. 2009, 42, 71–80. [Google Scholar]
- Hamel, F.G.; Bennett, R.G.; Upward, J.L.; Duckworth, W.C. Insulin inhibits peroxisomal fatty acid oxidation in isolated rat hepatocytes. Endocrinology 2001, 142, 2702–2706. [Google Scholar] [CrossRef]
Disclaimer/Publisher’s Note: The statements, opinions and data contained in all publications are solely those of the individual author(s) and contributor(s) and not of MDPI and/or the editor(s). MDPI and/or the editor(s) disclaim responsibility for any injury to people or property resulting from any ideas, methods, instructions or products referred to in the content. |
© 2023 by the authors. Licensee MDPI, Basel, Switzerland. This article is an open access article distributed under the terms and conditions of the Creative Commons Attribution (CC BY) license (https://creativecommons.org/licenses/by/4.0/).