Abstract
Commonly used to treat mood disorders, St. John’s Wort (Hypericum perforatum) is a popular herb in the natural health products industry. The potency of its active ingredients can be determined using a number of different analytical methods, but it is more widely determined using high performance liquid chromatography (HPLC). While monographs in the United States Pharmacopeia (USP) can often be relied upon for suitable analytical methods, the method proposed for determining hypericin content in St. John’s Wort products is inefficient in carrying out this purpose. This paper presents a modified new HPLC method for determining the hypericin content that can also be used for St. John’s Worts capsules and tablets by making use of purified hypericin as a chemical standard instead of oxybenzone, applying a wavelength of 588 nm during analysis and utilizing a binary instead of ternary mobile phase gradient. The resulting method and sample chromatograms provide better resolved, more easily identifiable peaks, shorter run time, and increased sustainability compared to the original USP method. This proposed method was developed using the more refined ultra-high performance liquid chromatography (UHPLC) and serves as a more accurate and reliable method for determining hypericin content in St. John’s Wort.
1. Introduction
St. John’s Wort is commonly used as a natural health product to treat mood disorders.
It is approved as a natural health product (NHP) in Canada, as a dietary supplement in the US, and listed as a medicinal herb by the European Medicines Agency [1,2,3]. Global sales of St. John’s Wort products were estimated to be several billion dollars per year [4]. Two of the key active ingredients responsible for the herb’s medicinal qualities are hypericin and hyperforin (Figure 1a,d) [5]. Hyperforin is a compound with a phloroglucinol backbone and has been proposed to be responsible for the plant’s antidepressant and anti-anxiety properties [6]. Hypericin, a naphthodianthrone, has also been proposed to be responsible for the plant’s antidepressant properties [7]. The herb’s two commonly occurring hypericin derivatives, pseudohypericin, an oxidated version of hypericin and protopseudohypericin (Figure 1b,c), may also have similar biological effects as hypericin [8]. Because levels of these compounds vary depending on the growing conditions and the extraction methods [6,7], it is important to have suitable methods to determine their potency for safe and effective dosing.
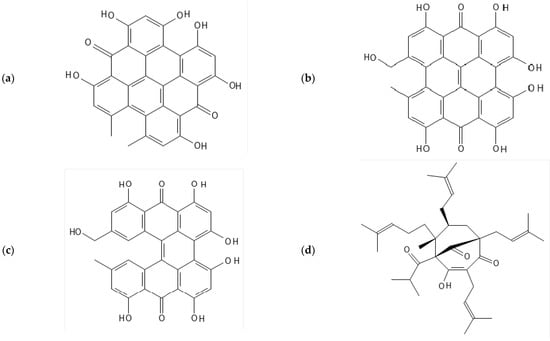
Figure 1.
Chemical structures of the St John’s Wort active ingredients (a) hypericin, (b) pseudohypericin, (c) protopseudohypericin, (d) hyperforin.
Currently, there are several methods used to determine the potency of St. John’s Wort products, including high-performance liquid chromatography (HPLC), high-performance thin-layer chromatography (HPTLC), and ultraviolet-visible (UV-Vis) spectrophotometry [9,10,11]. These methods can be used to quantify the concentrations of hyperforin and hypericin in powdered extracts, and some methods are also used for various dosage forms, such as capsules and tablets. Additionally, biological assays, such as measuring the inhibition of the enzyme Monoamine Oxidase A (MAO-A), can be used in vitro to determine pharmacological mechanisms [9]. Because each method has its advantages and disadvantages and could focus on different phytochemicals, product quality is closely linked to the performance characteristics of the selected test method. However, the most widely accepted method for quantifying active ingredients in St. John’s Wort remains HPLC due to the wide availability, high specificity, versatility, accuracy, and precision of HPLC instruments. It can be used to measure even low levels of hypericin in a diluted dosage form sample [12]. Additionally, HPLC can be coupled with UV and/or mass spectrometry (MS) detection, which allows for an even more specific and sensitive analysis of St John’s Wort actives [7,13,14,15,16].
The United States Pharmacopeia (USP) and European Pharmacopeia (EP) monographs publish a harmonized HPLC method for the determination of total hypericin in St. John’s Wort powders and extracts, and it is widely used by laboratories around the world. It is worth noting, however, that while the USP provides monographs for St. John’s Wort flowering tops, powdered St. John’s Wort flowering tops, and powder forms of extracts of St. John’s Wort flowering tops, it does not do so for capsules, tablets, or liquids that contain St. John’s Wort [9,17,18]. This raises the question of whether the same technique can accurately assess the hypericin content of those dosage forms. Moreover, a run time of 66 min means that several hours are required to analyze a sample along with its calibration standards. Furthermore, it employs a ternary gradient, whereas many HPLCs are only capable of binary gradients. Additionally, the method includes a 100% aqueous equilibration step (0.3% phosphoric acid in water), which is known to lead to irreproducible retention through a phenomenon called stationary phase collapse [19]. While there have been other studies that have published optimized methods using HPLC [20,21,22,23], each of those methods fall short of being suitable for the purposes of quantitative analysis.
The current work describes a revised method for assessing the potency of hyperforin and hypericin to be employed on HPLC, particularly ultra-high performance liquid chromatography (UHPLC), in an effort to address the reported inadequacies of the previous method. By employing a simpler binary gradient, a wavelength of 588 nm to limit interference, and purified hypericin as a replacement for oxybenzone as the primary external calibration standard, the new approach overcomes the shortcomings of the USP method. It also optimizes the equilibration stage to prevent a stationary phase collapse. The C18 column’s elution conditions were improved, the method’s run time was reduced, and sustainability was increased because fewer chemicals were consumed. The modified method was validated in accordance with the USP’s guidelines for detection limit, quantitation limit, linearity, precision and repeatability, and accuracy [24].
2. Materials and Methods
2.1. Reagents
Hypericin (Item No. 11334, Cayman Chemical, Ann Arbor, MI, USA) and oxybenzone (Primary Reference Standard, Sigma-Millipore Cat#PHR1074-1G) were used as chemical standards. For the standard solution, 0.5 mg of hypericin was accurately weighed into a 10 mL volumetric flask. A total of 8 mL of methanol was added to it, and the mixture was then sonicated in a room temperature water bath using a VWR Symphony sonicating water bath (VWR, Mississauga, ON, Canada) until the standard was dissolved. The solution was then filled up to volume and then diluted 1 in 5 with methanol to a final concentration of 0.01 mg/mL. To prepare the oxybenzone standard, 25 mg of oxybenzone was accurately weighed into a volumetric flask and 50 mL of a 1:1 mixture of acetone to water was added. The solution was diluted 1 in 100 times to obtain a final concentration of 0.005 mg/mL.
2.2. Plant Material
USP Powdered St. John’s Wort Extract RS (Lot# F0G2465 USP, Owings Mills, MD, USA) was used as the sample material. About 25 mg of the sample was accurately weighed into a volumetric flask and dissolved in 10 mL of methanol by sonicating in a room temperature water bath. A St. John’s Wort herbal extract as obtained from (InovoBiologic, Burnaby, BC, Canada) was also used as sample material. The sample (100 mg) was accurately weighed into a 50 mL volumetric flask and made to volume with methanol. The mixture was also sonicated in a room temperature water bath for 30 min and the solution became reddish-brown in color. For sample materials obtained from capsules, the procedure was the same as with the herbal extracts except a sample weight of 0.3 g was used.
2.3. HPLC
The standards and sample solutions were filtered into HPLC vials and placed in position in a Thermo-Fisher Vanquish HPLC system with an injection volume set to 5 μL and using an ACME Xceed C18 100 × 2.1 mm–1.9 µm column. The column temperature was set to 30 °C. For the mobile phase, Channel A contained 0.2% phosphoric acid in water (v/w), while Channel B contained HPLC grade acetonitrile. The detailed mobile phase gradient is described in Table 1 with flowrate set to 0.4 mL/min. The wavelengths on the UV-Visible detector were set to 270 nm and 588 nm.

Table 1.
Mobile phase gradient of the new HPLC method. Solution A is phosphoric acid and water (0.2%). Solution B is acetonitrile.
The results were analyzed using Thermo Chromeleon 7.2. A standard calibration curve obtained from hypericin and oxybenzone was used to calculate the concentration of the USP St. John’s Wort Extract RS, the herbal extracts, and the capsules containing St. John’s Wort.
2.4. Method Greenness Assessment
To assess the method greenness of the new method in contrast with the USP method, the eco-scale metric was applied. The ideal green analysis has an eco-scale value of 100. Penalty points are given to any aspect of the analysis that fails to conform to the green criteria. An excellent green analysis is any score >75 on the eco-scale, an acceptable green analysis is any score >50 on the eco-scale, and any method that scores <50 on the eco-scale is considered to be an inadequate green analysis [25]. For reagents and solvents, the calculation for penalty points is based on hazard penalty points and penalty points due to the amount used. Penalty points based on the volume used follow the rule that reagent amounts <10 mL = 1 penalty points, amounts 10–100 mL = 2 penalty points and any amounts >100 mL = 3 penalty points. Hazard penalty points are calculated as the number pictograms in a material safety data sheet multiplied by the score for the signal word. The signal word ‘safe’ = 1 penalty points, while ‘danger’ = 2 penalty points. To calculate the total penalty points for any reagent or solvent used, the penalty points from the amount are multiplied by the hazard penalty points’ instrumental energy consumption, which also has penalty points. Instruments using < 0.1 kWh per sample of energy = 0 penalty points, instruments using 0.1–1.5 kWh per sample energy = 1 penalty point, and instruments using 1.5 kWh per sample of energy = 2 penalty points. A method posing an occupational hazard can also result in penalty points. If there was a hermitization of the analytical process, 0 penalty points were allotted. However, if there was an emission of vapors into the atmosphere, 3 penalty points are allotted. The final category where penalty points can be accrued is waste. If the waste is recycled, 0 penalty points are given to the method, if waste undergoes degradation, then 1 penalty point is given, for passivation, 2 penalty points are given, and if there has been no treatment, 3 penalty points are given.
Another way to assess the method greenness is via the GAPI [26]. The GAPI uses five pentagrams, which are color-coded green, yellow, and red to evaluate and quantify the environmental influence of every step of an analytical method. The colors signify the low (green), medium (yellow), and high (red) impact on the environment. From left to right, the four surrounding pentagrams represent: (1) Sample collection, preservation, transport, and storage; (2) Sample preparation; (3) Reagents used; and (4) Instrumentation. The center pentagram represents the general method type. The GAPI was generated using a downloadable software from mostwiedzy.pl/complexgapi.
3. Results
3.1. New Method
On examining the results for the hypericin standard at 588 nm (Figure 2), hypericin shows up on the chromatogram as a single, sharp, and distinct peak around retention time 12.0 min.
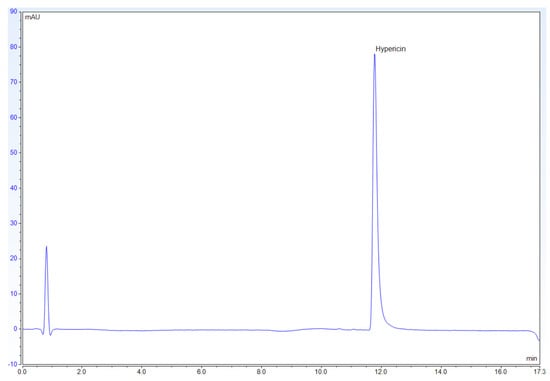
Figure 2.
Chromatogram for 0.0128 mg/mL hypericin at 588 nm.
The chromatogram for the St. John’s Wort reference at 588 nm showed the peaks belonging to hypericin and its three other derivatives, protopseudohypericin, pseudohypericin, and protohypericin, between the retention times of 10 and 12 (Figure 3). These peaks are sharp and very well defined.
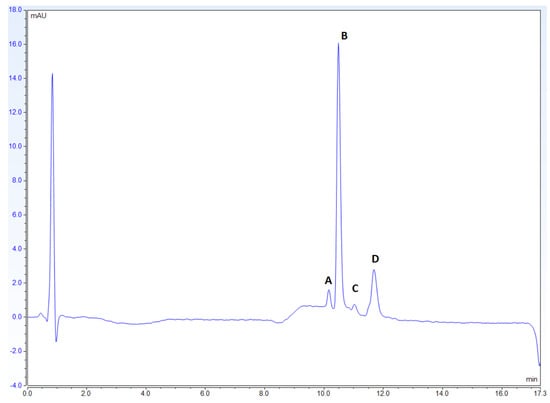
Figure 3.
Chromatogram for USP Powdered St. John’s Wort Extract RS at 588 nm. The order of the compounds represented at each of the peaks is (A) protopseudohypericin, (B) pseudohypericin, (C) protohypericin, and (D) hypericin.
A calibration curve was created using the results from both the hypericin and oxybenzone standards. The hypericin standard was injected at volumes ranging from 0.1 µL to 5.0 µL. The results from each of these volumes produced a linear curve that had an R2 value of 0.99994 and a relative standard deviation (RSD) value of 0.894%. The slope obtained from the hypericin standard was used to calibrate protopseudohypericin, pseudohypericin, and protohypericin. The response factors were adjusted based on the ratio of the molecular weight of each component against hypericin. Oxybenzone was injected 5 times at a volume of 5.0 µL. The calibration curve for oxybenzone was also a linear curve with an R2 value of 0.99994 and an RSD value of 0.42%. The slope obtained from oxybenzone was used to calculate hyperforin. Using these calculations, the total hypericin content detected for the herbal extracts was approximately 0.13%, while for capsules, the total hypericin content detected was in a range of 0.03–0.06% (see Table 2).

Table 2.
Percentage concentration of each of the St John’s Wort Actives presented in three separate lots of 300 mg St John’s Wort capsules.
This method was also validated according to the USP for detection limit, quantitation limit, linearity, precision and repeatability, and accuracy (Table 3). The calibration curve for hypericin indicated excellent linearity in the concentration range tested with an R2 value of 0.99994. The signal-to-noise ratio was determined using a 1 in 30 and a 1 in 100 dilution for the hypericin chemical standard, as well as a 1 in 30 dilution for the USP St. John’s Wort RS. The results were greater than 10 for both, demonstrating good sensitivity. The detection limit for the actives were exceptionally low with 0.000144% for hypericin calculated using the hypericin standard at 588 nm, and 0.00438% for hyperforin calculated using oxybenzone at 270 nm. The extract and the capsules were each extracted and ran 5 times in order to verify accuracy and repeatability. The results were a relative standard deviation of 3.11% for the extract and 1.58% for the capsules. For accuracy, the reference standard was run at 80%, 100%, and 120% dilutions. The results exhibited a relative standard deviation of less than 2% for each of these dilutions. The last three categories examine the chromatographic peak characteristics. Resolution determined between neighboring peaks ranged between 1.75–4.85, tailing factor ranged between 1.12–1.31, and peak asymmetry ranged between 1.19–1.61, all indicating clean, sharp, and well-defined peaks.

Table 3.
Method validation.
3.2. Original USP Method
The original USP method requires the use of oxybenzone as a calibration standard, and for its results to be examined at a wavelength of 270 nm. In comparison to hypericin as a standard, oxybenzone is barely detectable in HPLC chromatograms and has a different UV absorption maxima from hypericin (Figure 4a,b).
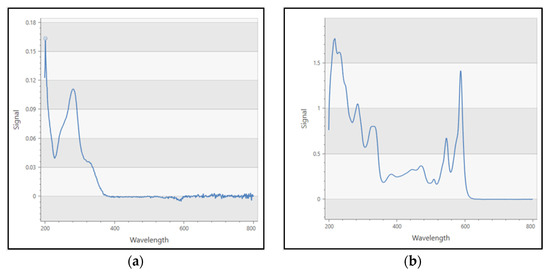
Figure 4.
(a) UV spectrum of oxybenzone standard. Max spectra at around 270 nm; (b) UV spectrum of hypericin standard. Max spectra at 588 nm.
In contrast with the novel method that uses 588 nm alone, the USP method uses 270 nm as the primary wavelength for quantification. The peaks yielded at this wavelength are small, poorly defined peaks that are difficult to identify correctly (Figure 5 and Figure 6).
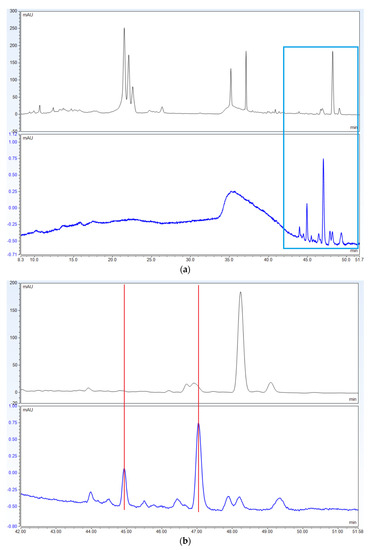
Figure 5.
(a) Chromatograms of USP Powdered St. John’s Wort Extract RS using USP’s harmonized method. Top: 270 nm. Bottom: 588 nm; (b) The squared off section has been magnified demonstrating that the peaks in 588 nm do not align with peaks in 270 nm.
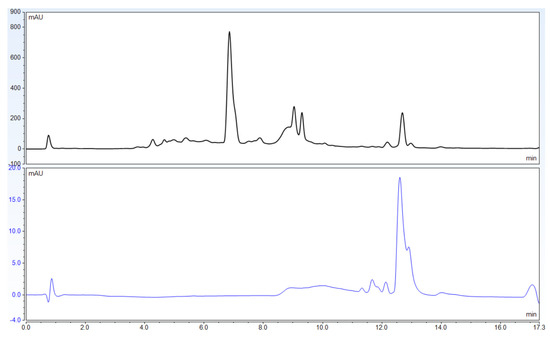
Figure 6.
Chromatograms of USP Powdered St. John’s Wort Extract RS adapted to UHPLC column dimensions and flow rates. The top chromatogram uses 270 nm wavelength, while the bottom chromatogram uses 588 nm.
3.3. Further Mobile Phase Studies
In order to establish the best mobile phase for this analysis, the use of methanol instead of acetonitrile as the organic solvent was also studied. This, however, proved to be an unsuitable substitution as the resulting chromatogram showed very poor separation of the target compounds (Figure 7).
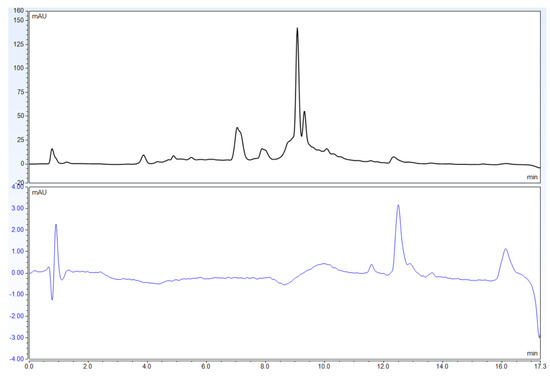
Figure 7.
Chromatograms of USP Powdered St. John’s Wort Extract RS using 0.2% phosphoric acid and methanol alone. The top chromatogram uses 270 nm wavelength, while the bottom chromatogram uses 588 nm.
3.4. Method Greenness Assessment
To assess the method greenness of the new method in contrast with the USP method, the eco-scale metric was applied. The ideal green analysis has an eco-scale value of 100. Penalty points are given to any aspect of the analysis that fail to conform to the green criteria. The GAPI was also generated for each of these methods.
3.4.1. USP Method
The GAPI for the USP method (Figure 8a) shows five green, six yellow, and four red fields.
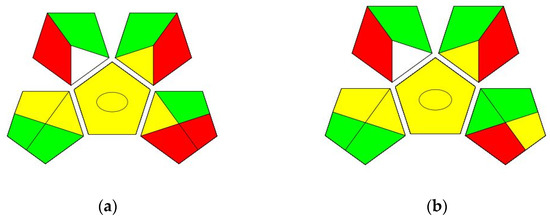
Figure 8.
The GAPI assessment of the (a) USP method and (b) the proposed UHPLC method.
Regarding the eco-scale calculation for this method, the penalty points were calculated and reported. The total penalty points for any reagent or solvent used the penalty points from the amount are multiplied by the hazard penalty points. In the case of the USP method, the reagents used were methanol, water, phosphoric acid, and acetonitrile. Taking into account sample prep and its use as a mobile phase, the volume of methanol used would be >100 mL. Thus, giving it three penalty points. The safety data sheet for methanol has three pictograms and the signal word ‘danger’. Therefore, the hazard penalty points are calculated as 3 × 2 = 6. Therefore, the total penalty points for methanol are 3 × 6 or 3 × 3 × 2 = 18 penalty points. For acetonitrile, it was used in the mobile phase, earning it 3 penalty points for amount >100 mL. The safety data sheet for acetonitrile has two pictograms and the signal word ‘danger’. The total penalty points for acetonitrile therefore would be 3 × 2 × 2 = 12 penalty points. For phosphoric acid, it is also used as a mobile phase, thus earning three penalty points. The safety data sheet for phosphoric acid also has 2 pictograms and the signal word ‘danger’ and thus this reagent’s total penalty points would be the same as acetonitrile with 3 × 2 × 2 = 12 penalty points. HPLC grade water was used to prepare the phosphoric acid but has no safety data sheet warnings or penalty points, and thus, has 0 penalty points. The Sonicator uses <0.1 kWh of energy and was given 0 penalty points, while the HPLC on the other hand uses between 0.1–1.5 kWh of energy, and thus, was given 1 penalty point. No vapors were emitted into the air, and thus, zero penalty points were given. There was no waste treatment for this method, and thus, it was given three penalty points.
3.4.2. New UHPLC Method
The GAPI for the new UHPLC method (Figure 8b) showed six green, six yellow, and three red fields.
The eco-scale calculations were also carried out by calculating the penalty points for this method. In this new method, the reagents being used were the same as with USP, with the exception of methanol, which was only used in sample preparation and excluded from the mobile phase. Consequently, while all the reagent points stayed the same, methanol’s penalty points reduced from 18 to 12 (2 (10–100 mL) × 3 (pictograms) × 2 (danger)). For the instrumental energy used, as before, the Sonicator was used, and its 0 penalty points stayed the same as in the USP method. The switch to UHPLC brings the points for this method down as UHPLC also uses < 0.1 kWh of energy per sample, giving only 0 penalty points. As in the previous method, no vapors were emitted into the air, and there was no waste treatment, thus allotting this method 0 and 3 penalty points, respectively.
In tallying up the eco-scale scores (see Table 4), we see that the USP method has 46 penalty points, and the new method has 39 penalty points. Subtracting these points from 100, we see that the USP method is at 54 on the eco-scale, while the new method is at 61. An excellent green analysis is any score > 75 on the eco-scale, an acceptable green analysis is any score >50 on the eco-scale, and any method that scores <50 on the eco-scale is considered to be an inadequate green analysis. Both methods are in the acceptable greenness section of the eco-scale though the new method is higher with seven points in its favor.

Table 4.
An outline of the penalty points for the new proposed method against the USP method using the eco-scale calculation where an analysis is deemed excellent if >75, acceptable if >50, and inadequate if <50.
4. Discussion
The most widely accepted quantification method for hypericin is HPLC with UV detection [12,14,16,27,28]. This method is based on reverse phase liquid chromatography (RPLC) using a C18 column. The mobile phase is typically composed of a mixture of water and an organic solvent (such as methanol or acetonitrile) with pH adjusted to 2–3. Importantly, in order to obtain good separation of the compounds, a mobile phase that contains an appropriate amount of organic solvent, typically 10–30%, should be used. Poor retention reproducibility tends to result when the organic phase drops below about 10% [23].
The current USP method has a run time of 66 min, and uses a ternary gradient: 0.3% phosphoric acid in water, methanol, and acetonitrile (Table 5). The stationary phase of the RPLC is composed of silica particles chemically bonded with a hydrophobic octadecylsilane (C18) ligand. Retention of the analytes mainly results from hydrophobic interactions between the compounds and the C18 stationary phase. However, when 100% aqueous mobile phase is used without any organic modifiers, the hydrophobic C18 ligands are forced to interact more with each other than with the analytes of interest.

Table 5.
HPLC mobile phase gradient from the USP monograph for St. John’s Wort. Solution A is phosphoric acid and water (3:997). Solution B is acetonitrile. Solution C is methanol.
Reduced interaction with the stationary phase means that the compounds elute from the column quickly, resulting in poor retention and separation. Additionally, the lack of an organic modifier can cause the C18 ligands to become protonated by the acidic mobile phase, which can further reduce the retention and separation of the compounds [29]. This can lead to poor peak shape and resolution. While equilibrating the column is a necessary step to ensure the column is in a steady state before sample injection, in the case of C18 columns, it is important to equilibrate the column with a mobile phase that contains an appropriate amount of organic solvent, typically 10–30%, to maintain good separation and resolution of the compounds [30].
Another issue is that the USP method uses oxybenzone as an external calibration standard, and oxybenzone is less than ideal in this application for several reasons: (1) It is not an endogenous compound of St. John’s Wort; (2) It is not chemically related to hypericin or hyperforin; (3) It has different UV absorption maxima from hypericin; and (4) It is barely detectable in HPLC chromatograms at the concentrations prescribed by the monograph (See Figure 4a,b). The selection of 270 nm as the primary wavelength for quantitation further complicates the problem. St John’s Wort extracts yield small, poorly defined peaks that are difficult to identify correctly at this wavelength due to the number of interfering compounds absorbing at this wavelength (See Figure 5, magnified section and Figure 6).
In light of these drawbacks, the current work optimized the USP method to provide better separation and more accurate detection of hypericin. Firstly, this improved method features the use of only 2 solvents channels, instead of the 3: 0.2% phosphoric acid in water, and acetonitrile. The binary gradient allows for the use of high-pressure mixing binary pumps in addition to low pressure mixing quaternary pumps. Binary pumps offer higher gradient precision and lower dwell volume so that their use with mass spectrometers is optimal. The peak responses were recorded at 588 nm instead of 270 nm, and were better defined and easier to identify (See Figure 3). Furthermore, the run time has been reduced to 17 min (Figure 2 and Figure 3 vs. Figure 5). The use of methanol instead of acetonitrile as the organic modifier was also investigated. However, the target analytes were very poorly separated with this substitution (Figure 7). It is possible that additional gradient optimization could improve separation, but it will come at the expense of a longer run time.
The current study is not the first to present shorter HPLC methods for hypericin. Compared to the USP method, the optimized and validated HPLC method reported by Zeliou et al. offer much better separation of St. John’s Wort phytochemicals in extracts and finished products with a run time of 60 min [20]. Petrovic and Stamenkovic reported an optimized HPLC method with a run time of less than 25 min, but they did not take advantage of the increased separation efficiencies from using acetonitrile as an organic modifier [21]. Puri et al. reported three methods for the separation of naphthodianthrones from St. John’s Wort using HPLC with a mixture of methanol, ethyl acetate, and water (67:16:17 v/v/v) at pH 3 as the mobile phase [22]. The first method is preparative HPLC with a flow rate of 15 mL/min and a cycle time of 7 min. While the method is very fast, the peaks are not separated well enough for quantitative purposes, and the solvent consumption is extremely high. Very few details were reported for the second method other than that it used the same mobile phase with a flow rate of 0.8 mL/min. However, cycle time can be estimated to be about 20 min from the published chromatogram. The third method was designed for mass spectrometric detection and had a cycle time of about 40 min based on the published chromatogram. Since no validation data were presented [22], it is difficult to determine the suitability of using these methods for the quantitative determination of hypericin. In comparison, the method proposed by the current study has been validated and used a lower flow rate of 0.4 mL/min to further reduce chemical waste.
While the USP method relies on oxybenzone to quantify the amount of hypericin, pseudohypericin, and hyperforin in the samples, the current study used purified hypericin as a calibration standard instead of relying on an unrelated compound. Hypericin is structurally similar to pseudohypericin and would serve as a better surrogate standard (Figure 1). Previous studies have reached similar conclusions. For example, Zeliou et al. validated a multi-wavelength HPLC method at 270 nm (for phloroglucinols), 300 nm (for phenolic acids), 350 nm (for flavonoids), and 590 nm (for naphthodianthrones, including hypericin) using hypericin to quantify naphthodianthrones, but the method used a ternary gradient with a run time of 60 min [20]. Alahmad et al. also outline a multi-wavelength HPLC method, instead using 260 nm, 350 nm, and 590 nm for the aforementioned respective compounds and also a ternary gradient using 0.1% formic acid, methanol, and water. While the peaks produced at 260 nm and 350 nm for the phloroglucinol and flavonoid compounds were relatively distinct and sharp, at 590 nm the peaks corresponding to the naphthodianthrones were especially weak and showed poor separation. Furthermore, at a run time of almost 100 min, the method employed is much longer than the USP or other published methods [23]. Huck-Pezzei et al. used a binary gradient with hypericin, pseudohypericin, hyperforin, rutin, hyperoside, and quercetin as reference standards; however, the run time is 65 min including equilibration [27]. Sakavitsi et al. described an UHPLC-HRMS & MS/MS method using a binary gradient, but the run time is still 24 min per sample [16]. The current study injected 0.0128 mg/mL hypericin at volumes ranging from 5 μL to 0.1 μL. The equivalent concentrations of hypericin to plot the standard curve are 0.0128 mg/mL, 0.00512 mg/mL, 0.00384 mg/mL, 0.00256 mg/mL, 0.001792 mg/mL, 0.00128 mg/mL, 0.000512 mg/mL, and 0.000256 mg/mL. The resulting calibration curve had an R2 value of 0.99994 using linear curve fitting with an offset from origin. The results obtained using this information gave a total hypericin value of 0.13% in herbal material and a range of 0.03–0.06% total hypericin in capsules and tablets. Oxybenzone was kept as a standard for use in calculating hyperforin content, since hyperforin has better detection at 270 nm; additionally, the standard for hyperforin is not commercially viable due to excessive cost. Most of the commercial extracts tested are shown to have low hyperforin content anyway; therefore, this method will continue to use oxybenzone as standard, not deviating from USP specification. The resulting linear curve produced had an R2 value of 0.99994. The total hyperforin content calculated in USP extract was 2.3–2.4%.
While this new method can be adapted to run on older HPLC instruments, it would benefit most from the higher pump pressure limits, faster detector scan speeds, and reduced gradient delay volumes of modern UHPLC instruments. The improved instrument performance of UHPLC also provides increased resolution, faster analysis, increased productivity, increased sensitivity, and greater flexibility.
The method greenness assessment shows that the eco-scale number for the proposed new UHPLC method is 61, which is 7 points higher than that of the USP method, which was 54. While both methods remain in the same category of acceptable greenness, there is possible room for improvement for the new method by modifying the volume of methanol used in sample preparation, or by investigating solvents with a lower environmental impact that can be used to extract the actives just as effectively, and also by investigating ways to even further treat or minimize the amount of chemical waste from the analysis. Future work can be conducted to further investigate what modification can be made to increase the greenness of this method.
5. Conclusions
The proposed new method using UHPLC to determine total hypericin and hyperforin content in St. John’s Wort products provides a more efficient and accurate approach compared to the original method outlined by the USP. We plan to submit this new method to the USP for consideration in the St John’s Wort monograph. By using UHPLC, the method can achieve better separation and resolution of the target compounds with higher sensitivity and faster analysis time. This improved method is expected to enhance the quality control of St. John’s Wort products by increasing the reliability of the measurements for potency, providing greater confidence in the accuracy of the labeling claims for consumers. Overall, the implementation of this new method can lead to better standardization and quality assurance in the production and distribution of St. John’s Wort products, ultimately benefiting both the industry and the consumers. As the herbal medicine industry continues to grow, there are many other herbal analysis methods that could obtain the same benefits from better standardization and adaptation to UHPLC. The undertaking of this should be considered in future works.
Author Contributions
Conceptualization, C.C.; Methodology, L.W.; Validation, L.W.; Formal analysis, L.W.; Investigation, L.W.; Resources, C.C.; Data curation, L.W. and A.I.; writing—original draft preparation, A.I.; Writing—review and editing, A.I., L.W., C.C. and J.S.; Visualization, A.I. and L.W.; Supervision, C.C.; Project administration, A.I.; Funding acquisition, C.C. All authors have read and agreed to the published version of the manuscript.
Funding
This research was funded by ISURA’s research fund as part of its non-profit mandate.
Data Availability Statement
Data are contained within the article.
Acknowledgments
We thank the ISURA staff and clients for their ongoing support of our research efforts.
Conflicts of Interest
The authors declare no conflict of interest. The funders had no role in the design of the study; in the collection, analyses, or interpretation of data; in the writing of the manuscript; or in the decision to publish the results.
References
- Government of Canada, Health Canada. Monograph: St. John’s Wort. Available online: https://webprod.hc-sc.gc.ca/nhpid-bdipsn/monoReq.do?id=163&lang=eng (accessed on 21 February 2023).
- National Center for Complemetary and Integrative Health. Health Information, St. John’s Wort. Available online: https://www.nccih.nih.gov/health/st-johns-wort (accessed on 21 February 2023).
- EMA. Hyperici Herba. Available online: https://www.ema.europa.eu/en/medicines/herbal/hyperici-herba (accessed on 23 February 2023).
- Zanoli, P. Role of Hyperforin in the Pharmacological Activities of St. John’s Wort. CNS Drug Rev. 2004, 10, 203–218. [Google Scholar] [CrossRef]
- Klemow, K.M.; Bartlow, A.; Crawford, J.; Kocher, N.; Shah, J.; Ritsick, M. Medical Attributes of St. John’s Wort (Hypericum Perforatum). In Herbal Medicine: Biomolecular and Clinical Aspects; Benzie, I.F.F., Wachtel-Galor, S., Eds.; CRC Press: Boca Raton, FL, USA; Taylor & Francis: Oxford, UK, 2011; ISBN 978-1-4398-0713-2. [Google Scholar]
- Butterweck, V.; Petereit, F.; Winterhoff, H.; Nahrstedt, A. Solubilized Hypericin and Pseudohypericin from Hypericum Perforatum Exert Antidepressant Activity in the Forced Swimming Test3. Planta Med. 1998, 64, 291–294. [Google Scholar] [CrossRef] [PubMed]
- Lou, H.; Ma, F.; Yi, P.; Hu, Z.; Gu, W.; Huang, L.; He, W.; Yuan, C.; Hao, X. Bioassay and UPLC-Q-Orbitrap-MS/MS Guided Isolation of Polycyclic Polyprenylated Acylphloroglucinols from St. John’s Wort and Their Neuroprotective Activity. Arab. J. Chem. 2022, 15, 104057. [Google Scholar] [CrossRef]
- Vandenbogaerde, A.; Zanoli, P.; Puia, G.; Truzzi, C.; Kamuhabwa, A.; De Witte, P.; Merlevede, W.; Baraldi, M. Evidence That Total Extract of Hypericum Perforatum Affects Exploratory Behavior and Exerts Anxiolytic Effects in Rats. Pharmacol. Biochem. Behav. 2000, 65, 627–633. [Google Scholar] [CrossRef]
- St. John’s Wort Flowering Top Dry Extract; Dietary Supplements; United States Pharmacopeia: North Bethesda, MD, USA, 2020.
- Gîtea, D.; Sipos, T.; Mircea, T.; Pasca, B. The Analysis of Alcoholic Extracts of Hypericum Species by UV/Vis Spectrophotometry. Ann. Oradea Univ. Biol. Fascicle 2010, 17, 111–115. [Google Scholar]
- McCutcheon, A. Botanical Adulterants Bulletin on St. John’s Wort (Hypericum Perforatum). 2017. Available online: www.botanicaladulterants.org (accessed on 27 February 2023).
- Zhang, J.; Gao, L.; Hu, J.; Wang, C.; Hagedoorn, P.-L.; Li, N.; Zhou, X. Hypericin: Source, Determination, Separation, and Properties. Sep. Purif. Rev. 2022, 51, 1–10. [Google Scholar] [CrossRef]
- Chandrasekera, D.H.; Heinrich, M.; Ashton, D.; Welham, K.J.; Middleton, R. Quantitative Analysis of the Major Constituents of St John’s Wort with HPLC-ESI-MS. J. Pharm. Pharmacol. 2010, 57, 1645–1652. [Google Scholar] [CrossRef]
- Schmidt, B.; Jaroszewski, J.W.; Bro, R.; Witt, M.; Stærk, D. Combining PARAFAC Analysis of HPLC-PDA Profiles and Structural Characterization Using HPLC-PDA-SPE-NMR-MS Experiments: Commercial Preparations of St. John’s Wort. Anal. Chem. 2008, 80, 1978–1987. [Google Scholar] [CrossRef]
- Raclariu, A.C.; Paltinean, R.; Vlase, L.; Labarre, A.; Manzanilla, V.; Ichim, M.C.; Crisan, G.; Brysting, A.K.; de Boer, H. Comparative Authentication of Hypericum Perforatum Herbal Products Using DNA Metabarcoding, TLC and HPLC-MS. Sci. Rep. 2017, 7, 1291. [Google Scholar] [CrossRef] [PubMed]
- Sakavitsi, M.E.; Christodoulou, M.-I.-M.; Tchoumtchoua, J.; Fokialakis, N.; Kokkinopoulou, I.; Papageorgiou, E.; Argyropoulou, A.; Skaltsounis, L.; Halabalaki, M.; Scorilas, A. Comparative HPLC-DAD and UHPLC-ESI(-)-HRMS & MS/MS Profiling of Hypericum Species and Correlation with Necrotic Cell-Death Activity in Human Leukemic Cells. Phytochem. Lett. 2017, 20, 481–490. [Google Scholar] [CrossRef]
- St. John’s Wort Flowering Top; Dietary Supplements; United States Pharmacopeia: North Bethesda, MD, USA, 2017.
- St. John’s Wort Flowering Top Powder; Dietary Supplements; United States Pharmacopeia: North Bethesda, MD, USA, 2017.
- Nagae, N. Retention Behavior of Reversed-Phase HPLC Columns with 100% Aqueous Mobile Phases. Bunseki Kagaku 2010, 59, 193–205. [Google Scholar] [CrossRef]
- Zeliou, K.; Kontaxis, N.I.; Margianni, E.; Petrou, C.; Lamari, F.N. Optimized and Validated HPLC Analysis of St. John’s Wort Extract and Final Products by Simultaneous Determination of Major Ingredients. J. Chromatogr. Sci. 2017, 55, 805–812. [Google Scholar] [CrossRef] [PubMed]
- Petrovic, G.; Stamenković, J. Optimization of HPLC Method for the Isolation of Hypericum perforatum L. Methanol Extract. Biol. Nyssana 2013, 4, 81–85. [Google Scholar]
- Puri, S.; Handa, G.; Kalsotra, A.K.; Gupta, V.K.; Shawl, A.S.; Suri, O.P.; Qazi, G.N. Preparative High-Performance Liquid Chromatographic Separation of Naphthodianthrones from St. John’s Wort. J. Chromatogr. Sci. 2006, 44, 177–180. [Google Scholar] [CrossRef]
- Alahmad, A.; Alghoraibi, I.; Zein, R.; Kraft, S.; Drager, G.; Walter, J.; Scheper, T. Identification of Major Constituents of Hypericum perforatum L. Extracts in Syria by Development of a Rabid, Simple, and Reproducible HPLC-ESI-Q-TOF MS Analysis and Their Antioxidant Activities. ACS Omega 2022, 7, 13475–13493. [Google Scholar] [CrossRef]
- USP-NF. <1225> Validation of Compendial Procedures. Available online: https://doi.usp.org/USPNF/USPNF_M99945_04_01.html (accessed on 13 February 2023).
- Galuszka, A.; Konieczka, P.; Migaszewski, Z.M.; Namkiesnik, J. Analytical Eco-Scale for assessing the greennss of analytical procedures. Trends Anal. Chem. 2012, 37, 61–72. [Google Scholar] [CrossRef]
- Plotka-Wasylka, J. A new tool for the evaluation of the analytical procedure: Green Analytical Procedure Index. Talanta 2018, 181, 204–209. [Google Scholar] [CrossRef]
- Huck-Pezzei, V.; Bittner, L.; Pallua, J.; Sonderegger, H.; Abel, G.; Popp, M.; Bonn, G.; Huck, C. A Chromatographic and Spectroscopic Analytical Platform for the Characterization of St John’s Wort Extract Adulterations. Anal. Methods 2013, 5, 616–628. [Google Scholar] [CrossRef]
- Isacchi, B.; Bergonzi, M.; Carnevali, F.; Van der Esch, S.A.; Vincieri, F.; Bilia, A.R. Analysis and Stability of the Constituents of St. John’s Wort Oils Prepared with Different Methods. J. Pharm. Biomed. Anal. 2008, 45, 756–761. [Google Scholar] [CrossRef]
- Dai, J.; Yang, X.; Carr, P.W. Comparison of the Chromatography of Octadecyl Silane Bonded Silica and Polybutadiene-Coated Zirconia Phases Based on a Diverse Set of Cationic Drugs. J. Chromatogr. A 2003, 1005, 63–82. [Google Scholar] [CrossRef]
- Gritti, F.; Walter, T. Retention Loss of Reversed-Phase Columns Using Highly Aqueous Mobile Phases: Fundamentals, Mechanism, and Practical Solutions. LCGC N. Am. 2020, 39, 33–40. [Google Scholar] [CrossRef]
Disclaimer/Publisher’s Note: The statements, opinions and data contained in all publications are solely those of the individual author(s) and contributor(s) and not of MDPI and/or the editor(s). MDPI and/or the editor(s) disclaim responsibility for any injury to people or property resulting from any ideas, methods, instructions or products referred to in the content. |
© 2023 by the authors. Licensee MDPI, Basel, Switzerland. This article is an open access article distributed under the terms and conditions of the Creative Commons Attribution (CC BY) license (https://creativecommons.org/licenses/by/4.0/).