Article

Comparative Study of E-Nose, GC-MS, and GC-IMS to Distinguish Star Anise Essential Oil Extracted Using Different Extraction Methods

School of Chemical Engineering and Light Industry, Guangdong University of Technology, Guangzhou 510006, China
*
Author to whom correspondence should be addressed.
Separations 2023, 10(4), 256; https://doi.org/10.3390/separations10040256
Submission received: 10 March 2023 / Revised: 8 April 2023 / Accepted: 11 April 2023 / Published: 16 April 2023

Abstract

:
In this study, star anise (Illicium verum) essential oils (SAEOs) were extracted by hydrodistillation (HD), ethanol solvent extraction (ESE), supercritical CO2 (SCD) and subcritical extraction (SE) via electronic nose (E-nose), gas chromatography-mass spectrometry (GC-MS), and GC-ion mobility spectrometry (GC-IMS). GC-MS and GC-IMS were used to identify the volatile compounds, and GC-MS was also used to determine their concentrations. Principal component analysis (PCA) and linear discriminant analysis (LDA) were used to visualise volatile compounds and differentiate samples. The results showed that anethole and limonene were the main volatile compounds in SAEOs extracted using the four methods and their components were similar, albeit in different proportions. In addition, the fingerprints of their volatile components were established via E-nose and GC-IMS analyses. In general, GC-MS, GC-IMS, and E-nose combined with PCA and LDA analysis could accurately distinguish SAEOs extracted using different extraction methods, and GC-IMS was identified as the most suitable method because of its accuracy and rapidity.

1. Introduction

Star anise (Illicium verum) essential oils (SAEOs) are widely used in cosmetics, food products, pharmaceuticals, and pesticides. They have effective antioxidant [1] and antibacterial [2] activities, prevent cancer [3], reduce inflammation [4], and repel insects [5]. The main components of SAEOs are aromatic compounds and terpenes, which can be extracted by hydrodistillation (HD), steam distillation, solvent extraction (SE), and supercritical fluid CO2 extraction. HD has a low extraction rate, high energy consumption, and a long extraction time [6]. Ahmed et al. [7] indicated that star anise water extract exhibited moderate and selective cytotoxic effects against HepG2 cell lines compared with those of essential oil. Solvent extraction not only requires a low temperature but also residual organic solvents [8]. Compared with HD and solvent extraction, critical extraction, which has a higher yield, can protect the extract from thermal degradation and solvent pollution [9]. These methods are widely used in the extraction of essential oils [10].
It has been reported that the bioactivity of essential oil is determined by its composition, which can be affected by extraction methods, solvent polarity, and extraction conditions [11,12,13,14]. Marjoram essential oils containing 21% volatile oils extracted using supercritical CO2 (SCD) and those containing 9% volatile oils extracted using Soxhlet ethanol showed significantly different antibacterial activities [15]. Glistic et al. [16] also found that the carrot essential oils obtained by the supercritical extraction method exhibited the strongest antibacterial effect against gram-positive bacteria, indicating that exploring suitable methods to extract essential oils is necessary.
However, it is important to develop instruments with high sensitivity and speed for analysing essential oils. Electronic nose (E-nose), as an intelligent system equipped with a series of chemical sensors, has high sensitivity and a rapid analysis speed [17]. Gas chromatography-ion mobility spectrometry (GC-IMS) can also be used to characterise volatile compounds because of its high sensitivity characteristic. Both are widely used to discriminate between authenticity and adulteration because of their high sensitivity, rapid analysis, low cost, and ease of construction [18,19,20,21]. Kalinichenko et al. [22] combined an E-nose with chemometric approaches to distinguish between the authenticity and adulteration of sausages with soy protein. E-nose and GC-IMS are suitable for characterising essential oils extracted using diverse different extraction methods [23].
Different extraction methods are used for a variety of applications. However, the cost performance greatly differs among essential oils that are extracted by different methods, thereby causing adulteration in the market. The present study mainly focused on the components and biological activities of essential oils extracted using different methods, whereas there are few references for rapid discrimination. Moreover, there are no rapid, low-cost techniques for the detection and quantitative assessment of essential oil products to avoid different types of fraud in the essential oil industry. Therefore, it is necessary to establish a rapid and highly sensitive method for detecting essential oils extracted by different methods. In this study, E-nose, GC-mass spectrometry (MS), and GC-IMS combined with principal component analysis (PCA) and linear discriminant analysis (LDA) were used to evaluate SAEOs extracted by HD, ethanol solvent extraction (ESE), SCD, and subcritical extraction (SE). This study aimed to establish the fingerprints of the volatile components of SAEOs extracted by the four methods and allow the realisation of effective quality control over adulterated or counterfeit essential oil products in the market.

2. Materials and Methods

2.1. HD

Dried star anise (70 g), which was obtained from Yulin City (Guangxi Province), was crushed, sifted, and poured into 700 mL of water, followed by HD for 2.5 h after sieving. The distillate was collected as the SAEO and stored at 4 °C for further use.

2.2. ESE

Star anise (100 g) was mixed with absolute ethanol (Damao Chemical Reagent Co., Ltd., Tianjin, China) at a ratio of 1:20 g/mL after crushing and sieving. The mixture was then stirred at 25 °C for 3 h. The ethanol in the extractions was removed via rotary evaporation at 50 °C and the obtained SAEO was kept at 4 °C after filtration.

2.3. SCD

Star anise (250 g) was crushed, sifted, and added to the reaction kettle for extraction at 50 °C and 20 MPa for 2 h with a CO2 flow rate of 20 L/h. After 2 h of extraction, the SAEO was obtained at 7 MPa and 40 °C and stored at 4 °C for further use.

2.4. SE

Star anise (100 g) was crushed and extracted with butane by using CBE-5L subcritical equipment (Henan, China) at 0.5 MPa and 45 °C for 40 min. After extraction, the SAEO was obtained and kept at 4 °C for further use.

2.5. E-Nose Data Acquisition

First, 2 mL of SAEO was placed into 40 mL headspace injection bottles. After 50 min, gas samples of SAEO were collected from the headspace equilibrium sample at 20 °C. Detection was performed at 25 °C. The parameters of the E-nose (PEN3, Germany) were as follows: flush time, 80 s; measurement time, 100 s; zero-point trim time, 10 s; pre-sampling time, 5 s; chamber flow, 450 mL/min; and initial injection flow, 300 mL/min. The aroma characteristics of each sample were described by the response values corresponding to the 10 sensors as presented in Table 1.

2.6. HS-Solid-Phase Microextraction-GC-MS Data Acquisition

The sample (1 g) extracted by HD was pre-treated by solid-phase microextraction (SPME) using a 65 μm PDMS/DVB coating extraction head at 70 °C for 1.5 h, and the SAEOs extracted by SCD, SE, and ESE were directly injected. The samples were then placed in the injection port to allow desorption. The injection mode was non-shunt injection.
The GC−mass spectrometer was equipped with an Agilent 7890A (Agilent Santa Clara CA, USA) coupled with an Agilent 5977B (Agilent CA, USA). An HP-5MS (60 m × 0.25 mm × 0.25 μm) capillary chromatography column (Agilent) was used for separation with helium (purity ≥ 99.999%) at a flow rate of 1 mL/min. The linear temperature program was as follows: the initial oven temperature was 50 °C and held for 3 min, then was increased to 180 °C at a rate of 2 °C/min, and finally increased to 300 °C at 20 °C/min and held for 10 min. The injector temperature was 250 °C and the shunt ratio was 120: 1. The temperature of the four-stage rod was set at 150 °C. The ion source for MS detection was EI in the positive mode at 70 eV at 230 °C. Mass spectra were obtained in the scan range of 29–550 amu.

2.7. GC-IMS Data Acquisition

A FlavourSpec from G.A.S. (Dortmund, Germany) and gas chromatography (Agilent Technologies, Agilent, CA, USA) were used to obtain HS-GC-IMS data. First, 100 μL of SAEO was automatically injected in the splitless mode at 85 °C after hatching for 5 min. The injection needle temperature was 85 °C and the IMS temperature was 45 °C. The separation was carried out on an FS-SE-54-CB-1 (15 m × 0.53 mm ID: 0.53 mm) column at 40 °C. Nitrogen (99.99% purity) was used as the carrier gas and the linear pressure program was as follows: 2 mL/min for 2 min, ramped up to 20 mL/min for 8 min, ramped up to 100 mL/min for 10 min, then, ramped up to 150 mL/min for 10 min, and held for 10 min. Nitrogen was used as a drift gas at a flow rate of 150 mL/min. LAV software version 2.2.1 (Gesellschaft für Analytische Sensorsysteme mbH, Dortmund, Germany) was used to collect the data.

2.8. Statistical Analysis

The results (mean ± standard deviation (SD)) were analysed using Origin 2017, and differences among mean values were compared by using one-way analysis of variance, with p < 0.05 considered to be significant. Each assay was performed in triplicate and the data are expressed as means ± SD. GC-MS data combined with PCA data were analysed using SIMCA-P 11.

3. Results and Discussion

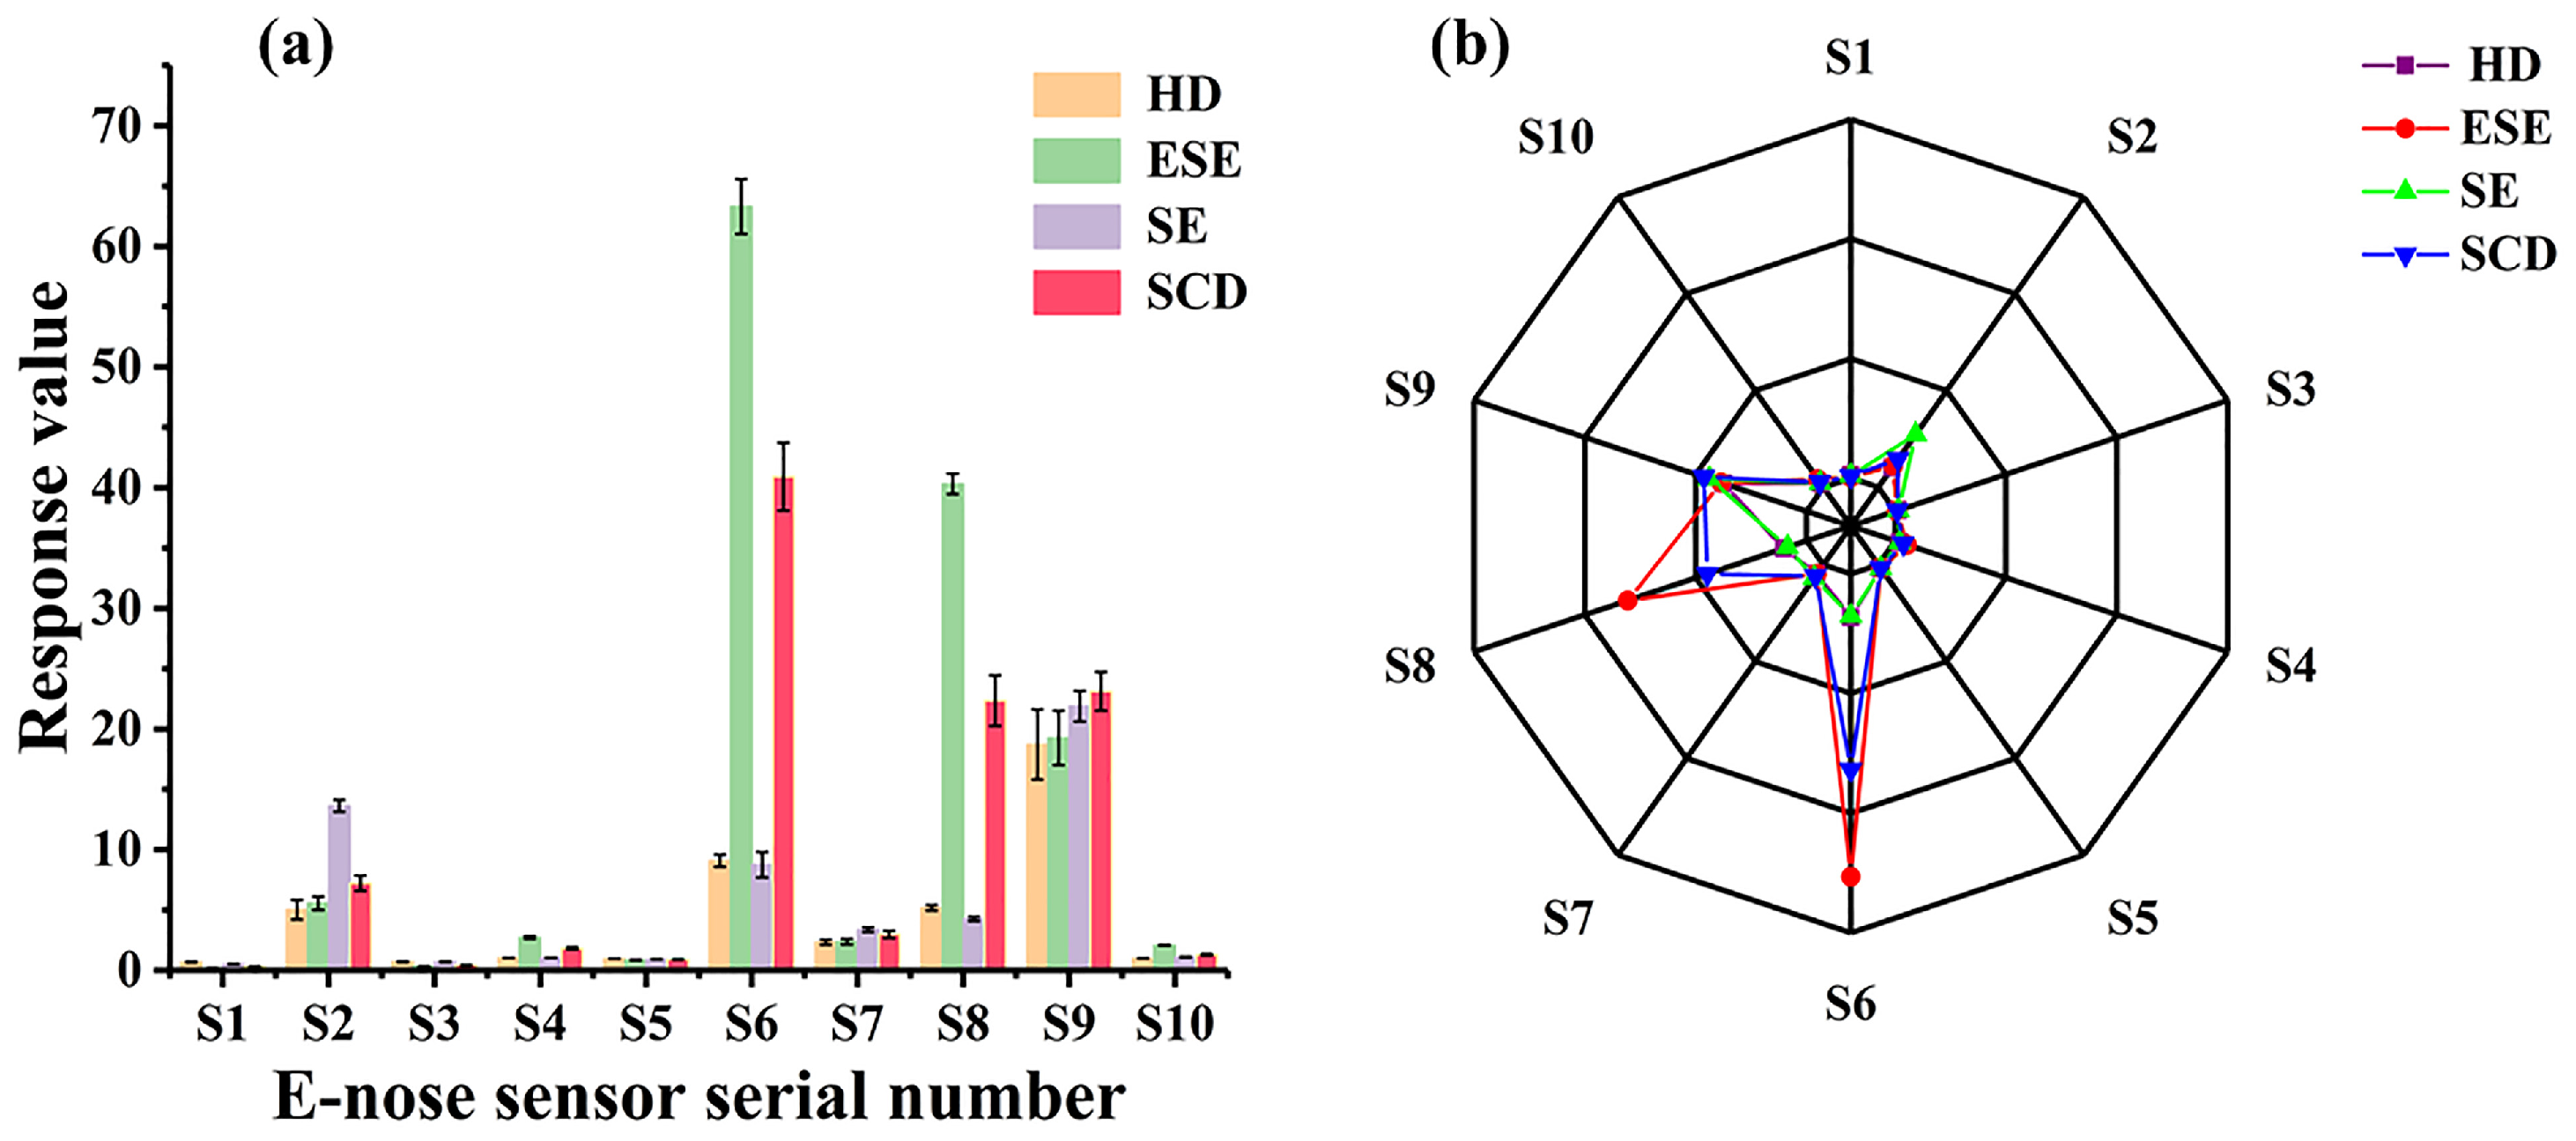
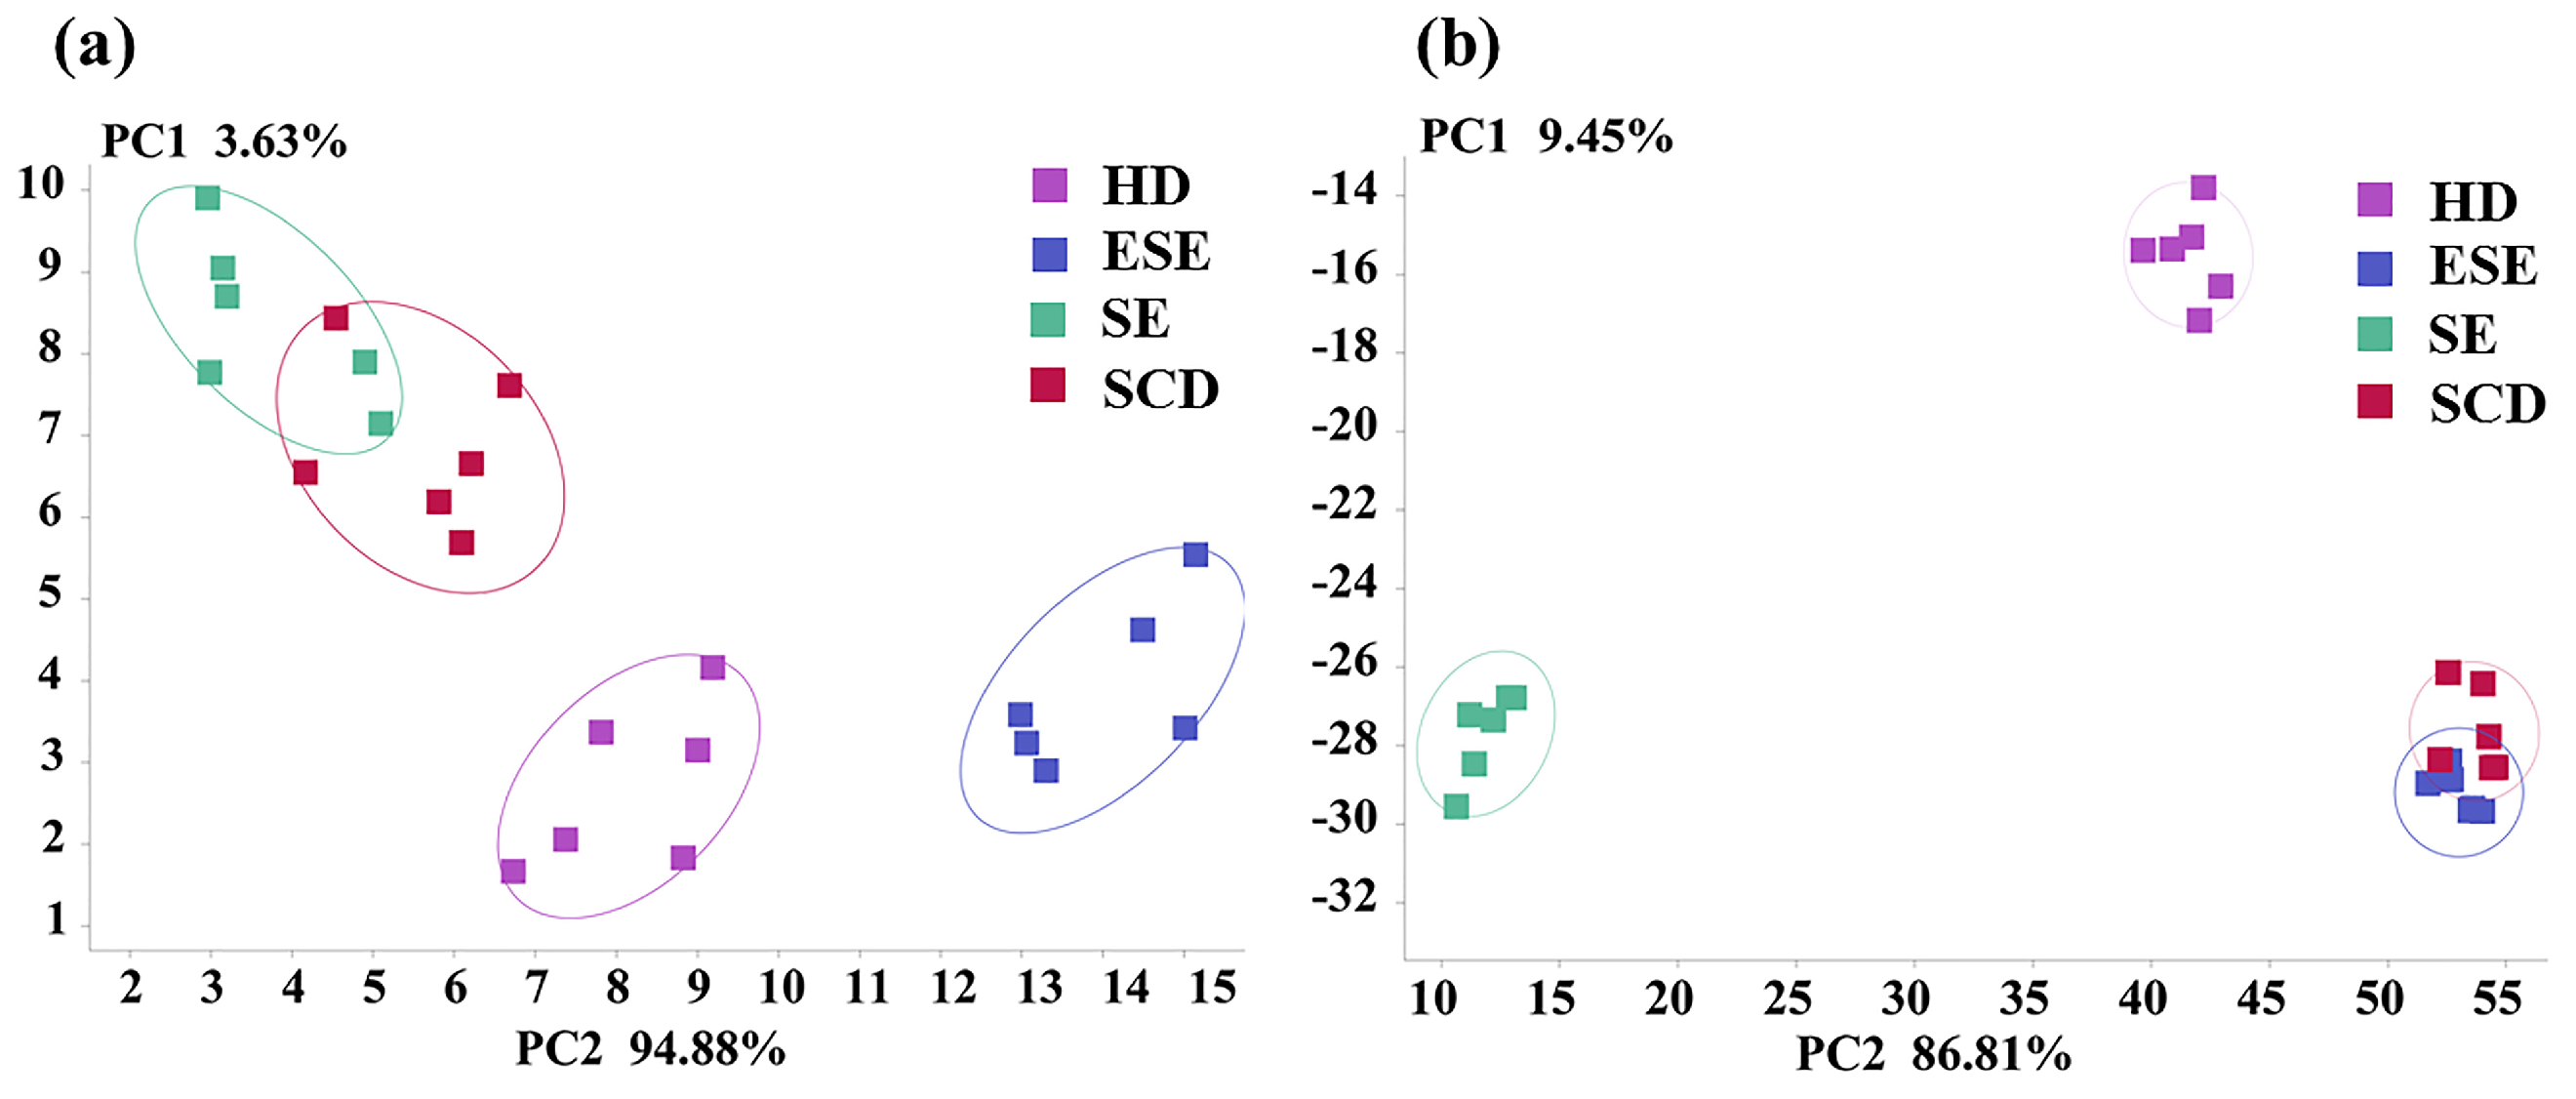
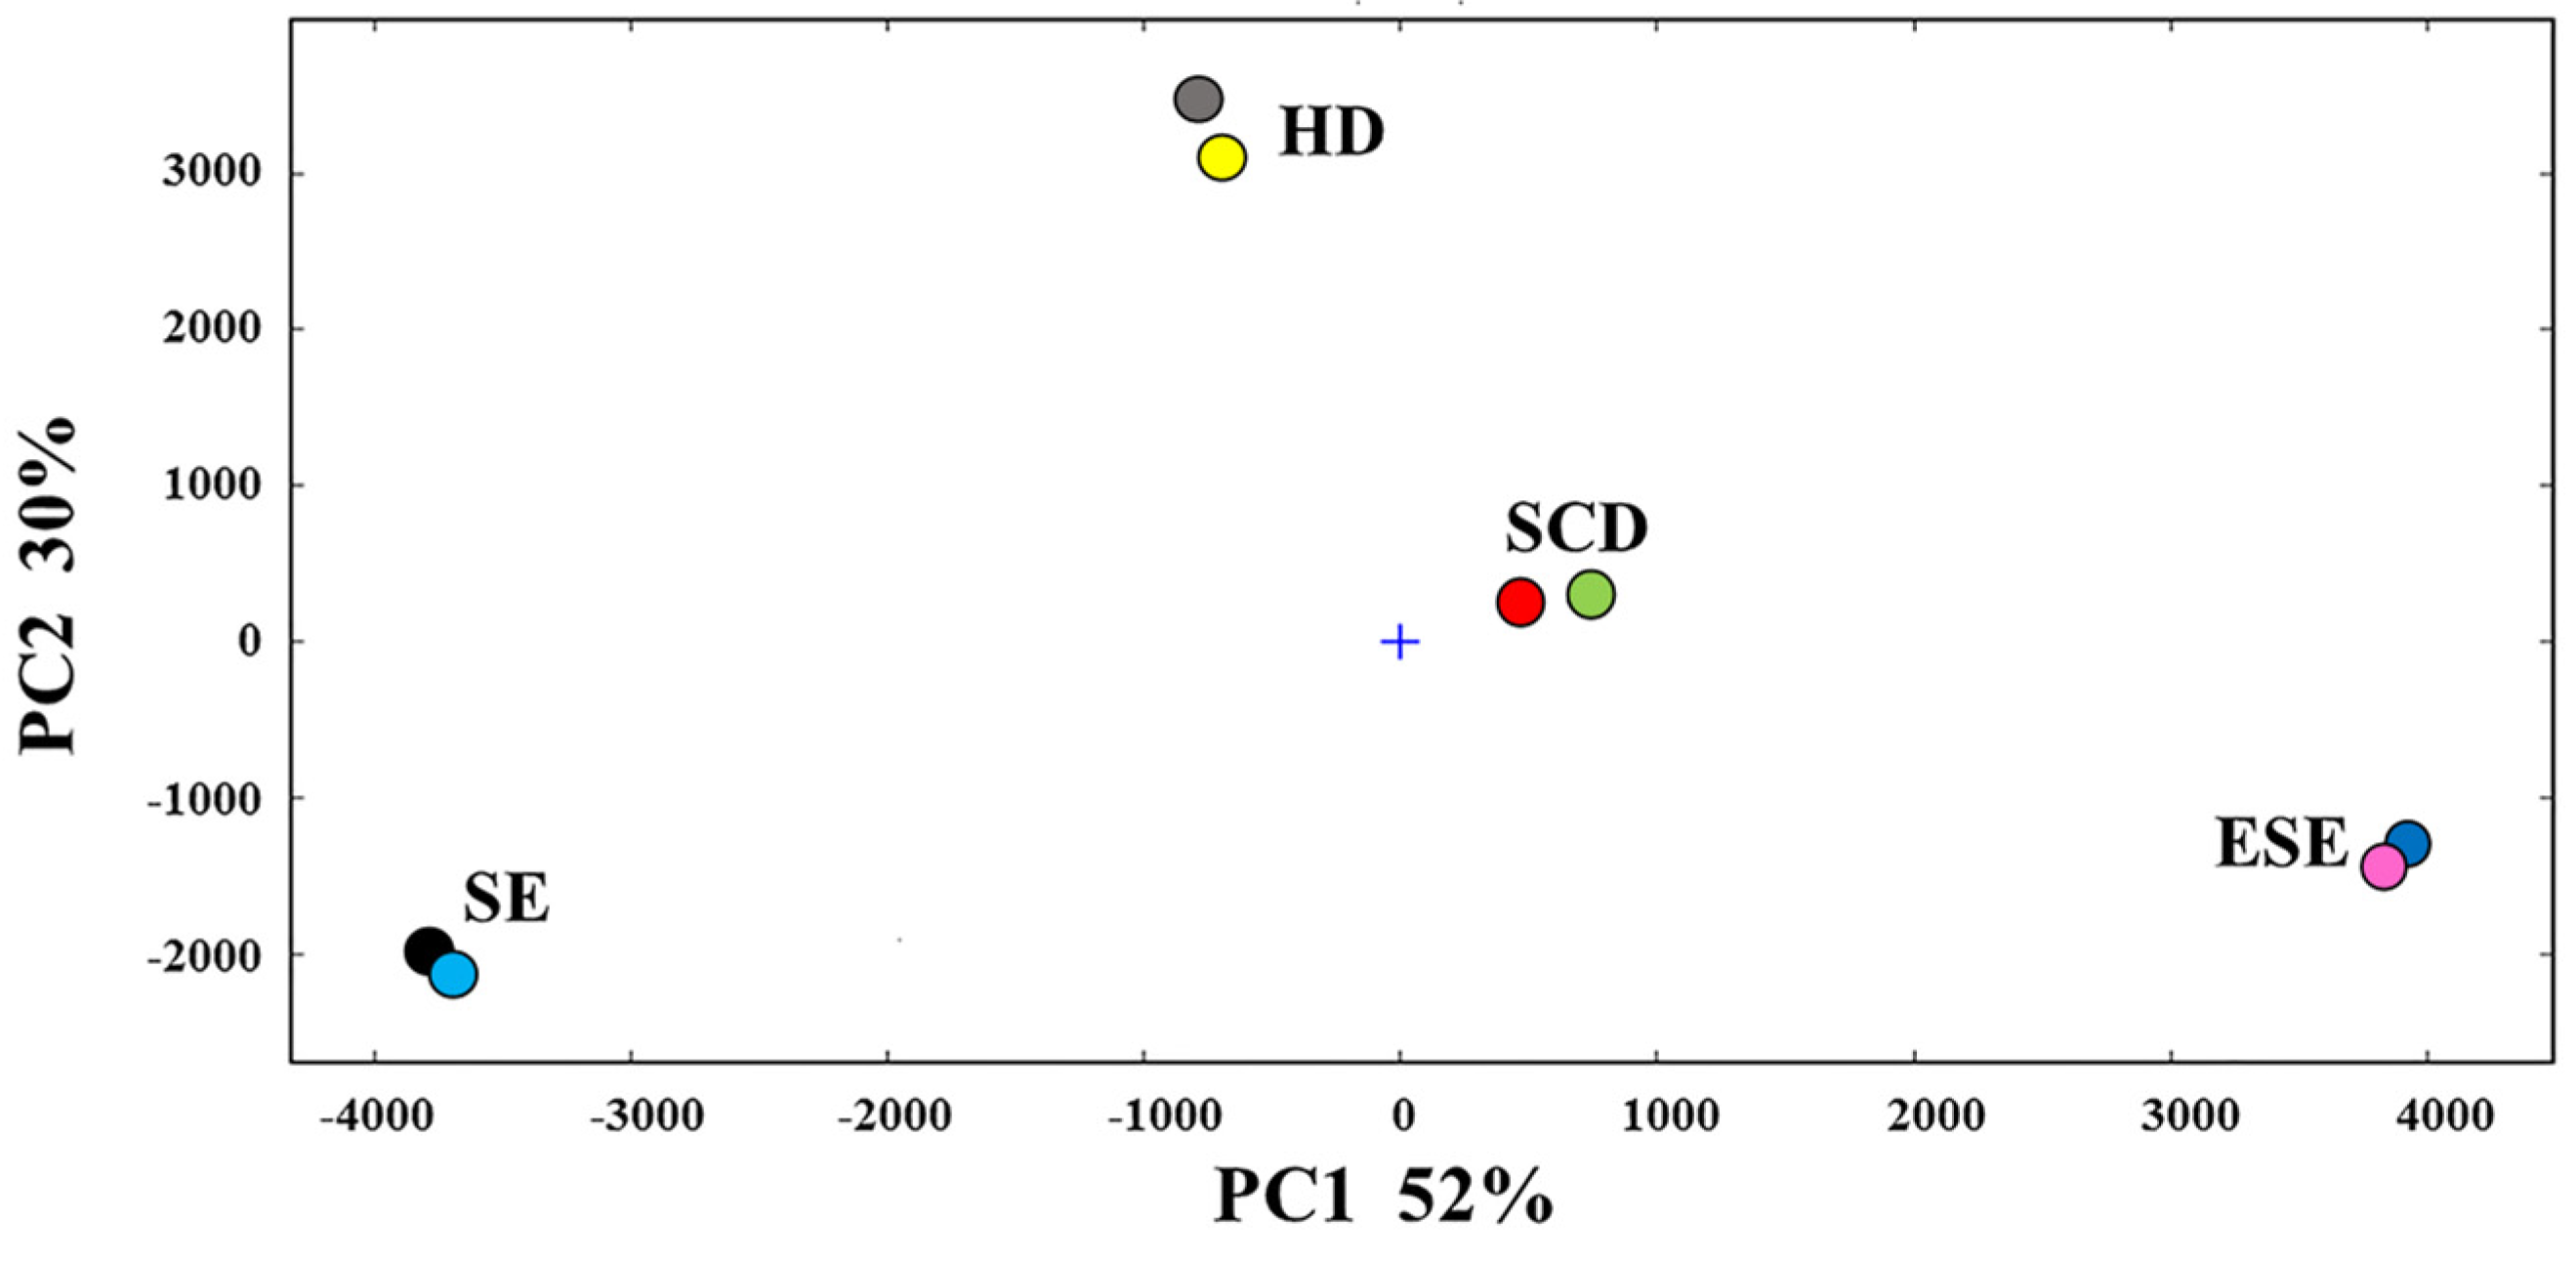
3.1. E-Nose Analysis Combined with PCA and LDA

PCA, as a pattern recognition method, can show the differences in the data [24]. The larger the total variance of PCA, the better the original data reflect [25]. The stable response values at 80, 85, and 90 s of the SAEOs extracted by different methods in the E-nose were collected for PCA. The PCA results for the response values at 80, 85, and 90 s showed that the total variance of the sample was 98.51, 98.45, and 98.44%, respectively. The data of 80 s, which best reflected the totality of the data, were selected as feature data, and are shown as a radar map and column chart in Figure 1.
As shown in Figure 1a, the response values of S6 and S8 of the SAEOs extracted by SCD and ESE were higher than those of SAEOs extracted by the other two methods, whereas the response value of S2 in SAEOs extracted by SE was the highest. This may be attributed to the high concentration of aromatic compounds, which could affect the response values of different sensors [26]. Then, the eigenvalues of SAEOs extracted using different extraction methods were analysed by PCA. In Figure 2a, the principal components PC1 and PC2 represented 94.88% and 3.63% of the total variance, respectively, indicating that they represent the whole sample. The SAEOs were divided into three types by E-nose PCA analysis with ESE, SCD, HD, and SE, which was consistent with the results shown in the E-nose radar diagram (Figure 1b). Interestingly, the SAEOs extracted by ESE and CSD could be distinguished, whereas those extracted by HD and SE had a partial overlap. According to the LDA analysis (Figure 2b), PC1 and PC2 represented 86.81% and 9.45% of the total variance, respectively, representing the entire sample [27]. The SAEOs extracted by the four methods showed good separability and were classified into three types based on the LDA diagram. The first type was HD, the second type was SE, and the third type was ESE and SCD. It could be seen that the E-nose combined with LDA clearly distinguished the SAEOs extracted by HD and SE, which constituted the SAEOs that PCA could not distinguish. Generally, the E-nose combined with PCA and LDA could effectively distinguish the SAEOs extracted by the four extraction methods.

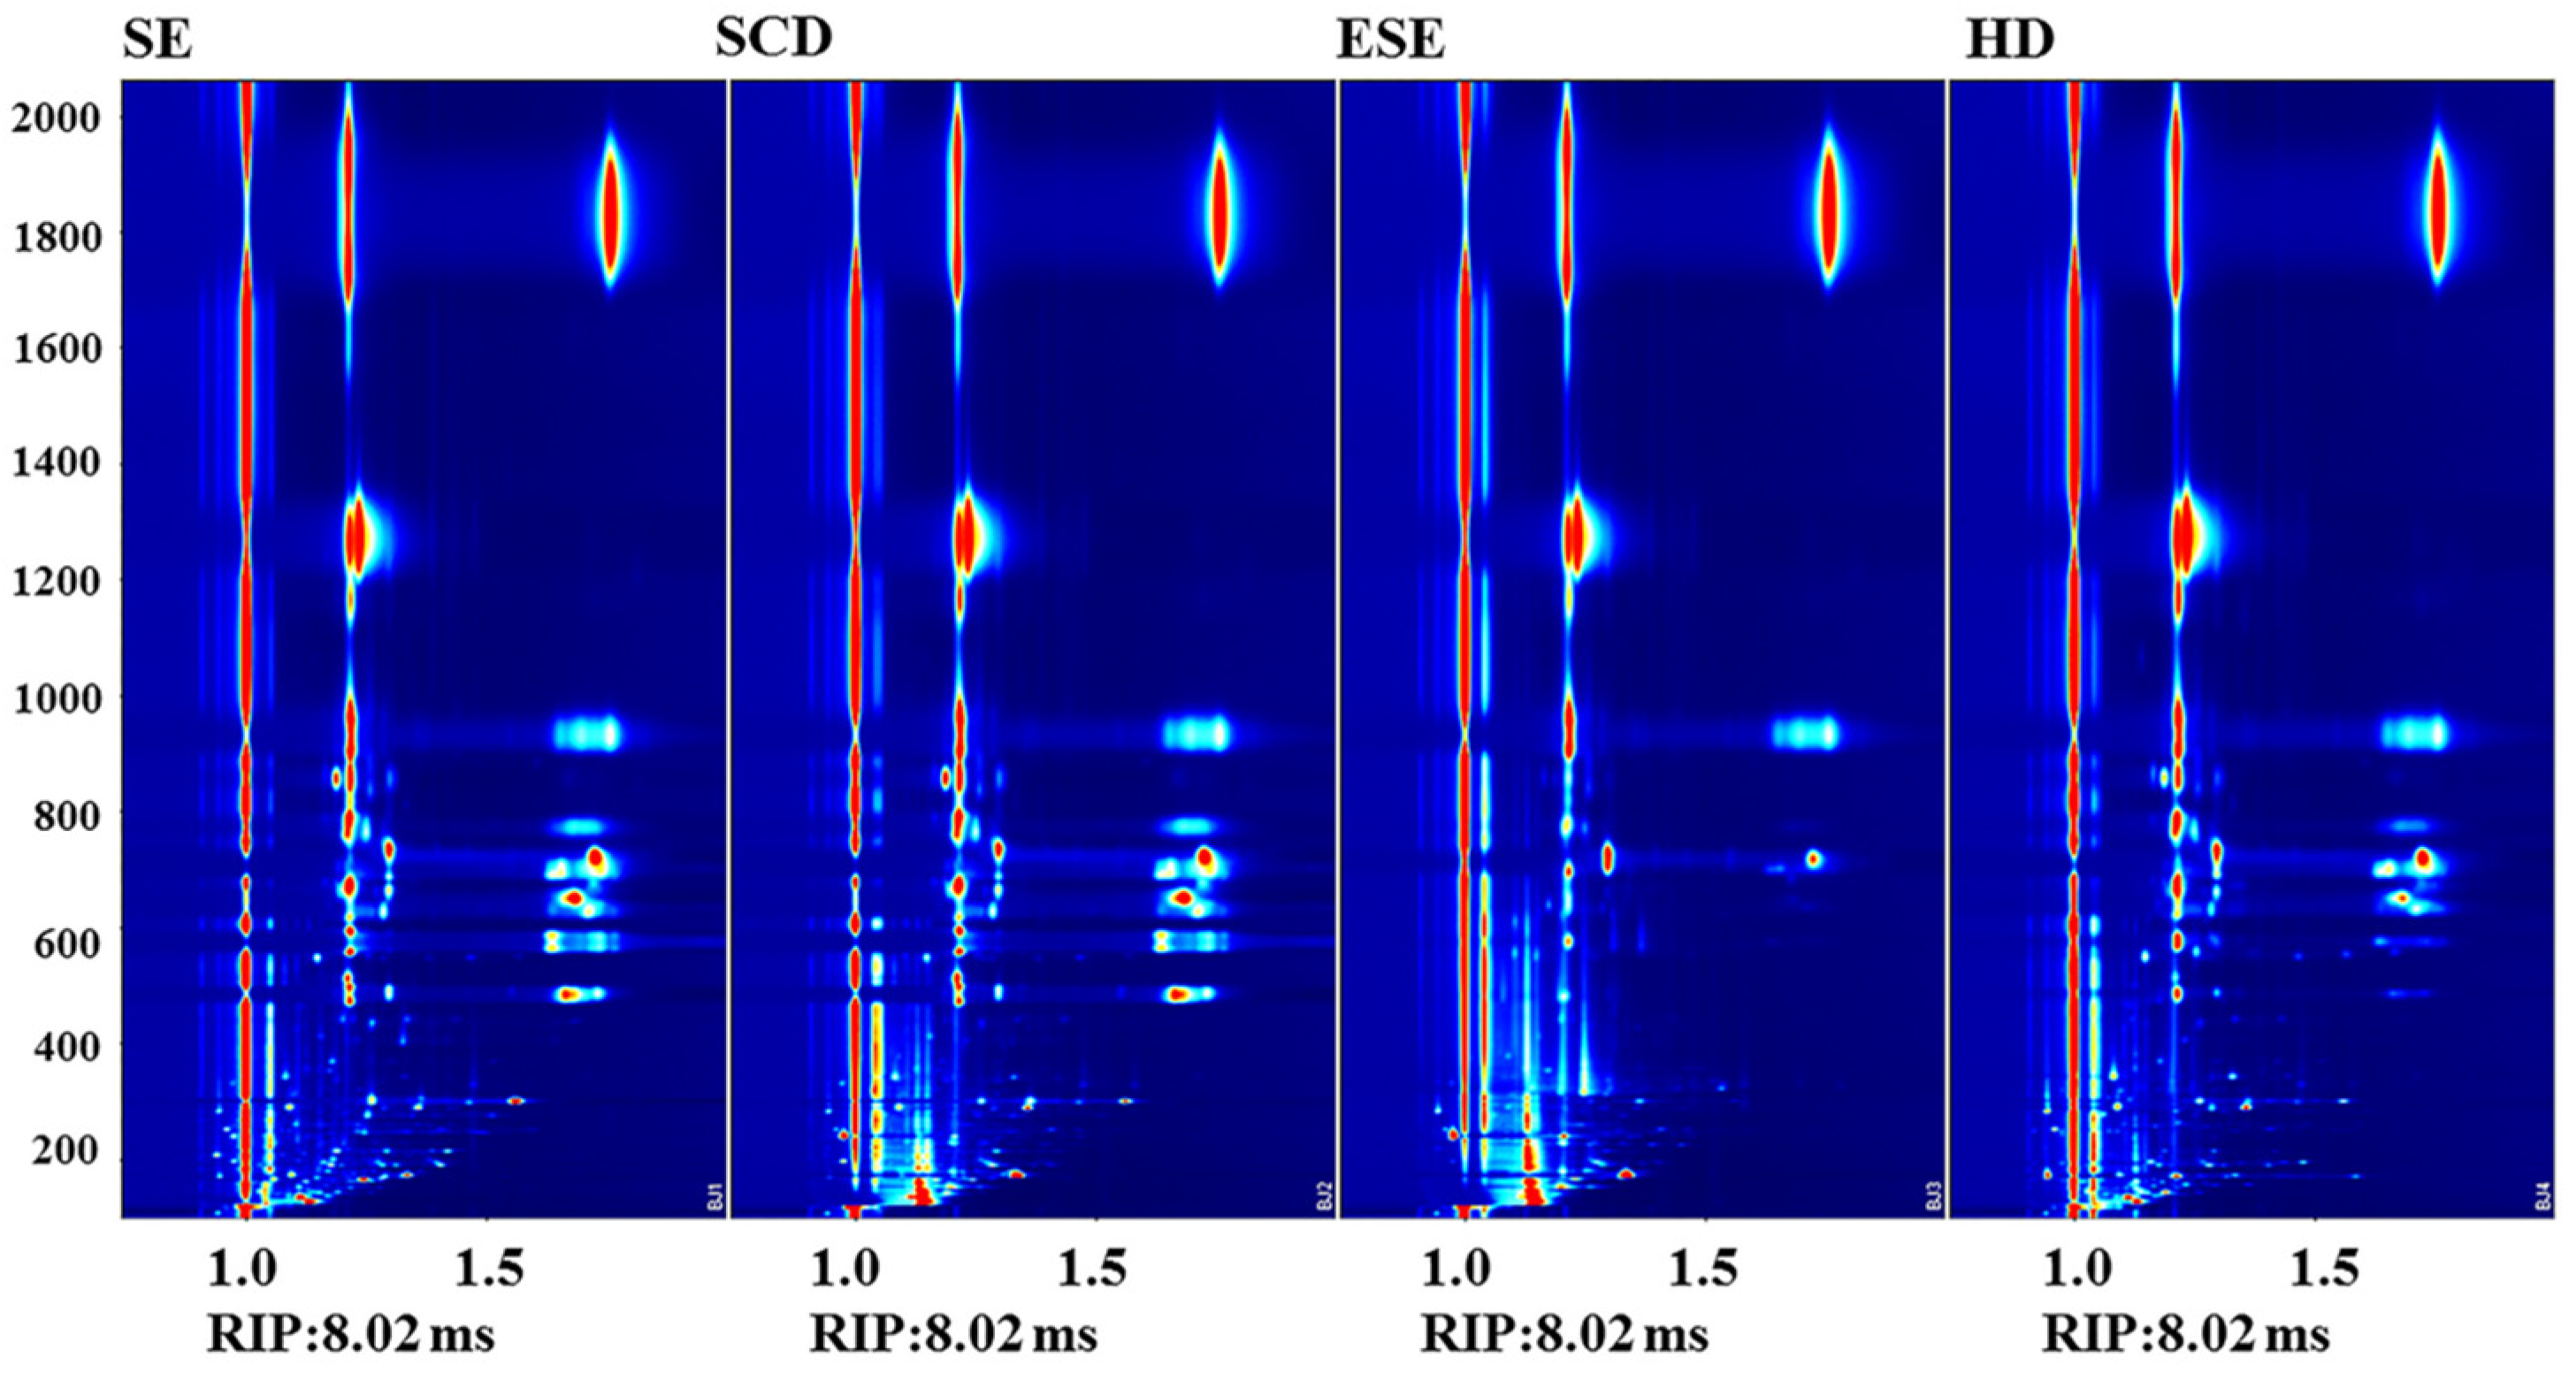
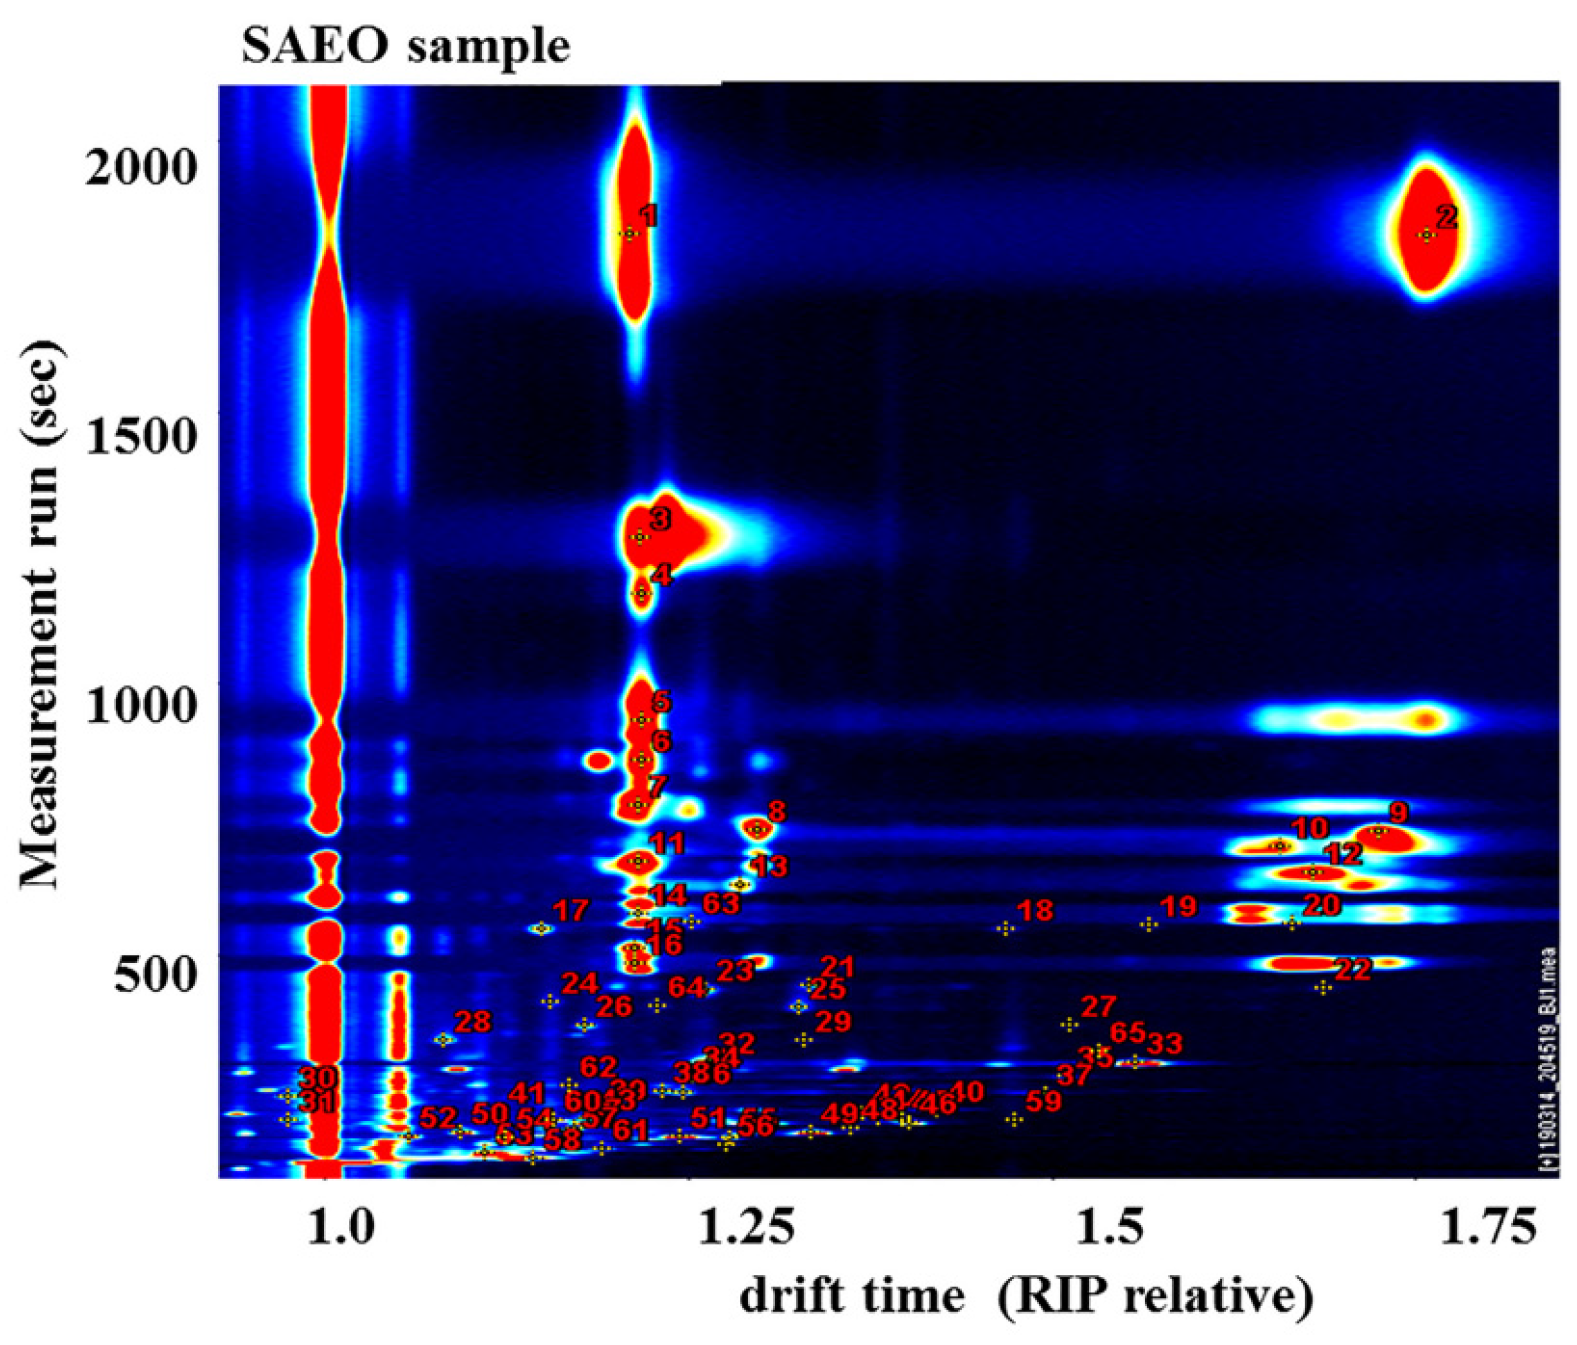
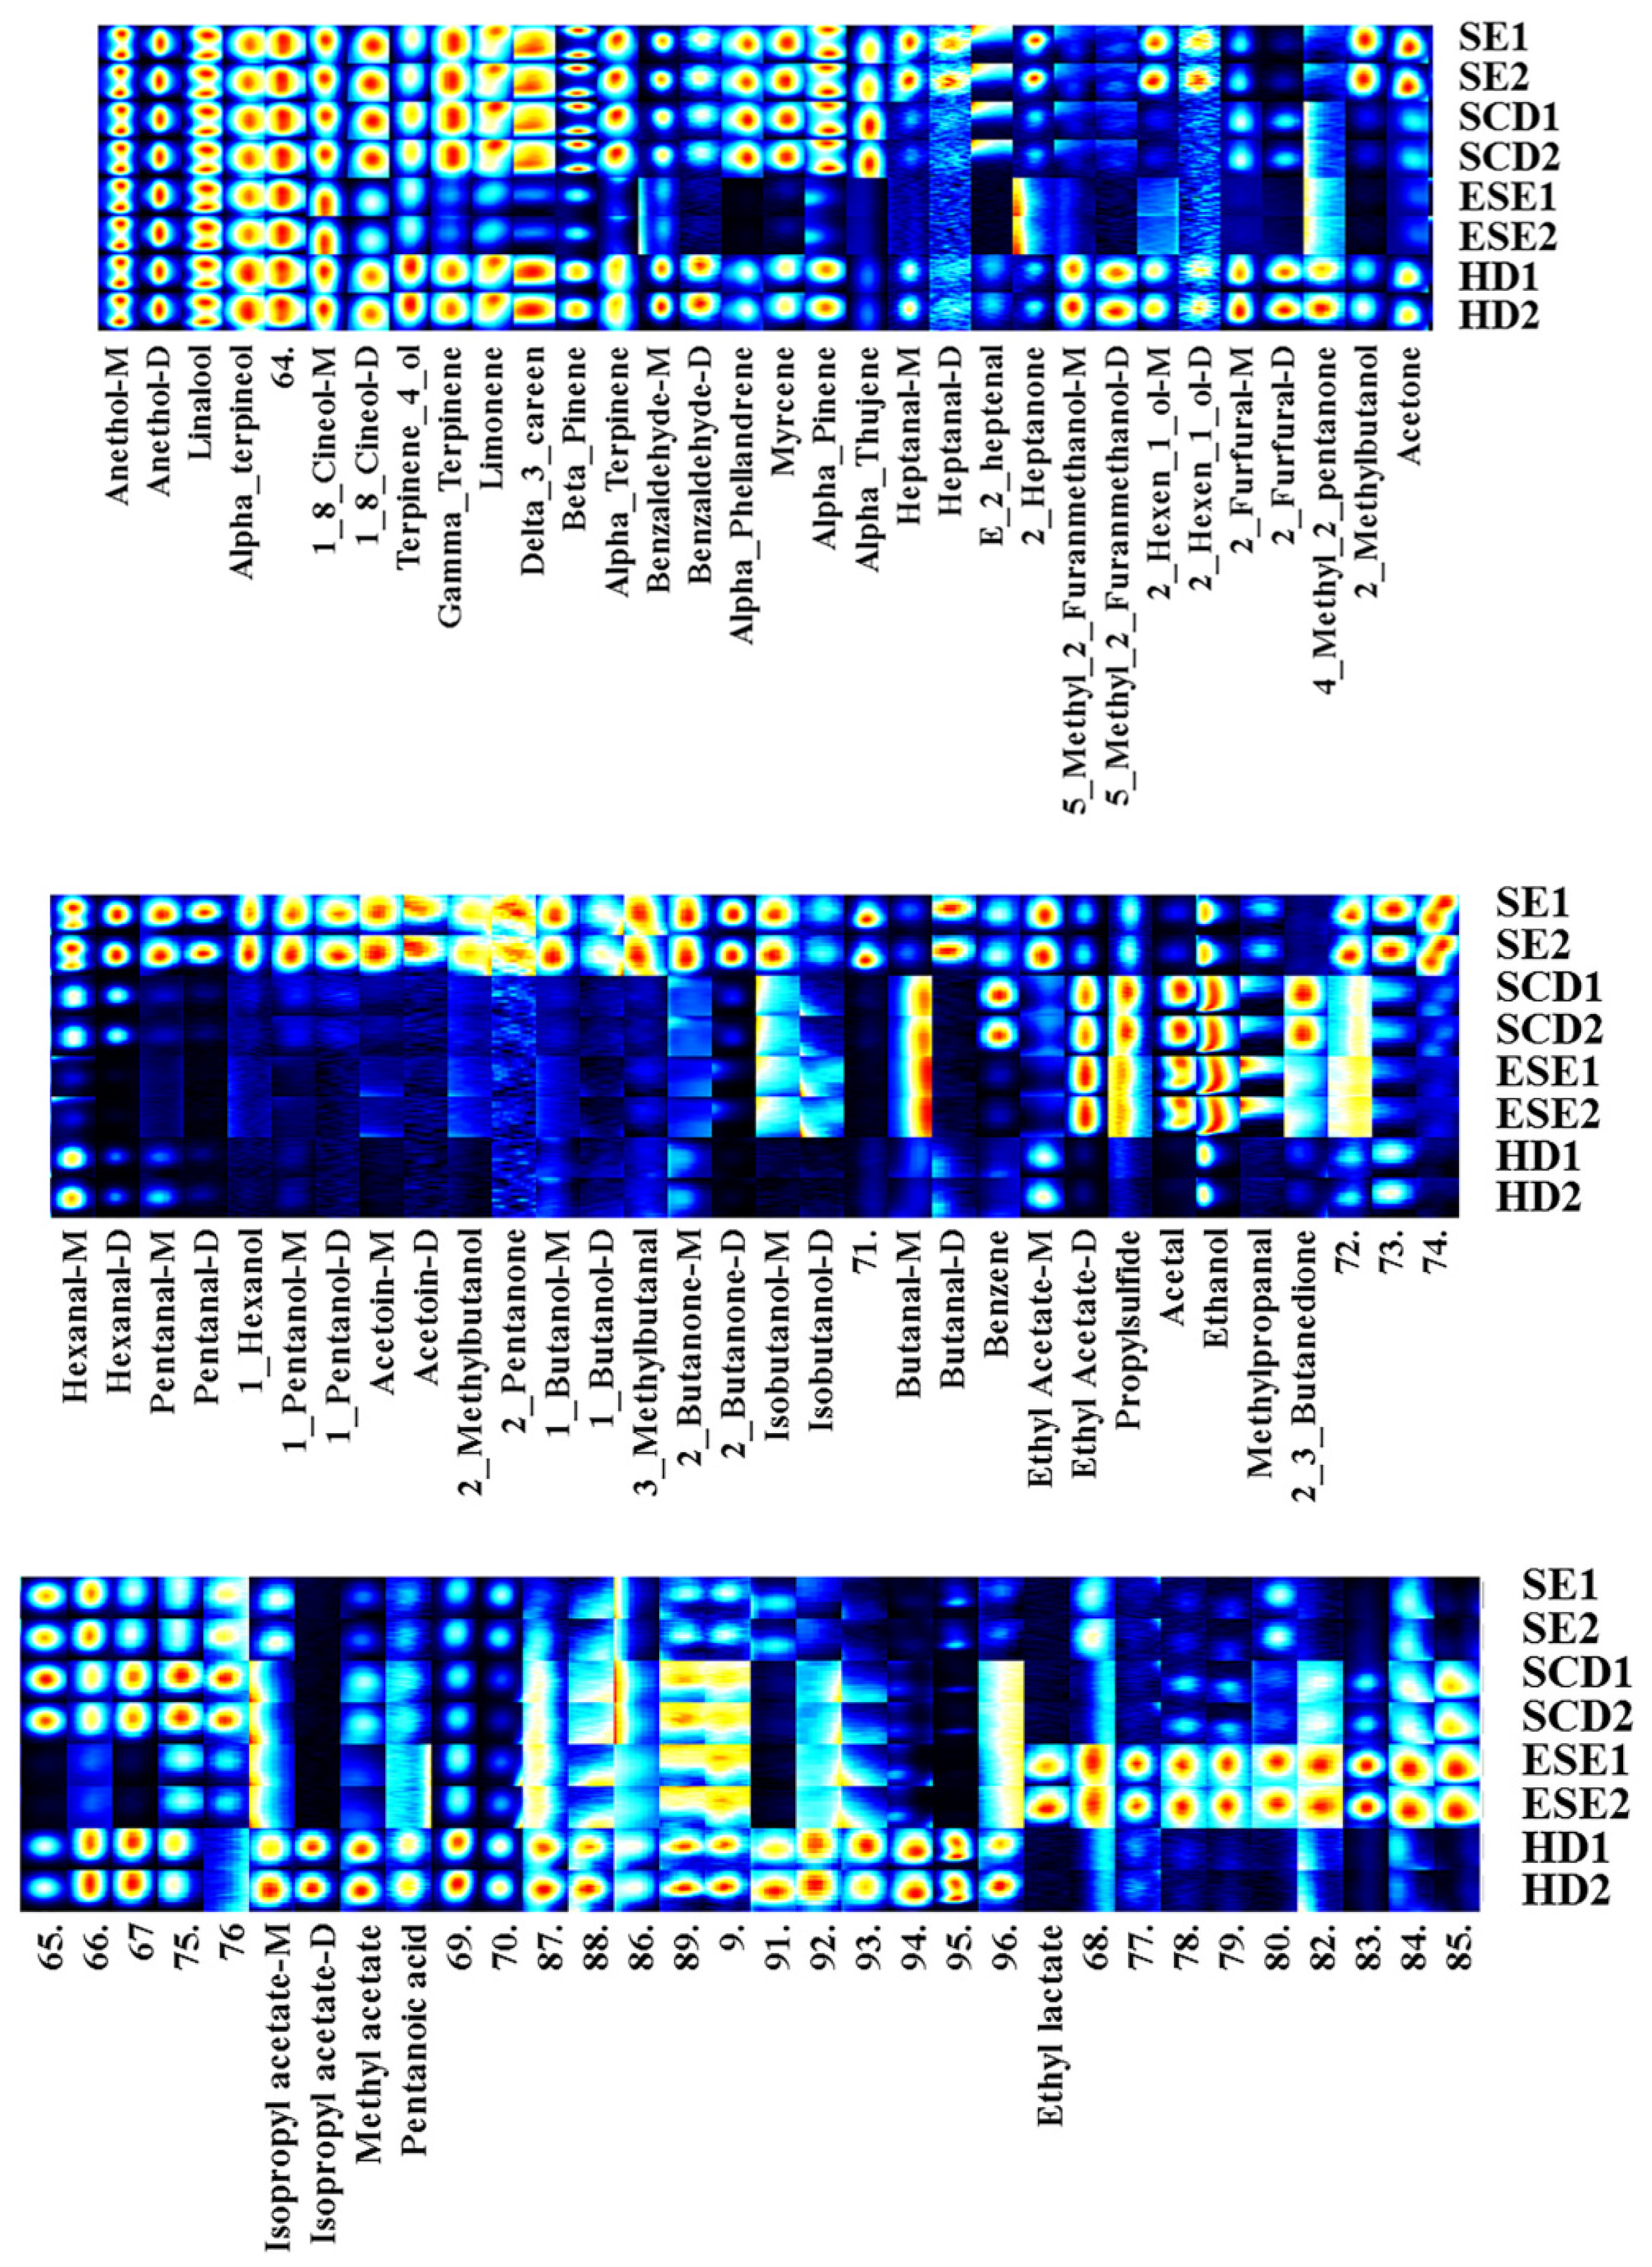
3.2. GC-IMS Combined with PCA

Figure 3 shows a top view of the SAEOs extracted using the four extraction methods in a three-dimensional (3D) topographic map of GC-IMS with a blue background. The red vertical line on the left represents the reactive ion peak, and each point on either side of the reactive ion peak represents a volatile organic compound. The colour indicates the concentration of the substances. White indicates a lower concentration and red indicates a higher concentration. It can be seen that the change in the organic compounds was significant with the retention time between 100 and 500 s. The difference in substance composition was not obvious, but mainly manifested as a clear difference in the content. The main compounds in SAEOs were as follows: 1 and 2, anethol; 3, alpha-terpineol; 4 and 6, terpinene; 5, linalool; 7, limonene; 8 and 9, 1-8-cineol (Figure 4). These results were consistent with those of the GC-MS analysis in this study (Table 2).
As shown in Figure 5, a characteristic map with 85 separate signals was obtained using GC-IMS to analyse the volatile compounds of SAEOs extracted using different methods. Each row in the picture represents a sample of essential oil, consisting of all the volatile organic signal peaks. Each column shows a signal peak for an organic compound at the same retention time. SAEOs extracted using the four different methods showed significantly different amounts of compounds. The difference between the SE and the other three SAEO methods was mainly reflected in the components with retention times ranging from 100 s to 300 s, including 2-methylbutanal, acetate, hexanal, pentanal, hexanol, 1-pentanol, acetoin, 2-methylbutanol, 2-pentanone, 1-butanol, 3-methylbutanal, 2-butanone, isobutanol, and butanal. The different components obtained through ESE compared to those obtained from the other three SAEO methods were mainly 1-8-cineol, limonene, gamma-terpinene, delta-3-carene, alpha-terpinene, alpha-pinene, alpha-phellandrene, beta-pinene and myrcene. The different components obtained through SCD compared to those obtained from the other three SAEO methods were mainly benzene and 2-3-butanedione. The different components obtained through HD compared to those obtained through the other three SAEO methods were mainly 5-methyl-2-furanmethanol, 2-furfural, isopropyl acetate, and 4-methyl-2-pentanone. These results suggested that GC-IMS can effectively characterise the differences in the volatile compounds of the SAEO extracted using different extraction methods.
It was found that SAEOs extracted by different methods showed the same composition but with different amounts, which was consistent with the results of GC-MS analysis (Table 2). However, the GC-MS and GC-IMS results were quite different for specific relative contents. The relative anethol content in GC-MS was greater than 80%, whereas that in GC-IMS was approximately 50%. This could be attributed to the relatively low GC-IMS threshold [28]. GC-IMS detected components that were not identified by GC-MS, causing an increase in the total amounts, and the relative amounts of the main compounds in GC-IMS were lower than those in GC-MS. The main component of SAEO is anethol, which was consistent with the essential oils extracted using the four different methods. However, the amounts of α-terpineol, terpinene-4-ol, linalool, gamma-terpinene, limonene, 1,8-cineoldelta-3-carene, α-terpinene, α-phellandrene, myrcene, β-pinene, α-thujene, and α-pinene were lower in ESE. The amounts of 2-methylbutanal, acetone, hexanal, pentanal, hexanol, 1-pentanol, acetoin, 2-methylbutanol, 2-pentanone, 1-butanol, 3-methylbutanal, 2-butanone, isobutanol, and butanal in SAEOs extracted by SE were higher than those in SAEOs extracted by other methods. The ethanol, acetal, and ethyl acetate amounts of SAEOs extracted by SCD and ESE were higher, whereas the isopropyl acetate and methyl acetate amounts of SAEOs extracted by HD were higher than those of SAEOs extracted by the other methods. These results are consistent with those shown in the corridor diagram of the signal peak area in Figure 5. In general, the characteristic fingerprints of the volatile compounds of SAEOs extracted by the four different methods could be established by GC-IMS, which provides theoretical guidance for SAEO investigation.
Furthermore, GC-IMS data were analysed using the PCA analysis method. PC1 and PC2, which represented 52% and 30% of the total variance, respectively, represented the entire sample. The SAEOs extracted using the four extraction methods were independently distributed and dispersed in the principal component space (Figure 6). These results suggested that SAEOs extracted by the different methods can be effectively distinguished through the combination of non-targeting feature markers and PCA.

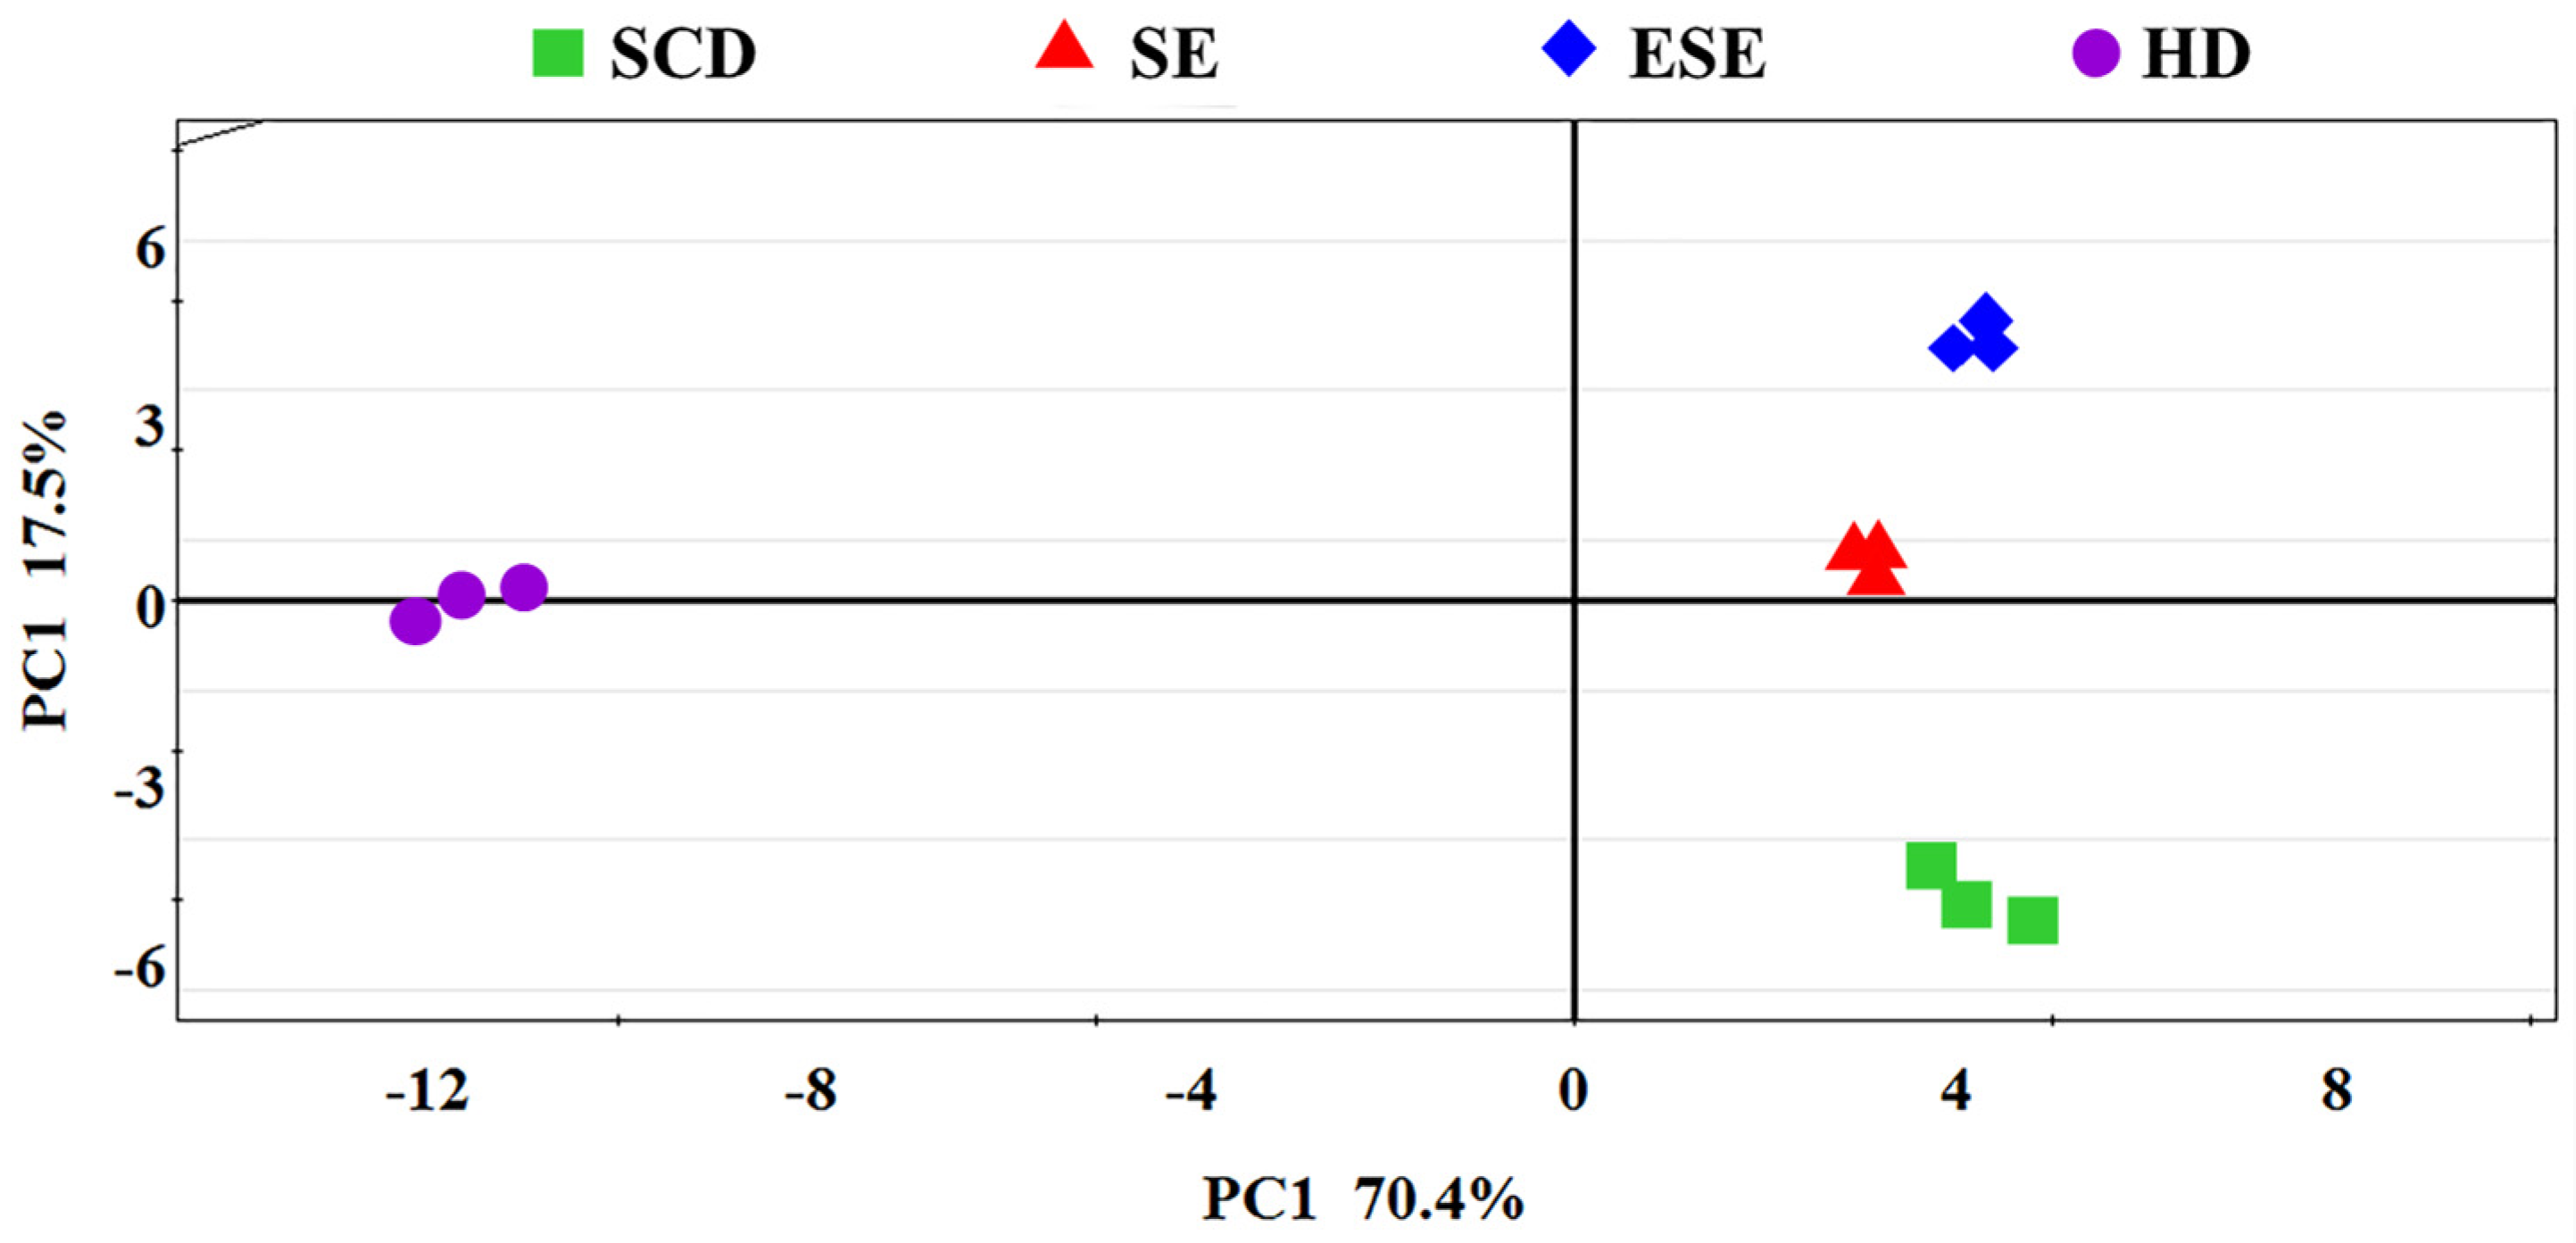
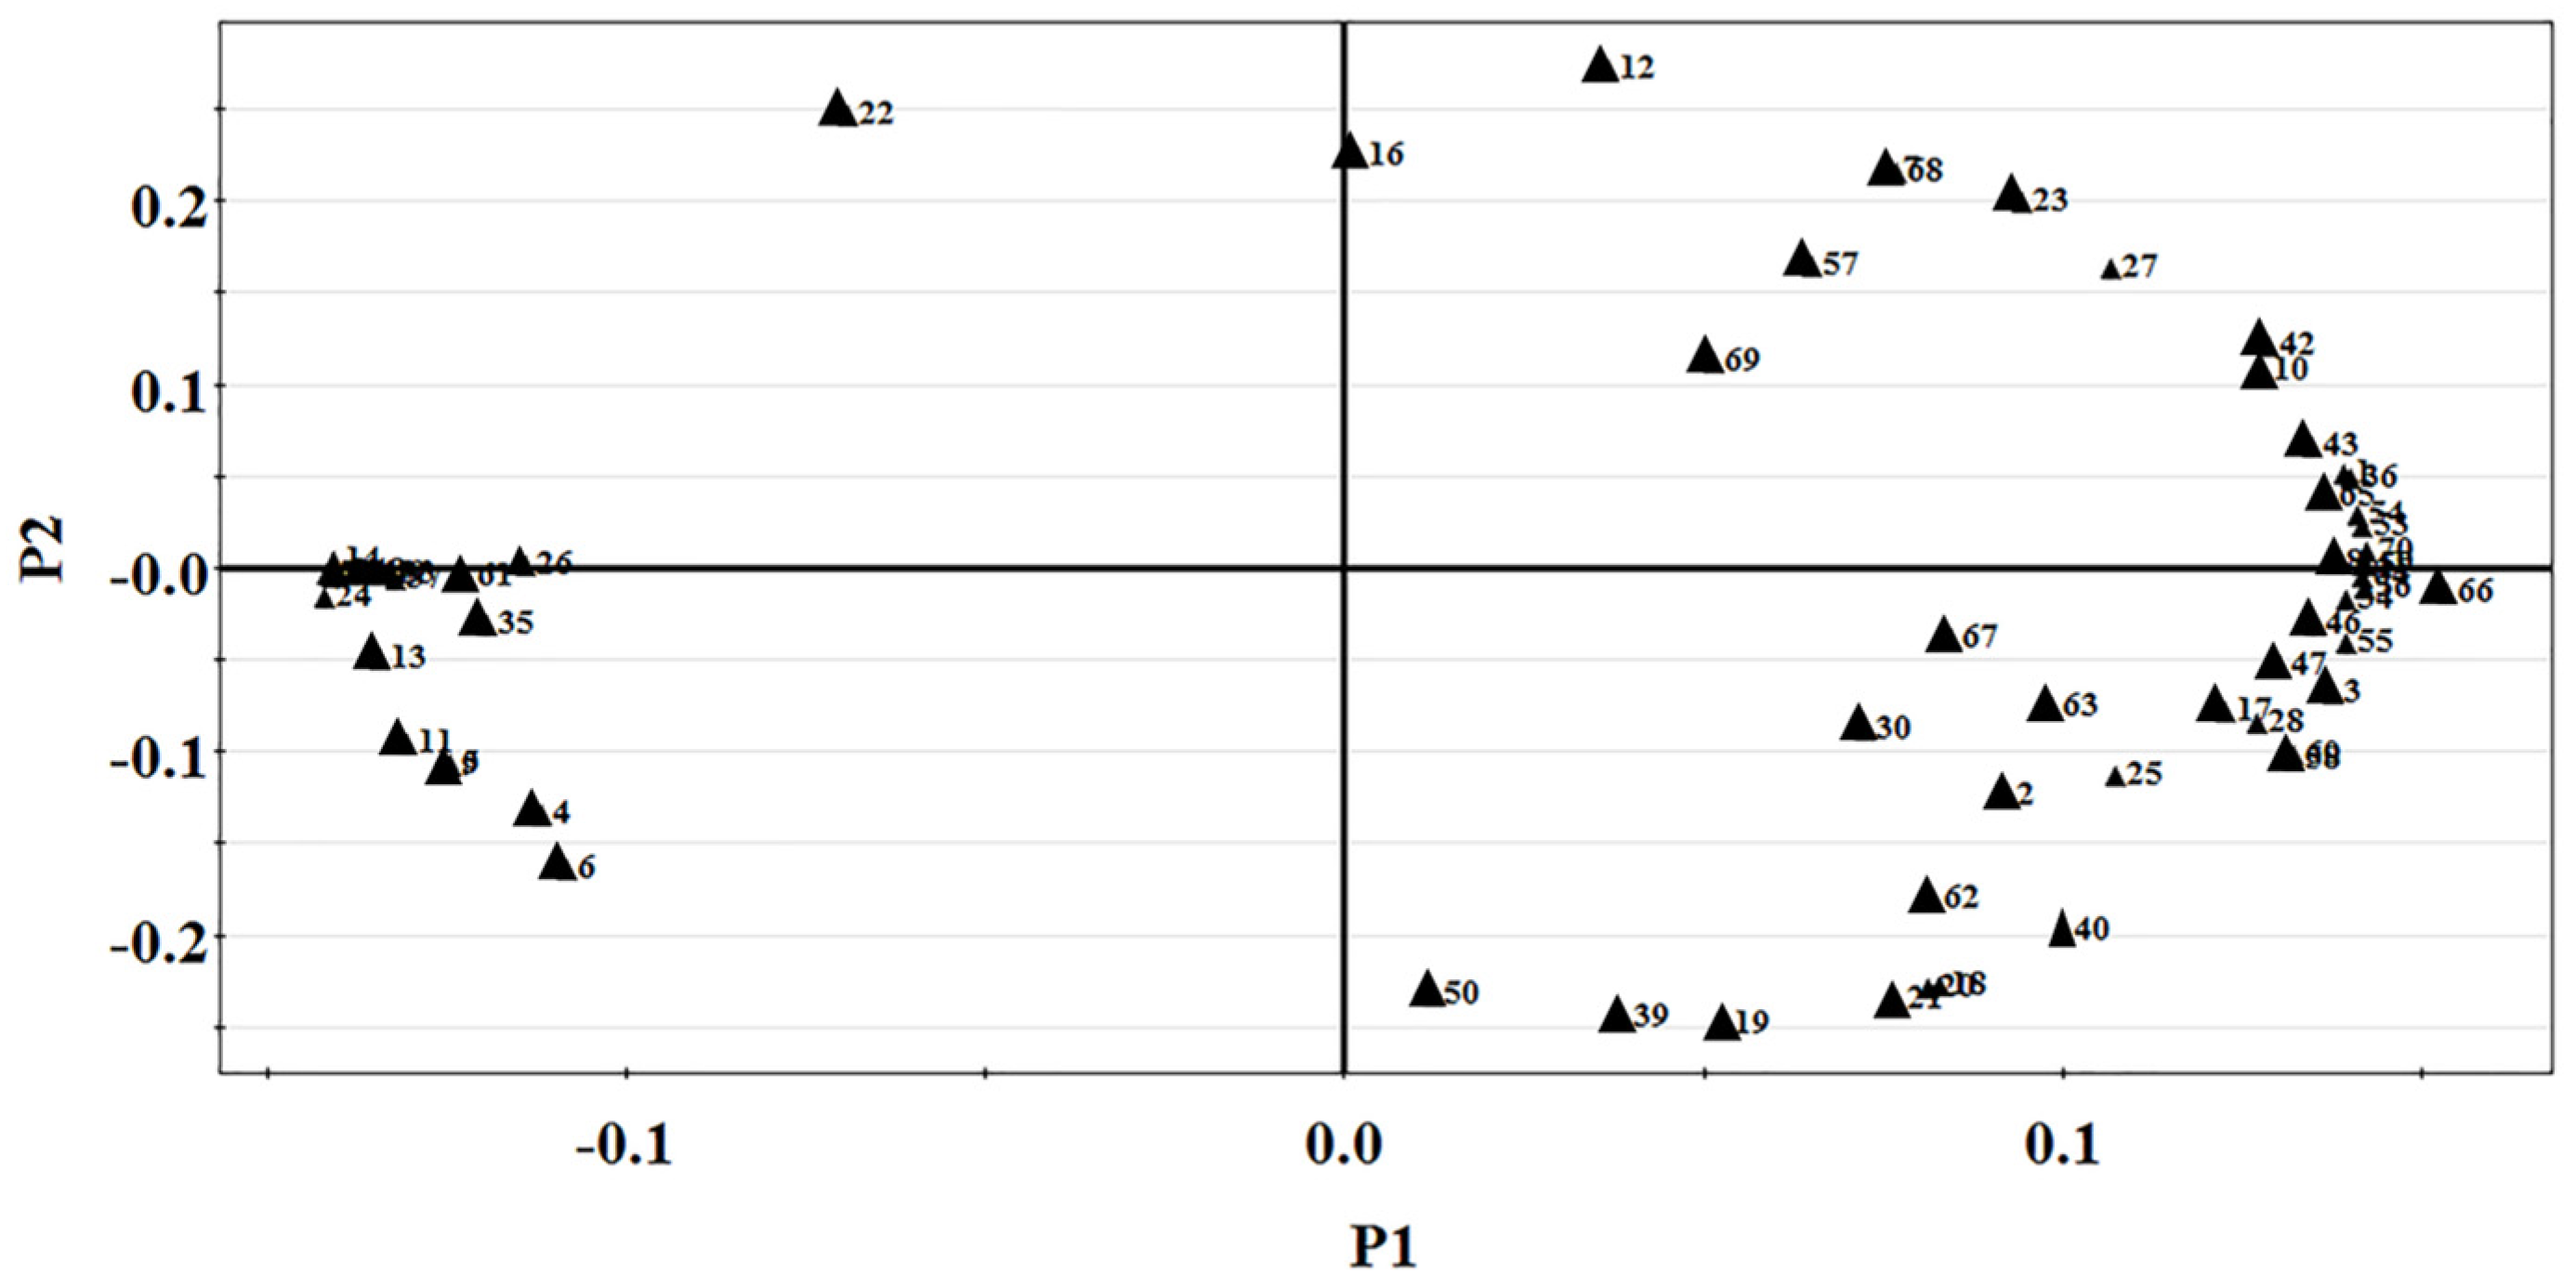
3.3. GC-MS Combined with PCA Analysis

Overall, 70 volatile compounds extracted using the four methods were identified and quantified using GC-MS (Table 2). It was observed that the contents of 52 compounds in SAEOs extracted by HD, ESE, and SE constituted 99.58 ± 0.08%, 99.47 ± 0.30%, and 99.43 ± 0.05% of the SAEOs, respectively. In addition, the content of 53 compounds of SAEOs extracted by SCD was 99.51 ± 0.03%. The main components were trans-anethole, limonene, foeniculin 1-(3-methyl-2-butenoxy)-4-(1-propenyl) benzene, and anionic aldehyde, etc., which is consistent with the findings of Aly et al. [29]. The composition of SAEOs extracted by HD was quite different from that of those extracted by other methods. All components are shown as trace compounds. There were no significant differences among the components of SAEOs extracted using SCD, SE, or ESE, and the components of SAEOs extracted by SCD were similar to those of SAEOs extracted by SE. The main compound in SAEOs extracted by the four methods was anethole, the content of which was greater than 80%. The limonene contents in SAEOs extracted by SCD and SE were similar and were higher than that of in SAEOs extracted by ESE and lower than that of in SAEOs extracted by HD, which is consistent with Sberveglieri et al. [30]. The amounts of linalool and estragole in SAEOs extracted by HD were significantly higher than those of linalool and estragole in SAEOs extracted by the other methods, while the amount of foeniculin in SAEOs extracted by HD was lower than that in SAEOs extracted by the other methods. The results indicated that the content and composition of SAEOs extracted by HD were quite different from those of SAEOs extracted by the other three methods. The content and composition of SAEOs extracted by ESE were also different from those of SAEOs extracted by SCD and SE, whereas those of SAEOs extracted by SCD and SE were similar. The relative content of each compound was used as the characteristic value for PCA after standardisation. As shown in Figure 7, the total variance contribution of the two principal components was 87.97%, which meant that it represented the entire dataset. There was a high degree of polymerisation for SAEOs extracted by the same method and a highly dispersed distribution for SAEOs extracted by different methods, revealing that SAEOs extracted by different methods could be well distinguished.
In addition, the distribution of 70 compounds was dispersed (Figure 8), indicating that the SAEOs extracted by the four methods were similar in terms of chemical composition but had different amounts of each compound. Meanwhile, the scattered points on the diagram illustrate that the specific components used as the basis for discrimination could be determined from the volatile compounds of the SAEOs, which included peak 22 (tR = 34.90 min) derived from 4-carvomenthenol and peak 23 (tR = 36.21 min) derived from α-terpineol. PCA can compensate for the defects of GC-MS by quickly and conveniently determining the characteristic substances of SAEOs extracted using different methods. Therefore, GC-MS analysis combined with PCA analysis could be used to distinguish SAEOs extracted using different extraction methods, which is in line with the findings of Dina et al. [31].

4. Conclusions

In this study, SAEOs were investigated via E-Nose, GC-MS, and GC-IMS combined with PCA and LDA, and the differences in the SAEO components were also determined. Generally, combining E-nose with PCA could effectively distinguish SAEOs extracted by ESE and CSD, while combining E-nose with LDA could accurately distinguish SAEOs extracted by HD and SE. The results of GC-IMS and GC-MS indicated that the SAEOs extracted using different methods could be effectively distinguished by combining non-targeting feature markers with PCA analysis. Moreover, GC-MS and GC-IMS have satisfactory discrimination, whereas E-nose and GC-IMS have the advantages of easy operation, faster analysis speed, and low cost. Thus, it can be concluded that E-nose and GC-IMS are more suitable for the discrimination of SAEOs, whereas GC-MS is more suitable for the qualitative and quantitative analysis of essential oils. In this regard, the results could provide theoretical guiding significance for further studies, which may include exploring additional extraction methods, conducting quantitative analyses of key compounds, or investigating the biological activities of the SAEOs extracted by different methods.

Author Contributions

Conceptualization, methodology, resources, data curation, writing—review and editing, and funding acquisition, X.C.; methodology, software, validation, investigation, data curation, and writing—original draft preparation, X.H.; resource and writing—review and editing, T.Z.; project administration and writing—review and editing, K.W.; software and writing—review and editing, X.D.; visualization and supervision, H.Y.; supervision and project administration, X.L. All authors have read and agreed to the published version of the manuscript.

Funding

This research was funded by the Forestry Scientific and Technology Innovative Project of Guangdong Province (2020KJCX010), the Science & Technology Planning Project of Guangzhou City (202103000078, 202206010181), the Guangdong Provincial Key Laboratory of Plant Resources Biorefinery (2021GDKLPRB01), the Science and technology plan project of Guangdong Province (220705101471437), and the Science & Technology Planning Project of Guangdong Province (19ZK0364).

Institutional Review Board Statement

This study does not involve any human or animal testing.

Informed Consent Statement

Not applicable.

Data Availability Statement

Data is contained within the article.

Conflicts of Interest

The authors declare no conflict of interest.

References

  1. Padmashree, A.; Roopa, N.; Semwal, A.D.; Sharma, G.K.; Agathian, G.; Bawa, A.S. Star-anise (Illicium verum) and black caraway (Carum nigrum) as natural antioxidants. Food Chem. 2017, 104, 59–66. [Google Scholar] [CrossRef]
  2. Wu, K.; Zhang, T.; Chai, X. Preparation and antibacterial and antioxidant ability of β-cyclodextrin complexes of vaporized Illicium verum essential oil. Food Sci. Nutr. 2022, 10, 4003–4018. [Google Scholar] [CrossRef]
  3. Yadav, A.S.; Bhatnagar, D. Chemo-preventive effect of Star anise in N-nitrosodiethylamine initiated and phenobarbital promoted hepato-carcinogenesis. Chem.-Biol. Interact. 2007, 169, 207–214. [Google Scholar] [CrossRef]
  4. Kang, P.; Kim, K.Y.; Lee, H.S.; Min, S.S.; Seol, G.H. Anti-inflammatory effects of anethole in lipopolysaccharide-induced acute lung injury in mice. Life Sci. 2013, 93, 955–961. [Google Scholar] [CrossRef]
  5. Ibrahim, M.; Matter, Z.; Abdel-Khalek, H. Evaluation of antibacterial efficacy of anise wastes against some multidrug resistant bacterial isolates. J. Radiat. Res. Appl. Sci. 2019, 10, 34–43. [Google Scholar] [CrossRef]
  6. Giacometti, J.; Bursać Kovačević, D.; Putnik, P.; Gabrić, D.; Bilušić, T.; Krešić, G. Extraction of bioactive compounds and essential oils from mediterranean herbs by conventional and green innovative techniques: A review. Food Res. Int. 2018, 113, 245–262. [Google Scholar] [CrossRef] [PubMed]
  7. Sabry, B.; Farouk, A.; Badr, A. Bioactivity evaluation for volatiles and water extract of commercialized star anise. Heliyon 2021, 7, e07721. [Google Scholar] [CrossRef] [PubMed]
  8. Fornari, T.; Vicente, G.; Vazquez, E.; Garcia-Risco, M.R.; Reglero, G. Isolation of essential oil from different plants and herbs by supercritical fluid extraction. J. Chromatogr. A 2012, 1250, 34–48. [Google Scholar] [CrossRef]
  9. Zhang, J.; Zhang, M.; Ju, R.; Chen, K.; Bhandari, B.; Wang, H. Advances in efficient extraction of essential oils from spices and its application in food industry: A critical review. Crit. Rev. Food Sci. Nutr. 2022, 1–22. [Google Scholar] [CrossRef]
  10. Yamini, Y.; Khajeh, M.; Ghasemi, E.; Mirza, M.; Javidnia, K. Comparison of essential oil compositions of Salvia mirzayanii obtained by supercritical carbon dioxide extraction and hydrodistillation methods. Food Chem. 2008, 108, 341–346. [Google Scholar] [CrossRef]
  11. Homami, S.S.; Jaimand, K.; Rezaee, M.B.; Afzalzadeh, R. Comparative Studies of Different Extraction Methods of Essential Oil from Matricaria recutita L. J. Chil. Chem. Soc. 2016, 61, 2982–2984. [Google Scholar] [CrossRef]
  12. Liu, X.J.; Xu, D.P.; Yang, Z.J.; Zhang, N.N. Chemical Composition of Essential Oils from the Heartwood of Pterocarpus macrocarpus by Different Extraction Methods in Southern China. J. Essent. Oil Bear. Plants 2017, 20, 110–115. [Google Scholar] [CrossRef]
  13. Singh, G.; Maurya, S.; Delampasona, M.; Catalan, C. Chemical constituents, antimicrobial investigations and antioxidative potential of volatile oil and acetone extract of star anise fruits. J. Sci. Food Agric. 2006, 86, 111–121. [Google Scholar] [CrossRef]
  14. Sultanbawa, Y. Anise Myrtle (Syzygium anisatum) Oils. In Essential Oils in Food Preservation, Flavor and Safety; Academic Press: Cambridge, MA, USA, 2016; pp. 215–219. [Google Scholar]
  15. Vagi, E.; Simandi, B.; Suhajda, A.; Hethelyi, E. Essential oil composition and antimicrobial activity of Origanum majorana L. extracts obtained with ethyl alcohol and supercritical carbon dioxide. Food Res. Int. 2005, 38, 51–57. [Google Scholar] [CrossRef]
  16. Glisic, S.B.; Misic, D.R.; Stamenic, M.D.; Zizovic, I.T.; Asanin, R.M.; Skala, D.U. Supercritical carbon dioxide extraction of carrot fruit essential oil: Chemical composition and antimicrobial activity. Food Chem. 2007, 105, 346–352. [Google Scholar] [CrossRef]
  17. Majchrzak, T.; Wojnowski, W.; Dymerski, T.; Gębicki, J.; Namieśnik, J. Electronic noses in classification and quality control of edible oils: A review. Food Chem. 2018, 246, 192–201. [Google Scholar] [CrossRef]
  18. Capitain, C.; Weller, P. Non-Targeted Screening Approaches for Profiling of Volatile Organic Compounds Based on Gas Chromatography-Ion Mobility Spectroscopy (GC-IMS) and Machine Learning. Molecules 2021, 26, 5457. [Google Scholar] [CrossRef] [PubMed]
  19. Gliszczyńska-Świgło, A.; Chmielewski, J. Electronic Nose as a Tool for Monitoring the Authenticity of Food. A Review. Food Anal. Methods 2017, 10, 1800–1816. [Google Scholar] [CrossRef]
  20. Peris, M.; Escuder-Gilabert, L. Electronic noses and tongues to assess food authenticity and adulteration. Trends Food Sci. Technol. 2016, 58, 40–54. [Google Scholar] [CrossRef]
  21. Tian, L.; Zeng, Y.; Zheng, X.; Chiu, Y.; Liu, T. Detection of Peanut Oil Adulteration Mixed with Rapeseed Oil Using Gas Chromatography and Gas Chromatography–Ion Mobility Spectrometry. Food Anal. Methods 2019, 12, 2282–2292. [Google Scholar] [CrossRef]
  22. Kalinichenko, A.; Arseniyeva, L. Electronic nose combined with chemometric approaches to assess authenticity and adulteration of sausages by soy protein. Sens. Actuators B Chem. 2020, 303, 127250. [Google Scholar] [CrossRef]
  23. Vautz, W.; Franzke, J.; Zampolli, S.; Elmi, I.; Liedtke, S. On the potential of ion mobility spectrometry coupled to GC pre-separation– A tutorial. Anal. Chim. Acta 2018, 1024, 52–64. [Google Scholar] [CrossRef] [PubMed]
  24. Jimenez-Carvelo, A.; Gonzalez-Cadado, A.; Bagur-Gonzalez, M. Alternative data mining/machine learning methods for the analytical evaluation of food quality and authenticity—A review. Food Res. Int. 2019, 122, 25–39. [Google Scholar] [CrossRef] [PubMed]
  25. Wold, S.; Esbensen, K.; Geladi, P. Principal Component Analysis. Chemom. Intell. Lab. Syst. 1987, 2, 37–52. [Google Scholar] [CrossRef]
  26. Zhu, D.; Ren, X.; Wei, L.; Cao, X.; Ge, Y.; Liu, H.; Li, J. Collaborative analysis on difference of apple fruits flavour using electronic nose and electronic tongue. Sci. Hortic. 2020, 260, 108879. [Google Scholar] [CrossRef]
  27. Manohar, P.; Estefania, N.; Marco, A. Olive Oil by S3 Device with Metal Oxides Gas Sensors. Proceedings 2018, 2, 1061. [Google Scholar]
  28. Szymańska, E.; Davies, A.N.; Buydens, L.M.C. Chemometrics for ion mobility spectrometry data: Recent advances and future prospects. Analyst 2016, 141, 5689–5708. [Google Scholar] [CrossRef] [PubMed]
  29. Aly, S.E.; Sabry, B.A.; Shaheen, M.S.; Hathout, A.S. Assessment of antimycotoxigenic and antioxidant activity of star anise (Illicium verum) in vitro. J. Saudi Soc. Agric. Sci. 2016, 15, 20–27. [Google Scholar] [CrossRef]
  30. Veronica, S.; Manohar, P.; Estefania, N. A Novel MOS Nanowire Gas Sensor Device (S3) and GC-MS-Based Approach for the Characterization of Grated Parmigiano Reggiano Cheese. Biosensors 2016, 6, 60. [Google Scholar]
  31. Dina, M.; Nada, M.; Shaimaa, F. GC-MS metabolites profiling of anethole-rich oils by different extraction techniques: Antioxidant, cytotoxicity and in-silico enzymes inhibitory insights. J. Enzym. Inhib. Med. Chem. 2022, 37, 1974–1986. [Google Scholar]
Figure 1. (a) Column chart and (b) radar map of the E-nose of SAEOs extracted by different methods.
Separations 10 00256 g001
Figure 2. (a) PCA analysis of the E−nose of SAEOs extracted by different methods. (b) LDA of the E-nose of SAEOs extracted by different methods.
Separations 10 00256 g002
Figure 3. Top view of the GC-IMS 3D topographic map of the SAEOs extracted by different methods. The longitudinal coordinate is the gas phase retention time, and the abscissa is the ion migration time (drift time).
Separations 10 00256 g003
Figure 4. Typical GC-IMS topographic map of SAEOs. The compounds of the SAEOs were labelled by searching the GC-IMS map library. A compound can produce multiple signals (monomer, dimer, or trimer), for example, 1 and 2 are anethole, and 1 is a monomer and 2 is a dimer. The whole spectrum represents the headspace composition of the sample.
Separations 10 00256 g004
Figure 5. Corridor diagram of volatile compounds of SAEOs extracted by four different methods.
Separations 10 00256 g005
Figure 6. PCA scatter plot of pre-processed GC−IMS spectra for SAEOs extracted by four different methods.
Separations 10 00256 g006
Figure 7. The PCA diagram of GC−MS of the SAEOs extracted by the four different methods.
Separations 10 00256 g007
Figure 8. The PCA analysis load diagram of GC−MS of the SAEOs extracted by the four different methods.
Separations 10 00256 g008
Table 1. Performance description of E-nose sensors.
Array No.Sensor NamePerformance Description
S1W1CSensitive to aromatic benzene
S2W5SVery sensitive to nitrogen oxides, especially negative to nitrogen oxides
S3W3CAmmonia, sensitive to aromatic components
S4W6SMainly selective to hydrides
S5W5CShort-chain alkanes, aromatic compounds sensitive
S6W1SSensitive to methyls
S7W1WSensitive to inorganic sulfides and terpenes
S8W2SSensitive to alcohols, aldehydes, and ketones
S9W2WAromatic ingredients, sensitive to organic sulfur compounds
S10W3SSensitive to long-chain alkanes
Table 2. GC-MS Analysis component diagram of SAEO extracted by different methods 1.
No.RTVolatile CompoundsRelative Content (%)
SCD1SCD2SCD3SE1SE2SE3ESE1ESE2ESE3HD1HD2HD3
117.94α-Pinene0.22620.22520.20560.25080.24320.25160.26650.26620.24710.03780.04880.0351
220.61Sabinene0.13160.13050.12070.15830.15540.15970.04440.04390.03710.01520.02080.0151
320.85β-pinene0.10220.09980.09540.08430.08350.08610.08020.08050.07660.02250.02760.0199
421.75Myrcene0.09570.09260.08750.09410.09260.09440.03610.03580.03380.13880.17070.1214
522.74α-Phellandrene0.06190.06090.05270.06290.05860.0619NBNBNB0.14470.16440.1166
623.163-Carene0.18160.18040.16810.14550.14140.1451NBNBNB0.27560.34110.2429
723.61a-TerpineneNBNBNB0.04790.04080.04760.05330.05390.0331NBNBNB
824.18p-Isopropyltoluene0.42810.42240.40650.47960.47580.48290.41220.40990.39890.05990.08540.0724
924.49Limonene1.63511.63191.56971.64031.63721.64620.36030.36080.34823.22094.06032.9144
1024.68Cineole0.86670.86150.84891.31021.32031.30991.28761.28351.28250.25160.20140.1494
1125.83Ocimene0.03500.03470.03290.03310.03250.0328NBNBNB0.09620.10460.0814
1226.65γ-Terpinene0.08460.08360.07710.17680.17510.17840.23110.22910.22410.12840.14750.1063
1328.80Terpinolene0.08570.08410.05730.05490.05000.05500.03670.03670.03170.20390.23100.3181
1429.58Linalool0.69480.69180.70360.75990.77330.76180.73070.72870.73392.00352.26911.8145
1529.36Methyl benzoateNBNBNBNBNBNBNBNBNB0.00730.01010.0083
1631.892-Cyclohexen-1-ol, 1-methyl-4-(1-methylethyl)NBNBNBNBNBNB0.01770.01780.01950.00580.00680.0068
1732.95d-Camphor0.11590.11450.11710.04750.04630.04550.08870.08910.0897NBNBNB
1833.58l-Menthalone0.26500.25840.27130.07950.08120.08250.04370.04560.0453NBNBNB
1933.83Isoborneol0.03310.02950.0277NBNBNBNBNBNBNBNBNB
2034.34Isomenthone0.12730.12390.12390.03310.03470.03280.02100.02140.0230NBNBNB
2134.90l-Menthol0.16230.15750.16570.03930.04450.04090.02000.02040.0221NBNBNB
2235.284-Carvomenthenol0.13670.13200.13290.23800.24750.24410.32470.32220.32770.31260.33730.3083
2336.21α-Terpineol0.09780.09540.09660.11770.11690.11660.16710.16730.16810.06180.07690.0846
2436.78Estragole3.36533.36063.38623.11843.14183.12122.95352.95162.975610.344710.987110.8927
2539.65Isocyclocitral0.04340.03990.04510.02220.0279NB0.02140.02030.0370NBNBNB
2640.71Anisic aldehyde0.73510.72370.77470.74050.76200.73900.74260.73750.77040.76300.96611.0304
2743.29trans-Anethole79.553079.815779.865381.562481.523081.549981.832481.765081.820779.498177.465678.7854
2844.14Cinnamyl alcohol0.03250.03130.03470.03240.03310.03420.02180.02260.01980.00560.00320.0050
2945.921-Methoxy-4-propylbenzeneNBNBNBNBNBNBNBNBNB0.00420.00380.0054
3046.37Chavicol0.03710.02700.0252NBNBNB0.02280.02260.02370.00410.00410.0058
3147.22Elemene isomerNBNBNBNBNBNBNBNBNB0.00730.00620.0062
3247.71Terpinyl acetateNBNBNBNBNBNBNBNBNB0.00280.00260.0026
3348.334-sec-ButylanisoleNBNBNBNBNBNBNBNBNB0.02950.05160.0727
3448.70Methyl anisate0.04320.04160.04110.04320.04400.04310.03940.03890.03930.01730.01580.0176
3548.95Copaene0.15430.14770.15300.14040.14320.14300.14920.12440.15300.25140.17920.2015
3649.15Geranyl acetate0.03600.03240.03520.03860.03770.03740.04120.04160.0436NBNBNB
3749.324-Methoxyphenylacetone0.09310.08760.08550.08390.08440.08410.08640.08510.08550.32260.51560.6960
3850.35β-ElemeneNBNBNBNBNBNBNBNBNB0.00750.00670.0067
3950.47a-Ethyl-4-methoxybenzyl alcohol0.02920.02390.02850.01940.02150.0205NBNBNB0.00630.00850.0116
4051.00Isocaryophyllene0.03340.03210.02820.02430.02370.02430.02050.02130.02010.01730.01630.0162
4151.39cis-a-Bergamotene0.75060.74480.75090.70680.71490.71080.75360.75300.75060.49930.46460.4546
4251.83Caryophyllene0.31060.30760.30500.33190.33220.33120.36960.37420.36260.24320.22430.2228
4353.11Cinnamyl acetate0.05000.04070.04160.04060.04320.04070.05530.05470.05480.01580.01390.0154
4453.52trans-a-BergamotolNBNBNBNBNBNBNBNBNB0.00600.00560.0060
4553.72MethoxypropiophenoneNBNBNBNBNBNBNBNBNB0.00850.01120.0162
4653.83β-Farnesene0.23170.22010.22050.18990.19390.18820.20870.21020.20470.11380.03880.1090
4753.95α-Humulene0.05510.05300.05310.05670.05780.05780.04530.04510.04470.02570.02530.0222
4854.63AromadendreneNBNBNBNBNBNBNBNBNB0.00510.00340.0033
4955.81Germacrene-dNBNBNBNBNBNBNBNBNB0.00450.00480.0084
5056.36Methyl isoeugenol0.08070.07670.07930.03970.04150.04060.03690.03730.0365NBNBNB
5156.64LedeneNBNBNBNBNBNBNBNBNB0.01530.01390.0139
5256.74BicyclogermacreneNBNBNBNBNBNBNBNBNB0.01120.00920.0125
5356.99α-Farnesene0.13690.13200.12900.12290.12310.12470.14490.14610.14060.02970.02380.0253
5457.13beta-Bisabolene0.16630.16540.16400.15290.15460.15320.18220.18300.18170.04700.04190.0430
5557.61gamma-Cadinene0.03480.03020.03030.02870.02940.02770.02890.02840.02880.01140.01120.0144
5658.12delta-cadinene0.06160.06020.05800.05840.05990.05830.05720.05780.05770.02110.01900.0209
5758.90[1,2,4] Triazolo [1,5-a] pyrimidin-7-ol,0.0689NB0.0675NBNBNB0.20190.20590.2324NBNBNB
5859.802-Hydroxy-1-(4-Methoxyphenyl) propan-1-one0.04160.04040.04200.03130.03070.03110.02440.02570.0257NBNBNB
5960.31Nerolidol0.15200.14440.14220.13470.13540.13680.14650.14710.14620.01780.01500.0211
6060.642′-Hydroxybutyrophenone0.23760.23040.23470.18320.18450.18580.14560.14300.1399NBNBNB
6160.70MethoxycinnamaldehydeNBNBNBNBNBNBNBNBNB0.00710.00910.0018
6260.821-(4-Methoxyphenyl)-1,2-propanediol0.62120.61320.40350.26720.09880.26500.30780.30700.13970.04720.11310.1704
6361.43Spathulenol0.06340.04120.01250.05300.05240.05010.01340.01960.0249NBNBNB
6461.52Foeniculin 1-(3-Methyl-2-butenoxy)-4-(1-propenyl) benzene5.86885.90776.02174.90494.95284.91055.86565.86555.88260.12570.09910.1886
6561.81Caryophyllene oxide0.04740.03840.04020.03580.03430.03150.05240.04790.0529NBNBNB
6665.77alpha-Cadinol0.10120.09060.08900.07550.07760.07690.09020.09100.09080.00380.0043
6768.671(2H)-Quinolinecarboxylic acid, 6-amino-3,4-dihydro-, methyl ester0.38730.39210.3893NBNBNB0.4398NB0.4383NBNBNB
6868.94FarnesolNBNBNB0.01670.01440.01460.01540.01610.0125NBNBNB
6971.163,5-Dimethylthiophenol, S-trifluoroacetyl-NBNBNB0.05070.04820.05090.0598NBNBNBNBNB
7071.73(4-Methoxy-phenyl)-(2-nitrocyclohexyl)-methanol0.33270.33270.33970.30930.30670.30930.35090.34660.3413NBNBNB
1 NB: the substance was not detected, RT: Retention time.
Disclaimer/Publisher’s Note: The statements, opinions and data contained in all publications are solely those of the individual author(s) and contributor(s) and not of MDPI and/or the editor(s). MDPI and/or the editor(s) disclaim responsibility for any injury to people or property resulting from any ideas, methods, instructions or products referred to in the content.

