Article

Calluna vulgaris Crude Extract Reverses Liver Steatosis and Insulin Resistance-Associated-Brain Lesion Induced by CCl4 Administration

by
Muhanad Alhujaily
Department of Medical Laboratory Sciences, College of Applied Medical Sciences, University of Bisha, Bisha 67714, Saudi Arabia
Separations 2023, 10(2), 94; https://doi.org/10.3390/separations10020094
Submission received: 11 January 2023 / Revised: 14 January 2023 / Accepted: 20 January 2023 / Published: 31 January 2023

Abstract

:
Fatty liver (FL) is one of the most prevalent diseases in the world, characterized by insulin resistance and hyperlipidemia, which consequently lead to neurodegenerative disorders through the induction of oxidative stress-inflammatory axis, which alters the neurotransmitters’ levels. Calluna vulgaris (CV), also known as heather, has anti-inflammatory and antidepressant properties, making it a promising candidate for treating steatosis and brain lesions. This study aimed to assess the prophylactic and therapeutic effect of CV extract on brain dysfunction associated with steatosis. FL was induced in rats by CCl4 oral administration (50 µL/Kg in olive oil three times/week) for six weeks. The protection group received 200 mg/kg CV extract orally for two weeks before and two weeks during FL induction, while the treatment group was orally administered CV extract after FL induction for one month. The biochemical parameters revealed that CCl4 administration induced hepatotoxicity as blood-liver function parameters (AST, ALT, ALP, protein, and LDH) were increased by 1.8, 1.4, 2, 2.4, and 1.2-fold, respectively. Moreover, insulin resistance was characterized by a two-fold increase in the glucose, insulin, and lipid profile when compared to control one, at p < 0.05. Steatosis liver demonstrated a two-fold increase in all following parameters— acetaldehyde (AC), prooxidant (TBARS), acetylcholine esterase (AChE), monoamine oxidase (MAO), hyaluronidase, and ATPase—when compared to control one, at p < 0.05. CCl4 administration led to brain lesions where the brain level of TBARS, insulin, cholesterol, AChE, and MAO was progressively increased by 2, 1.6, 2.2, 4, and 1.6-fold, respectively, that was associated with reduced glucose (8-fold) and GSH (2-fold) than that of control level, at p < 0.05. CV extract as a prophylactic and therapeutic agent increased GSH and decreased TBARS of both the liver and brain than that of induced group, at p < 0.05, normalized the activities of AChE and MAO, and increased insulin sensitivity where they successfully decreased the HOMA-IR, glucose, TG, and cholesterol compared to than that of induced group, at p < 0.05. This positive effect of CV extract contributed to the presence of polyphenolic compounds such as catechins (5.501 ± 0.056 µg/g extract), gallic (3.525 ± 0.143 µg/g) extract, and protocatechuic acid (2.719 ± 0.132 µg/g extract). Therefore, we concluded that FL induced brain dysfunction through the formation of ROS and elevation of insulin and lipid inside the brain tissue, which alter the amount of neurotransmitter and cellular energy production. Rich in polyphenolic compounds, CV extract functions as an antioxidant, antidiabetic, hepatoprotective, inhibitor of neurotransmitter catabolizing enzymes, and a regulator for energy production. Therefore, it can be used as a preventative or treatment for NAFLD and brain damage.

1. Introduction

Nonalcoholic fatty liver disease (NAFLD) affects approximately one-fourth of the global population. About 10% of these individuals develop severe liver disorders such as nonalcoholic steatohepatitis (NASH), fibrosis, cirrhosis, etc. NAFLD is characterized by the presence of small fat and triglyceride vesicles within the hepatocytes without causing hepatic inflammation [1]. NAFLD, such as steatosis, is a component of the insulin resistance syndrome because it is directly linked to the growing prevalence of visceral obesity, hyperglycemia, low levels of high-density lipoprotein (HDL) cholesterol, hypertension, hypertriglyceridemia, oxidant stress, high fatty acids, and high levels of inflammatory cytokines [2]. Insulin resistance stimulates the development of NAFLD by increasing the production of free fatty acids (FFA) absorbed by the liver, resulting in steatosis (first hit) progression. Steatosis triggers a series of cells (hepatocytes, stellate cells, adipose cells, Kupffer cells) crosstalk that stimulates the formation of reactive oxygen species (ROS) and inflammatory mediators, which leads to NASH formation or cirrhosis [3].
The liver and brain are connected by the insulin signaling pathway and oxidative stress-inflammation axis, which mainly affects the neurotransmitter level in both peripheral and central neurons. Brain oxidative stress, inflammation, and cognitive impairment were found to be associated with NAFLD [4]. During NAFLD, the stimulated Kupffer cells release a high amount of proinflammatory cytokines, such as tumor necrosis factor-alpha (TNF-α). The TNF-α can cross the blood–brain barrier (BBB) and induce the systemic ROS and inflammatory mediators, thus altering the brain metabolic pathways and leading to neurodegeneration disorder [5]. During NAFLD, brain insulin resistance takes place. It leads to ceramide biosynthesis from the accumulated free fatty acid, which, in turn, stimulates the expression of nuclear factor kappa-β (NF-kβ), leading to brain inflammation [6,7]. Moreover, high brain fat inhibits the primary antioxidants expression regulator, nuclear factor erythroid 2-related factor 2 (Nrf2), which consequently inhibits the production of the enzymatic and non-enzymatic antioxidants such as glutathione (GSH), leading to ROS production and accumulation, which finally results in an oxidative stress status [8]. In addition, insulin resistance impairs mitochondrial function by reducing oxidative phosphorylation (OXPHOS) and the tricarboxylic acid (TCA) cycle. According to reports, an increase in brain ROS causes a decrease in mitochondrial oxygen levels, which contributes to a decrease in ATP production [9].
Insulin therapy and insulin sensitizers are used to treat neurodegenerative disorders associated with insulin resistance. Several natural products or plant extracts have been examined as alternative therapeutic preparations for both diseases due to their biodiversity and low toxicity, as well as the potential to modify the actions of several proteins’ targets implicated in disease progression [10]. Several polyphenols, such as quercetin, resveratrol, kuromanin, berberine, catechin, and cyanidin, were used in vitro and in vivo to treat NAFLD and insulin resistance [10]. Furthermore, serval plants extracts have been examined as hepatoprotective against NAFLD, such as Myrciaria jaboticaba berry peel, Cynara scolymus L., Vaccinium spp., Valeriana fauriei, Laminaria japonica, Coffea arabica pulp, Zingiber officinale, and roscoe extracts. They all were found to inhibit hepatic lipid accumulation, act as potent antioxidants and anti-inflammatories, and increase insulin sensitivity [11].
Calluna vulgaris, also known as heather or ling, is an evergreen shrub that belongs to the Ericaceae family and Calluna genus. It grows in Africa, Europe, and Asia. In addition to its anti-inflammatory properties, Calluna was utilized in traditional folk medicine as an antiseptic, antibacterial, cholagogue, diuretic, expectorant, anti-rheumatic, and antidepressant agent [12,13].
In our previous work, the heather extract showed in vitro antioxidants, anti-inflammatory properties, anti-acetylcholinesterase, anti-glucosidase activities, and antimicrobial effects [14]. These biological effects are due to the presence of total phenolic compounds, alkaloids, flavonoids, saponin, lipids, amino acids, and proteins in this ethanolic extract [14]. In addition, this extract contains chlorogenic acid, caffeic acid, 3,5-dicaffeoylquinic acid, gallic acid, retinol, tannic acid, and 3,4 dicaffeoylquinic acid [15]. This extract also exhibited a hepatoprotective effect against LPS-induced inflammation in rats where it increased the hepatic enzymic antioxidants activities and decreased the hepatic inflammatory markers, namely cyclooxygenase 2 (COX-2, inducible nitric oxide synthase (iNOS) and tumor necrosis factor-α (TNF- α) [16]. Other studies have demonstrated that heather extract is abundant in phenolic compounds such as f kaempferol-3-O- β-d-galactoside (flavonoid glycoside), which exerts significant in vivo anti-inflammatory effects by inhibiting the production of TNF-, COX-2, iNOS, and lipoxygenase (LOX) [17]. These findings demonstrate that heather extract could protect against and treat NAFLD and neurodegenerative brain disorders.
Therefore, this study aimed to investigate the protective and therapeutic activity of Calluna vulgaris (CV) ethanolic extract against NAFLD associated with brain lesions by tracking its effect on the diabetic profile, lipid profile, oxidative stress, neurotransmitter trafficking, and mitochondria metabolism.

2. Material and Methods

2.1. Materials

Acetylthiocholine iodide (ACTI), 5′-dithio-bis-2-nitrobenzoic acid (DTNB), pyrogallol, GSH, p-hydroxy-diphenyl, thiobarbituric acid, hyaluronic acid, dimethylaminobenzaldehyde, ATP, and methyl green were purchased from Sigma Aldrich (St. Louis, MO, USA). Other chemicals and solvents used in this study were of analytical grade and supplied by El-Nasr Pharmaceutical Chemicals Co., Alexandria, Egypt; International Company, Alexandria, Egypt; Fluka, Buchs, Switzerland and Win Lab, Babson Park, UK.

2.2. Plant Collection, Extraction, and Polyphenolic Content Identification

2.2.1. Extraction Preparation

CV dried shoots were purchased from the local market, and their class was verified based on the data about the plant published by the Burncoose Nurseries and the United States Department of Agriculture [18,19]. In addition, specimens of this plant was deposited as voucher specimens at Alexandria University Herbarium (ALEX). The plant’s aerial part was powdered and sieved. One liter of ethanol was added to 100 g of CV powder and stirred for three days at room temperature. After that, the solution was separated by filtration twice with 400 mL of ethanol per iteration. The clear solutions were collected and evaporated using a rotary evaporator (Jobling Laboratory, Sunderland, UK) and then lyophilized (Lyophilizer; Virtus SP Specific, Nowy Targ; Malopolskie, Poland) to obtain the dried powder form (20 g).

2.2.2. Phytochemical Identification

Total phenolic contents were determined by the Folin–Ciocalteu method according to [20]. Briefly, 1 mg of CV extract was dissolved in 0.1 mL of absolute ethanol (99.9%), then mixed with 2.8 mL of deionized water, 2 mL of sodium carbonate, and 0.1 mL of Folin–Ciocalteau reagent. After incubation at room temperature for 30 min, the absorbance of the reaction mixture was measured at 750 nm. Gallic acid (GA) was used as a standard, and the CV extract phenolic content was calculated as mg gallic acid equivalent (GAE/g dried powder).

2.2.3. HPLC Analysis of Polyphenolic Compounds of CV Extract

A weight of 1 g of sample was mixed with 20 mL of 2 M NaOH and shaken for 4 h at room temperature. The pH was adjusted to 2 with 6 M HCl. The samples were centrifuged at 5000 rpm for 10 min, and the supernatant was collected. The phenolic compounds were extracted twice with 50 mL diethyl ether and ethyl acetate 1:1. The organic phase was separated and evaporated at 45 °C, and the sample was re-dissolved in 2 mL methanol.
Subsequently, HPLC analysis of polyphenolic compounds was carried out as described by Kim et al. [21] using Agilent Technologies 1100 series. The HPLC conditions were performed as follows: the column was XDB-C18, and the gradient mobile phase consisted of acetonitrile (solvent A) and 2% acetic acid in water (v/v) (solvent B). The flow rate was kept at 0.8 mL/min for a total run time of 70 min (100% B to 85% B in 30 min, 85% B to 50% B in 20 min, 50% B to 0% B in 5 min, and 0% B to 100% B in 5 min). The benzoic acid and cinnamic acid derivatives had peaks at 280 and 320 nm, respectively. Then, UV spectra were compared to 17 standards (Sinapic, p-coumaric, Rosmarinic, Chlorogenic, Cinnamic, Ferulic, Gallic, Protocatechuic, p-hydroxybenzoic, Syringic, Vanillic, Catechin, Chrysin, Rutin, Apigenin-7-glucoside, Quercetin, and Kaempferol).

2.3. Animal

This study was performed on female rats because the incidence of NAFLD, insulin resistance, and neurodegenerative disease in Egypt is higher among women than men [22,23,24]. Thirty female Sprague-Dawley rats (90–120 g) were purchased from the Medical Research Institute, University of Alexandria, Alexandria, Egypt. The animals had free access to pelleted food and tap water for one week. They were housed in polystyrene cages (6/cage) and maintained under controlled temperatures and constant photoperiodic conditions. All animal experiments were performed according to ARRIVE guidelines and the National Institutes of Health Guide for the Care and Use of Laboratory animals (NIH Publications No. 8023). The animal experiments approval number was 31-1Z-1120, which was taken from the Institutional Animal Care and Use Committees (IACUCs) of the Pharmaceutical and Fermentation Industries Development Center, Scientific Research and Technological Application City.

Animal Design

Animals were divided into five main groups. First, the sham control group received a regular pelleted diet. The vehicle group was intraperitoneally (IP) injected with 375 μL olive oil/kg body weight three times/week for four weeks. The group was then orally administered 1 mL of 20% polyethylene glycol (PEG)/kg body weight for the next 30 days. The NAFLD-induced group received IP injected with 50 μL carbon tetrachloride (CCl4) in 375 μL olive oil/kg body weight three times/week for four weeks. The protection group orally received 200 mg/kg Calluna extract dissolved in 20% polyethylene glycol (PEG)/kg body weight for four weeks [16]. It was divided into two weeks before and two weeks during the NAFLD induction period. Finally, the treated group orally received 200 mg Calluna extract/kg body weight for one month after the induction period. Body weight was recorded on the first day and the 58th day of the experiment. After the end of the experimental period (58 days), rats were overnight fasted and then anesthetized by isoflurane before scarification. Blood was collected in plain tubes to prepare serum. The brain and liver were rapidly isolated, washed in cold saline, and then weighed. Brain or liver homogenate was prepared by homogenizing one part of the tissue with nine volumes of 0.1 M sodium phosphate buffer saline, pH 7.4.

2.4. Biochemical Parameters

Body weight gain and liver or brain/body weight ratios were calculated.
The serum levels of aspartate aminotransferase (AST), alanine aminotransferase (ALT), alkaline phosphatase (ALP), lactate dehydrogenase (LDH), serum and tissues protein level, serum and brain levels of glucose, cholesterol, and triglycerides beside serum HDL, LDL, and VLDL were measured using commercial kits, which were all obtained from Diamond Diagnostic (Egypt). Serum and brain insulin was measured using an Invitrogen commercial kit (Thermo Fisher, Waltham, Massachusetts, USA).
The Homeostatic Model Assessment for Insulin Resistance (HOMA-IR) was calculated according to the formula: fasting insulin (µU/L) x fasting glucose (nmol/L)/22.5.
The levels of thiobarbituric acid-reactive substances (TBARS) were determined in serum and tissues’ homogenates according to [25], where 0.5 mL of the serum or tissue homogenates were added to 1 mL trichloroacetic acid (TCA) and centrifuged off at 3000 rpm for 10 min. To 1 mL of supernatant, 0.5 mL of thiobarbituric acid (0.7%) was added and boiled in boiling water bath for 45 min. Afterward, the obtained pink color was estimated at 540 nm against a blank.
The non-reducing antioxidant status of serum and tissues’ homogenates was determined in the reduced GSH, where a volume of 0.1 mL serum or homogenate was mixed with 0.1 mL of sulphosalicylic acid (4%). After cold incubation at 4 °C for 10 min, the solution was centrifuged at 3000 rpm for 10 min at 4 °C. Then, 100 µL supernatant was mixed with 2.7 mL phosphate buffer and 0.2 mL DTNB (0.1M, pH 8.5) and reincubated for 5 min. The developed yellow color of 5-thio-2-nitrobenzoic acid (TNB) was measured immediately at 412 nm [26].
Liver acetaldehyde was determined according to the method of [27], where 100 µL of liver homogenate was mixed with 100 µL distilled water and 200 µL TCA before being incubated in ice for 5 min. The solutions were centrifuged at 3000 rpm for 5 min, and the supernatant was decanted. To the supernatant, 150 µL copper sulfate (20%) and 150 mg calcium oxide were added, mixed thoroughly, and then incubated with stirring for 30 min at room temperature. The solutions were centrifuged at 3000 rpm for 5 min, and the supernatants were separated. To the supernatants, 50 µL p-hydroxydiphenyl (50 mg dissolved in 3 mL of 3% NaOH) was added and left to stand at 30 °C for 30 min with stirring. The solutions were placed in boiling water bath for 15 min and then cooled. The absorbances of the formed violet color were measured at 560 nm.
The hepatic hyaluronidase was determined according to the method of [28]. Briefly, 135 µL liver homogenate was mixed with 67.5 µL acetate buffer (50 mM, pH 4 containing 150 mM sodium chloride) and 0.8 mL hyaluronate solution (1.25 g/L in acetate buffer) and incubated for 10 min at 37 °C (tested solution). A volume of 500 µL of the tested solution, standard (N-acetylglucosamine solutions, 10 µg/mL in acetate buffer) or blank solution (0.1 mL tetraborate solution (0.8 M, pH 9.1), 0.4 mL hyaluronate and 0.1 mL sample) was added to 0.1 mL tetraborate and heated for 3 min in a boiling water bath then cooled. After that, 3 mL dimethylaminobenzaldehyde reagent (1% (4-dimethylaminobenzaldehyde, 10 g was dissolved in 100 mL acetic acid containing 12.5 v/v HCl, 10 M. Before use, the solution was diluted with 9 volumes acetic acid) was added and incubated for 20 min at 37 °C. The absorbances of tests and standards were read at 585 nm against a blank.
Serum, liver, and brain AChE activities were determined using the Ellman assay [29]. In a final volume of 1 mL, the assay system contained 100 mM phosphate buffer, pH 8, and 75 mM ACTI. The brain, liver supernatant, or serum was pre-incubated with the assay medium for 15 min at 37 °C, and 0.32 mM DTNB was added as a second substrate. The reaction was initiated by the addition of DTNB, and the increase in absorbance at 412 nm was recorded for 5 min at 37 °C. The enzyme-specific activity was calculated using the following equation:
IU/mg = [absorbance difference] × [Total Volume in cuvette (µL)]/([Molar extinction coefficient of DTNB] × [Volume of sample (µL)] × [Protein Concentration (mg/mL)])
Serum and tissues’ homogenates monoamine oxidase (MAO) were measured according to the method of [30]. A volume of 667 μL of 500 μM p-tyramine and 133 μL potassium phosphate buffer pH 7.6 were added to 100 μL brain, liver supernatant, or serum. The absorbance was measured at 250 nm against air after 30 s and 90 s.
Serum, liver, and brain adenosine triphosphatase (ATPase) activity was determined by the method of [31]. Briefly, 200 µL Tris-buffer (5 mM MgCl2, 80 mM NaCl, 20 mM KCl, 40 mM Tris–HCl buffer, pH 7.4) was added to 20 μL serum or supernatant and preincubated for 5 min at 37 °C. Subsequently, 20 μL ATP (10 mM) was added and incubated for 30 min. To the solution, 200 μL TCA (10%) was added and centrifuged at 3000 rpm for 10 min. To 50 μL of supernatant, 5 mL ammonium molybdate-methyl green mixture (5.8 mL molybdate, 1.7 mL methyl green, and 1.3 triton ×305/NaOH and 1 mL water) was added, mixed well, and incubated for 10 min at room temperature. The absorbance of samples and standards were measured at 630 nm against a blank. Enzyme-specific activities were expressed as nmol pi released/min/mg protein.

2.5. Histological Investigations

Following sacrificing, specimens were collected from the liver rats in all groups before being fixed in a 10% neutral buffered Formalin solution. After a minimum of 24 h, the steps of dehydration were followed with ascending grades of ethanol, and specimens were cleared in xylene and then embedded in paraffin wax. Tissue sections (3-5 Microns thick) were cut and stained with hematoxylin and eosin (H&E) according to [32] and subjected to light microscopy for histopathologic evaluation.

2.6. Statistical Analysis

Data were analyzed by one-way analysis of variance (ANOVA) using the Primer of Biostatistics (Version 5) software program. The significance of means ± SD was detected in groups using the multiple comparisons Student–Newman–Keuls test at p < 0.05.

3. Results

The total phenolic content in CV extract was 135.6 µg, equivalent to gallic acid/g extract (Table 1 and Figure 1). CV extract was examined for the presence of 17 phenolic compounds, which were classified into three classes: Hydroxy-cinnamic acids (sinapic, p-coumaric, rosmarinic, chlorogenic, cinnamic, and ferulic), hydroxy-benzoic acids (gallic, protocatechuic, p- hydroxybenzoic, syringic, and vanillic) and flavonoids (catechin, chrysin, rutin, apigenin-7-glucoside, quercetin, and kaempferol), as depicted in Table 1. The most predominant hydroxy-cinnamic acid was sinapic, the highest phenolic compound found in this extract; followed by catechin, classified as flavonoids; and, finally, gallic acid, classified as hydroxy-benzoic acid.
Table 2 illustrates that all treatments resulted in the same body weight gain, with the exception of the induction group and the treated group, which showed the lowest body weight gain at p < 0.05. The administration of PEG followed by olive oil, CCl4, or CV extract after the induction period (treatment groups) decreased the liver/body ratio by the same level compared to the control group, at p < 0.05. The protection group demonstrated the same control liver/body ratio. The brain/body ratio revealed the same pattern at p <0.05.
The liver function tests are shown in Table 3. The vehicle group exhibited normal control AST and ALT activities and a normal AST/ALT ratio associated with low ALP, LDH, and protein levels compared to sham control levels, at p < 0.05. The administration of CCl4 for four weeks led to hepatotoxicity, which was indicated by high ALT, AST, ALP, LDH, and protein levels coupled with an AST/ALT ratio reduction when compared to the sham group, at p < 0.05. The administration of CV extract before and during the induction period (protection group) prevented CCl4 adverse effects on the hepatic tissue. The group demonstrated the same control levels of liver function parameters except for the blood protein level, which was lower than the sham control level but similar to the vehicle control level, at p < 0.5. In contrast, the use of CV extract as a therapeutic agent (treatment group) successfully normalized the liver function tests at p < 0.05.
According to Table 4, the levels of blood glucose (BGL), insulin, HOMA-IR, TG, cholesterol, HDL, LDL, and VLDL in the vehicle group were identical to those of the sham control group at p < 0.05. CCl4 injected for four weeks led to hyperglycemia, hyperinsulinemia, insulin resistance (elevated HOMA-IR), and hyperlipidemia. The administration of CV extract as a preventative or therapeutic agent improved the diabetic profile but did not normalize the tested parameters at p < 0.05.
The administration of PEG followed by olive oil did not alter normal serum prooxidant (TBARS), non-reducing antioxidant (GSH), neurotransmitter-catabolizing enzymes levels (AChE and MAO), and ATPase at p < 0.05 (Table 5). CCl4 injection for four weeks induced oxidative stress, as measured by an increase in TBARS and a decrease in GSH levels compared to those of the sham control group. In addition, it hyperactivated injection AChE and hypo-activated MAO, at p < 0.05, compared to the sham control group. CV extract administration as a protection or treatment agent improved the TBARS level but failed to normalize it. Otherwise, its administration normalized GSH, AChE, and MAO serum levels at p < 0.05. Finally, ATPase activity in the serum was not affected by any treatment at p < 0.05.
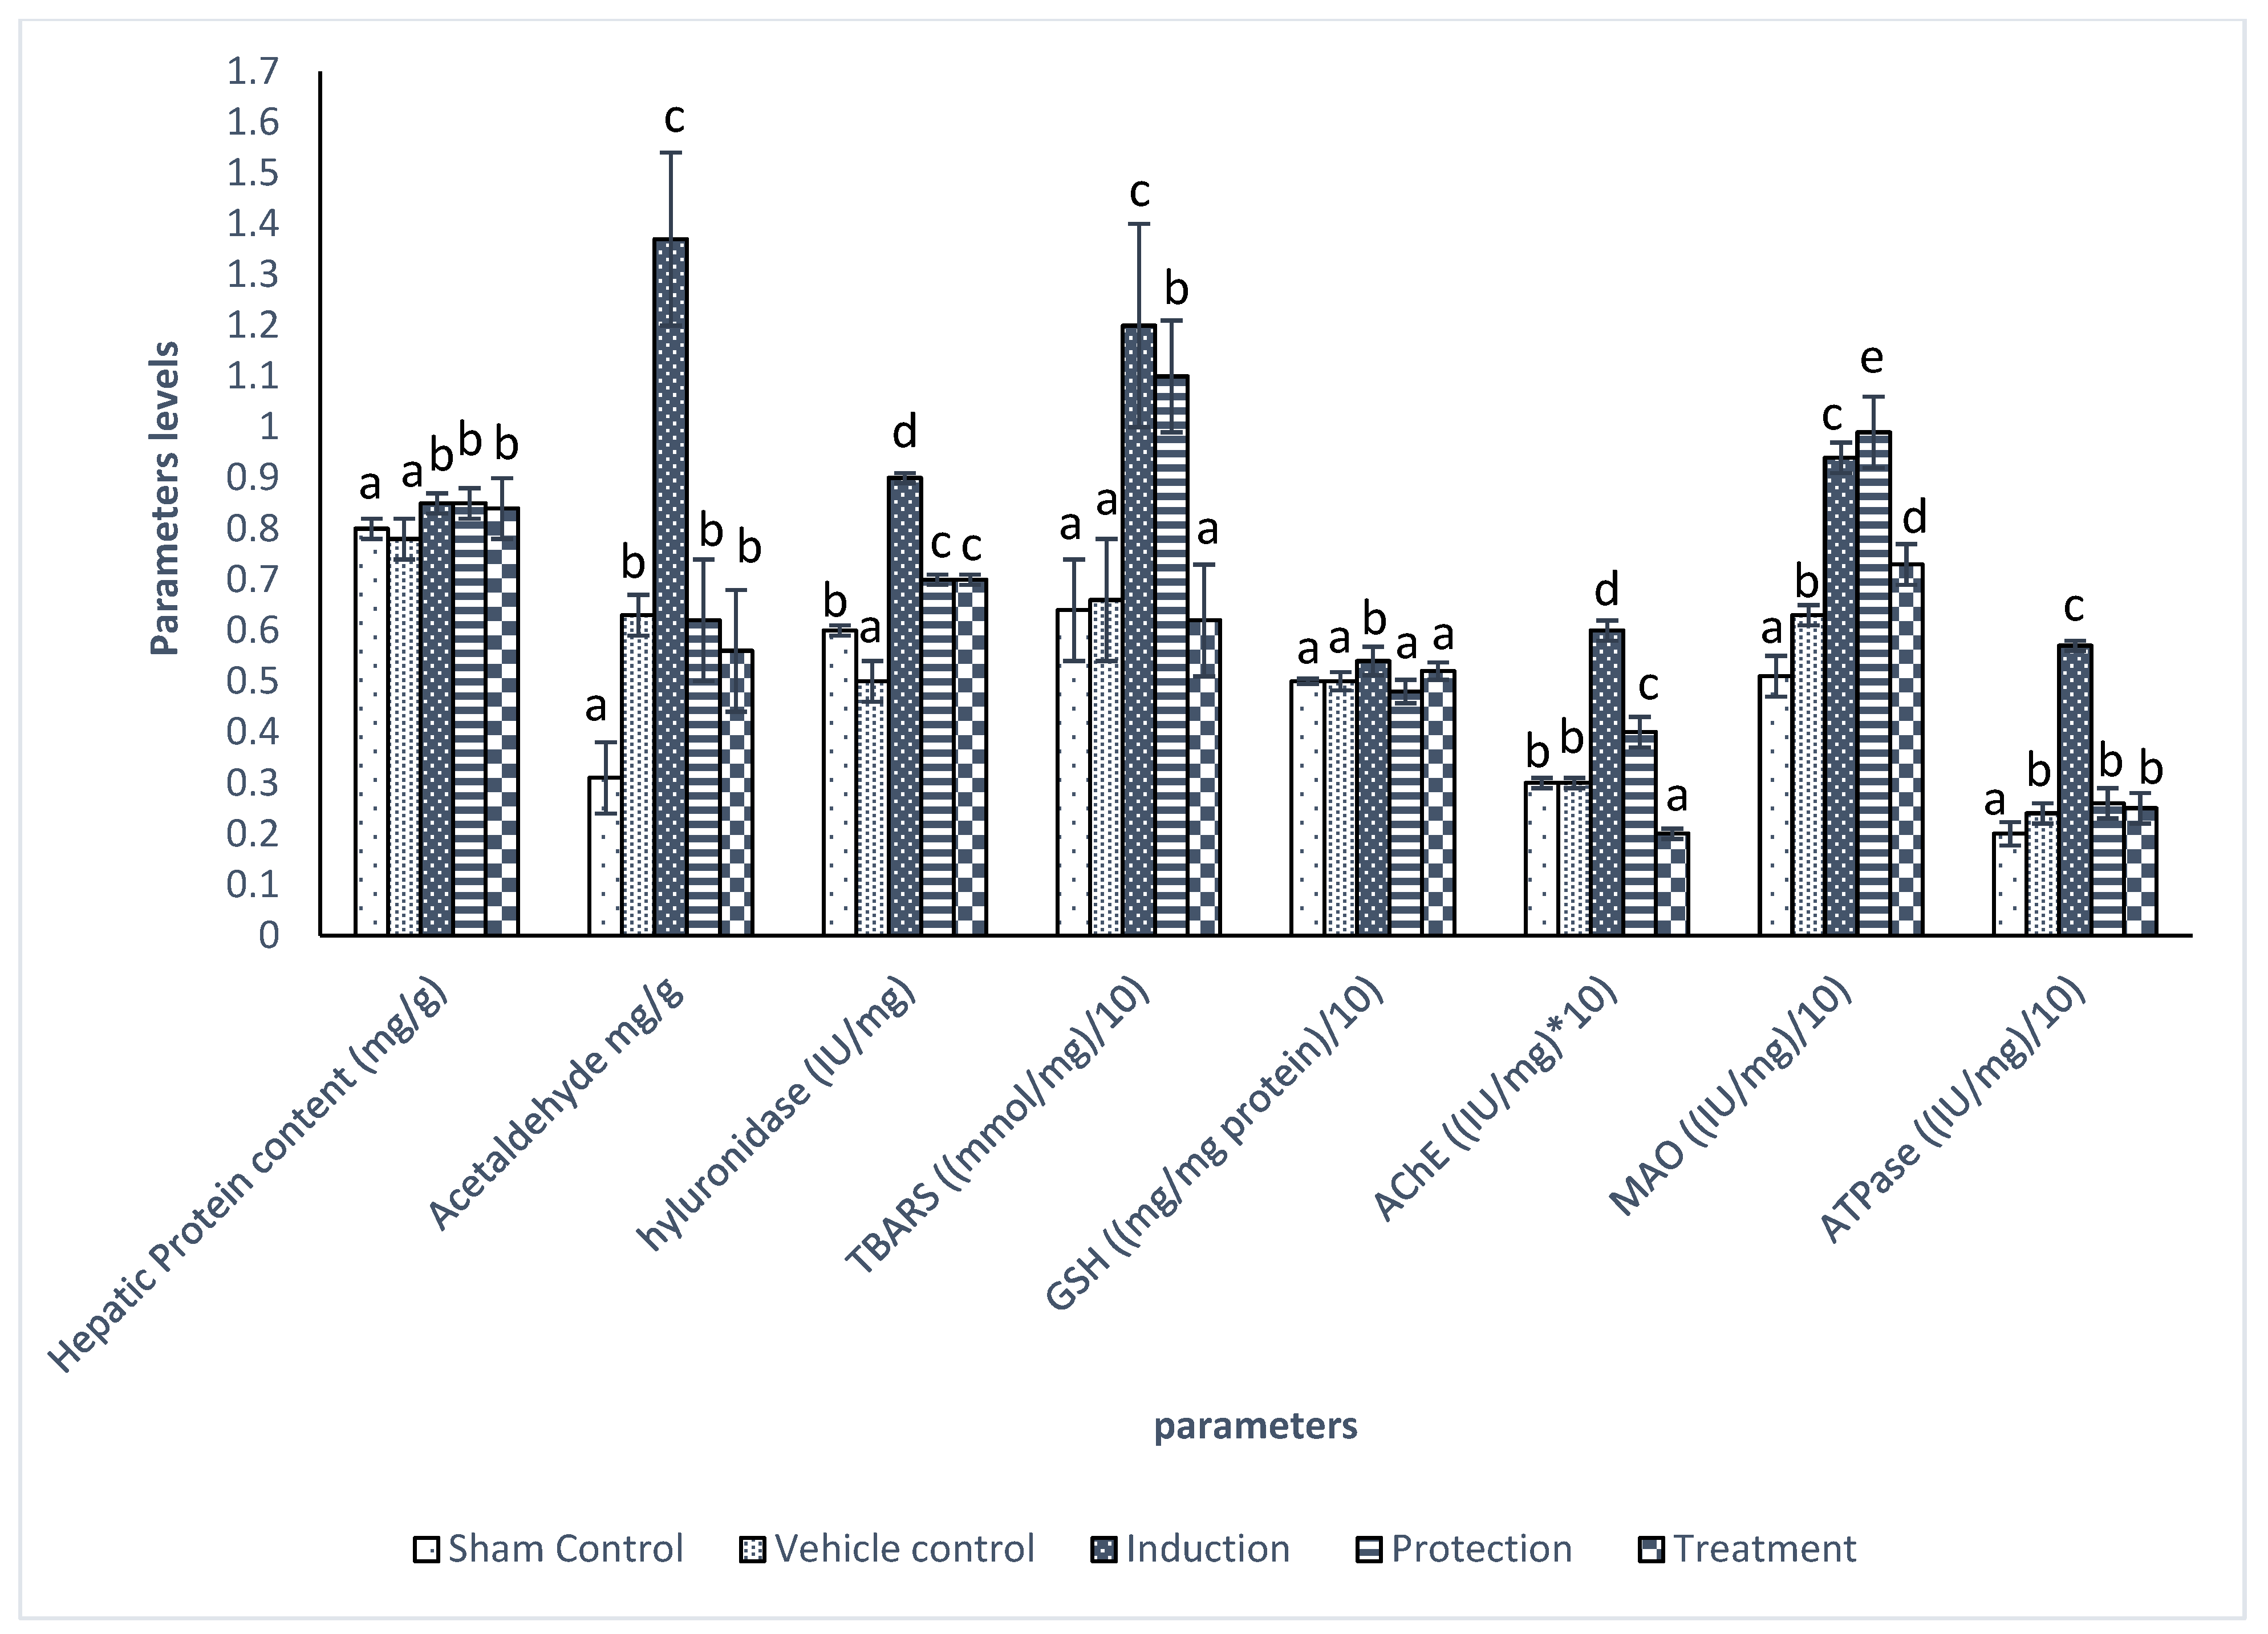
Figure 2 shows that CCl4 administration increased the hepatic protein, acetaldehyde, TBARS, and GSH levels associated with the hyperactivation of hyaluronidase, AChE, MAO, and ATPase enzymes compared to the sham control group at p < 0.05. The administration of CV extract as prophylactic preparation improved acetaldehyde, hyaluronidase, TBARS, AChE, and ATPase associated with the normalization of GSH level and the elevation of the MAO activity. The same pattern was observed when CV extract was used as a therapeutic preparation, except that it normalized TBARS and hyperactivated AChE significantly more than the sham control group, at p < 0.05. On the contrary, CV extract administration showed the same hepatic protein level as the CCl4-administered group.
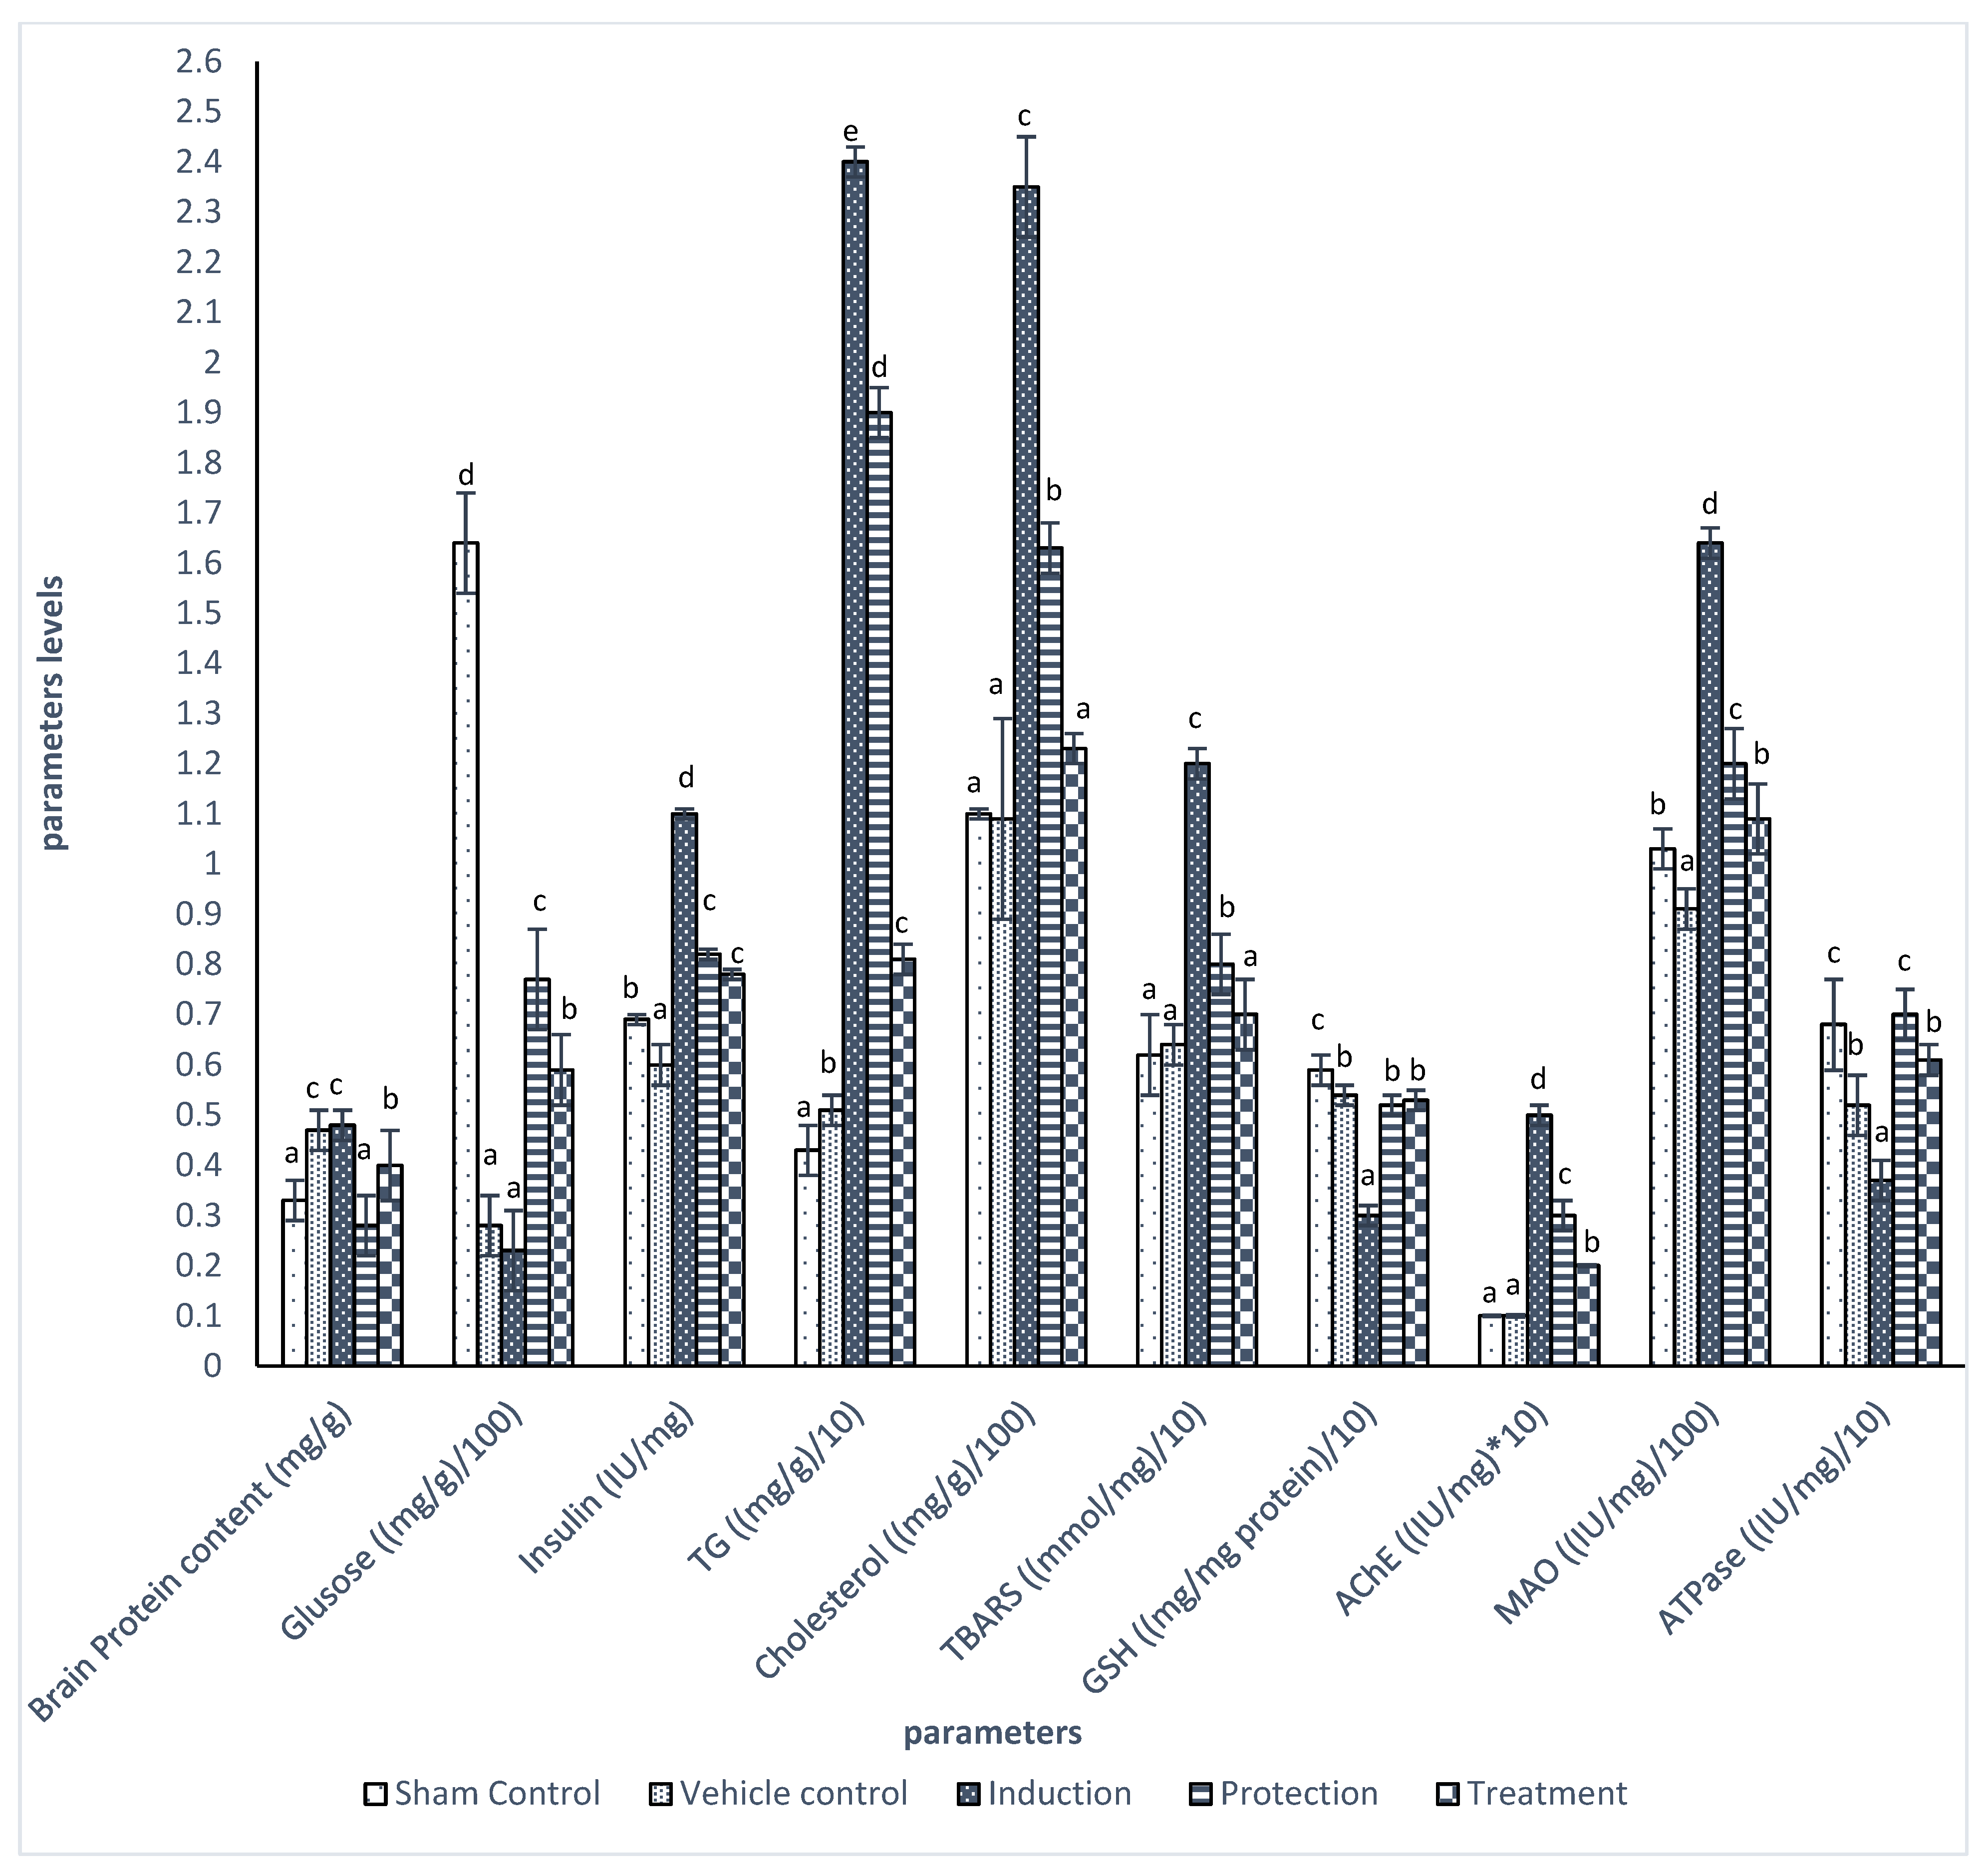
Compared to the sham control level, the administration of CCl4 decreased glucose, GSH, and ATPase levels in brain tissue while increasing insulin, TG, cholesterol, TBARS, AChE, and MAO tissue levels, at p < 0.05, when compared to sham control level. The protection group showed higher brain glucose and GSH levels than the induction group but lower than the sham one, at p < 0.05. Furthermore, the protection group had lower insulin, TG, cholesterol, TBARS, AChE, and MAO levels than the induction one but was still higher than the sham control group, at p < 0.05. The combination of CV extract as a therapeutic preparation normalized brain cholesterol, GSH, and MAO activity. In contrast, its administration improved the other tested parameters but failed to normalize them at p < 0.05 (Figure 3).
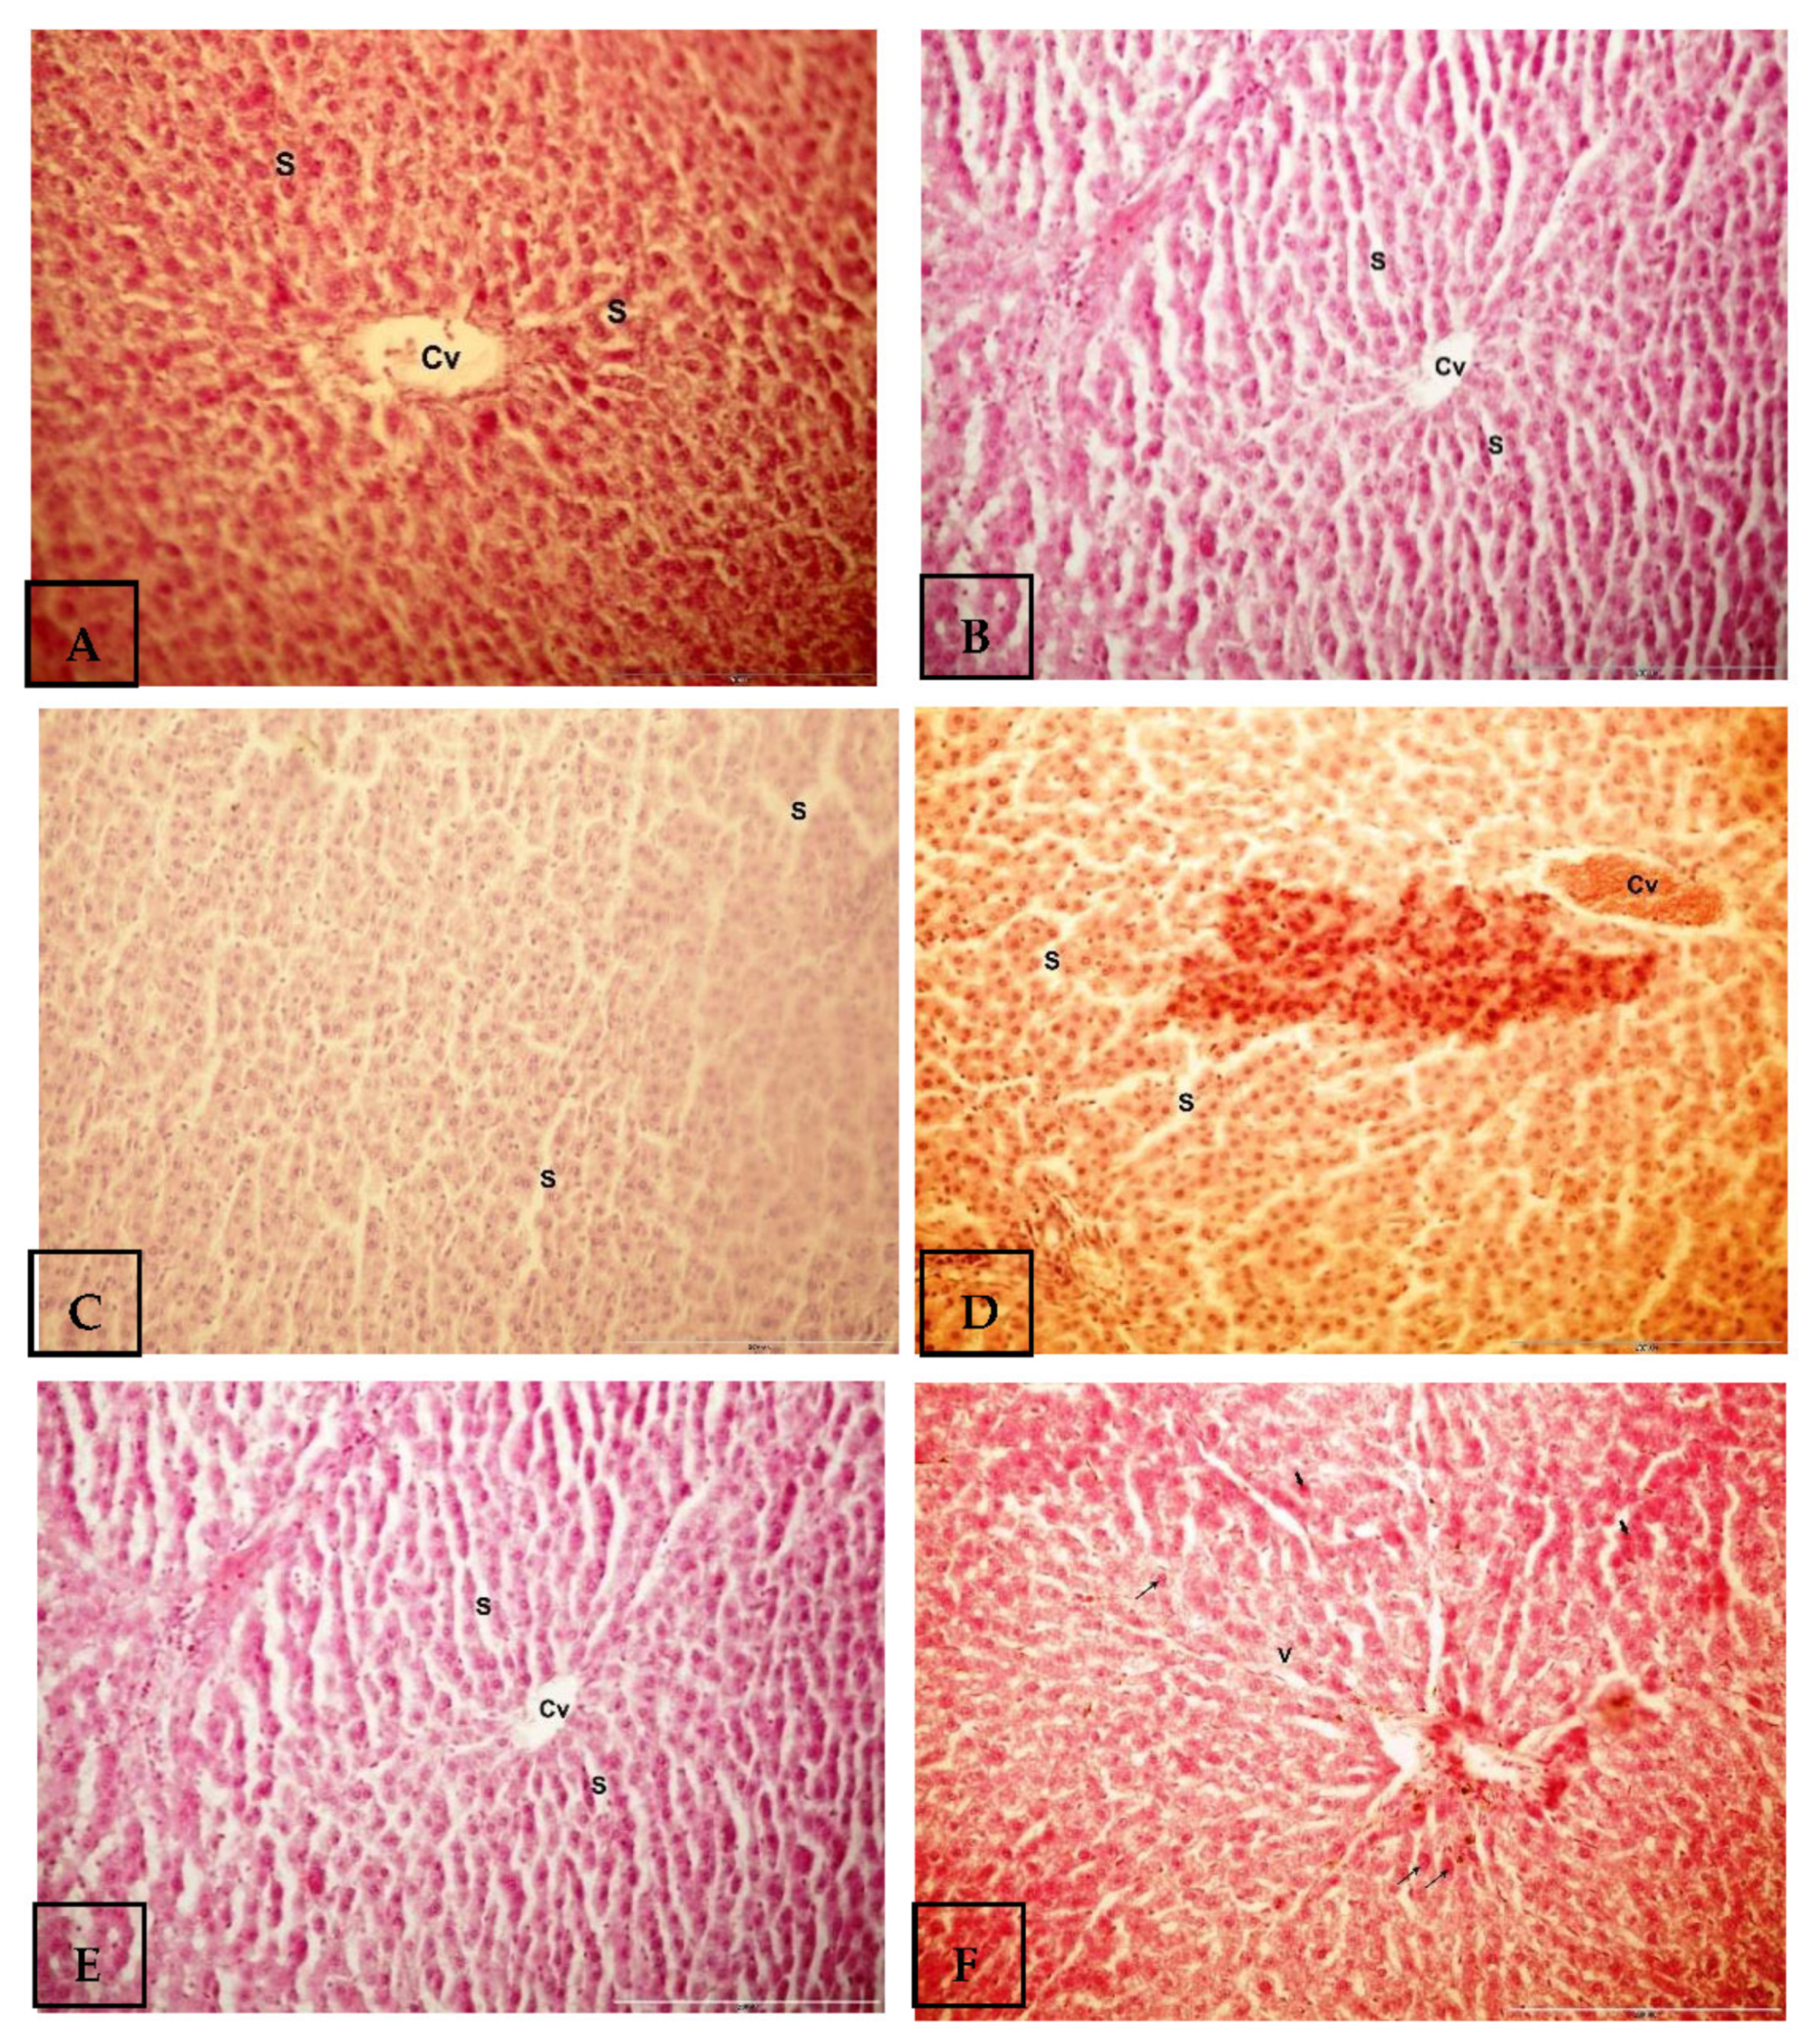
Figure 4 demonstrates the alteration in the architecture of hepatic cells during different treatments. Figure 4A shows that the hepatic cells of the control group radiating around the central vein (Cv) were separated by sinusoids (S). The administration of PEG (vehicle group) (Figure 4B) revealed a normal histological structure of the hepatic cords, sinusoids (S), and central vein (Cv). The administration of CCl4 led to a progressive alteration in hepatic tissue, as Figure 4C shows a loss of regular arrangement of hepatic configuration, dilated blood sinusoids (S), and hepatocytes with vacuolated nuclei (arrows). In contrast, Figure 4D shows a congested central vein (Cv) and dilated sinusoids (S). The protection group (Figure 4E) demonstrates a normal central vein (Cv) and some inflammatory cells (arrow). In contrast, the treatment group (Figure 4F) demonstrates the vacuolation of hepatocytes (curved arrows), a large-sized cytoplasm (cytomegaly), bigger nuclei (arrows), and some pyknotic nuclei (thick arrows).

4. Discussion

Carbon tetrachloride (CCl4) induces NAFLD and NASH through the stimulation of interleukin-1 receptor-associated kinase 4 (IRAK-4) which occurs due to the formation of trichloromethyl radical, CCl3, in hepatocytes by CYP2E1. CCl3 interacts with oxygen to form the trichloromethyl peroxyl radical, CCl3OO, which initiates the chain reaction of lipid peroxidation and ROS formation that activates mTOR and its downstream pathway, leading to liver fibrosis [33]. Furthermore, IRAK-4 could stimulate caspase 8, leading to mitochondrial dysfunction that consequently arrests β-oxidation and, therefore, reduces ATP production [33]. Epidemiologically, NAFLD and NASH are associated with insulin resistance and other metabolic syndromes such as diabetes [34]. Insulin binds with its receptor, which is present in all brain regions, to modulate glucose, acetylcholine, norepinephrine, and dopamine levels [35]. Therefore, during insulin resistance, the levels of the neurotransmitter and its regulator, glucose, change, leading to neurodegenerative disorder progression [36].
In accordance with these reports, CCl4 injection caused cellular oxidative stress, insulin resistance, hepatocytes toxicity, and weight loss. It was observed that after CCl4, the serum TBARS was increased while the GSH level was decreased (Table 5), which confirmed the incidence of oxidative stress [37]. Moreover, CCl4 administration produced insulin resistance characterized by an elevation of HOMA-IR, hyperglycemia, hyperinsulinemia, hypercholesterolemia, hypertriglyceridemia, a reduction of HDL, and an elevation of LDL (Table 4) that increased the risk of heart disease [38]. Finally, weight loss (Table 2) was noticed in the CCl4-administred group. This was due to the lack of ghrelin and peptide YY (PYY) that takes place in insulin resistance, which resulted in appetite loss and, consequently, weight loss [39]. Furthermore, CCl4 caused liver toxicity and injury due to CCl3OO’s detrimental effect on the hepatocyte cell membrane, which was characterized by an elevation of serum in all liver function tests (which was characterized by the elevation of serum AST, ALT, ALP, and LDH, which was associated with a reduction of AST/ALT ratio (Table 3)) and the alterations that occurred in the hepatocytes architecture (Figure 4). These data are in agreement with Farzaei et al. [40], who reported that liver that exposes to sever oxidative stress undergoes apoptosis, which is associated with the elevation of serum liver function tests. It is well known that AST is located in the hepatocytes cytosol and mitochondria, while ALT is found only in cytosol during hepatic lesions that occurs when to a stimulant that affects the cell membrane only likes CCl4. Therefore, the AST/ALT ratio is decreased compared to the normal range [41]. Moreover, CCl4 increased hepatic hyaluronidase and acetaldehyde, which was associated with high prooxidants (TBARS) and low antioxidants (GSH) (Figure 2). NAFLD is characterized by the fatty acid accumulation in hepatocytes, which induces lipid peroxidation due to mitochondrial-β-oxidation impairment and aggravates liver necro-inflammatory change and fibrosis [42]. Hyaluronidase, which is the catabolic enzyme involved in the degradation of hyaluronic acid and increased as a marker for IR and the extracellular matrix formation during fibrosis, increases in the serum during liver damage. Moreover, hyaluronidase is considered as a very early serum indicator in acute liver injury [43,44]. Acetaldehyde is increased in NAFDL due to the overexpression of alcohol dehydrogenase 4 [45], which consequently deactivates aldehyde dehydrogenase 2 (ADH2), resulting in the accumulation of toxic aldehydes produced from lipid peroxidation. This acculumation is toxic to the mitochondria [40,46].
Due to the overabundance of β -oxidation and the stimulation of lipid peroxidation, ROS production increased and antioxidants decreased, which led to oxidative stress (OS) [5]. In agreement with these findings, our results showed that the lipid accumulation in brain tissue stimulated the induction of CYP 2E1, thereby inducing the production of lipid peroxidation and generating the oxidative stress status (Figure 3).
Mitochondria are responsible for the adenosine triphosphate (ATP) metabolism because they produce ATP through oxidative phosphorylation and degrade ATP through ATPase action. During NAFLD, ATP deficiency occurs due to mitophagy activation [47] and the elevation of ATPase [48]. Consistent with prior research findings, our data revealed that hepatic ATPase was substantially elevated after NAFLD development (Figure 2). Conversely, the enzyme activity was significantly decreased in brain tissue (Figure 3), primarily due to the accumulation of amyloid B [49] and overexpression of CYP2E1 [50] inside the brain tissue due to IR, which directly inhibits the ATPase.
As previously mentioned, IR and NAFDL are complicated brain degeneration disorders similar to AD, which are characterized by AChE and monoamine oxidase (MAO) hyperactivation [51,52]. MAO is significantly associated with the mitochondrial outer membrane and acts as a source [53]. According to our results, the injection of CCl4 increased AChE and MAO activities in serum, liver, and brain (Table 5, Figure 2 and Figure 3, respectively), demonstrating the direct relationship between liver disease and changes in nerve impulses and neurotransmitter levels that affect hepatic stellate cells (HSC). This relationship is associated with the reduction of transforming growth factor-β 1 in order to ameliorate liver fibrosis [54].
The therapeutic potential of medicinal plants as antioxidants in preventing free radical-induced tissue damage has attracted increased attention.
Our results revealed that Calluna extract is rich in phenolic compounds, with the presence of 17 compounds. The most abundant compounds are catechin, gallic, protocatechuic, and sinapic acid (Table 1). These results are in agreement with [55], who found 11 phenolic compounds in Calluna extract, which reflect its antioxidant properties. In addition, [13] illustrated that hydroethanolic Calluna extract is characterized by antioxidant, anti-inflammatory, and antidiabetic properties. Our results proved that the usage of Calluna extract as a prophylactic or therapeutic agent reduced oxidative stress status in the serum, liver, and brain and thus decreased insulin resistance and improved the lipid profile in all tissues. Furthermore, this extract prevents the formation of liver toxicity/fibrosis where serum liver function parameters are normalized, and it also improves mitochondria function by decreasing the hepatic acetaldehyde and ATPase and inhibiting hyaluronidase activity. Finally, Calluna extract acts as an antioxidant and antidiabetic; it normalized the neurotransmitter-catabolizing enzyme AChE and MAO in both liver and brain tissue, indicating its anti-neurodegenerative properties. There are no in vivo data considering Calluna extract in NASH and neurodegenerative disease treatment. However, in their research, [14] proved the anti-AChE properties of Calluna extract. Therefore, we focused on the active compounds in this extract. It was found that patients treated with 600 mg catechin daily for six months had low body mass index, serum lipids, and glucose and had normal liver function profile due to its antioxidant and anti-inflammatory properties [56]. Moreover, catechin acts as an anti-Alzheimer’s compound because it prevents amyloid plaque formation, ROS, and proinflammatory mediators’ formation in the brain tissue of diabetic rats, in addition to decreasing the AChE and MAO activities [57]. Gallic acid, a potent antidiabetic agent and preventer of IR [58], prevents amyloid B formation by inhibiting β-secretase. In addition, gallic acid prevented the formation of brain oxidative stress and neuro-inflammation in a mice-AD model [59]. Sinapic acid, which has antioxidant, hypoglycemic, and hepatoprotective effects [60], has a neuroprotective effect against diabetic inducers injected in brain tissue by preventing brain oxidative stress and inflammation, as well as activating choline acetyltransferase [61].

5. Conclusions

NAFLD progression as a result of prolonged exposure to CCl4 alters the activities of neurotransmitters catabolizing enzymes due to several factors, such as oxidative stress, inflammation, energy loss, and alteration in lipid content in both the liver as well as the brain tissues that trigger mitochondria dysfunction. These factors contribute to an imbalance in brain functions and the progression of neurodegenerative diseases. Calluna extract, which is rich in catechin, gallic acid, and sinapic acid, prevents the development of insulin resistance and, as a result, functions as a hypoglycemic, hypolipidemic, hepatoprotective, and antioxidant agent. This extract inhibits the accumulation of lipids in the liver and brain, thereby preventing mitochondrial β oxidation impairment and the formation of toxic acetaldehyde. In addition, this extract acts as an inhibitor for AChE and MAO; therefore, it can be a promising candidate for the treatment of dementia.

Funding

This work received no external funding.

Institutional Review Board Statement

The animal experiments approval number was 31-1Z-1120, which was taken from the Institutional Animal Care and Use Committees (IACUCs) of the Pharmaceutical and Fermentation Industries Development Center, Scientific Research and Technological Application City.

Informed Consent Statement

Not applicable.

Data Availability Statement

Data are available with author upon request.

Conflicts of Interest

The authors declare no conflict of interest.

Abbreviations

BBB, blood–brain barrier, BGL; blood glucose level, COX-2; Cyclooxygenase 2, CV; Calluna vulgaris, FFA; Free fatty acids, GSH; Glutathione, HDL; High-density lipoprotein, iNOS; inducible Nitric oxide synthase, IR; Insulin receptor, LDL; Low-density lipoprotein, LOX; Lipoxygenase, NAFLD; Nonalcoholic FL disease, NASH; Nonalcoholic steatohepatitis, NF-kβ; Nuclear factor kappa-β, Nrf2; Nuclear factor erythroid 2-related factor 2, OXPHOS; Oxidative phosphorylation, ROS; Reactive oxygen species, TCA; Tricarboxylic acid, TG; Triglycerides, TNF- α-Tumor necrosis factor-α, TNF-α; Tumor necrosis Factor alpha, vLDL; very low-density lipoprotein.

References

  1. Powell, E.E.; Wong, V.W.S.; Rinella, M. Non-alcoholic fatty liver disease. Lancet 2021, 397, 2212–2224. [Google Scholar] [CrossRef] [PubMed]
  2. Angulo, P. GI epidemiology: Nonalcoholic fatty liver disease: Incidence and prevalence. Aliment. Pharmacol. Ther. 2007, 25, 883–889. [Google Scholar] [CrossRef] [PubMed]
  3. Than, N.N.; Newsome, P.N. A concise review of non-alcoholic fatty liver disease. Atherosclerosis 2015, 239, 192–202. [Google Scholar] [CrossRef] [PubMed] [Green Version]
  4. Biessels, G.J.; Deary, I.J.; Ryan, C. Cognition and diabetes: A lifespan perspective. Lancet Neurol. 2008, 7, 184–190. [Google Scholar] [CrossRef]
  5. Kouvari, M.; Sergi, D.; D’Cunha, N.M.; Bulman, A.; Panagiotakos, D.B.; Naumovski, N. Is Non-Alcoholic Fatty Liver Disease Connected with Cognition? The Complex Interplay between Liver and Brain. Diabetology 2022, 3, 355–363. [Google Scholar] [CrossRef]
  6. Milstein, J.L.; Ferris, H.A. The brain as an insulin-sensitive metabolic organ. Mol. Metab. 2021, 52, 101234. [Google Scholar] [CrossRef]
  7. Dutta, B.J.; Singh, S.; Seksaria, S.; Gupta, G.D. Inside the diabetic brain: Insulin resistance and molecular mechanism associated with cognitive impairment and its possible therapeutic strategies. Pharmacol. Res. 2022, 182, 106358. [Google Scholar] [CrossRef]
  8. Liddell, J.R.; Hoepken, H.H.; Crack, P.J.; Robinson, S.R.; Dringen, R. Glutathione peroxidase 1 and glutathione are required to protect mouse astrocytes from iron-mediated hydrogen peroxide toxicity. J. Neurosci. Res. 2006, 84, 578–586. [Google Scholar] [CrossRef]
  9. Carvalho, C.; Cardoso, S. Diabetes–Alzheimer’s Disease Link: Targeting Mitochondrial Dysfunction and Redox Imbalance. Antioxid. Redox Signal. 2020, 34, 631–649. [Google Scholar] [CrossRef] [Green Version]
  10. Abenavoli, L.; Larussa, T.; Corea, A.; Procopio, A.; Boccuto, L.; Dallio, M.; Federico, A.; Luzza, F. Dietary polyphenols and non-alcoholic fatty liver disease. Nutrients 2021, 13, 494. [Google Scholar] [CrossRef]
  11. Bayram, H.; Majoo, F.; Ozturkcan, A. Polyphenols in the prevention and treatment of non-alcoholic fatty liver disease: An update of preclinical and clinical studies. Clin. Nutr. ESPEN 2021, 44, 1–14. [Google Scholar] [CrossRef] [PubMed]
  12. Filip, G.A.; Postescu, D.; Tatomir, C.; Muresan, A.; Clichici, S. Calluna vulgaris extract modulates NF-κB/ERK signaling pathway and matrix metalloproteinase expression in SKH-1 hairless mice skin exposed to ultraviolet B irradiation. J. Physiol. Pharmacol. 2012, 63, 423–432. [Google Scholar] [PubMed]
  13. Starchenko, G.; Hrytsyk, A.; Raal, A.; Koshovyi, O. Phytochemical profile and pharmacological activities of water and hydroethanolic dry extracts of Calluna vulgaris (L.) Hull. Herb. Plants 2020, 9, 751. [Google Scholar] [CrossRef] [PubMed]
  14. Ghareeb, D.A.; ElAhwany, A.M.; El-Mallawany, S.M.; Saif, A.A. In vitro screening for anti-acetylcholiesterase, anti-oxidant, anti-glucosidase, anti-inflammatory and anti-bacterial effect of three traditional medicinal plants. Biotechnol. Biotechnol. Equip. 2014, 28, 1155–1164. [Google Scholar] [CrossRef] [Green Version]
  15. Ismail, N.; Ghareeb, D.; El- Sohaimy, S.; EL-Demellawy, M.; El-Saied, M. Evaluation of the anti-Fusarium effect of Cinnamoum zeilanicum, Berberise vulgaris and Caluna vulgaris ethanolic extracts. Int. J. Cancer Biomed. Res. 2020, 4, 143–150. [Google Scholar] [CrossRef]
  16. Abdel-Latif, M.; Hegazy, A.; Khalil, S.; Ghareeb, D. Prophylactic effect of herbal extracts on LPS-induced inflammatory response in rat hepatocytes. Int. J. Phytomed. 2017, 9, 20–28. [Google Scholar]
  17. Orhan, I.; Küpeli, E.; Terzioğlu, S.; Yesilada, E. Bioassay-guided isolation of kaempferol-3-O-β-d-galactoside with anti-inflammatory and antinociceptive activity from the aerial part of Calluna vulgaris L. J. Ethnopharmacol. 2007, 114, 32–37. [Google Scholar] [CrossRef]
  18. Burncoose Nurseries. HEATHERS Calluna. Available online: https://www.burncoose.co.uk/site/plants.cfm?pl_id=650 (accessed on 6 January 2020).
  19. US National Plant Germplasm System. Calluna vulgaris (L.) Hull. Available online: https://npgsweb.ars-grin.gov/gringlobal/taxon/taxonomydetail?id=8605 (accessed on 6 January 2020).
  20. Slinkard, K.; Singleton, V.L. Total phenol analysis: Automation and comparison with manual methods. Am. J. Enol. Vitic. 1977, 28, 49–55. [Google Scholar] [CrossRef]
  21. Kim, K.H.; Tsao, R.; Yang, R.; Cui, S.W. Phenolic acid profiles and antioxidant activities of wheat bran extracts and the effect of hydrolysis conditions. Food Chem. 2006, 95, 466–473. [Google Scholar] [CrossRef]
  22. Tomah, S.; Hamdy, O.; Abuelmagd, M.; Hassan, A.; Alkhouri, N.; Al-Badri, M.; Gardner, H.; Eldib, A.; Eid, A. Prevalence of and risk factors for non-alcoholic fatty liver disease (NAFLD) and fibrosis among young adults in Egypt. BMJ Open Gastroenterol. 2021, 8, e000780. [Google Scholar] [CrossRef]
  23. EL Tallawy, H.; Farghaly, W.; El Hamed, M.; Badry, R.; Usama, K.; Shehata, G.; Tohmy, A.; Abdulghani, K.; Ghanem, M.; Sayed, M.; et al. Prevalence of Alzheimer dementia in Upper Egypt (desert areas). Egypt. J. Neurol. Psychiatry Neurosurg. 2019, 55, 29. [Google Scholar] [CrossRef]
  24. Ghareeb, D.; Hussen, H. Vanadium improves brain acetylcholinesterase activity on early stage alloxan-diabetic rats. Neurosci. Lett. 2008, 436, 44–47. [Google Scholar] [CrossRef] [PubMed]
  25. Łukaszewicz-Hussain, A.; Moniuszko-Jakoniuk, J.; Rogalska, J. Assessment of lipid peroxidation in rat tissues in subacute chlorfenvinphos administration. Pol. J. Environ. Stud. 2007, 16, 233–236. [Google Scholar]
  26. Jollow, D.; Mitchell, J.; Zampaglione, N.; Gillette, J. Bromobenze induced liver necrosis: Protective role of glutathione and evidence for 3, 4-bromobenzenoxide as the hepatotoxic intermediate. Pharmacology 1974, 11, 151–169. [Google Scholar] [CrossRef]
  27. Stroev, E.; Makarova, V. Carbohydrate metabolism. In Laboratory Manual in Biochemistry; Mir Publishers: Moscow, Russia, 1989; pp. 144–146. [Google Scholar]
  28. Leaback, D.; Walker, P. On the Morgan-elson reaction. Biochim. Biophys. Acta 1963, 74, 297–300. [Google Scholar]
  29. Ellman, G.; Courtney, K.; Andres, V.; Featherstone, R. A new and rapid colorimetric determination of acetylcholinesterase activity. Biochem. Pharmacol. 1961, 7, 88–95. [Google Scholar] [CrossRef]
  30. Sandler, M.; Reveley, M.; Glover, V. Human platelet monoamine oxidase activity in health and disease: A review. J. Clin. Pathol. 1981, 34, 292–302. [Google Scholar] [CrossRef]
  31. Litwack, G.; Bothwell, J.W.; Williams, J.N.; Elvehjem, J. A colorimetric assay for xanthine oxidase in rat liver homogenates. J. Biol. Chem. 1953, 200, 303–310. [Google Scholar] [CrossRef]
  32. Bancroft, D.; Gamble, M. Theory and Practice of Histological Techniques; Elsevier Health Sciences: London UK, 2008. [Google Scholar]
  33. Malik, A.; Arooj, M.; Butt, T.; Zahid, S.; Zahid, F.; Jafar, T.; Waquar, S.; Gan, S.; Ahmad, S.; Mirza, M. n silico and in vivo characterization of cabralealactone, solasodin and salvadorin in a rat model: Potential anti-inflammatory agents. Drug Des. Dev. Ther. 2018, 12, 1431. [Google Scholar] [CrossRef] [Green Version]
  34. Godoy-Matos, A.; Silva Júnior, W.; Valerio, C. NAFLD as a continuum: From obesity to metabolic syndrome and diabetes. Diabetol. Metab. Syndr. 2020, 12, 60–79. [Google Scholar] [CrossRef]
  35. Maciejczyk, M.; Żebrowska, E.; Chabowski, A. Insulin resistance and oxidative stress in the brain: What’s new? Int. J. Mol. Sci. 2019, 20, 874. [Google Scholar] [CrossRef] [PubMed] [Green Version]
  36. Nguyen, T.; Ta, Q.; Nguyen, T.; Nguyen, T.; Giau, V. Type 3 Diabetes and Its Role Implications in Alzheimer’s Disease. Int. J. Mol. Sci. 2020, 21, 3165. [Google Scholar] [CrossRef] [PubMed]
  37. Li, R.; Yang, W.; Yin, Y.; Zhang, P.; Tao, K. 4-OI attenuates carbon tetrachloride-induced hepatic injury via regulating oxidative stress and the inflammatory response. Front. Pharmacol. 2021, 12, 1238–1250. [Google Scholar] [CrossRef]
  38. Ormazabal, V.; Nair, S.; Elfeky, O.; Aguuayo, C.; Salomon, C.; Zuniga, F. Association between insulin resistance and the development of cardiovascular disease. Cardiovasc. Diabetol. 2018, 17, 122. [Google Scholar] [CrossRef] [Green Version]
  39. Ouerghi, N.; Feki, M.; Bragazzi, N.L.; Knechtle, B.; Hill, L.; Nikolaidis, P.T.; Bouassida, A. Ghrelin Response to Acute and Chronic Exercise: Insights and Implications from a Systematic Review of the Literature. Sport. Med. 2021, 51, 2389–2410. [Google Scholar] [CrossRef]
  40. Farzaei, M.; Zobeiri, M.; Parvizi, F.; El-Senduny, F.; Marmouzi, I.; Coy-Barrera, E.; Naseri, R.; Nabavi, S.; Rahimi, R.; Abdollahi, M. Curcumin in liver diseases: A systematic review of the cellular mechanisms of oxidative stress and clinical perspective. Nutrients 2018, 10, 855. [Google Scholar] [CrossRef] [PubMed] [Green Version]
  41. Ozaki, E.; Ochiai, H.; Shirasawa, T.; Yoshimoto, T.; Nagahama, S.; Muramatsu, J.; Chono, T.; Ito, T.; Inoue, H.; Kokaze, A. Eating quickly is associated with a low aspartate aminotransferase to alanine aminotransferase ratio in middle-aged adults: A large-scale cross-sectional survey in Japan. Arch. Public Health 2020, 78, 101. [Google Scholar] [CrossRef]
  42. Ma, Y.; Lee, G.; Heo, S.Y.; Roh, Y.S. Oxidative stress is a key modulator in the development of nonalcoholic fatty liver disease. Antioxidants 2021, 11, 91. [Google Scholar] [CrossRef]
  43. Kang, L.; Lantier, L.; Kennedy, A.; Bonner, J.; Mayes, W.; Bracy, D.; Bookbinder, L.; Hasty, A.; Thompson, C.; Wasserman, D. Hyaluronan Accumulates with High-Fat Feeding and. Diabetes 2013, 62, 1888–1896. [Google Scholar] [CrossRef] [Green Version]
  44. Chajara, A.; Raoudi, M.; Delpech, B.; Delpech, M.; Basuyau, J.; Levesque, H. Increased hyaluronan and hyaluronidase production and hyaluronan degradation in injured aorta of insulin-resistant rats. Arterioscler. Thromb. Vasc. 2000, 20, 1480–1487. [Google Scholar] [CrossRef] [Green Version]
  45. de Medeiros, I.; de Lima, G. s nonalcoholic fatty liver disease an endogenous alcoholic fatty liver disease?–A mechanistic hypothesis. Med. Hypotheses 2015, 85, 148–152. [Google Scholar] [CrossRef] [PubMed]
  46. Anderson, E.; Katunga, L.; Willis, M. itochondria as a source and target of lipid peroxidation products in healthy and diseased heart. Clin. Exp. Pharmacol. Physiol. 2012, 39, 179–193. [Google Scholar] [CrossRef] [PubMed] [Green Version]
  47. Lee, K.; Haddad, A.; Osme, A.; Kim, C.; Borzou, A.; Ilchenko, S.; Allende, D.; Dasarathy, S.; McCullough, A.; Sadygov, R.G.; et al. Hepatic mitochondrial defects in a nonalcoholic fatty liver disease mouse model are associated with increased degradation of oxidative phosphorylation subunits. Mol. Cell. Proteom. 2018, 17, 2371–2386. [Google Scholar] [CrossRef]
  48. Onishi, M.; Yamano, K.; Sato, M.; Matsuda, N.; Okamoto, K. Molecular mechanisms and physiological functions of mitophagy. EMBO J. 2021, 40, e104705. [Google Scholar] [CrossRef]
  49. Vives-Bauza, C.; Gonzalo, R.; Manfredi, G.; Garcia-Arumi, E.; Andreu, A. Enhanced ROS production and antioxidant defenses in cybrids harbouring mutations in mtDNA. Neurosci. Lett. 2006, 391, 136–141. [Google Scholar] [CrossRef]
  50. Caro, A.; Evans, L.; Cederbaum, I. CYP2E1 overexpression inhibits microsomal Ca2+−ATPase activity in HepG2 cells. Toxicology 2009, 255, 171–176. [Google Scholar] [CrossRef] [Green Version]
  51. Ghareeb; Hafez, H.; Hussien, H.; Kabapy, N. Non-alcoholic fatty liver induces insulin resistance and metabolic disorders with development of brain damage and dysfunction. Metab. Brain Dis. 2011, 26, 253–267. [Google Scholar] [CrossRef] [PubMed]
  52. Colognesi, M.; Gabbia, D.; De Martin, S. Depression and cognitive impairment—Extrahepatic manifestations of NAFLD and NASH. Biomedicines 2020, 8, 229. [Google Scholar] [CrossRef] [PubMed]
  53. Manzella, N.; Santin, Y.; Maggiorani, D.; Martini, H.; Douin-Echinard, V.; Passos, J.; Lezoualc’h, F.; Binda, C.; Parini, A.; Mialet-Perez, J. Monoamine oxidase-A is a novel driver of stress-induced premature senescence through inhibition of parkin-mediated mitophagy. Aging Cell 2018, 17, e12811. [Google Scholar] [CrossRef] [PubMed] [Green Version]
  54. Fong, G.; Backman, L.; Alfredson, H.; Scott, A.; Danielson, P. The effects of substance P and acetylcholine on human tenocyte proliferation converge mechanistically via TGF-β1. PLoS ONE 2017, 12, e0174101. [Google Scholar] [CrossRef] [Green Version]
  55. Bekkai, D.; Oulad El Majdoub, Y.; Bekkai, H.; Cacciola, F.; Miceli, N.; Taviano, M.; Cavò, E.; Errabii, T.; Vinci, R.; Mondello, L.; et al. Determination of the Phenolic Profile by Liquid Chromatography, Evaluation of Antioxidant Activity and Toxicity of Moroccan Erica multiflora, Erica scoparia, and Calluna vulgaris (Ericaceae). Molecules 2022, 27, 3979. [Google Scholar] [CrossRef]
  56. Fukuzawa, Y.; Kapoor, M.; Yamasaki, K.; Okubo, T.; Hotta, Y.; Juneja, L. Effects of green tea catechins on nonalcoholic steatohepatitis (NASH) patients. J. Funct. Foods 2014, 9, 48–59. [Google Scholar] [CrossRef]
  57. Ide, K.; Matsuoka, N.; Yamada, H.; Furushima, D.; Kawakami, K. Effects of tea catechins on Alzheimer’s disease: Recent updates and perspectives. Molecules 2018, 23, 2357. [Google Scholar] [CrossRef] [PubMed]
  58. Huang, D.W.; Chang, W.C.; Wu JS, B.; Shih, R.W.; Shen, S.C. Gallic acid ameliorates hyperglycemia and improves hepatic carbohydrate metabolism in rats fed a high-fructose diet. Nutr. Res. 2016, 36, 150–160. [Google Scholar] [CrossRef] [PubMed]
  59. Mori, T.; Koyama, N.; Yokoo, T.; Segawa, T.; Maeda, M.; Sawmiller, D.; Tan, J.; Town, T. Gallic acid is a dual α/β-secretase modulator that reverses cognitive impairment and remediates pathology in Alzheimer mice. J. Biol. Chem. 2020, 295, 16251–16266. [Google Scholar] [CrossRef] [PubMed]
  60. Zych, M.; Kaczmarczyk-Sedlak, I.; Wojnar, W.; Folwarczna, J. The effects of sinapic acid on the development of metabolic disorders induced by estrogen deficiency in rats. Oxidative Med. Cell. Longev. 2018, 2018, 9274246. [Google Scholar] [CrossRef] [Green Version]
  61. Verma, V.; Singh, D. Sinapic acid alleviates oxidative stress and neuro-inflammatory changes in sporadic model of Alzheimer’s disease in rats. Brain Sci. 2020, 10, 923. [Google Scholar] [CrossRef] [PubMed]
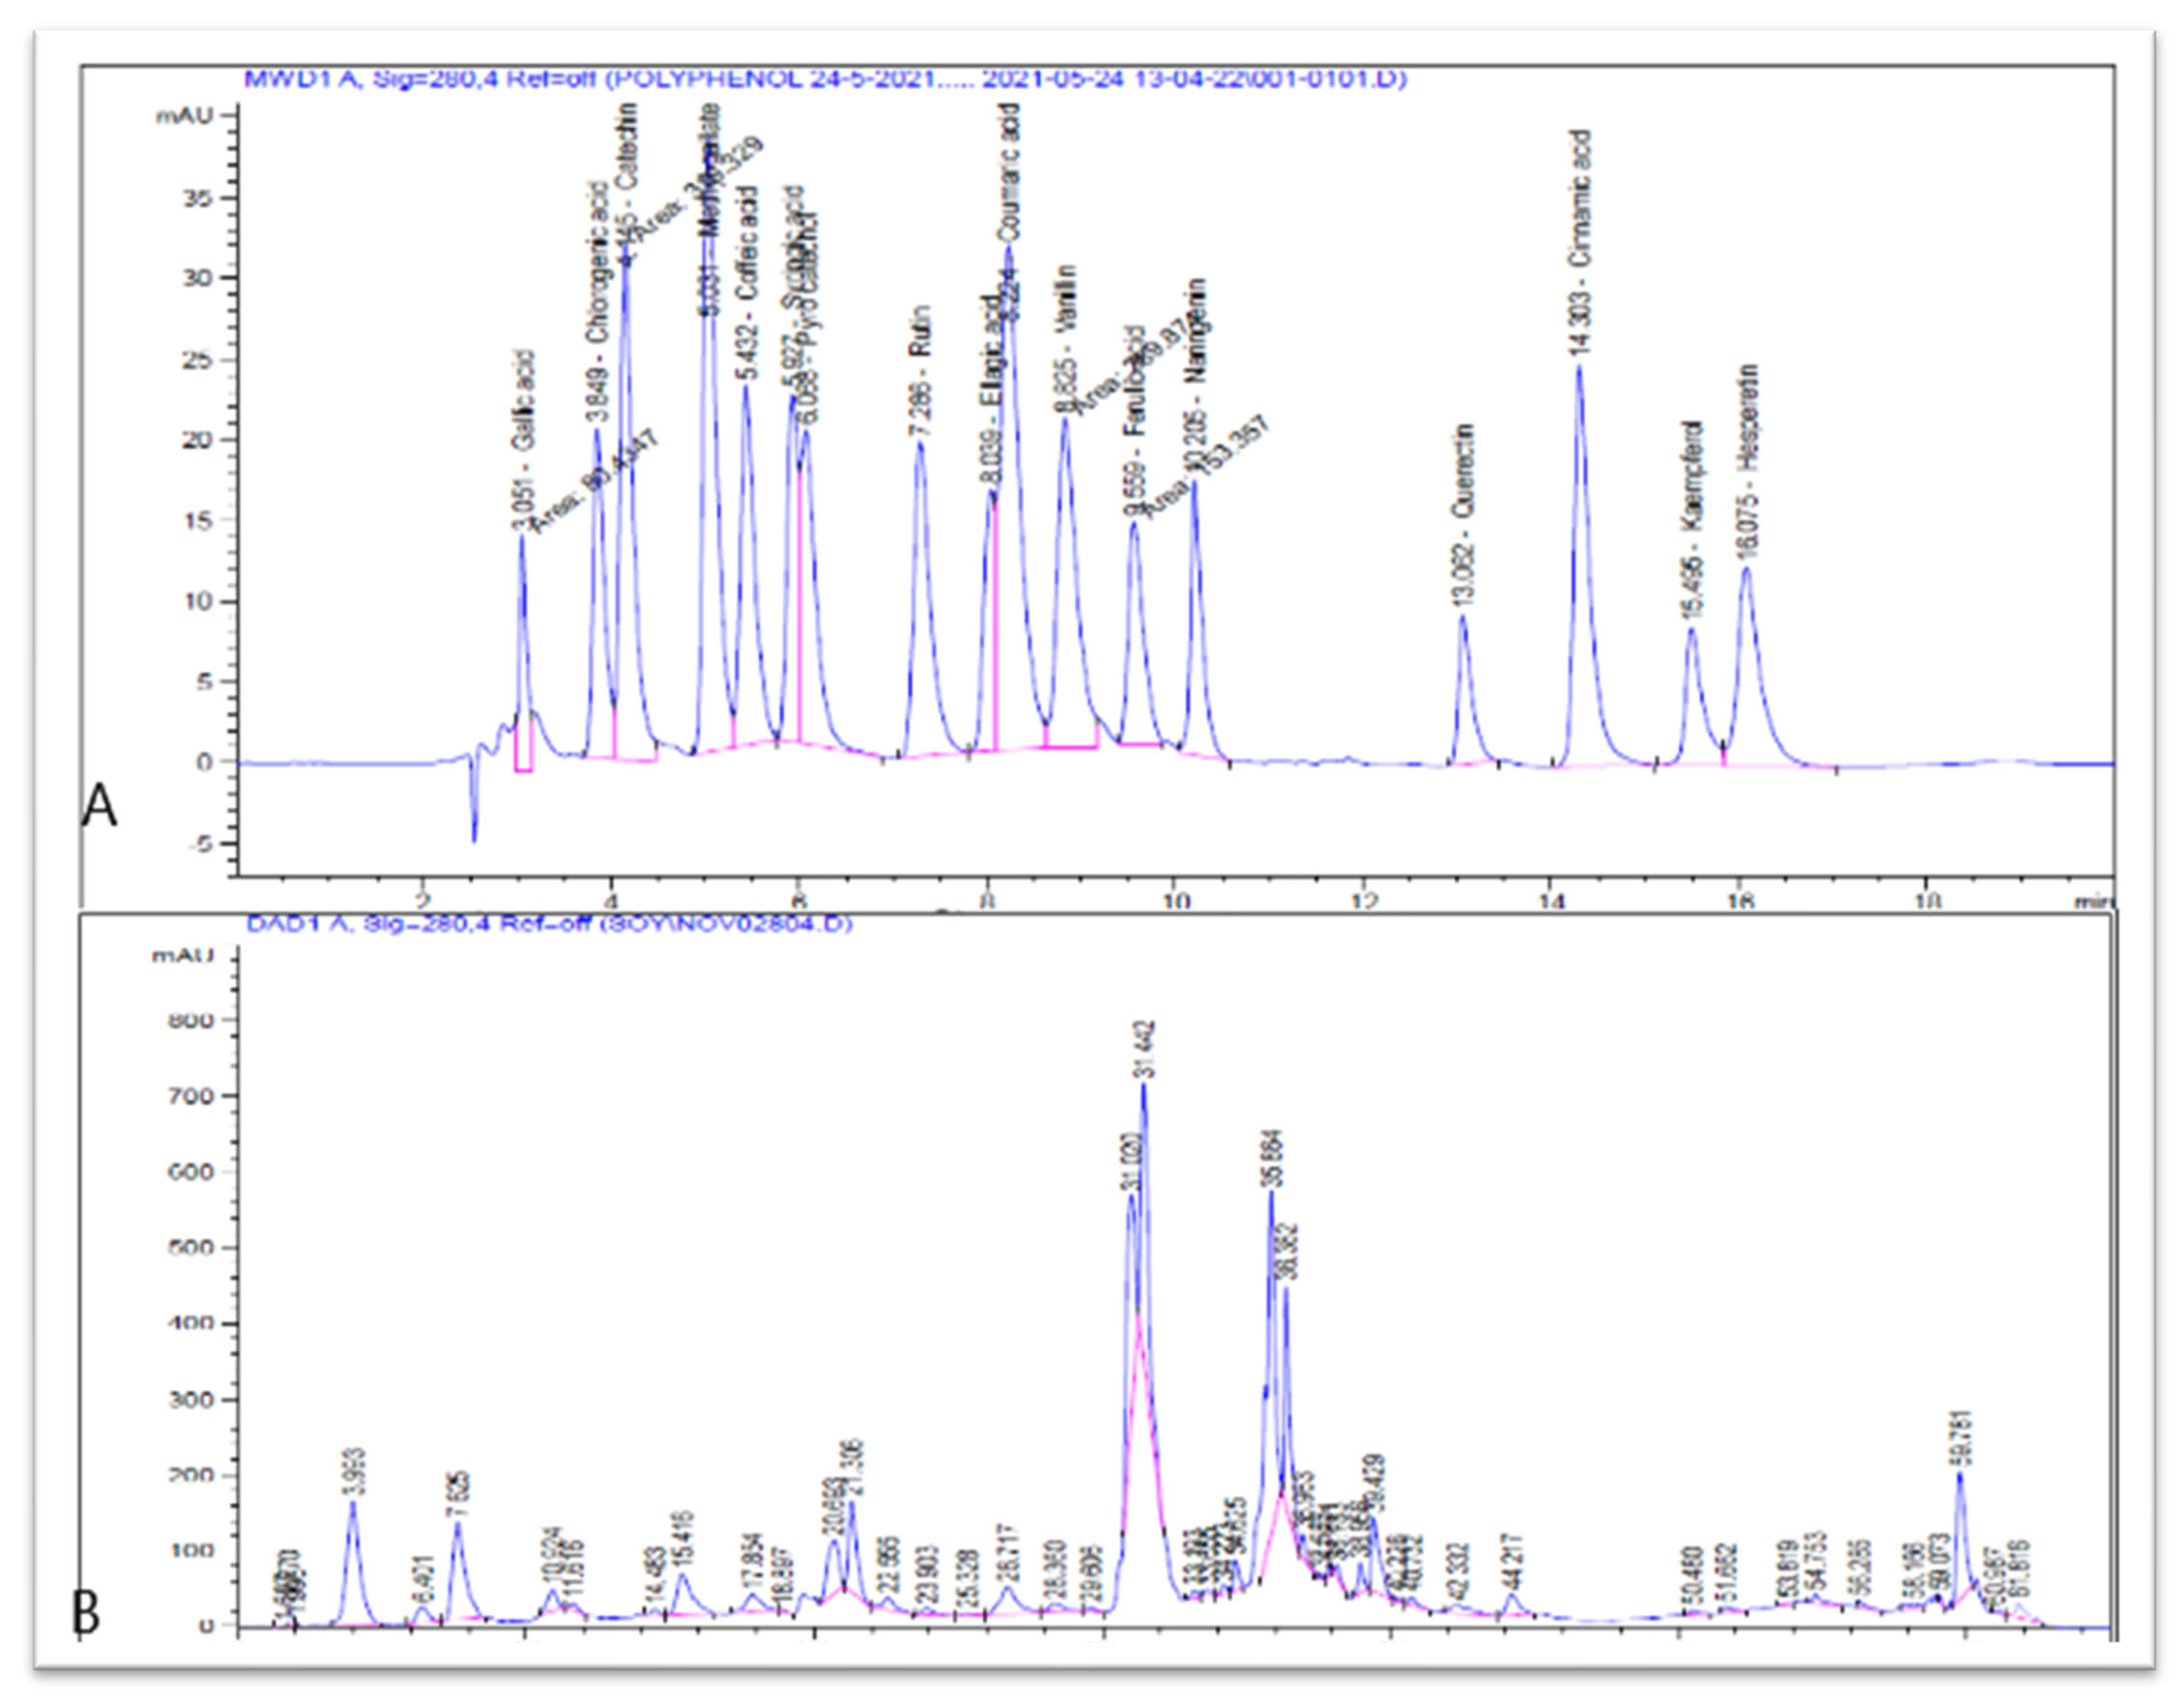
Figure 1. The chromatograms of (A) standard phenolic compounds and (B) CV crude extract.
Separations 10 00094 g001
Figure 2. Effect of different treatments on hepatic protein, energy-producing markers (acetaldehyde and ATPase), oxidative stress markers (TBARS and GSH), neurotransmitter catabolizing enzymes (AChE and MAO), and fibrotic marker (hyaluronidase). Data are represented as M±SD. For each parameter, means with different letters are significantly different at p < 0.05. The mean with the letter (a) is the smallest, followed by b, c, etc. * is multiplication sign.
Separations 10 00094 g002
Figure 3. Effect of different treatments on brain protein, glucose, insulin, TG, cholesterol, energy-producing markers (acetaldehyde and ATPase), oxidative stress markers (TBARS and GSH), neurotransmitter-catabolizing enzymes (AChE and MAO), and fibrotic marker (hyaluronidase). Data are represented as M ± SD. For each parameter, means with different letters are significantly different at p < 0.05. The mean with the letter (a) is the smallest, followed by b, c, etc. * is multiplication sign.
Separations 10 00094 g003
Figure 4. Histopathological changes in female rats stained with hematoxylin and eosin liver tissue samples under magnification 40X. (A) Sham control, (B), vehicle control, (C,D) induction group, (E) protection group, and finally, (F) treatment group. Cv: central vein, S: sinusoids, arrows: vacuolated nuclei.
Separations 10 00094 g004
Table 1. Total phenolic content and different phenolic compounds of Calluna extract.
Phenolic Compound Nameµg/g ExtractMonoisotopic (Da)Theoretical m/z (Da)Error of the Calculation (ppm)
Total Phenolic Content 135.6 ± 2.563ChemSpider WebpageWARWICK/Chemistry Webpage
Apigenin-7-glucoside0.145 ± 0.002432.105652432.106195−1.256636
Cateachin5.501 ± 0.056290.079041290.079587−1.88
Chlorogenic1.593 ± 0.003354.095093354.095631−1.52
Chrysin1.835 ± 0.123254.057907254.058457−2.164856
Cinnamic acid0.625 ± 0.056148.052429148.052978−3.708132
Ferulic acid0.101 ± 0.003194.057907194.058457−2.83
Gallic acid3.525 ± 0.143170.021530170.022072−3.19
Kaempferol0.044 ± 0.001286.047729286.048287−1.950720
p- hydroxybenzoic acid1.136 ± 0.093138.031693138.032243−3.984576
p-coumaric acid1.751 ± 0.081164.047348164.047893−3.322201
Protocatechuic acid2.719 ± 0.132154.026611154.027157−3.544829
Quercetin0.105 ± 0.003302.042664302.043201−1.777891
Rosmarinic acid0.392 ± 0.004360.084503360.085066−1.563519
Rutin0.858 ± 0.002610.153381610.153933−0.9
Sinapic acid9.365 ± 0.873224.068466224.069022−2.481378
Syringic acid0.682 ± 0.005198.052826198.053372−2.76
Vanillic acis0.246 ± 0.002152.047348152.047893−3.58
Note: The Monoisotopic mass for each compound was obtained from https://www.chemspider.com/, accessed on, while the theoretical mass and error were calculated from https://warwick.ac.uk/fac/sci/chemistry/research/barrow/barrowgroup/calculators/mass_errors/, accessed on 6 January 2023.
Table 2. The effect of different treatments on body weight gain and liver or brain-to-body mass percentage.
GroupsBody Weight Percentage Gain (%)% of LIVER to Body Mass% of Brain to Body Mass
Sham Control32.6 ± 3.2 b5.4 ± 0.4 b1.25 ± 0.12 b
Vehicle control37.5 ± 1.6 b3.9 ± 0.3 a0.87 ± 0.08 a
Induction24.5 ± 3.9 a3.6 ± 0.25 a0.81 ± 0.07 a
Protection32.7 ± 3.6 b4.9 ± 0.34 b1.05 ± 0.09 b
Treatment23.5 ± 3.5 a3.5 ± 0.35 a0.99 ± 0.09 ab
p Value0.00
Data are represented as M ± SD. Within the column, means with different letters significantly differ at p < 0.05. Mean with the letter (a) is the smallest, followed by b, c, etc.
Table 3. Effect of different treatments on the liver function parameters.
GroupsALT (U/l)AST (U/l)AST/ALTALP (U/l)LDH (U/l)Protein (g/dL)
Sham Control142.3 ± 4.42 ab245.4 ± 2.47 a1.72 ± 0.08 b112.9 ± 1.27 b144.1 ± 2.40 b8.2 ± 0.53 b
Vehicle control135.4 ± 8.01 a250.4 ± 4.26 a1.84 ± 0.06 b92.81 ± 2.84 a123.3 ± 7.23 a7.9 ± 0.41 a
Induction 260.3 ± 7.76 c350.3 ± 2.98 b1.34 ± 0.02 a220.9 ± 2.20 c345.2 ± 6.23 c9.9 ± 0.21 c
Protection 145.9 ± 5.54 b262.6 ± 10.51 a1.80 ± 0.01 b108.2 ± 1.13 b118.4 ± 3.17 a7.7 ± 0.31 a
Treatment 149.6 ± 1.56 b254.1 ± 11.64 a1.7 ± 0.07 b109.9 ± 3.68 b144.9 ± 10.42 b8.1 ± 0.41 b
p Value0.000 *0.014 0.005 0.000 0.000 0.000
Data are represented as M ± SD. Within the column, means with different letters are significantly different at p < 0.05. The mean with the letter (a) is the smallest, followed by b, c, etc.
Table 4. Effect of different treatments on the serum diabetic profile.
GroupsGlucose
(mg/dL)
Insulin
(µIU/mL)
HOMA-IRTG
(mg/dL)
Cholesterol (mg/dL)HDL
(mg/dL)
LDL
(mg/dL)
VLDL
(mg/dL)
Sham Control62.04 ± 6.46 a6.93 ± 0.45 a1.1 ± 0.01 a114.90 ± 4.04 a114.38 ± 0.47 a41.12 ± 0.59 b50.28 ± 0.93 a22.98 ± 0.8 a
Vehicle control65.64 ± 3.81 a6.79 ± 0.53 a1.1 ± 0.02 a109.31 ± 9.00 a118.50 ± 6.16 a39.87 ± 3.10 b56.77 ± 3.26 a21.86 ± 1.80 a
Induction 220.5 ± 1.53 c10.76 ± 0.33 c5.9 ± 0.03 d255.84 ± 9.50 d238.86 ± 6.98 c25.47 ± 3.92 a167.21 ± 1.16 c45.32 ± 1.90 c
Protection 90.68 ± 2.56 b8.03 ± 0.26 b1.8 ± 0.02 b136.29 ± 8.25 c136.37 ± 0.62 b44.12 ± 2.75 c64.81 ± 3.78 b27.53 ± 1.65 b
Treatment 89.33 ± 1.59 b8.40 ± 0.10 b1.9 ± 0.04 c126.73 ± 1.98 b132.76 ± 2.51 b44.17 ± 1.67 c64.24 ± 1.6 b25.35 ± 0.40 b
p Value0.0000.0000.000 0.000 0.000 0.000 0.000 0.000
Data are represented as M ± SD. Within the column, means with different letters are significantly different at p < 0.05. The mean with the letter (a) is the smallest, followed by b, c, etc.
Table 5. Effect of different treatments on serum oxidative stress marker (TBARS and GSH), neurotransmitter-catabolizing enzyme (AChE and MAO), and ATPase activities.
GroupsTBARS nmol/mLGSH
mg/dL
AChE
IU/mg
MAO
IU/mg
ATPase
IU/mg
Sham Control8.30 ± 1.11 a5.92 ± 0.38 b2.58 ± 0. 3 a1.85 ± 0.18 b0.15 ± 0.02 a
Vehicle control8.36 ± 1.87 a5.61 ± 0.35 b2.62 ± 0.94 a1.79 ± 0.14 b0.14 ± 0.01 a
Induction 16.29 ± 2.96 c3.78 ± 1.02 a4.79 ± 0.14 b1.14 ± 0.12 a0.14 ± 0.02 a
Protection 10.55 ± 0.92 b5.52 ± 0.29 b2.60 ± 0.34 a1.81 ± 0.18 b0.16 ± 0.01 a
Treatment 9.78 ± 0.30 b5.33 ± 0.39 b2.90 ± 0.64 a1.78 ± 0.12 b0.15 ± 0.01 a
p Value0.000 0.000 0.0010.000 0.150
Data are represented as M ± SD. Within the column, means with different letters are significantly different at p < 0.05. Mean with the letter (a) is the smallest, followed by b, c, etc.
Disclaimer/Publisher’s Note: The statements, opinions and data contained in all publications are solely those of the individual author(s) and contributor(s) and not of MDPI and/or the editor(s). MDPI and/or the editor(s) disclaim responsibility for any injury to people or property resulting from any ideas, methods, instructions or products referred to in the content.