
Application of the Fourier Transform to Improve the Accuracy of Gamma-Based Volume Percentage Detection System Independent of Scale Thickness

 , , , , and
Abstract
:1. Introduction
- Enhancing the accuracy of the detecting mechanism.
- Conducting volumetric fraction measurements of a three-phase flow as it traveled through a scale-lined oil pipe.
- Analyzing the efficiency of the frequency characteristics in determining the volume percentages.
- Aggregating helpful characteristics to significantly reduce the computational load.
2. Materials and Methods
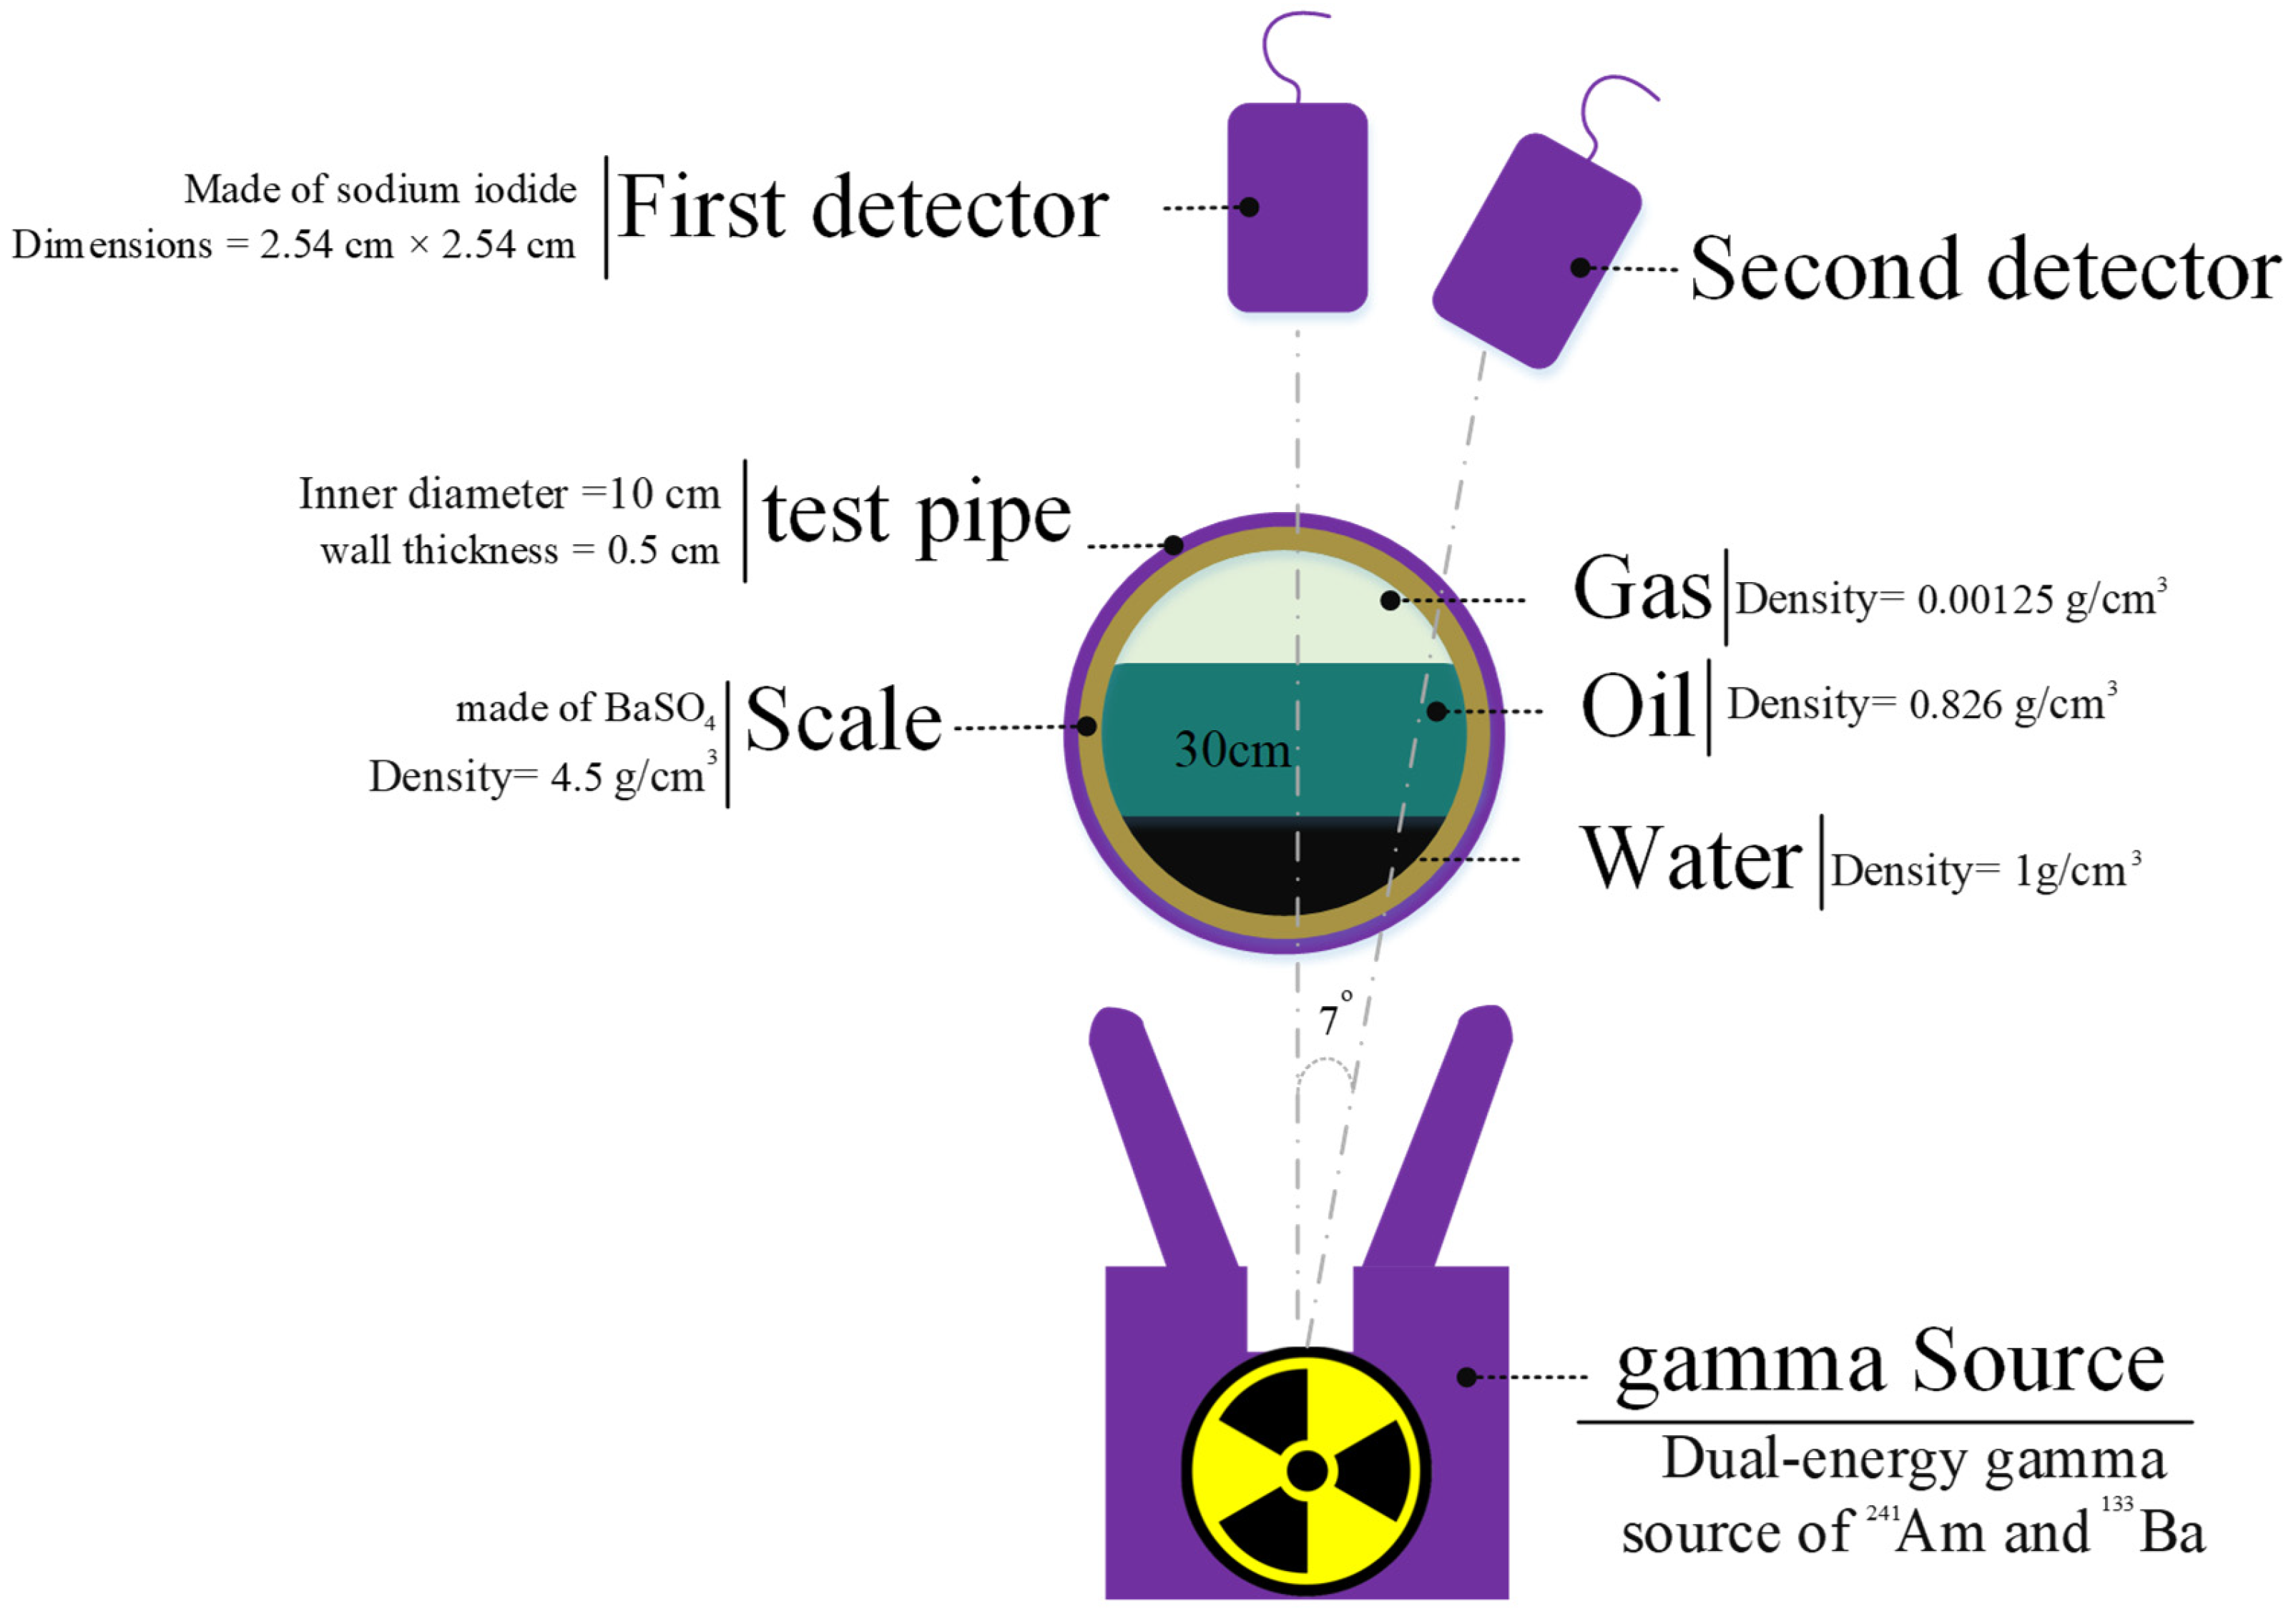
2.1. Simulation Setup
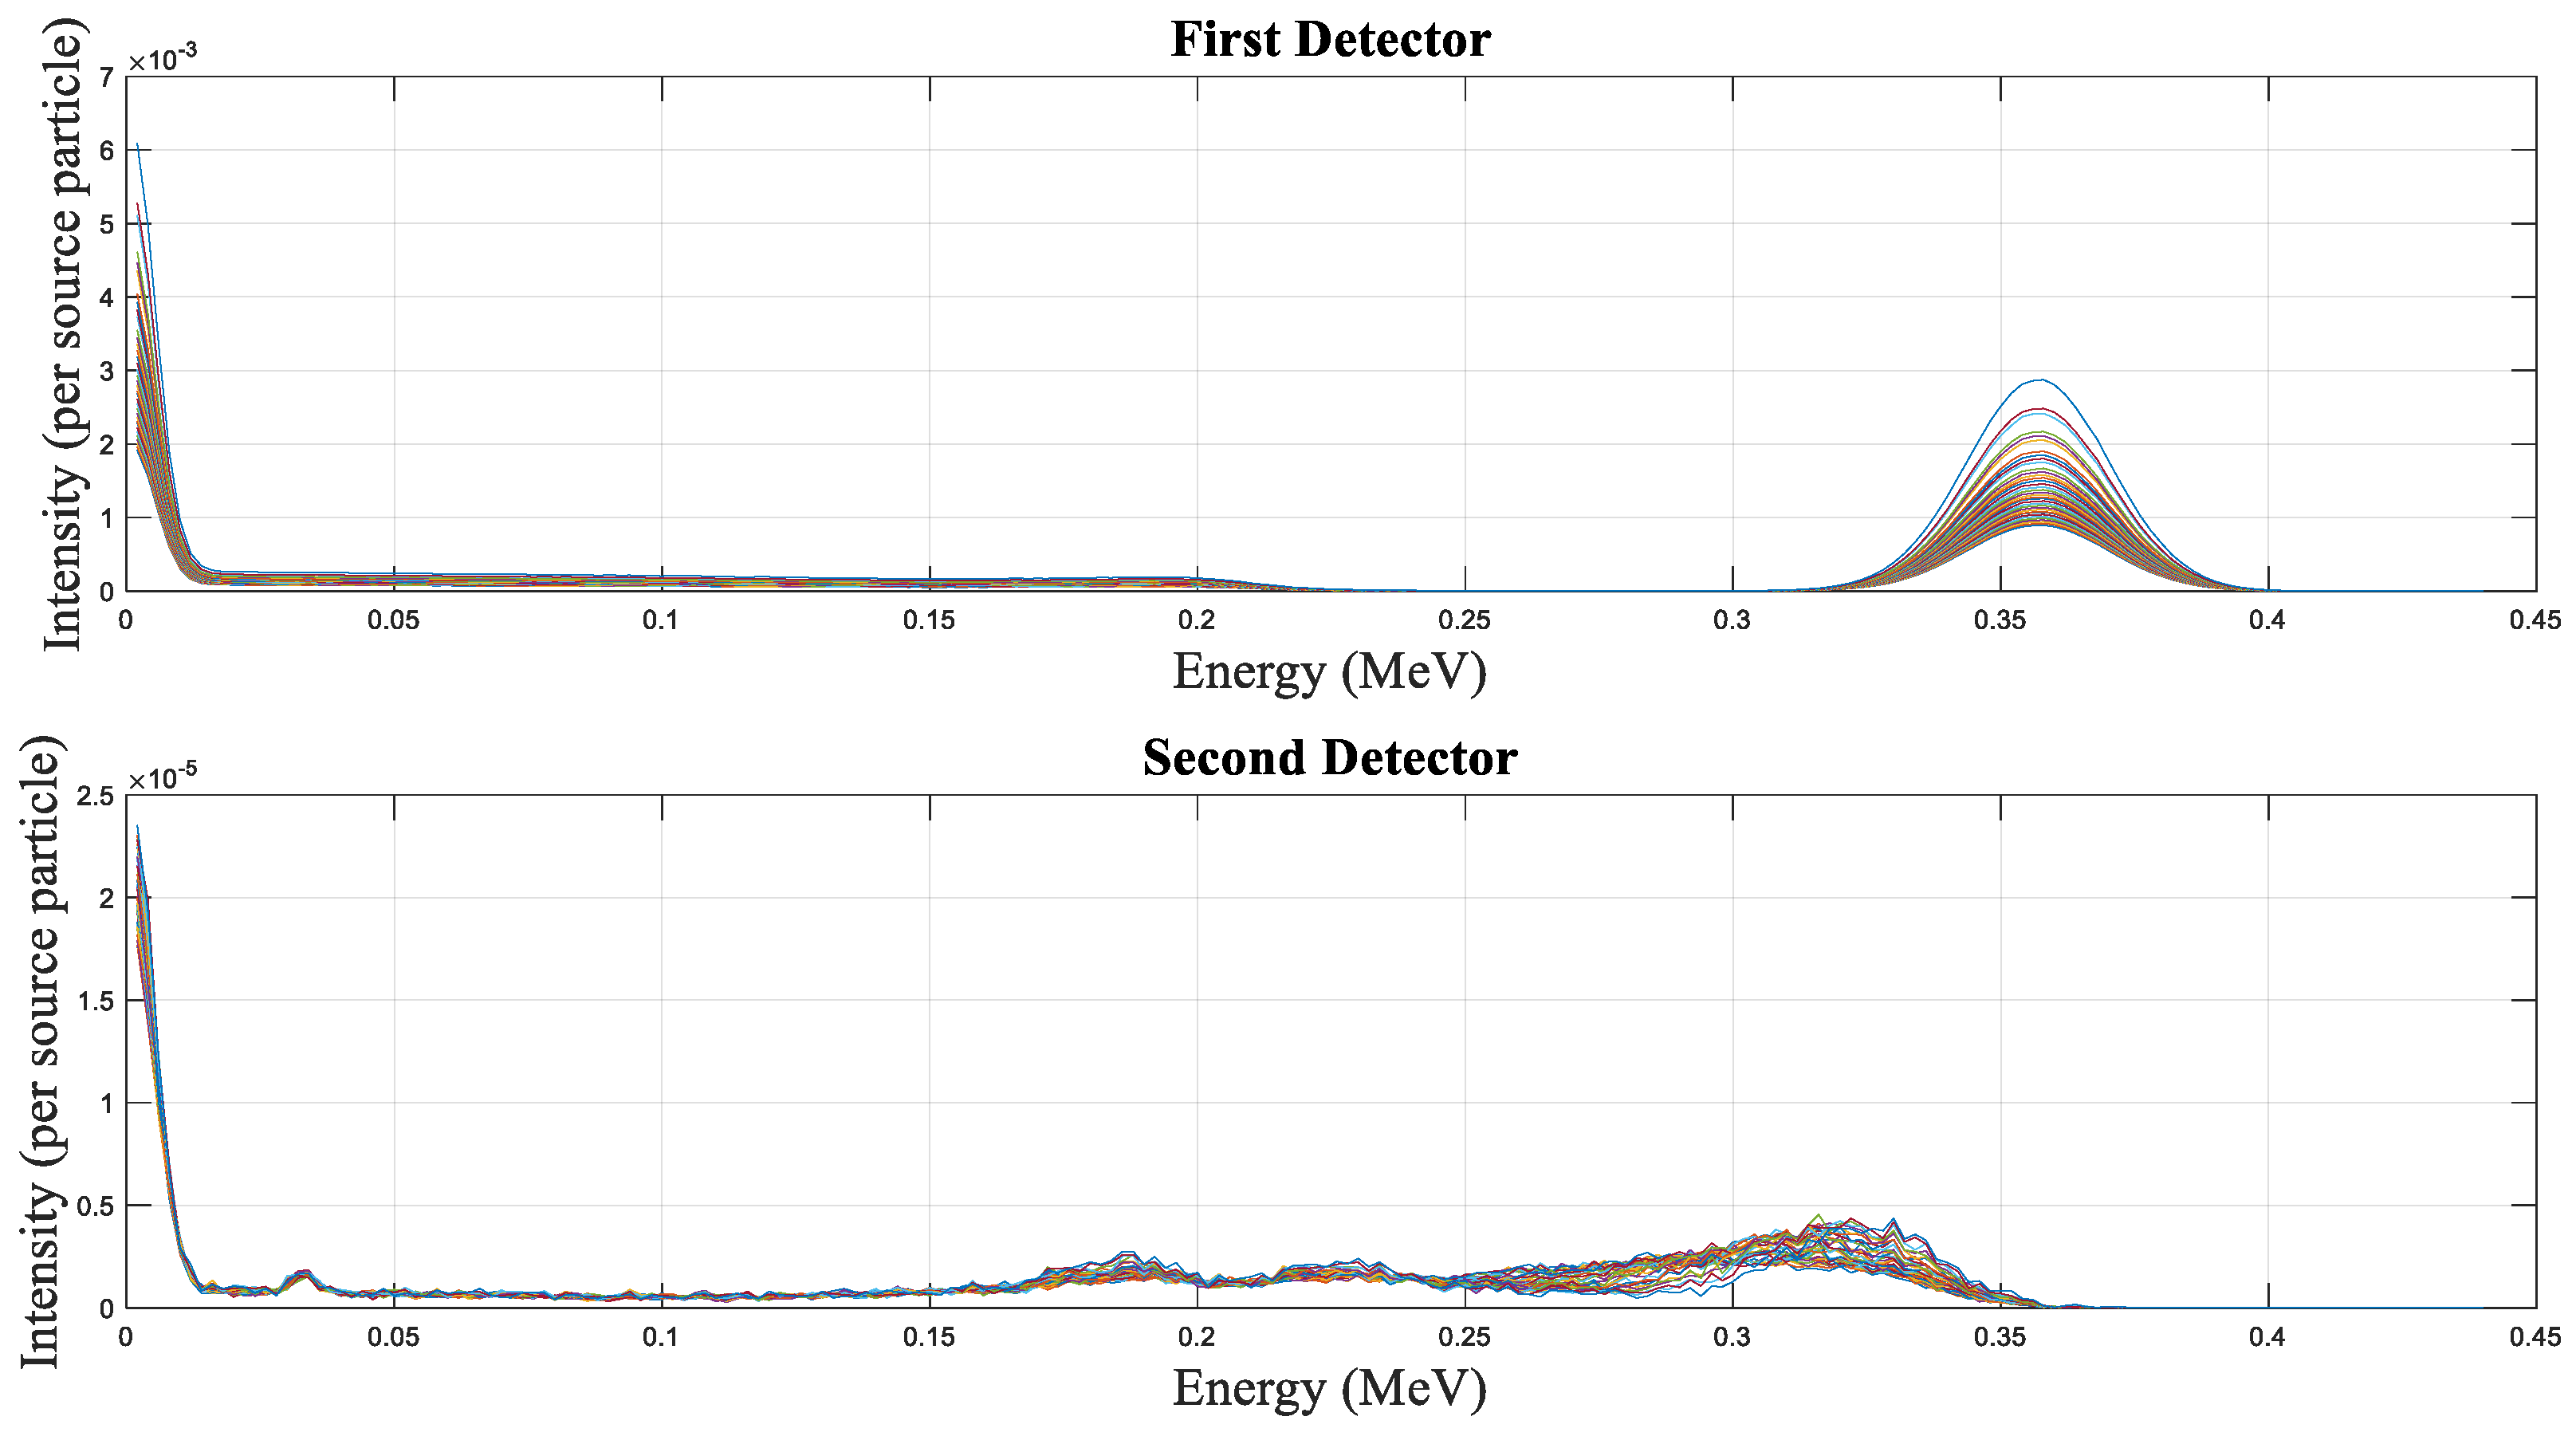
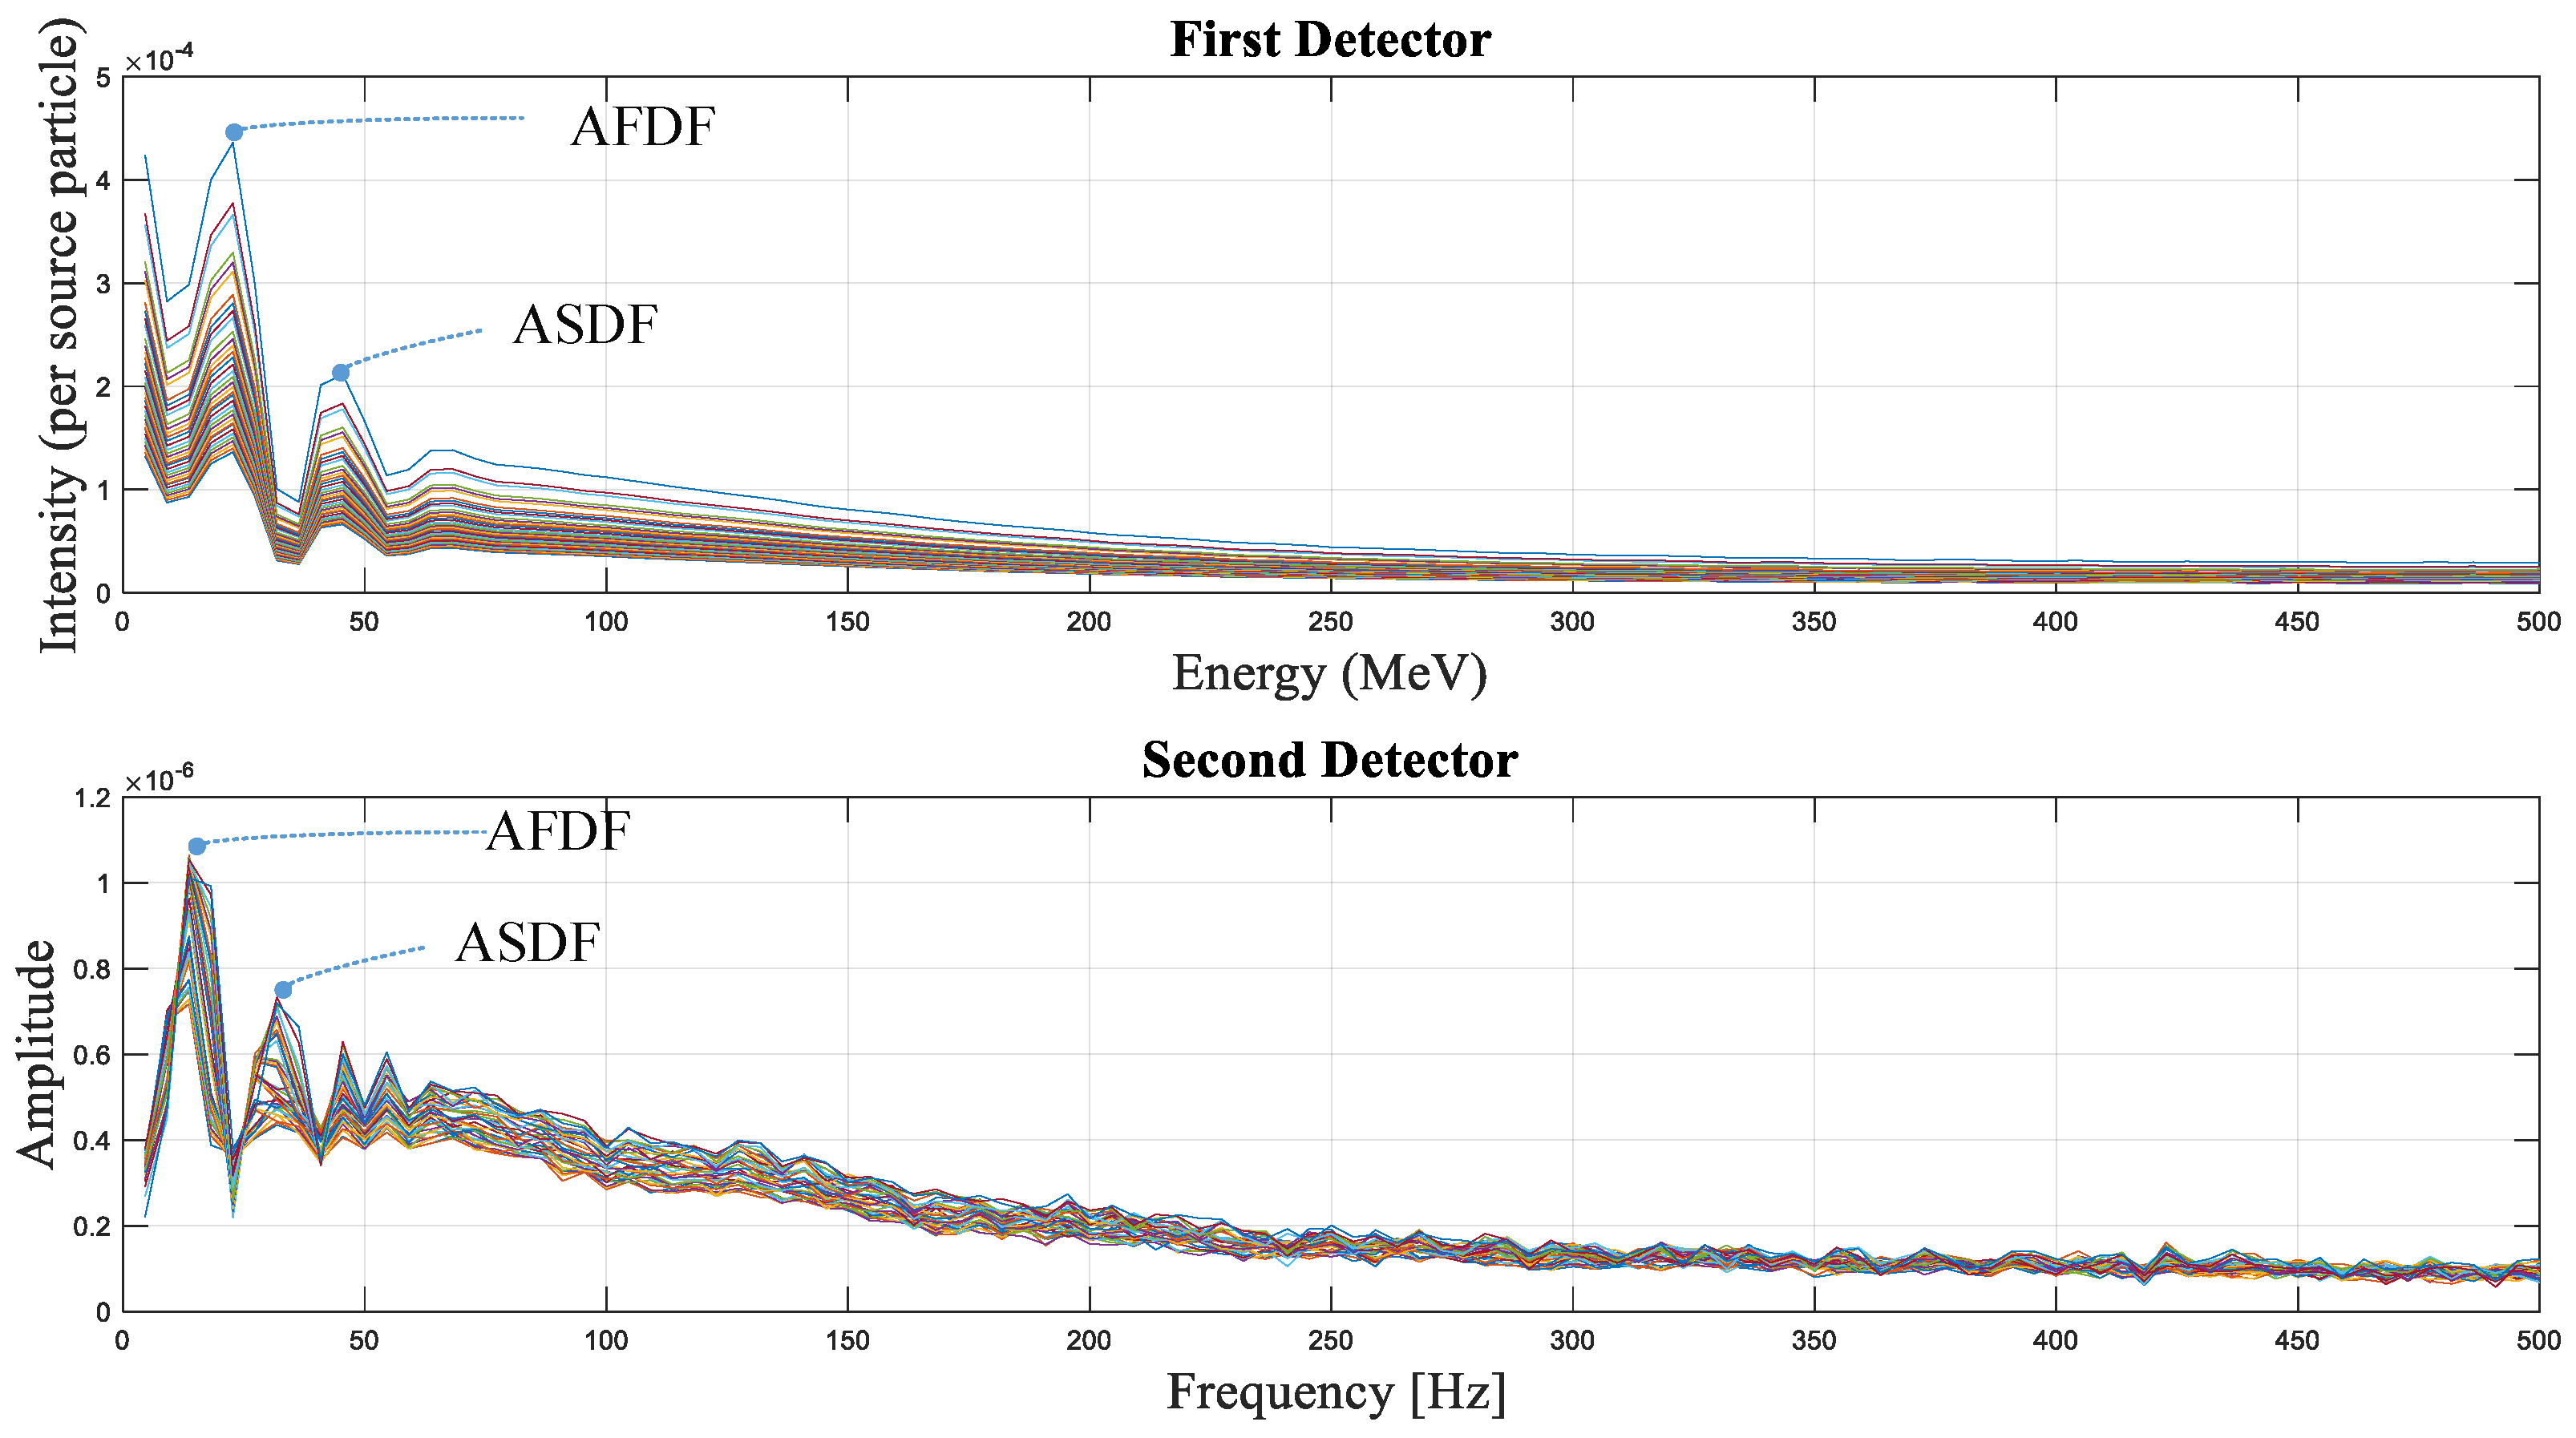
2.2. Feature Extraction
2.3. Radial Basis Function Neural Network
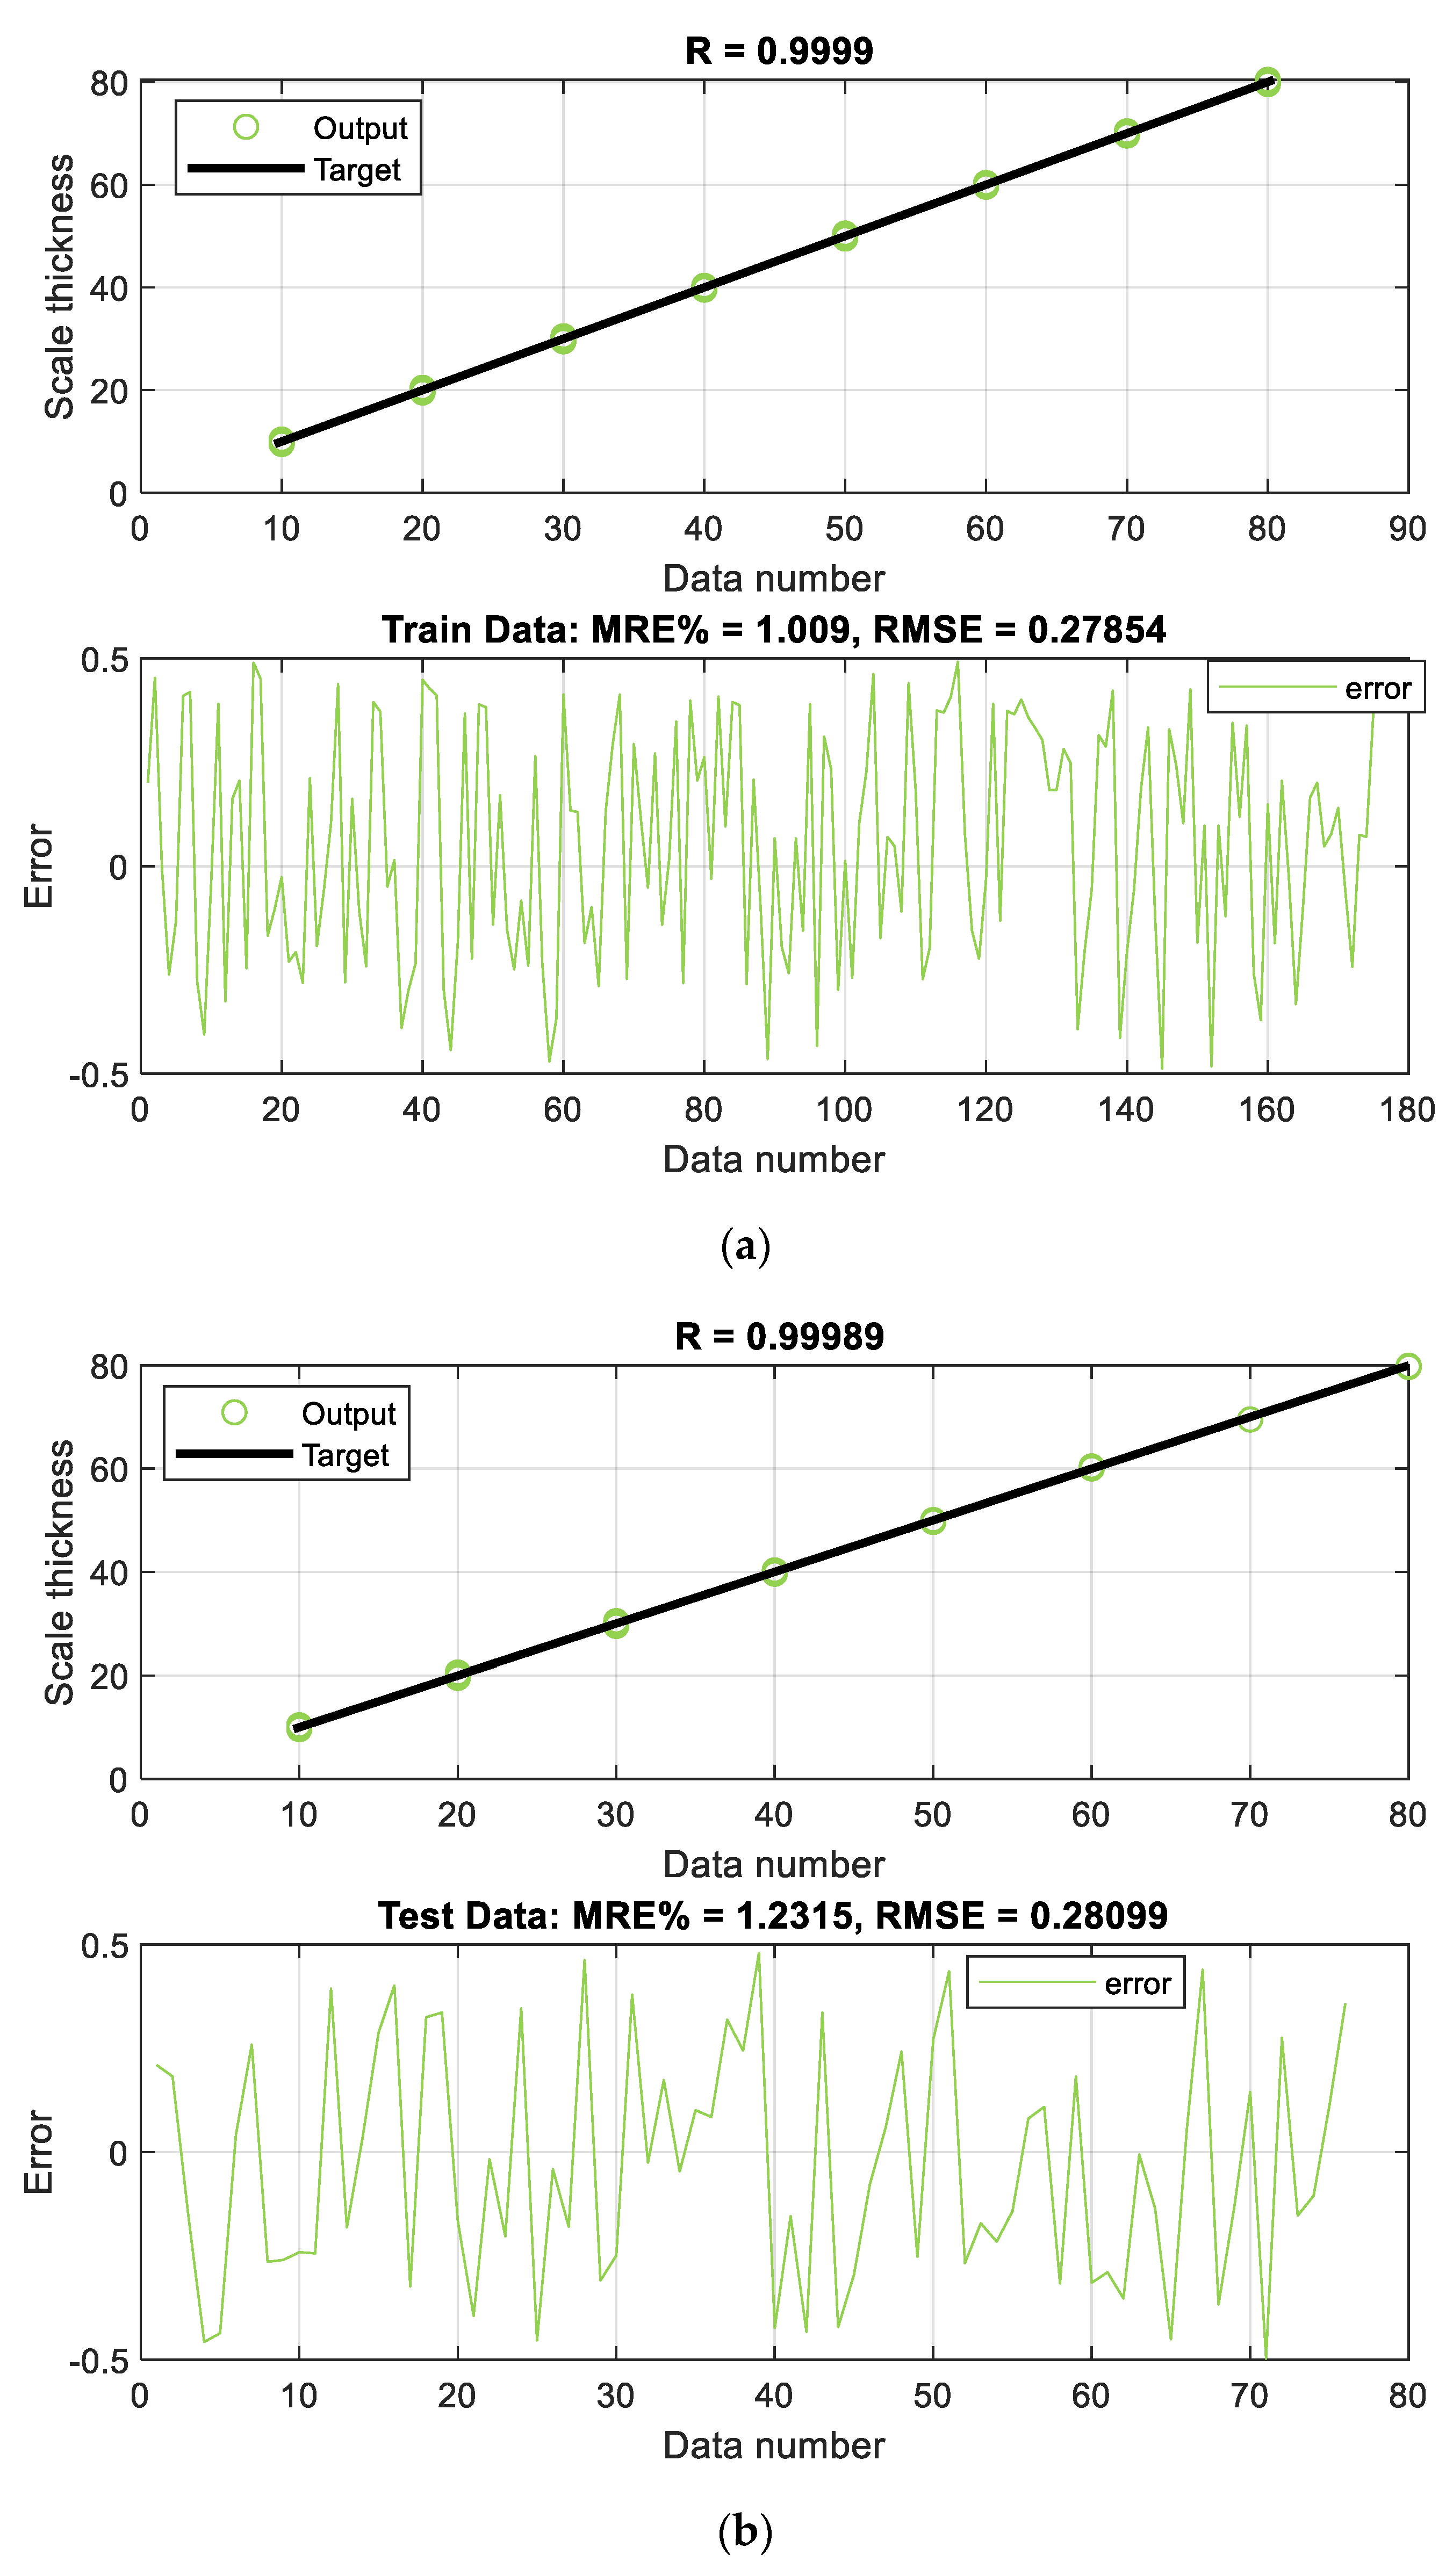
3. Results and Discussion
4. Conclusions
Author Contributions
Funding
Data Availability Statement
Conflicts of Interest
References
- Nazemi, E.; Roshani, G.H.; Feghhi, S.A.H.; Setayeshi, S.; Zadeh, E.E.; Fatehi, A. Optimization of a method for identifying the flow regime and measuring void fraction in a broad beam gamma-ray attenuation technique. Int. J. Hydrogen Energy 2016, 41, 7438–7444. [Google Scholar] [CrossRef]
- Mayet, A.M.; Alizadeh, S.M.; Hamakarim, K.M.; Al-Qahtani, A.A.; Abdullah, K.; Guerrero, J.W.G.A.; Hala, H.A.; Eftekhari-Zadeh, E. Application of Wavelet Characteristics and GMDH Neural Networks for Precise Estimation of Oil Product Types and Volume Fractions. Symmetry 2022, 14, 1797. [Google Scholar] [CrossRef]
- Islamirad, S.Z.; Gholipour Peyvandi, R. Precise volume fraction measurement for three-phase flow meter using 137Cs gamma source and one detector. Radiochim. Acta 2020, 108, 159–164. [Google Scholar] [CrossRef]
- Rad, I.; Zahra, S.; Peyvandi, R.G.; Gharaghani, H.P. Evaluation of nuclear data analysis techniques for volume fraction prediction in the flow meter. Radiochim. Acta 2023, 111, 73–79. [Google Scholar]
- Sattari, A.M.; Roshani, G.H.; Hanus, R. Improving the structure of two-phase flow meter using feature extraction and GMDH neural network. Radiat. Phys. Chem. 2020, 171, 108725. [Google Scholar] [CrossRef]
- ShadSanjabad, M.; Feghhi, A.; Ghaderi, R. Regime independent flow rate prediction in a gas-liquid two-phase facility based on gamma ray technique and one detector using multi-feature extraction. Flow Meas. Instrum. 2023, 92, 102388. [Google Scholar] [CrossRef]
- Tzu-Chia, C.; Abdullah, M.; Hanus, I.R.; Salama, A.S.; Hirota, K. Predicting Scale Thickness in Oil Pipelines Using Frequency Characteristics and an Artificial Neural Network in a Stratified Flow Regime. Energies 2022, 15, 7564. [Google Scholar]
- Salgado, C.M.; Brandão, L.E.B.; Pereira, C.M.N.A.; Salgado, W.L. Salinity independent volume fraction prediction in annular and stratified (water–gas–oil) multiphase flows using artificial neural networks. Prog. Nucl. Energy 2014, 76, 17–23. [Google Scholar] [CrossRef]
- Jeshvaghani, P.; Rezaee, A.K.; Feghhi, S.A.H.; Jafari, A. Using statistical features and a neural network to predict gas volume fractions independent of flow regime changes. Flow Meas. Instrum. 2023, 93, 102430. [Google Scholar] [CrossRef]
- Hossein, R.G.; Ali, P.J.M.; Mohammed, S.; Hanus, R.; Abdulkareem, L.; Alanezi, A.A.; Sattari, M.A.; Amiri, S.; Nazemi, E.; Eftekhari-Zadeh, E.; et al. Simulation study of utilizing X-ray tube in monitoring systems of liquid petroleum products. Processes 2021, 9, 828. [Google Scholar]
- Mohammed, B.; Sattari, M.A.; Taylan, O.; Bakhsh, A.A.; Nazemi, E. Applications of discrete wavelet transform for feature extraction to increase the accuracy of monitoring systems of liquid petroleum products. Mathematics 2021, 24, 3215. [Google Scholar]
- Tzu-Chia, C.; Abdullah, M.; Alizadeh, I.S.M.; Ahmed, S.; Eftekhari-Zadeh, S.E.; Hirota, K. The use of artificial intelligence and time characteristics in the optimization of the structure of the volumetric percentage detection system independent of the scale value inside the pipe. Appl. Artif. Intell. 2023, 37, 2166225. [Google Scholar]
- Marques, S.C.; de Freitas Dam, R.S.; de Carvalho Conti, C.; Salgado, W.L. Three-phase flow meters based on X-rays and artificial neural network to measure the flow compositions. Flow Meas. Instrum. 2021, 82, 102075. [Google Scholar]
- Eng, L.A.; Goh, S. Effect of microchannel diameter on electroosmotic flow hysteresis. Energies 2023, 16, 2154. [Google Scholar]
- Serov, V.; John, T.M.; Hoogenboom, J.E. A new effective Monte Carlo Midway coupling method in MCNP applied to a well logging problem. Appl. Radiat. Isot. 1998, 49, 1737–1744. [Google Scholar] [CrossRef]
- Juntao, L.; Zhang, F.; Wang, X.; Han, F.; Yuan, Z. Numerical study on determining formation porosity using a boron capture gamma ray technique and MCNP. Appl. Radiat. Isot. 2014, 94, 266–271. [Google Scholar]
- Effendy, N.; Zaid, M.H.M.; Sidek, H.A.A.; Matori, K.A.; Mahmoud, K.A.; Sayyed, M.I. Influence of ZnO to the physical, elastic and gamma radiation shielding properties of the tellurite glass system using MCNP-5 simulation code. Radiat. Phys. Chem. 2021, 188, 109665. [Google Scholar] [CrossRef]
- Ozan, T.H.; Manici, T. Simulations of mass attenuation coefficients for shielding materials using the MCNP-X code. Nucl. Sci. Tech. 2017, 28, 95. [Google Scholar]
- Pelowitz, D.B. MCNP-X TM User’s Manual; Version 2.5.0, LA-CP-05e0369; Los Alamos National Laboratory: Los Alamos, NM, USA, 2005.
- Nussbaumer, H.J. The Fast Fourier Transform; Springer: Berlin/Heidelberg, Germany, 1981. [Google Scholar]
- Yu, B.; He, X. Training radial basis function networks with differential evolution. IEEE Int. Conf. Granul. Comput. 2006, 11, 369–372. [Google Scholar] [CrossRef]
- Hartman, E.J.; Keeler, J.D.; Kowalski, J.M. Layered neural networks with Gaussian hidden units as universal approximators. Neural Comput. 1990, 2, 210–215. [Google Scholar] [CrossRef]
- Al-Naser, M.; Elshafei, M.; Al-Sarkhi, A. Artificial neural network application for multiphase flow patterns detection: A new approach. J. Pet. Sci. Eng. 2016, 145, 548–564. [Google Scholar] [CrossRef]
- Świsulski, D.M. Uncertainty of mass flow measurement using centric and eccentric orifice for Reynolds number in the range 10,000 ≤ Re ≤ 20,000. Measurement 2020, 160, 107851. [Google Scholar]
- Yan, Y.; Wang, L.; Wang, T.; Wang, X.; Hu, Y.; Duan, Q. Application of soft computing techniques to multiphase flow measurement: A review. Flow Meas. Instrum. 2018, 60, 30–34. [Google Scholar] [CrossRef]
- Mohammad, M.A.; Chen, T.-C.; Alizadeh, S.M.; Al-Qahtani, A.A.; Qaisi, R.M.A.; Alhashim, H.H.; Eftekhari-Zadeh, E. Application of Artificial Intelligence for Determining the Volume Percentages of a Stratified Regime’s Three-Phase Flow, Independent of the Oil Pipeline’s Scale Thickness. Processes 1996, 10, 10. [Google Scholar]
- Mohammadmehdi, R.; Sattari, M.A.; Ali, P.J.M.; Roshani, G.H.; Nazemi, B.; Corniani, E.; Nazemi, E. Application of GMDH neural network technique to improve measuring precision of a simplified photon attenuation based two-phase flowmeter. Flow Meas. Instrum. 2020, 75, 101804. [Google Scholar]
- Amir, S.M.; Roshani, G.H.; Hanus, R.; Nazemi, E. Applicability of time-domain feature extraction methods and artificial intelligence in two-phase flow meters based on gamma-ray absorption technique. Measurement 2021, 168, 108474. [Google Scholar] [CrossRef]
- Hosseini, S.; Roshani, G.H.; Setayesh, S. Precise gamma based two-phase flow meter using frequency feature extraction and only one detector. Flow Meas. Instrum. 2020, 72, 101693. [Google Scholar] [CrossRef]
- Gholipour, P.R.; Islami Rad, S.Z. Application of artificial neural networks for the prediction of volume fraction using spectra of gamma rays backscattered by three-phase flows. Eur. Phys. J. Plus 2017, 132, 511. [Google Scholar] [CrossRef]
- Roshani, G.H.; Nazemi, E.; Feghhi, S.A.H.; Setayeshi, S. Flow regime identification and void fraction prediction in two-phase flows based on gamma ray attenuation. Measurement 2015, 62, 25–32. [Google Scholar] [CrossRef]
- Mayet, A.M.; Alizadeh, S.M.; Kakarash, Z.A.; Al-Qahtani, A.A.; Alanazi, A.K.; Alhashimi, H.H.; Eftekhari-Zadeh, E.; Nazemi, E. Introducing a precise system for determining volume percentages independent of scale thickness and type of flow regime. Mathematics 2020, 10, 1770. [Google Scholar] [CrossRef]


| ANN | Gas Predictor | Oil Predictor | ||
|---|---|---|---|---|
| Neurons in the input layer | 4 | 4 | ||
| Neurons in the hidden layer | 38 | 27 | ||
| Neurons in the output layer | 1 | 1 | ||
| RBF spread | 4 | 5 | ||
| RMSE | Train set | Test set | Train set | Test set |
| 0.27 | 0.18 | 0.27 | 0.29 | |
| MRE% | 0.9 | 1.1 | 1.0 | 1.2 |
| Oil Percentage Predictor Network | Gas Percentage Predictor Network | |||||||
|---|---|---|---|---|---|---|---|---|
| Train | Test | Train | Test | |||||
| Output | Target | Output | Target | Output | Target | Output | Target | |
| 1 | 40.0054 | 40 | 10.4679 | 10 | 29.7982 | 30 | 9.7902 | 10 |
| 2 | 60.2055 | 60 | 29.3219 | 30 | 49.5464 | 50 | 9.8175 | 10 |
| 3 | 29.7308 | 30 | 50.5092 | 50 | 20.0054 | 20 | 10.1537 | 10 |
| 4 | 29.4942 | 30 | 19.4093 | 20 | 10.2614 | 10 | 20.4569 | 20 |
| 5 | 79.9658 | 80 | 10.2367 | 10 | 70.1311 | 70 | 60.4357 | 60 |
| 6 | 59.8074 | 60 | 50.0003 | 50 | 79.5899 | 80 | 29.9579 | 30 |
| 7 | 10.4034 | 10 | 29.6052 | 30 | 9.5809 | 10 | 19.7405 | 20 |
| 8 | 20.3924 | 20 | 20.1003 | 20 | 50.2772 | 50 | 20.2639 | 20 |
| 9 | 30.2359 | 30 | 49.4711 | 50 | 50.4051 | 50 | 10.2593 | 10 |
| 10 | 39.4869 | 40 | 30.2396 | 30 | 10.0338 | 10 | 60.2406 | 60 |
| 11 | 39.3302 | 40 | 40.1394 | 40 | 39.6092 | 40 | 30.2437 | 30 |
| 12 | 40.0838 | 40 | 9.3784 | 10 | 30.3258 | 30 | 29.6059 | 30 |
| 13 | 39.7211 | 40 | 9.3789 | 10 | 59.8381 | 60 | 10.1816 | 10 |
| 14 | 70.6152 | 70 | 59.5135 | 60 | 29.7940 | 30 | 19.9633 | 20 |
| 15 | 10.6733 | 10 | 49.3275 | 50 | 30.2463 | 30 | 49.7122 | 50 |
| 16 | 29.7013 | 30 | 9.9092 | 10 | 9.5103 | 10 | 29.5985 | 30 |
| 17 | 60.4211 | 60 | 60.4651 | 60 | 9.5484 | 10 | 60.3236 | 60 |
| 18 | 10.5546 | 10 | 10.1643 | 10 | 10.1679 | 10 | 19.6750 | 20 |
| 19 | 30.1365 | 30 | 20.0282 | 20 | 10.1035 | 10 | 49.6636 | 50 |
| 20 | 10.5376 | 10 | 10.5094 | 10 | 30.0261 | 30 | 10.1660 | 10 |
| 21 | 20.6212 | 20 | 39.4368 | 40 | 50.2297 | 50 | 10.3944 | 10 |
| 22 | 40.0688 | 40 | 40.5713 | 40 | 10.2073 | 10 | 40.0166 | 40 |
| 23 | 10.3197 | 10 | 9.4512 | 10 | 30.2814 | 30 | 40.2027 | 40 |
| 24 | 30.1075 | 30 | 10.0238 | 10 | 19.7880 | 20 | 9.6536 | 10 |
| 25 | 49.3362 | 50 | 29.5004 | 30 | 10.1925 | 10 | 30.4535 | 30 |
| 26 | 19.9251 | 20 | 80.0831 | 80 | 20.0567 | 20 | 50.0409 | 50 |
| 27 | 50.2048 | 50 | 39.3064 | 40 | 39.8965 | 40 | 10.1797 | 10 |
| 28 | 10.0297 | 10 | 40.3734 | 40 | 39.5616 | 40 | 29.5366 | 30 |
| 29 | 39.8212 | 40 | 30.4882 | 30 | 60.2802 | 60 | 10.3092 | 10 |
| 30 | 50.6120 | 50 | 30.5835 | 30 | 69.8376 | 70 | 40.2486 | 40 |
| 31 | 20.4613 | 20 | 70.6818 | 70 | 20.1079 | 20 | 19.6202 | 20 |
| 32 | 60.4887 | 60 | 30.0072 | 30 | 50.2413 | 50 | 60.0250 | 60 |
| 33 | 39.8215 | 40 | 69.6800 | 70 | 19.6048 | 20 | 39.8258 | 40 |
| 34 | 30.1305 | 30 | 9.4411 | 10 | 29.6279 | 30 | 10.0464 | 10 |
| 35 | 20.5216 | 20 | 40.0110 | 40 | 10.0495 | 10 | 9.8989 | 10 |
| 36 | 50.6069 | 50 | 30.1199 | 30 | 49.9852 | 50 | 9.9151 | 10 |
| 37 | 70.2358 | 70 | 30.3680 | 30 | 70.3905 | 70 | 79.6807 | 80 |
| 38 | 69.5895 | 70 | 29.4161 | 30 | 40.2990 | 40 | 39.7554 | 40 |
| 39 | 70.2154 | 70 | 50.2262 | 50 | 30.2343 | 30 | 69.5205 | 70 |
| 40 | 79.4009 | 80 | 10.0238 | 10 | 49.5513 | 50 | 30.4237 | 30 |
| 41 | 59.8694 | 60 | 49.5395 | 50 | 49.5729 | 50 | 20.1537 | 20 |
| 42 | 50.2337 | 50 | 40.6140 | 40 | 29.5885 | 30 | 20.4326 | 20 |
| 43 | 30.6072 | 30 | 20.1267 | 20 | 20.2984 | 20 | 9.6635 | 10 |
| 44 | 30.4353 | 30 | 19.9169 | 20 | 20.4430 | 20 | 30.4211 | 30 |
| 45 | 59.9784 | 60 | 10.6187 | 10 | 80.1837 | 80 | 40.2947 | 40 |
| 46 | 10.3594 | 10 | 10.2183 | 10 | 9.6321 | 10 | 10.0774 | 10 |
| 47 | 69.8839 | 70 | 59.9327 | 60 | 20.2227 | 20 | 9.9400 | 10 |
| 48 | 30.6605 | 30 | 10.4756 | 10 | 59.6104 | 60 | 9.7576 | 10 |
| 49 | 40.6832 | 40 | 20.0457 | 20 | 9.6175 | 10 | 60.2519 | 60 |
| 50 | 50.5098 | 50 | 20.0754 | 20 | 50.1407 | 50 | 19.7287 | 20 |
| 51 | 39.8444 | 40 | 20.2521 | 20 | 9.8288 | 10 | 19.5642 | 20 |
| 52 | 29.9366 | 30 | 19.8141 | 20 | 10.1538 | 10 | 60.2673 | 60 |
| 53 | 29.6454 | 30 | 19.6350 | 20 | 40.2491 | 40 | 10.1712 | 10 |
| 54 | 10.3982 | 10 | 40.1105 | 40 | 60.0832 | 60 | 40.2152 | 40 |
| 55 | 10.5360 | 10 | 10.5136 | 10 | 40.2400 | 40 | 60.1421 | 60 |
| 56 | 20.5792 | 20 | 19.8695 | 20 | 9.7348 | 10 | 79.9190 | 80 |
| 57 | 10.0816 | 10 | 49.4577 | 50 | 20.2350 | 20 | 29.8908 | 30 |
| 58 | 70.1384 | 70 | 69.9214 | 70 | 50.4706 | 50 | 60.3161 | 60 |
| 59 | 9.5084 | 10 | 69.7203 | 70 | 10.3669 | 10 | 9.8174 | 10 |
| 60 | 20.5596 | 20 | 39.8619 | 40 | 19.5862 | 20 | 10.3145 | 10 |
| 61 | 9.9306 | 10 | 40.4667 | 40 | 9.8664 | 10 | 20.2891 | 20 |
| 62 | 49.5879 | 50 | 19.8651 | 20 | 29.8692 | 30 | 10.3523 | 10 |
| 63 | 10.5595 | 10 | 59.8462 | 60 | 70.1850 | 70 | 10.0056 | 10 |
| 64 | 20.3676 | 20 | 39.8046 | 40 | 20.0979 | 20 | 30.1357 | 30 |
| 65 | 10.5355 | 10 | 39.4964 | 40 | 50.2894 | 50 | 20.4509 | 20 |
| 66 | 9.6989 | 10 | 9.6642 | 10 | 39.8677 | 40 | 19.9440 | 20 |
| 67 | 20.2425 | 20 | 19.4215 | 20 | 49.7060 | 50 | 29.5600 | 30 |
| 68 | 40.2300 | 40 | 9.9012 | 10 | 39.5867 | 40 | 30.3667 | 30 |
| 69 | 39.4719 | 40 | 39.6602 | 40 | 20.2719 | 20 | 10.1312 | 10 |
| 70 | 19.8702 | 20 | 9.7166 | 10 | 69.7057 | 70 | 9.8551 | 10 |
| 71 | 49.6854 | 50 | 19.8948 | 20 | 29.8883 | 30 | 20.4970 | 20 |
| 72 | 30.3033 | 30 | 69.4669 | 70 | 40.0518 | 40 | 39.7242 | 40 |
| 73 | 9.6967 | 10 | 19.9931 | 20 | 39.7290 | 40 | 10.1525 | 10 |
| 74 | 60.5547 | 60 | 20.2890 | 20 | 20.1419 | 20 | 40.1050 | 40 |
| 75 | 50.4572 | 50 | 59.6410 | 60 | 69.9845 | 70 | 29.8872 | 30 |
| 76 | 19.8460 | 20 | 40.3991 | 40 | 9.6518 | 10 | 39.6422 | 40 |
| 77 | 79.9971 | 80 | - | - | 30.2819 | 30 | - | - |
| 78 | 30.2727 | 30 | - | - | 19.6006 | 20 | - | - |
| 79 | 50.4681 | 50 | - | - | 29.7941 | 30 | - | - |
| 80 | 60.1535 | 60 | - | - | 19.7374 | 20 | - | - |
| 81 | 80.1046 | 80 | - | - | 40.0309 | 40 | - | - |
| 82 | 29.7565 | 30 | - | - | 9.5915 | 10 | - | - |
| 83 | 19.9390 | 20 | - | - | 59.9053 | 60 | - | - |
| 84 | 60.2993 | 60 | - | - | 29.6048 | 30 | - | - |
| 85 | 10.5382 | 10 | - | - | 29.6123 | 30 | - | - |
| 86 | 60.3092 | 60 | - | - | 20.2844 | 20 | - | - |
| 87 | 29.3261 | 30 | - | - | 9.7916 | 10 | - | - |
| 88 | 50.2447 | 50 | - | - | 40.1035 | 40 | - | - |
| 89 | 39.9139 | 40 | - | - | 50.4644 | 50 | - | - |
| 90 | 59.9129 | 60 | - | - | 9.9325 | 10 | - | - |
| 91 | 19.4639 | 20 | - | - | 40.1948 | 40 | - | - |
| 92 | 50.4406 | 50 | - | - | 20.2581 | 20 | - | - |
| 93 | 39.7548 | 40 | - | - | 19.9326 | 20 | - | - |
| 94 | 19.6447 | 20 | - | - | 30.1555 | 30 | - | - |
| 95 | 29.7798 | 30 | - | - | 39.6098 | 40 | - | - |
| 96 | 19.8260 | 20 | - | - | 30.4338 | 30 | - | - |
| 97 | 50.0652 | 50 | - | - | 29.6875 | 30 | - | - |
| 98 | 20.0867 | 20 | - | - | 29.7662 | 30 | - | - |
| 99 | 39.8542 | 40 | - | - | 40.2978 | 40 | - | - |
| 100 | 19.8574 | 20 | - | - | 49.9876 | 50 | - | - |
| 101 | 10.0215 | 10 | - | - | 60.2690 | 60 | - | - |
| 102 | 10.2205 | 10 | - | - | 19.8960 | 20 | - | - |
| 103 | 20.6313 | 20 | - | - | 19.7729 | 20 | - | - |
| 104 | 80.3113 | 80 | - | - | 19.5372 | 20 | - | - |
| 105 | 59.8601 | 60 | - | - | 60.1733 | 60 | - | - |
| 106 | 40.4646 | 40 | - | - | 29.9296 | 30 | - | - |
| 107 | 69.4881 | 70 | - | - | 9.9517 | 10 | - | - |
| 108 | 9.3847 | 10 | - | - | 20.1099 | 20 | - | - |
| 109 | 19.4179 | 20 | - | - | 39.5594 | 40 | - | - |
| 110 | 49.5295 | 50 | - | - | 69.8158 | 70 | - | - |
| 111 | 79.7539 | 80 | - | - | 80.2727 | 80 | - | - |
| 112 | 9.7224 | 10 | - | - | 40.1964 | 40 | - | - |
| 113 | 9.3164 | 10 | - | - | 49.6253 | 50 | - | - |
| 114 | 10.0559 | 10 | - | - | 29.6302 | 30 | - | - |
| 115 | 19.4335 | 20 | - | - | 9.5924 | 10 | - | - |
| 116 | 19.5051 | 20 | - | - | 29.5078 | 30 | - | - |
| 117 | 20.1836 | 20 | - | - | 49.9231 | 50 | - | - |
| 118 | 10.5030 | 10 | - | - | 20.1556 | 20 | - | - |
| 119 | 30.6639 | 30 | - | - | 50.2229 | 50 | - | - |
| 120 | 20.0992 | 20 | - | - | 20.0312 | 20 | - | - |
| 121 | 30.6956 | 30 | - | - | 49.6088 | 50 | - | - |
| 122 | 30.0750 | 30 | - | - | 20.1318 | 20 | - | - |
| 123 | 20.0216 | 20 | - | - | 19.6265 | 20 | - | - |
| 124 | 9.7630 | 10 | - | - | 59.6343 | 60 | - | - |
| 125 | 19.9020 | 20 | - | - | 9.5986 | 10 | - | - |
| 126 | 29.9885 | 30 | - | - | 49.6420 | 50 | - | - |
| 127 | 49.3995 | 50 | - | - | 49.6683 | 50 | - | - |
| 128 | 30.5428 | 30 | - | - | 19.6962 | 20 | - | - |
| 129 | 29.3905 | 30 | - | - | 39.8175 | 40 | - | - |
| 130 | 29.9107 | 30 | - | - | 49.8164 | 50 | - | - |
| 131 | 40.4573 | 40 | - | - | 9.7176 | 10 | - | - |
| 132 | 49.8523 | 50 | - | - | 39.7510 | 40 | - | - |
| 133 | 30.1589 | 30 | - | - | 30.3929 | 30 | - | - |
| 134 | 20.4461 | 20 | - | - | 30.2032 | 30 | - | - |
| 135 | 10.5407 | 10 | - | - | 10.0557 | 10 | - | - |
| 136 | 30.6036 | 30 | - | - | 39.6844 | 40 | - | - |
| 137 | 39.5671 | 40 | - | - | 69.7120 | 70 | - | - |
| 138 | 49.6620 | 50 | - | - | 29.5773 | 30 | - | - |
| 139 | 30.5570 | 30 | - | - | 80.4138 | 80 | - | - |
| 140 | 40.1307 | 40 | - | - | 20.2067 | 20 | - | - |
| 141 | 60.0054 | 60 | - | - | 10.0578 | 10 | - | - |
| 142 | 10.1579 | 10 | - | - | 69.8134 | 70 | - | - |
| 143 | 70.4472 | 70 | - | - | 29.6662 | 30 | - | - |
| 144 | 50.0446 | 50 | - | - | 20.1225 | 20 | - | - |
| 145 | 9.5829 | 10 | - | - | 50.4879 | 50 | - | - |
| 146 | 9.9355 | 10 | - | - | 69.6704 | 70 | - | - |
| 147 | 9.8991 | 10 | - | - | 39.7578 | 40 | - | - |
| 148 | 10.6525 | 10 | - | - | 29.8968 | 30 | - | - |
| 149 | 10.1681 | 10 | - | - | 69.5740 | 70 | - | - |
| 150 | 20.2735 | 20 | - | - | 10.1841 | 10 | - | - |
| 151 | 60.3082 | 60 | - | - | 49.9024 | 50 | - | - |
| 152 | 39.7857 | 40 | - | - | 30.4828 | 30 | - | - |
| 153 | 10.0238 | 10 | - | - | 19.9022 | 20 | - | - |
| 154 | 60.0794 | 60 | - | - | 30.1207 | 30 | - | - |
| 155 | 39.5191 | 40 | - | - | 69.6544 | 70 | - | - |
| 156 | 30.0869 | 30 | - | - | 19.8813 | 20 | - | - |
| 157 | 20.2727 | 20 | - | - | 19.6611 | 20 | - | - |
| 158 | 9.8970 | 10 | - | - | 20.2581 | 20 | - | - |
| 159 | 20.4708 | 20 | - | - | 20.3711 | 20 | - | - |
| 160 | 30.3239 | 30 | - | - | 59.8508 | 60 | - | - |
| 161 | 49.8040 | 50 | - | - | 60.1855 | 60 | - | - |
| 162 | 9.9359 | 10 | - | - | 39.7941 | 40 | - | - |
| 163 | 29.8409 | 30 | - | - | 60.0306 | 60 | - | - |
| 164 | 30.3858 | 30 | - | - | 60.3324 | 60 | - | - |
| 165 | 10.3280 | 10 | - | - | 50.0975 | 50 | - | - |
| 166 | 49.9024 | 50 | - | - | 39.8353 | 40 | - | - |
| 167 | 20.2713 | 20 | - | - | 79.7992 | 80 | - | - |
| 168 | 50.6233 | 50 | - | - | 59.9526 | 60 | - | - |
| 169 | 20.3979 | 20 | - | - | 69.9226 | 70 | - | - |
| 170 | 20.2878 | 20 | - | - | 19.8596 | 20 | - | - |
| 171 | 29.4531 | 30 | - | - | 40.0583 | 40 | - | - |
| 172 | 9.8459 | 10 | - | - | 10.2425 | 10 | - | - |
| 173 | 60.1273 | 60 | - | - | 9.9243 | 10 | - | - |
| 174 | 9.9431 | 10 | - | - | 9.9294 | 10 | - | - |
| 175 | 69.3705 | 70 | - | - | 39.6249 | 40 | - | - |
| 176 | 19.6202 | 20 | - | - | 49.5244 | 50 | - | - |
| Ref. | Maximum MSE | Maximum RMSE | Extracted Features | Type of Neural Network |
|---|---|---|---|---|
| [5] | 0.21 | 0.46 | Time features | MLP |
| [27] | 7.34 | 2.71 | No feature extraction | GMDH |
| [28] | 1.24 | 1.11 | Time features | GMDH |
| [29] | 0.67 | 0.82 | Frequency features | MLP |
| [30] | 2.56 | 1.6 | No feature extraction | MLP |
| [31] | 1.08 | 1.04 | No feature extraction | MLP |
| [32] | 0.19 | 0.44 | Wavelet features | GMDH |
| [current study] | 0.07 | 0.27 | Frequency features | RBF |
Disclaimer/Publisher’s Note: The statements, opinions and data contained in all publications are solely those of the individual author(s) and contributor(s) and not of MDPI and/or the editor(s). MDPI and/or the editor(s) disclaim responsibility for any injury to people or property resulting from any ideas, methods, instructions or products referred to in the content. |
© 2023 by the authors. Licensee MDPI, Basel, Switzerland. This article is an open access article distributed under the terms and conditions of the Creative Commons Attribution (CC BY) license (https://creativecommons.org/licenses/by/4.0/).
Share and Cite
Mayet, A.M.; Guerrero, J.W.G.; Ijyas, T.; Bhutto, J.K.; Shukla, N.K.; Eftekhari-Zadeh, E.; Alhashim, H.H. Application of the Fourier Transform to Improve the Accuracy of Gamma-Based Volume Percentage Detection System Independent of Scale Thickness. Separations 2023, 10, 534. https://doi.org/10.3390/separations10100534
Mayet AM, Guerrero JWG, Ijyas T, Bhutto JK, Shukla NK, Eftekhari-Zadeh E, Alhashim HH. Application of the Fourier Transform to Improve the Accuracy of Gamma-Based Volume Percentage Detection System Independent of Scale Thickness. Separations. 2023; 10(10):534. https://doi.org/10.3390/separations10100534
Chicago/Turabian StyleMayet, Abdulilah Mohammad, John William Grimaldo Guerrero, Thafasal Ijyas, Javed Khan Bhutto, Neeraj Kumar Shukla, Ehsan Eftekhari-Zadeh, and Hala H. Alhashim. 2023. "Application of the Fourier Transform to Improve the Accuracy of Gamma-Based Volume Percentage Detection System Independent of Scale Thickness" Separations 10, no. 10: 534. https://doi.org/10.3390/separations10100534
APA StyleMayet, A. M., Guerrero, J. W. G., Ijyas, T., Bhutto, J. K., Shukla, N. K., Eftekhari-Zadeh, E., & Alhashim, H. H. (2023). Application of the Fourier Transform to Improve the Accuracy of Gamma-Based Volume Percentage Detection System Independent of Scale Thickness. Separations, 10(10), 534. https://doi.org/10.3390/separations10100534