Article

Microstructural Evolution of a High-Strength Zr-Ti-Modified 2139 Aluminum Alloy for Laser Powder Bed Fusion

Department of Mechanical Engineering, Politecnico di Milano, Via G. La Masa 1, 20156 Milan, Italy
*
Author to whom correspondence should be addressed.
Metals 2023, 13(5), 924; https://doi.org/10.3390/met13050924
Submission received: 14 April 2023 / Revised: 4 May 2023 / Accepted: 8 May 2023 / Published: 10 May 2023
(This article belongs to the Special Issue Additive Manufacturing of Al- and Mg-Based Light Metal Alloys)

Abstract

:
The demand for high-performance aluminum components drives research into the design of novel alloys that can be processed by laser-based additive manufacturing. In recent years, the addition of grain refiners proved to be an effective strategy to reduce the hot-cracking of high-strength Al alloys. In this study, the solidification and aging behavior of an Al2139 alloy doped with additions of Zr and Ti for L-PBF was investigated. These elements favored the formation of a fine-grained structure free of cracks. The formation of Al3(Zr,Ti) inoculants was predicted by Scheil simulations and observed as cuboidal particles in the center of α-Al grains. The microstructure of the as-built material featured fine and fully equiaxed grains, which appeared comparatively finer at the edge (300–600 nm) and coarser (0.8–2.0 μm) at the center of the molten pools. In both cases, there was evidence of Cu and Mg micro-segregations at the grain boundaries. The microhardness of 109.7 HV0.5 in the as-built state was increased to 186.1 HV0.5 after optimized T4 heat treatment, responsible for the precipitation of many rod-shaped Zr- and Ti-based second phases and quasi-spherical Cu-, Mn-, and Fe-rich particles. Prolonged exposure carried out to simulate high-temperature service caused a drop in microhardness and marked modification of the microstructure, evidenced by the rearrangement and subsequent spheroidization of Cu- and Mg-rich particles at the grain boundaries.

1. Introduction

Additive manufacturing (AM), also known as 3D printing, is an innovative technique currently revolutionizing the industrial world. Whereas in traditional “subtractive” manufacturing processes, the final product is obtained by massive material removal, AM allows building objects by adding material only where necessary according to a computer-aided design (CAD) file. Another great advantage is the possibility of creating products that are characterized by complex geometries and innovative features. This change in paradigm allows the design of components with light weight and new functionalities that were unfeasible until a few years ago. Therefore, it is not surprising that many sectors—including automotive, aerospace, and automation—make extensive use of this technology [1]. The most widespread AM technique used to produce metal parts is laser powder bed fusion (L-PBF) thanks to the achievable geometrical definition and quality of the as-built products. In this process, the micrometric metal powder feedstock is first uniformly distributed on the building platform to form a thin layer (from about 20 to 60 µm) and then selectively melted by a high-energy laser beam. The molten pool quickly solidifies (at a rate of about 103–108 K/s), and a new layer of powder is distributed on top of the previous one. The layer-by-layer repetition of these micro-welding tracks allows for obtaining fully dense metal components [2].
Due to the intrinsic properties of low density, corrosion resistance, and good electrical and thermal conductivity, aluminum alloys are widely used for structural applications. Al-Si-based alloys (such as AlSi10Mg and AlSi7Mg) are particularly suitable for the L-PBF process since the high silicon content guarantees excellent printability [3,4,5,6]. Nevertheless, despite the quality of the printed products, Al-Si alloys cannot achieve remarkable mechanical properties. The need for high-performance materials drives research toward the development of high-strength aluminum alloys, mainly derived from the heat-treatable wrought 2xxx, 6xxx, and 7xxx series. However, these alloys possess limited L-PBF processability due to their hot-crack susceptibility. The wide solidification range of these alloys is the main reason for the formation of hot tears. Indeed, the liquidus–solidus temperature gap leads to extensive shrinkage of the solidifying grains and to the build-up of stresses at grain boundaries in the last stages of solidification, which in turn are responsible for the formation of cracks [7,8].
To overcome this problem, several strategies can be considered. The optimization of process parameters can mitigate the hot-cracking sensitivity [9,10]. In particular, the adoption of a preheated platform, a reduced scanning speed, and high laser power have positive effects on reducing the length and density of cracks, despite other problems that may arise, such as industrially unsustainable production times or the loss of volatile elements (Mg, Zn, and Li) [11,12]. Although process parameters optimization is a fundamental step before proceeding with the production of a component, it is usually not enough to completely solve the hot tearing problem. A widely used strategy to avoid the formation of hot-cracks consists of the modification of the original alloy, either by adding elements that increase the amount of liquid available in the last stages of solidification, by promoting eutectic formation [13], or by the introduction of nano-inoculants [14,15]. Generally, the latter approach is preferred since the eutectic formation implies a heavy change in the alloy chemical composition and affects the material properties. Conversely, even low contents of grain refiners are effective in forming inoculant particles during the early stages of solidification, acting as substrates for the heterogeneous nucleation of the α-Al grains. In this way, the columnar growth of coarse crystals is replaced by the equiaxial growth of fine grains within the molten pools, leading to the so-called columnar-to-equiaxed transition (CET). It has been demonstrated that the formation of fine equiaxed grains can better distribute elemental segregation and thermal stresses, thus suppressing the hot-cracking susceptibility of high-strength Al alloys [7,16]. Numerous studies showed that Al alloys can exploit elements such as Sc, Zr, and Ti to promote the formation of tri-aluminide precipitates Al3M (where M represents one or a combination of the above elements), which can act as effective nucleants, leading to crack-free parts [17,18,19,20,21,22,23,24,25].
Among the precipitation-strengthened Al alloys, the 2xxx series has been extensively studied in recent years. The high mechanical properties deriving from the precipitation of the strengthening phases such as the S-phase (Al2CuMg) and the θ-phase (Al2Cu) make Al-Cu-Mg alloys excellent candidates for structural applications. New alloys inspired by 2618, 2024, A201, and 2139 grades have been suitably re-designed in order to be processable by L-PBF [26,27,28,29,30,31]. Specifically, an Al-3.5Cu-4.0Mg-2.0Zr has been studied by Schuster et al. [32]. It was shown that a fraction of the Zr is originally found in the liquid melt forms as primary aluminides that effectively act as grain refiners, while the remaining fraction is trapped in the α-Al solid solution during rapid solidification. By a three-step heat treatment, the surplus of the dissolved Zr in the α-Al matrix precipitates as nano-sized particles contributing, simultaneously to the formation of the S-phase, to the overall material strength. Such alloy reached a microhardness of 1420 MPa and a yield strength (YS) of 340 MPa. Elambasseril et al. studied the 2139 alloy produced by L-PBF and concluded that the addition of AlTiB master alloy to the melt at the powder atomization stage positively affects the hot-crack susceptibility of the alloy upon L-PBF processing. However, despite the addition of such grain refiner, fully crack-free parts were obtained only with high volumetric energy densities (VED) > 1000 J/mm3, which, on the other hand, caused a substantial loss of Mg during printing [9].
In this work, an Al2139 alloy modified by the addition of Zr and Ti was investigated. The alloy represents a commercially available variant of the Al2139 alloy, specifically developed for the L-PBF process. Particular attention is given to the analysis of the microstructure, both in the as-built state and after specific heat treatment schedules, which were designed and optimized through CALPHAD simulations, calorimetric tests, and microhardness measurements. Finally, the microstructural changes induced by prolonged exposure at high temperatures are considered to simulate the high-temperature service of parts.

2. Materials and Methods

A 2139ZrTi Al alloy powder marketed by EOS with the composition given in Table 1 was studied [33]. The actual composition of the alloy, measured by energy dispersive X-ray spectrometry (EDS), is reported in the table together with the nominal composition.
The particle size distribution (PSD) of the powder was measured using a Malvern Morphologi 4 automatic imaging microscope. Several sets of 10 × 10 × 10 mm3 cubic samples, used for both the optimization of the process parameters and the following analyses, were produced using a 3DNT L-PBF system. The specimens were printed without any support structures directly on a non-preheated Al building platform. The L-PBF build chamber was flushed with Ar, and the residual oxygen level was kept lower than 0.2%. The optimization of printing parameters was performed through four jobs, selecting different layer thicknesses (t), namely, 25, 33, 40, and 50 μm. The laser power (P) was kept at 200 W in all jobs, while hatch distance (h) and laser scanning speed (v) were varied between 0.08 and 0.16 mm and between 600 and 1000 mm/s, respectively. Laser scanning direction was rotated by 67° after each layer completion. The measurement of the relative density of samples at 20 °C was determined by using Archimede’s method, using a Mettler Toledo ME analytical balance. The optimized parameters, allowing for a relative density exceeding 99.67%, were achieved for t, h, and v values of 25 mm, 0.12 mm, and 1000 mm/s, respectively, corresponding to a VED of 66.67 J/mm3.
The preliminary design of the heat treatment parameters was performed using the Thermo-Calc® software (using the TCAL8 v8.2 database for Al alloys) and subsequently optimized through differential scanning calorimetry (DSC) and experimental aging tests. A Setaram Labsys calorimeter was used for DSC analyses that were performed in an Ar atmosphere, using Al2O3 crucibles, and by setting a heating/cooling rate of 10 °C/min within the temperature range of 20–750 °C. The material response to different thermal treatments was monitored by Vickers microhardness tests performed with a load of 500 g and a dwell time of 15 s. Five microhardness measurements were performed in the mid-section of the samples, which were preliminarily ground down to 2500 grit paper.
A Nikon Eclipse LV150NL light optical microscope (LOM) and Zeiss Sigma 500 Field Emission Scanning Electron Microscope (FE-SEM) were equipped with the Oxford Instruments Ultim Max detector for EDS and electron backscattered diffraction (EBSD) detector mod. Oxford Instruments C-Nano was used for microstructure investigations. The preparation of samples for metallographic analyses consisted of grinding and polishing with a 50 nm colloidal silica solution, using an automatic machine. Chemical etching by Keller’s reagent was performed on selected samples.

3. Results and Discussion

3.1. Powder Characterization

The size distribution of the powder particles was measured on over 70,000 particles and returned D10 = 32.83 µm, D50 = 49.21 µm, and D90 = 68.98 µm. SEM analysis confirmed the measured size of the powder particles (Figure 1). On their surface, occasional satellites and additional surface layers partially covering the particles were detected. These layers, marked in Figure 1a with red arrows, are presumably caused by the impact of additional molten metal volumes on the surface of already solidified particles during the powder atomization process.
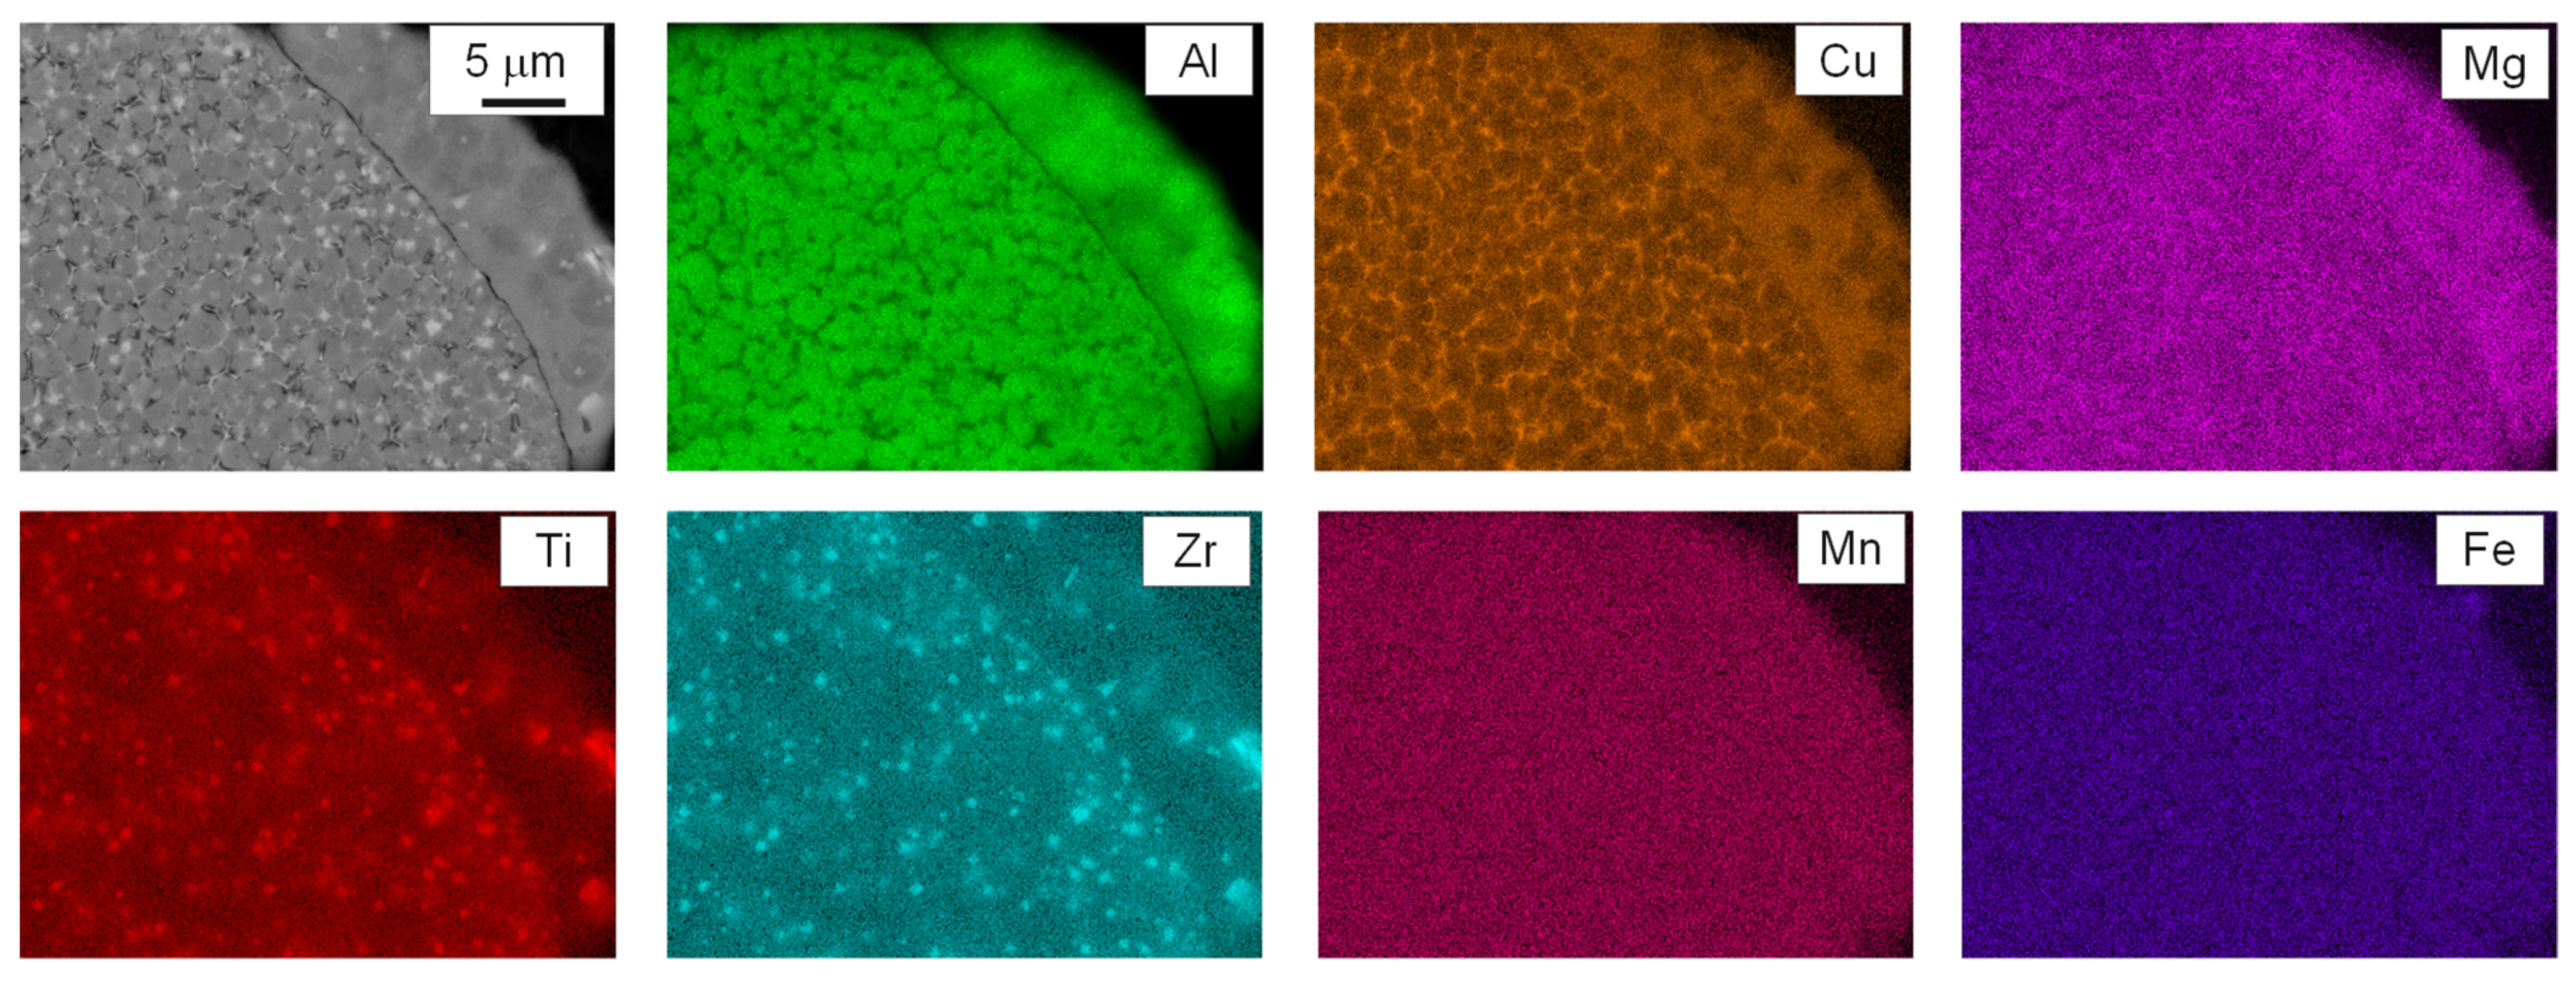
Representative micrograph and elemental maps of a 2139ZrTi powder particle section (Figure 2) show that Ti and Zr particles are homogeneously distributed within the Al grains. Cu and, to a lower extent, Mg appear mainly segregated at grain boundaries. All other alloying elements are homogeneously distributed within the particles. Moreover, in Figure 2, an additional layer deposited on the surface of the already solidified particle during the atomization process can be identified in the top right corner of the image.

3.2. As-Built Microstructure and Microhardness

Low-magnification LOM images taken from printed samples sectioned parallel to the building direction show the so-called fish-scale microstructure typical of L-PBF-processed materials (Figure 3a). The high density of the specimens printed with the optimized set of parameters (99.67%) is consistent with the presence of few gas pores dispersed within the microstructure, whereas no hot-cracks were detected. The EBSD analysis revealed an extremely fine microstructure consisting of equiaxed grains fully covering the inspected section of the samples. Therefore, it can be stated that CET was completely achieved in the investigated alloy owing to the powerful effects of Ti and Zr.
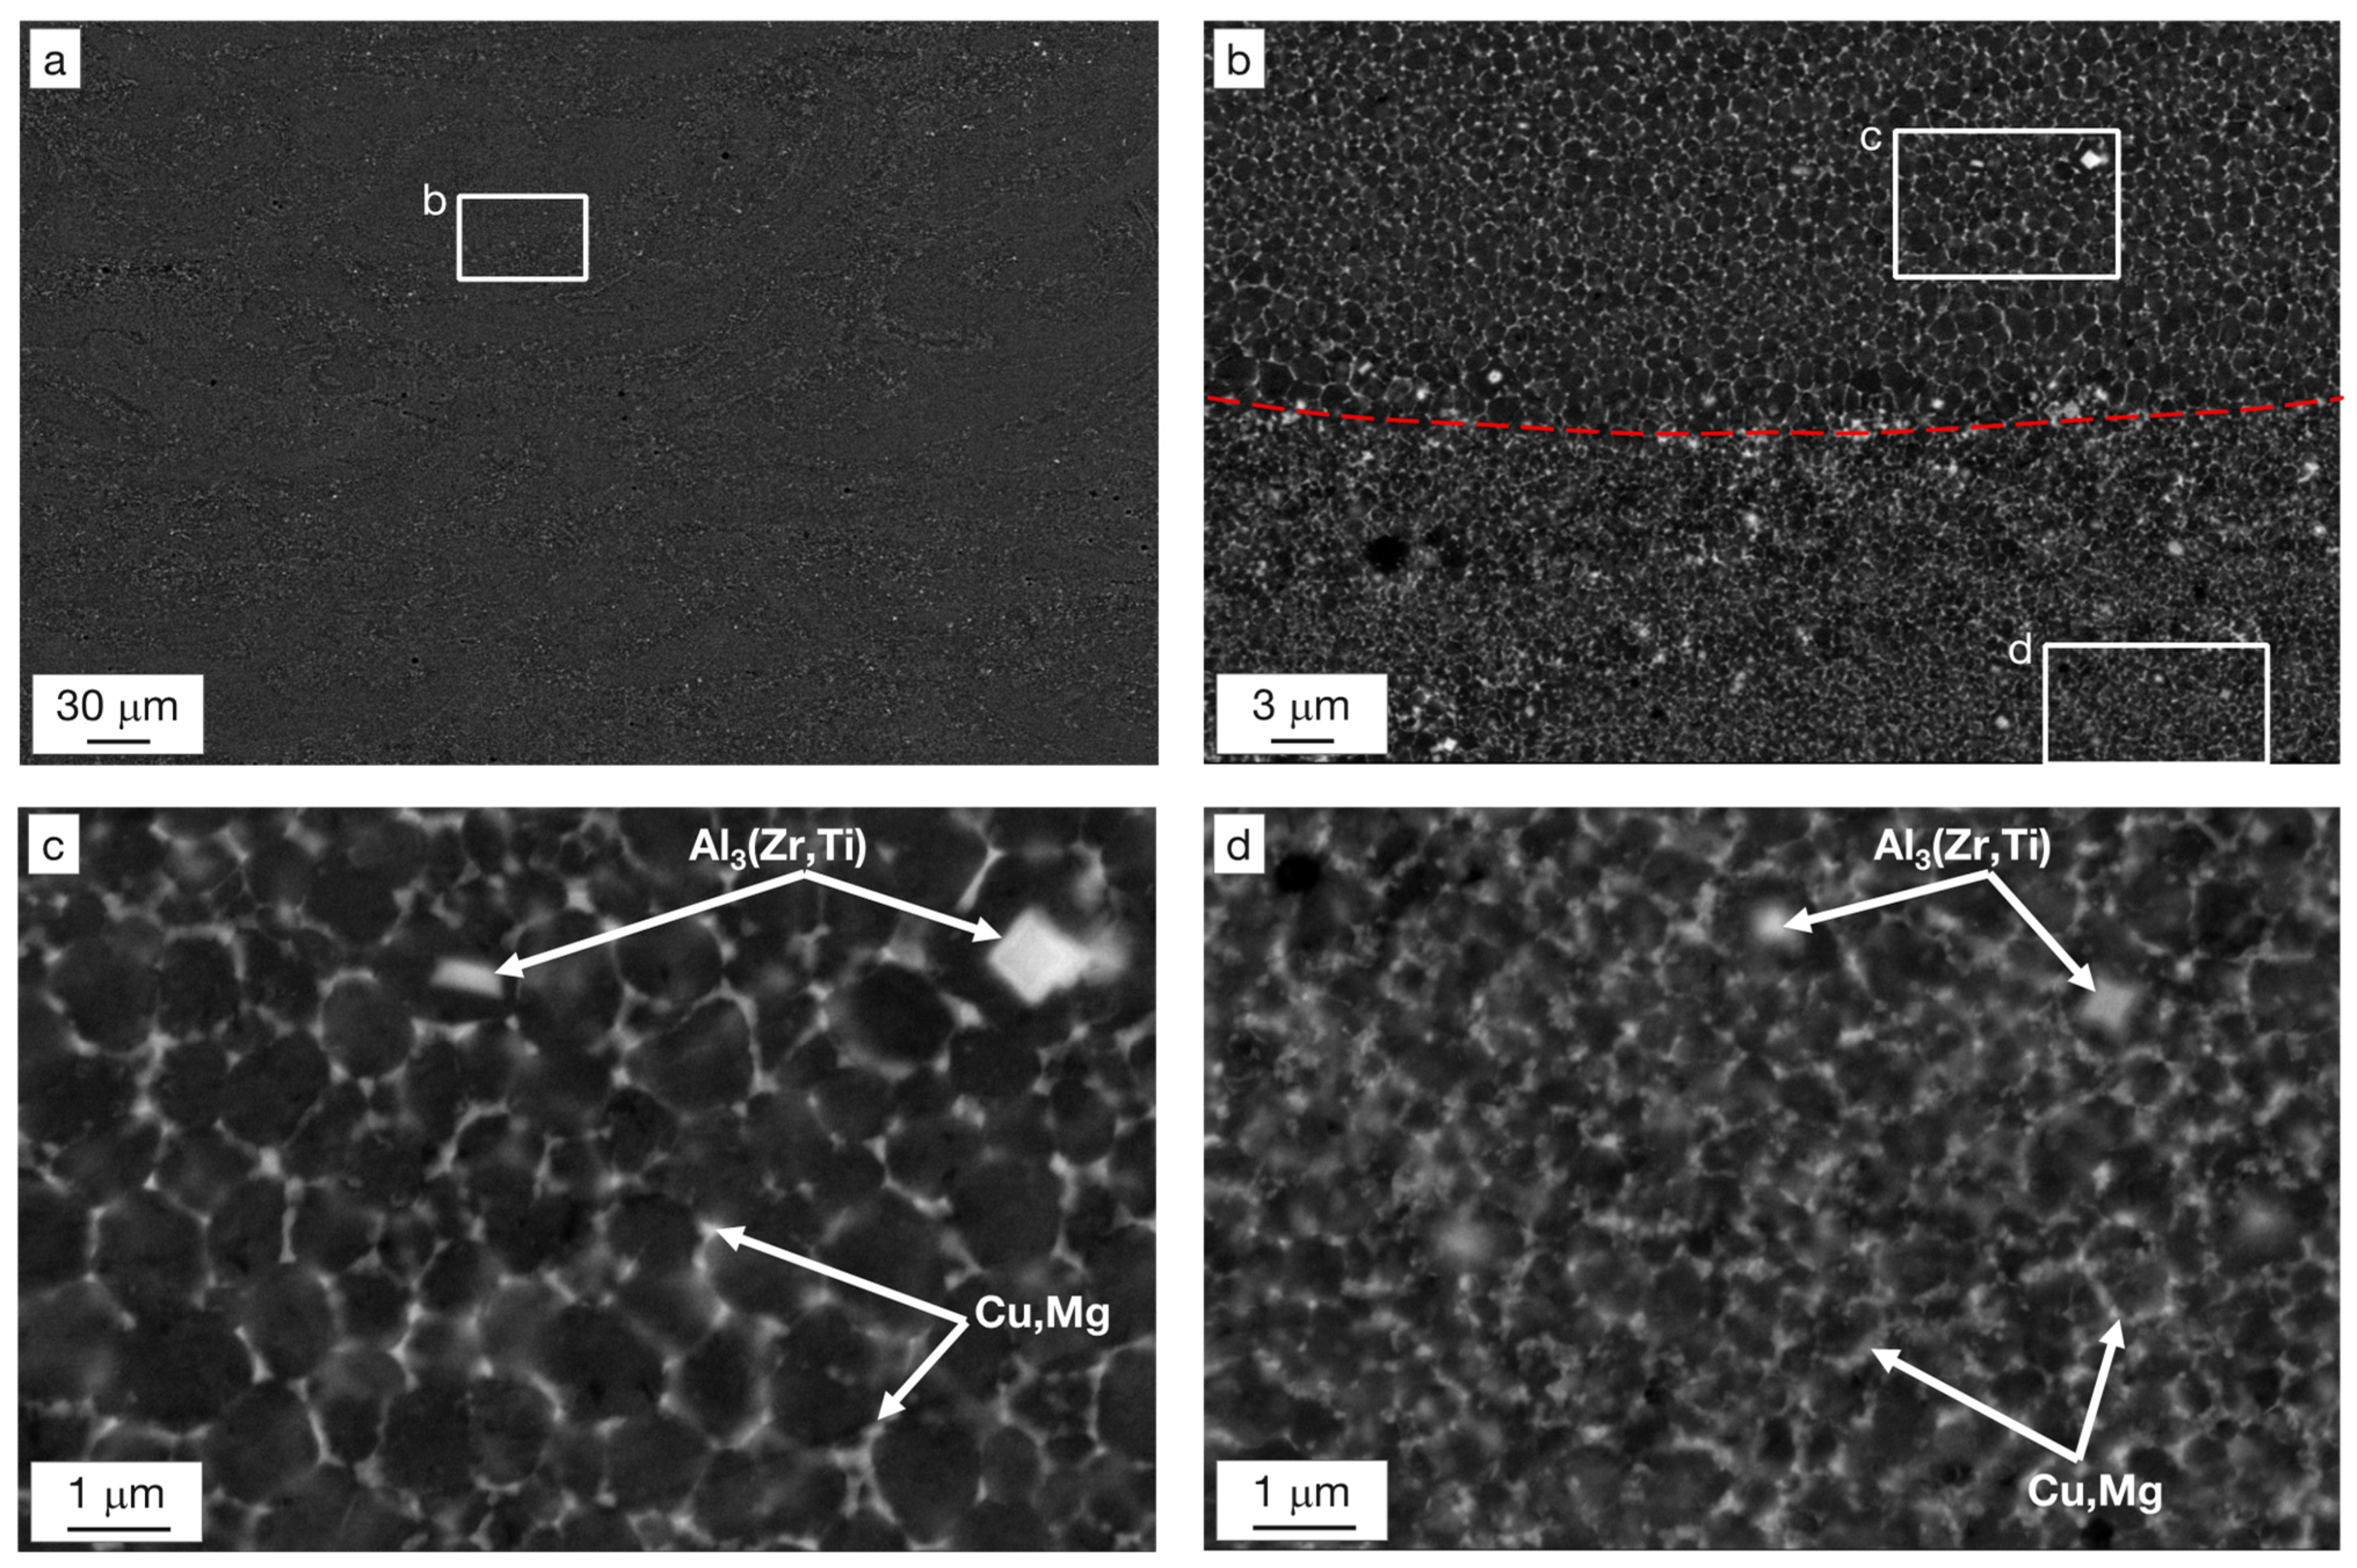
It is also noticed that the grain size follows a bimodal distribution. At the edge of the molten pools, the grains are slightly finer and possess diameters ranging from 300 to 600 nm. At the center of the melt pools, the grains are coarser, with sizes in the range of 0.8–2.0 μm (Figure 3b,c). SEM images taken at higher magnifications (Figure 4) show that several nanometric cuboidal particles rich in Zr and Ti are located at the centers of some grains. No significant difference in particle distribution and density was noted comparing the boundaries and centers of the melt pools. Numerous studies identified precipitates with the same size and morphology as Al3(Zr,Ti) primary inoculant particles, having an L12 crystalline structure, known to be coherent and with a low lattice mismatch with the α-Al matrix [24,31]. Cu- and Mg-rich micro-segregations decorate grain boundaries.
In as-built samples, EDS measurements collected on large areas generally provide a composition comparable to that of the starting nominal powder (Table 1), with a marginal difference in the measured Mg content (0.7 against 0.8% of the powder), which could be attributed to partial evaporation during L-PBF [12].
The microstructure of the 2139ZrTi Al alloy here investigated slightly differs from that found in other high-strength aluminum alloys containing Sc and Zr and processed by L-PBF, where a transition from equiaxed grains at the edge of the laser tracks to elongated grains oriented along the thermal gradient direction at the center of the molten pools is observed [18,34]. In both cases, the difference in grain size and shape can be related to different solidification conditions in terms of front growth rate and thermal gradient in the liquid melt. Small grains are mainly located at melt pool boundaries where the high cooling rate leads to a strong undercooling and high nucleation rate of α-Al grains. Moving toward the center of the melt pool, the nucleation rate reduces due to lower thermal gradients and the recalescence effect, and a competitive solidification mode takes place, leading to coarser grains and possibly to a transition toward columnar-shaped grains. The full suppression of columnar grains in the investigated 2139ZrTi alloy can be reasonably attributed to the high Zr and Ti contents used, which effectively act as inoculants even at the center of the melt pools. Conversely, high-strength aluminum alloys exhibiting columnar grain regions have a lower content of grain refiners [18,21,23,27]. A second effect playing a role in CET is brought by solute elements rejected into the liquid during solidification. Indeed, it is known that a wide undercooled region is an essential condition to suppress epitaxial growth and activate the inoculant particles as heterogeneous nucleation sites for grains ahead of the solidification front. The efficiency of solutes in promoting an extended constitutional undercooling region is usually quantified through the growth restriction factor (Q), which is based on solute concentration and its partition coefficient between solid and liquid phases [35] or on more accurate variants of it, also accounting for the actual thermal undercooling of the melt [36]. In Al alloys, Ti is appreciated in this perspective since it can form an additional Al3Ti layer on the surface of the inoculants that facilitate nucleation, while the remaining Ti in solution promotes an extremely high Q value [35].

3.3. Phase Stability and Heat Treatment Optimization

The Thermo-Calc ® simulations provided valuable hints for the design of the heat treatment of the investigated alloy. The sequence of phases that form from the liquid was calculated according to the Scheil–Gulliver model, which assumes no elemental diffusion inside the solid phase, complete mixing of the liquid, and equilibrium conditions at the solid–liquid interface. The results obtained based on the input of the EDS chemical composition given in Table 1 are summarized in Figure 5. It is predicted that at 1022 °C, the Al3Zr phase precipitates from the molten aluminum. Even though Thermo-Calc ® foresees the formation of the stable D023 phase, it has been reported in the literature that due to the high cooling rates during the L-PBF process, the metastable phase L12 might form instead [32].
These results are consistent with the cubic particles observed in the as-built microstructure that serve as nucleation sites for the growth of the α-Al grains (i.e., the FCC_A1 phase listed in Figure 5), which starts forming at 640 °C. Subsequently, other Mn- and Fe-based intermetallic phases are expected to grow—in particular, the Al6Mn, Al28Cu4Mn7, and Al7Cu2Fe compounds, followed by the θ-Al2Cu, the S-Al2CuMg, and the β-Mg2Si phases—which form during the last stage of solidification, at temperatures below 524 °C, and are therefore mainly expected at the grain boundaries.
Precipitation-strengthened Al alloys express their maximum potential in terms of mechanical properties after customized heat treatment. Generally, 2xxx alloys are subjected to a solution treatment performed to create a supersaturated solid solution and subsequent aging to stimulate the precipitation of nanometric strengthening particles, mainly consisting of the metastable precursors of the S- and θ-equilibrium phases.
The equilibrium phase stability was calculated against temperature, from RT up to 1100 °C, to determine the optimal temperature for the solution treatment. The data shown in Figure 6 confirm that the solidification process ends at 522 °C under equilibrium. Therefore, a solution-annealing temperature limited to 490 °C was conservatively established, which is also in accordance with powder producer specifications [33]. At 490 °C, the following transformations are reached: the complete dissolution of the S-phase in the Al matrix and the partial dissolution of the Al2Cu and Al3Ti_LT phases. Furthermore, the fraction of Ti and Zr trapped in the supersaturated solid solution is expected to form Al3M phases during the high-temperature soaking, contributing to material strengthening.
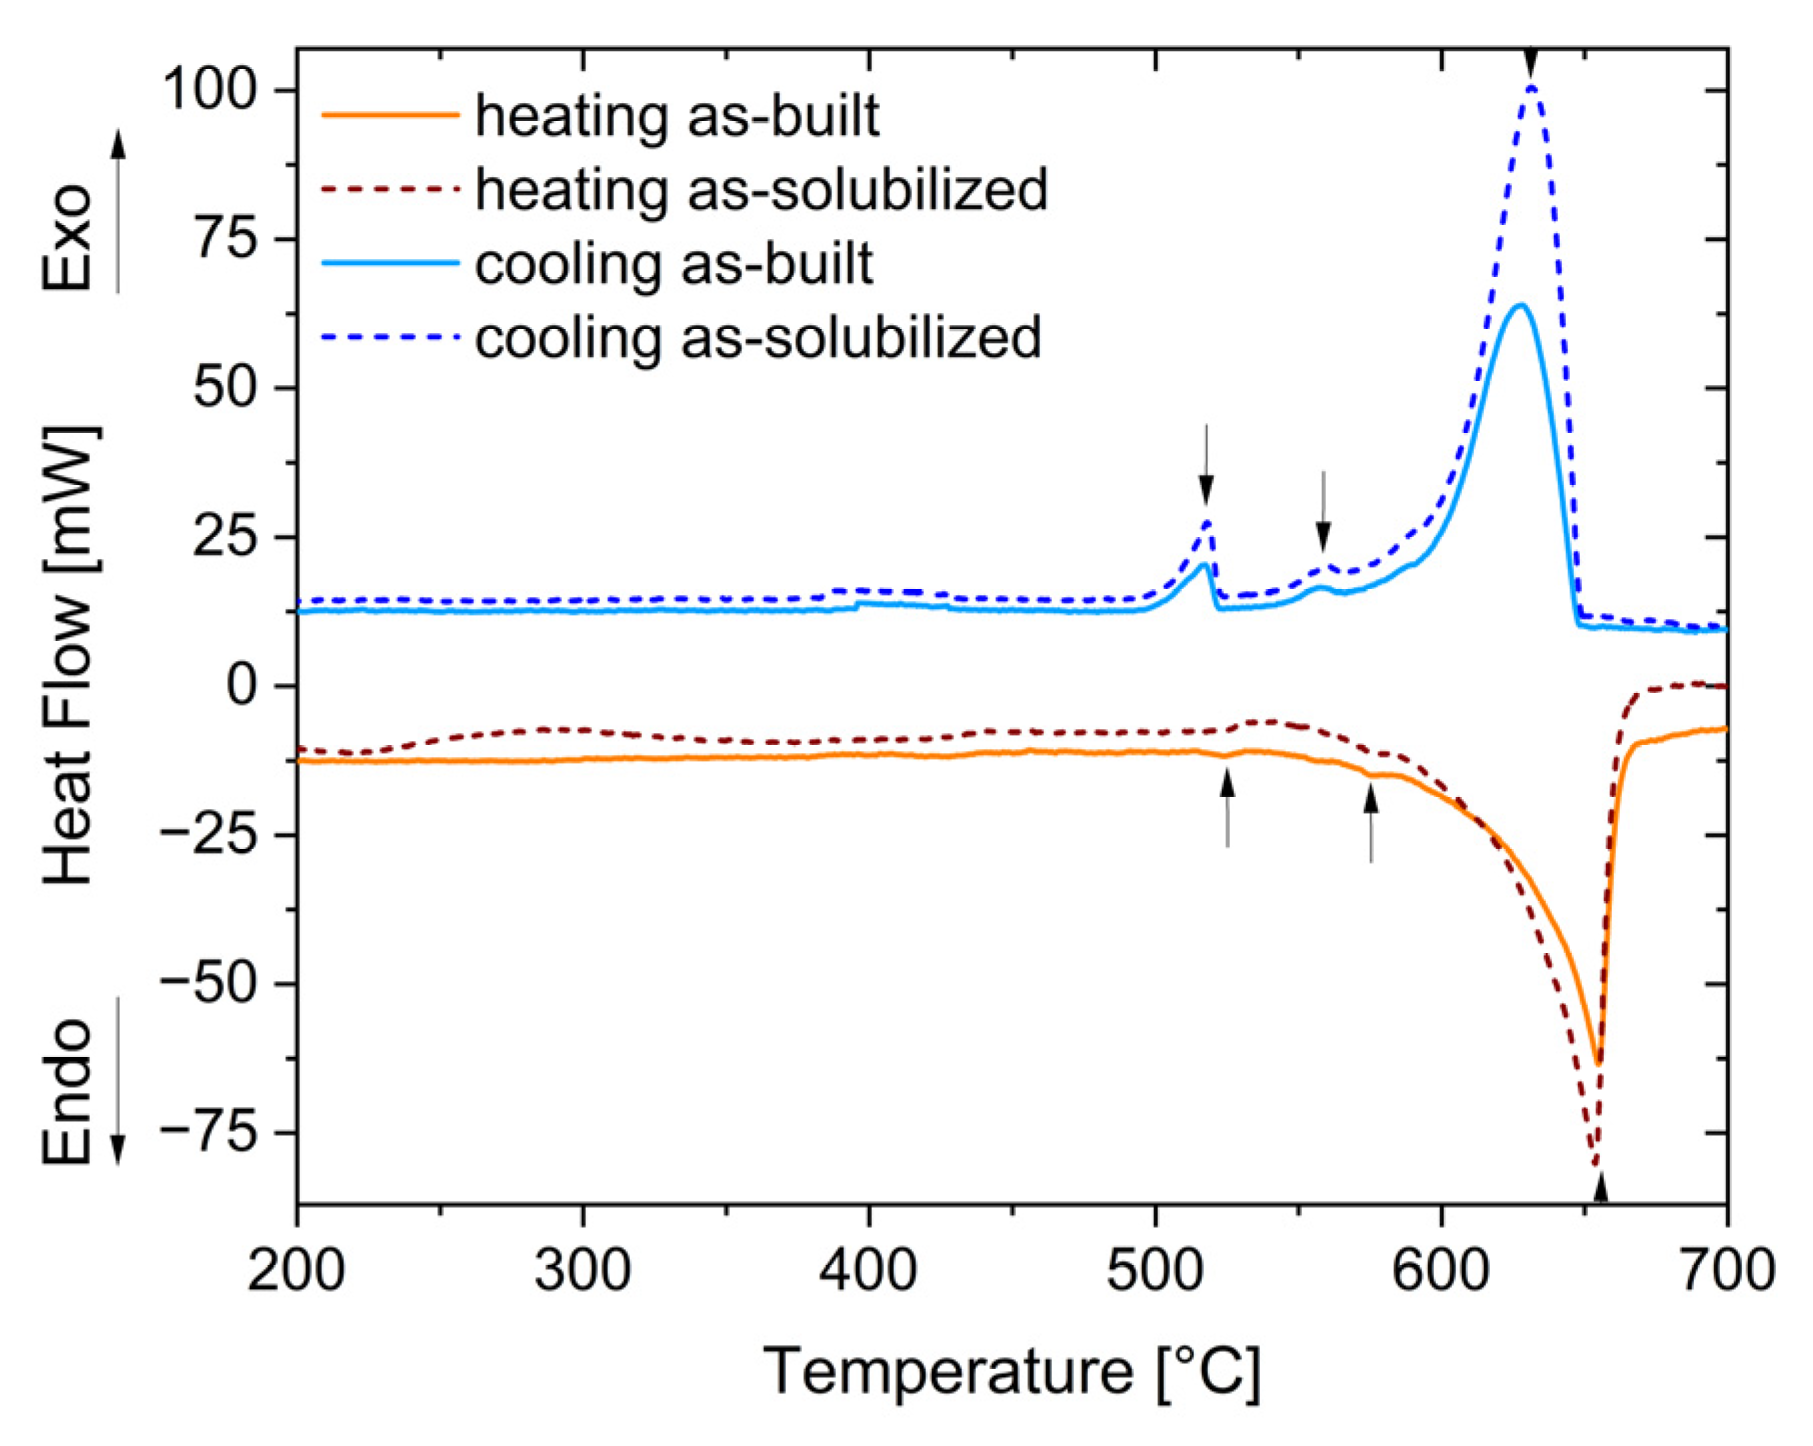
DSC measurements were performed on both as-built- and as-solution-annealed and quenched specimens. Figure 7 reports the heating and cooling curves of the samples. Gradually increasing the temperature of the as-built specimen (heating curves in Figure 7), two minor peaks followed by one main peak with much higher intensity are observed. The first peak located at 522 °C corresponds to the melting of the Al2Cu phase according to published studies [32,37]. The second peak at 575 °C is likely associated with the transition from the metastable to the stable Al3(Zr,Ti) phase [32]. The sharp endothermic peak at 655 °C is clearly related to the melting of the alloy [37]. The heating curve of the solution-annealed specimen displays an extended hump in the range of 220–320 °C, probably associated with the precipitation of the precursors of θ- and S-phases, while at high temperatures, it follows the trend of the as-built curve with the onset of the melting stage. For both samples, considering now the cooling curves, the solidification starts at 648 °C and ends at 495 °C. Other secondary exothermic peaks can be identified within the cooling stage in the solid range, presumably associated with the formation of the Al6Mn, Al28Cu4Mn7, and the Al2Cu intermetallics.
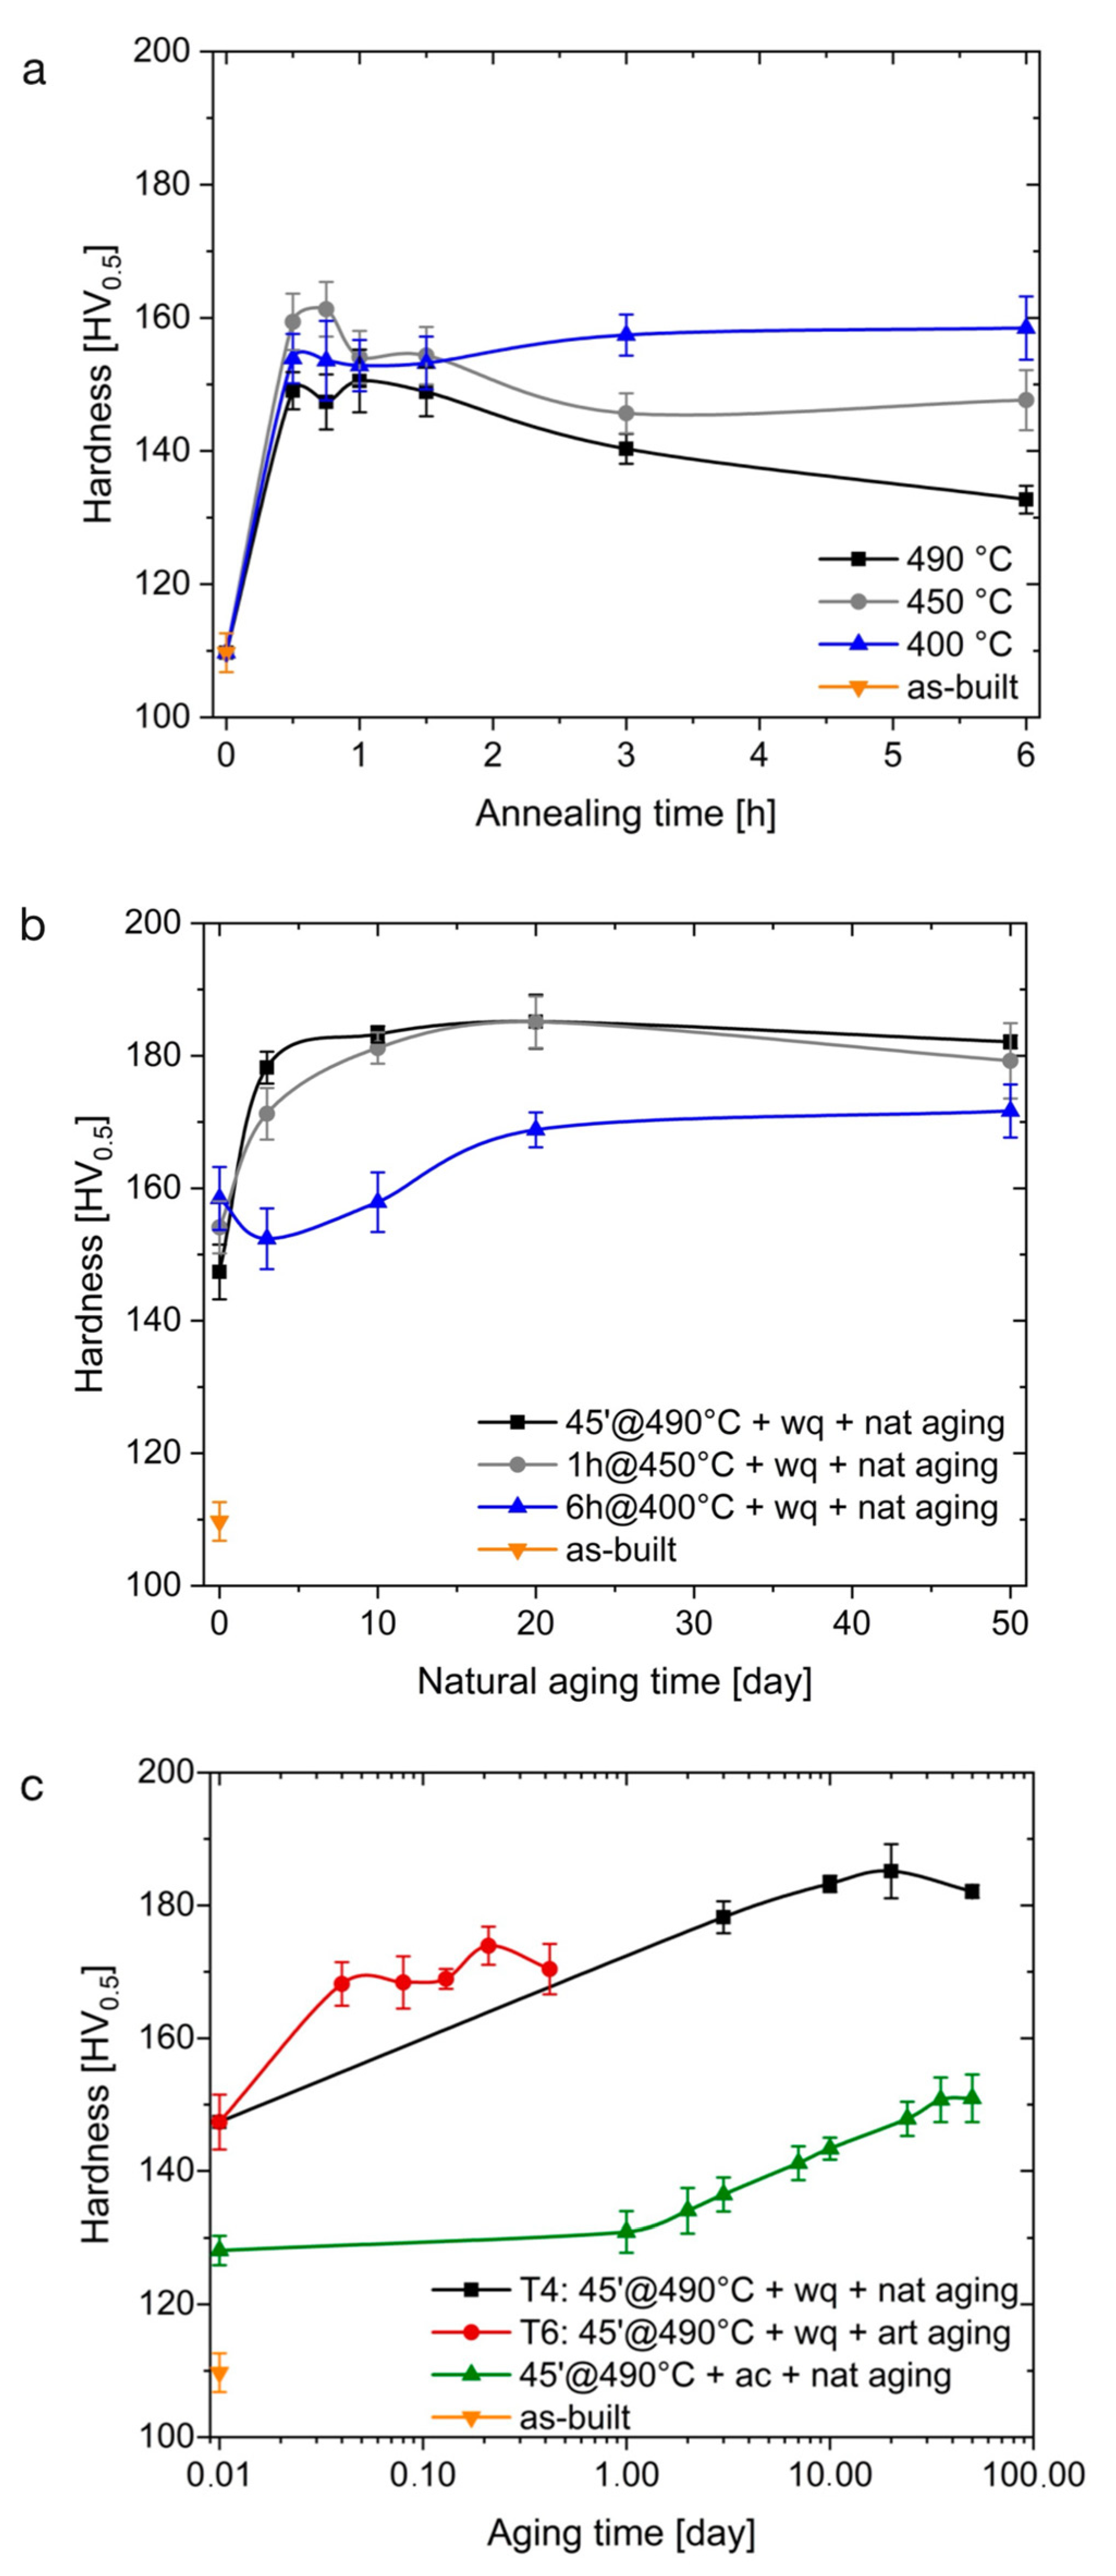
The strengthening achieved by different heat treatment routes was evaluated by microhardness tests. Three different annealing temperatures (400 °C, 450 °C, and 490 °C) and six holding times (30 min; 45 min; 1 h; 1 h 30 min; 3 h; and 6 h) were investigated to identify the best solution-annealing conditions. Figure 8a shows the results of the microhardness measurements performed immediately after water quenching. Considering the hardness of 109.7 HV0.5 of the as-built alloy and its evolution with the annealing time, it can be supposed that holding at high temperatures not only promotes the expected solubilization of part of the precipitated Mg and Cu but also the precipitation of further Al3Zr particles from the supersaturated solution inherited from rapid solidification, which results in a significant increase in hardness. This trend is consistent with the results provided by Shuster et al. [32] who studied a Zr-containing 2xxx series alloy. The hardening can already be noticed after 30 min of soaking time, indicating a rapid response of the material to the treatment. At 400 °C, the hardness value is maintained at around 150–160 HV0.5 regardless of the holding time. In contrast, the samples treated at 450 °C and 490 °C show a clear overaging effect after about one hour. Figure 8b shows the effect of the following natural aging (T4 temper), achieved by long holding times at room temperature, on material hardness measured on samples that had been subjected to the optimal annealing conditions at the different temperatures, i.e., 6 h at 400 °C; 1 h at 450 °C; and 45 min at 490 °C. The orange point in the graph at 109.7 HV0.5 indicates the reference value of the as-built state, whereas the values at t = 0 correspond to the hardness immediately recorded after water quenching from the annealing temperature. The curve at 400 °C shows the lowest increase in microhardness due to natural aging. This is consistent with the simulations, which showed that despite the material being soaked for 6 h during the treatment at 400 °C, the S-phase could not be fully dissolved. In contrast, a higher hardness is attained at both 450 °C and 490 °C as a result of the potentially larger aging response. Indeed, after long natural aging times, the microhardness values overlapped, reaching about 185 HV0.5.
The T6 condition, which implies artificial aging after the solution annealing, was also investigated considering samples annealed under optimal conditions at 490 °C and then exposed at 160 °C for times ranging from 45 min to 10 h. A hardness peak of 173.9 HV0.5 was achieved after 5 h, as depicted in Figure 8c. The comparison between the two aging treatments indicates that the T4 temper allows for achieving slightly higher hardness than the T6 one.
Finally, the effect of the cooling rate after the high-temperature annealing was investigated by comparing the microhardness evolution of the standard T4 samples with a sample treated for 45 min at 490 °C, subsequently air-cooled, and naturally aged. Right after the annealing treatment, the air-cooled sample reached a value of 128.1 HV0.5 as opposed to 147.4 HV0.5 of the water-cooled counterpart. After natural aging, the hardness of the air-cooled sample reached a peak of 150.7 HV0.5, about 35 HV0.5 lower than the peak-aged standard T4 sample. Furthermore, the kinetics of the natural aging process appears to be more sluggish after air cooling since the peak hardness was reached after 35 days, as opposed to 5 days for the conventional T4 temper, likely due to the lower supersaturation degree attained by air cooling.

3.4. T4 State and Overaging Effects

In this section, microstructural changes associated with the previously described thermal treatments are presented. In addition, the effects of overaging on the T4 temper are investigated.
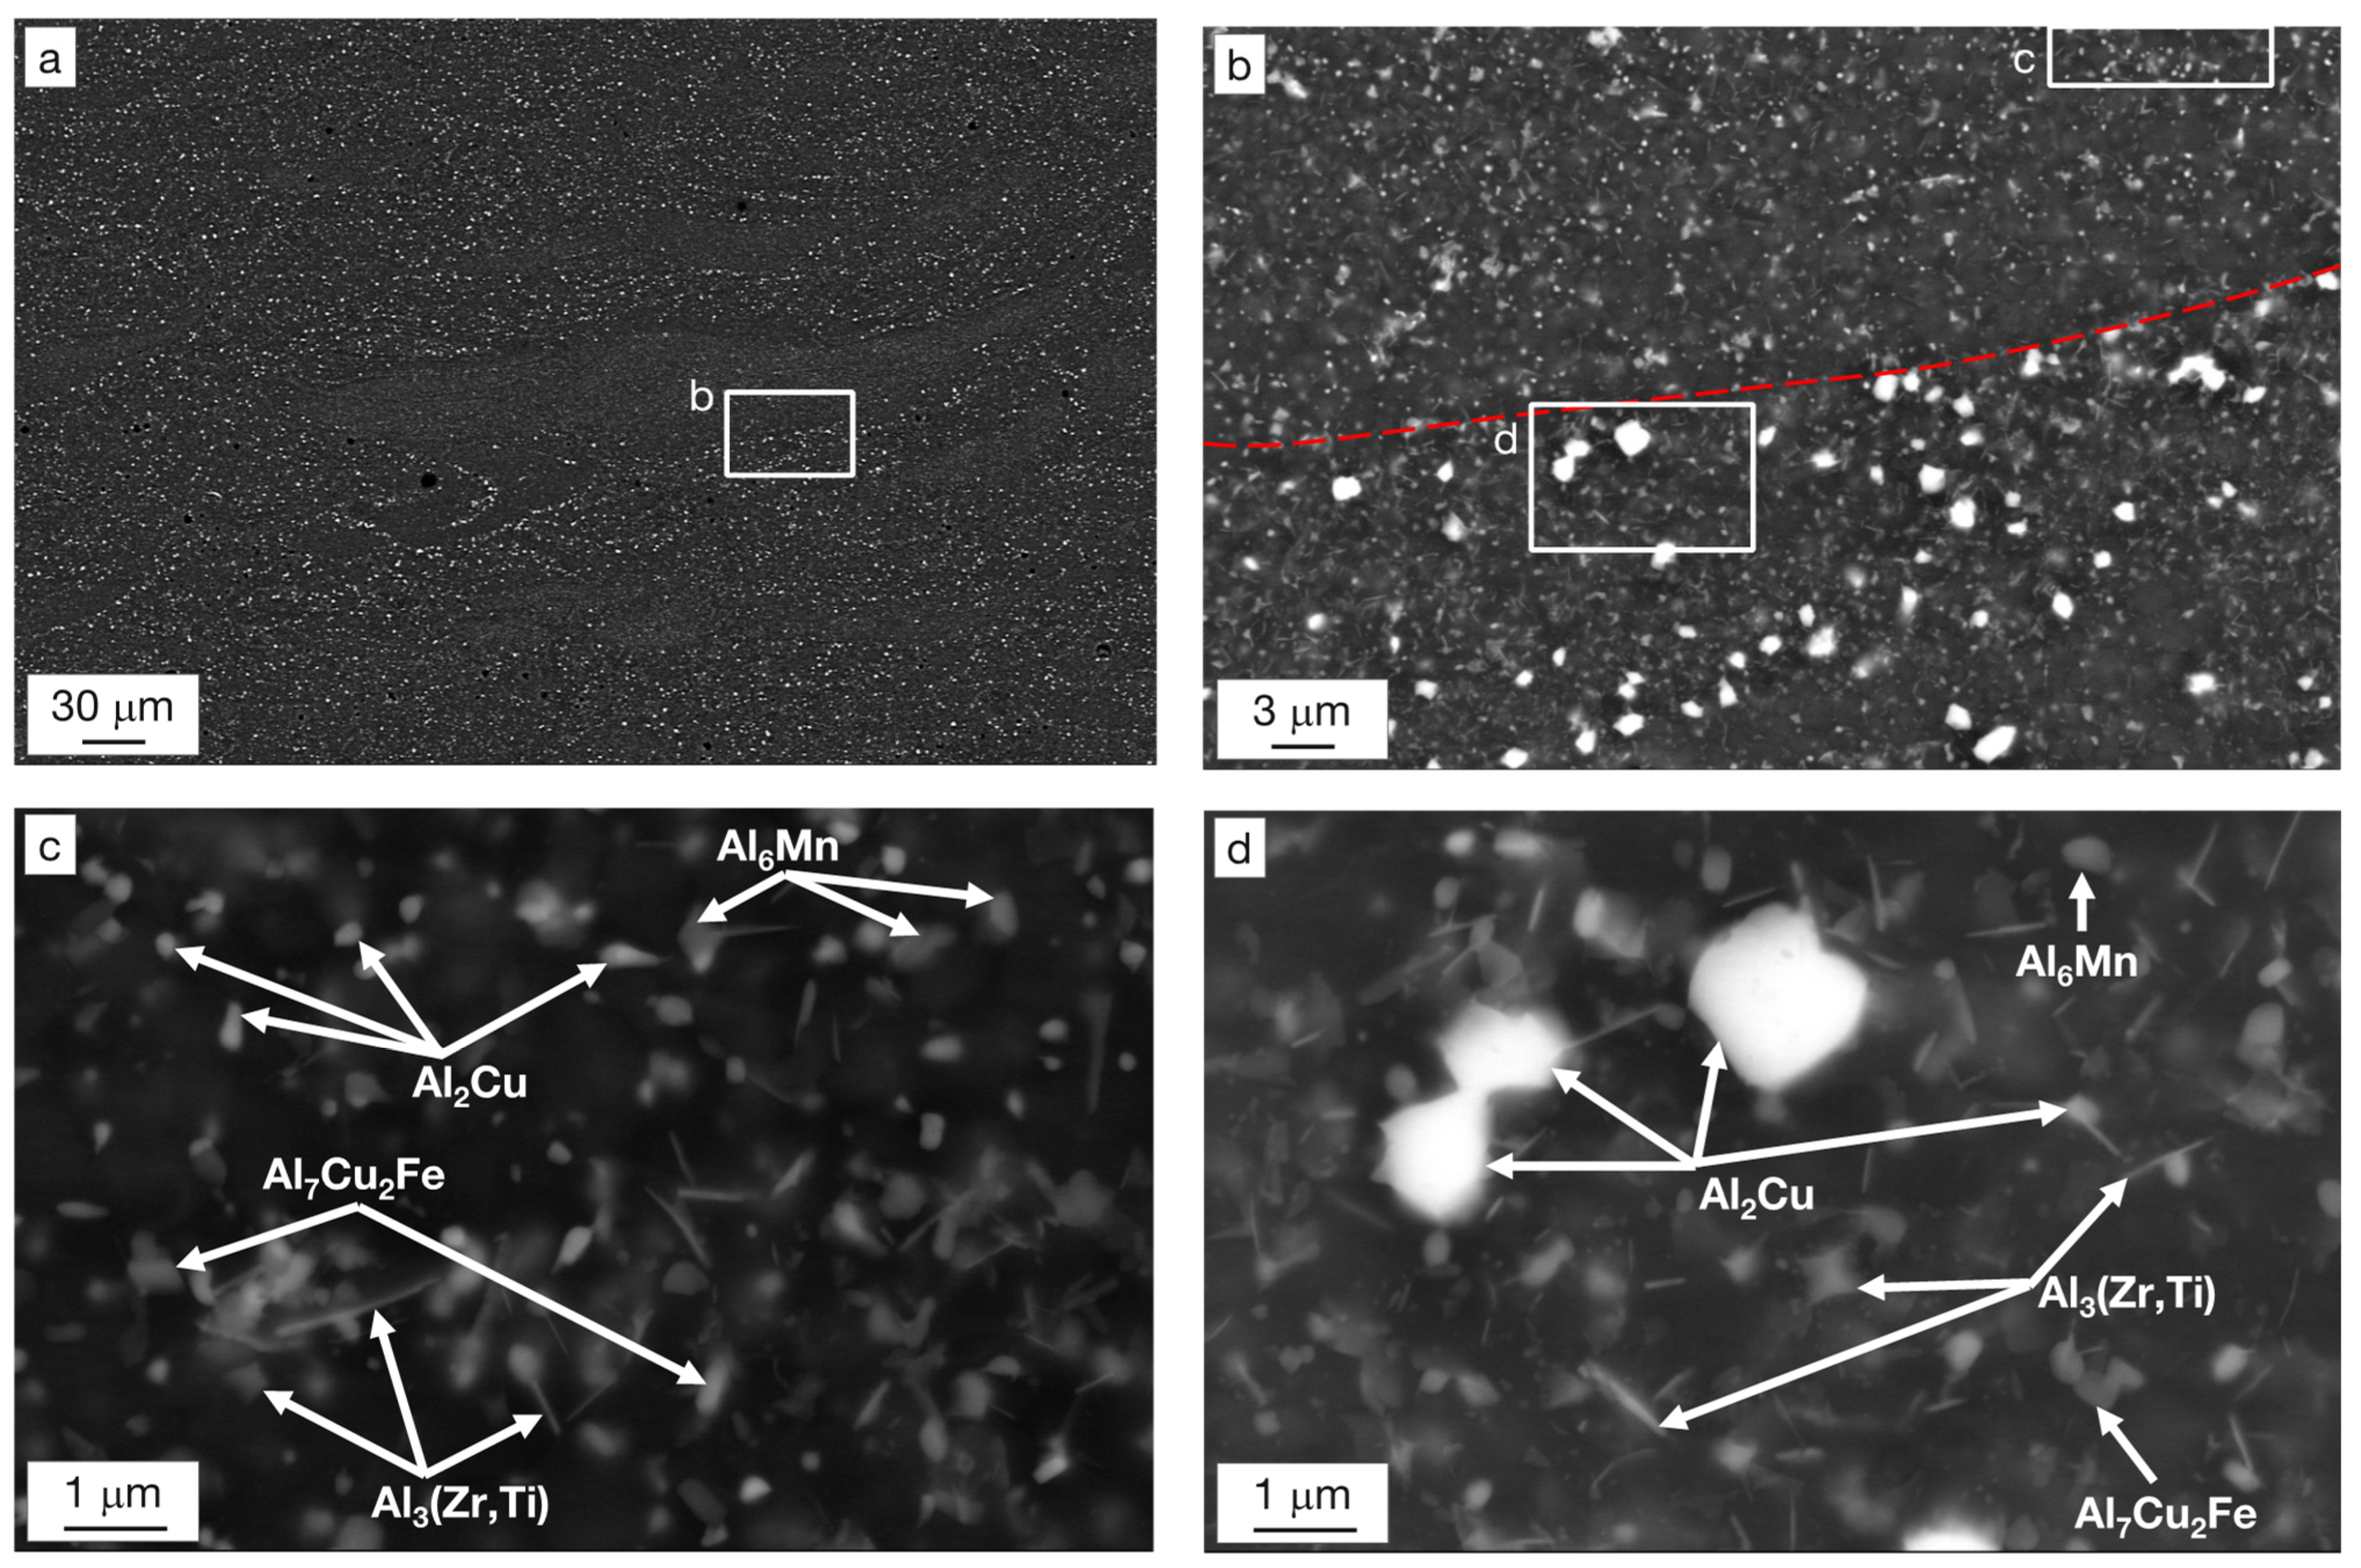
Representative micrographs of the T4-treated samples (Figure 9) show that the evidence of laser tracks is still slightly visible in low-magnification images. The copper-rich network observed in the as-built state is no longer noticeable, and the α-Al grains are now surrounded by a non-homogeneous distribution of bright spherical Al2Cu particles. Such particles are 0.5–1 μm in size and are mainly visible along the boundaries of the molten pools (Figure 9a,b). The primary Al3(Zr,Ti) particles maintained their cubic shape and size after solution annealing. As suggested above, the high-temperature treatment generated a second type of Zr- and Ti-based precipitates featuring a rod-like shape, about 1 μm in length, clearly visible in Figure 9c,d. A large fraction of particles about 100–300 nm in size are mainly distributed along the grain boundaries. These include Cu-, Mn-, and Fe-rich intermetallics, which are assumed to be Al2Cu, Al6Mn, and Al7Cu2Fe, respectively, according to the results of the simulation. From the SEM analysis, it was also possible to trace precipitates smaller than 80 nm arranged in the center of the grains, as depicted in Figure 9c,d. Although their composition could not be detected by EDS due to the small size, they are assumed to correspond to the expected nano-sized metastable S-phase and θ-phase precipitates [32,34]. In particular, according to Zhou et al., two forms of Al2Cu can form, i.e., the semicoherent θ’-Al2Cu and coherent Ω-phase, which are prone to nucleate in the aluminum planes {001}a and {111}a, respectively. The two precipitation sequences are SSSS → G.P. Zones (Cu) → θ’ {001}a → θ and SSSS → G.P Zone (Mg and Ag) → Ω {111}a → θ [38]. Although Mg and Ag are not apparently found in the Al2Cu precipitates, they are known to be fundamental elements for the Ω-phase formation, to the detriment of the θ’-phase, resulting in a higher strength of the alloy both at room and high temperatures due to the higher resistance to coarsening of the former phase [26,39]. Several studies report the optimal contents of Mg and Ag that promote the formation of Ω in Al-Cu alloys [38,40,41]. Given the amount of Mg (0.7 wt.%) and Ag (0.44 wt.%) in the 2139ZrTi alloy, it can be assumed that most of the nanoprecipitates arranged in the α-grains consistently correspond to the Ω-phase.
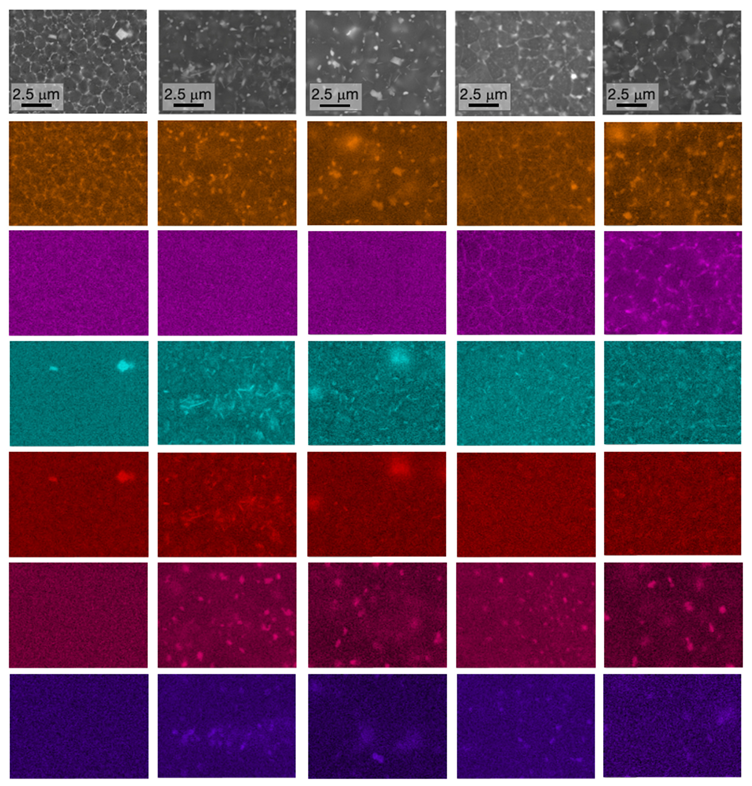
Since the 2139ZrTi alloy was designed for applications up to 250 °C, it is of particular interest to investigate the microstructural changes promoted by long holding times at the expected service temperatures [30]. Therefore, three samples treated to the T4 state were overaged for 50 h at temperatures of 150, 250, and 300 °C. The results show that prolonged exposure at 150 °C leads to a microhardness drop from 186.1 to 167.9 HV0.5. However, as shown by the microstructure and EDS maps collected in Table 2, this decrease is not associated with any significant change in microstructure at the investigated magnifications. Instead, holding at 250 °C leads to a net drop in hardness down to 119.3 HV0.5, corresponding to a loss of about 65 HV0.5, associated with evident changes in the microstructure. Cu and Mg accumulated at grain boundaries and formed particles with sizes in the range of 0.8–2.2 μm in the center of the molten pools, while at the edges of the pools, the changes were less noticeable. It must be considered that despite the long soaking time at elevated temperatures, the grain size increased only to a little extent. This limited growth can be attributed to the pinning effect of the precipitates decorating the grain boundaries. Indeed, the literature reports that thermally stable particles such as Al6Mn, Al7Cu2Fe, and Al3M have a beneficial effect also on grain growth restriction [20,42]. From micrographs and EDS maps, it is also evident that the number of rod-shaped Zr- and Ti-based particles decrease when increasing the holding temperature, whereas the features of the Mn- and Fe-rich constituents remained substantially unchanged. Finally, an increase in the soaking temperature to 300 °C leads to a further drop in the microhardness, reaching a value of 110.3 HV0.5, substantially corresponding to the hardness of the as-built state. Cu and Mg evolved from a grain boundary network to spheroidized nanometric particles, while the aspect of the other constituents remained comparable to that of the previously analyzed overaging at 250 °C.

4. Conclusions

The microstructural evolution of the commercial 2139ZrTi Al alloy, specifically developed for laser powder bed fusion, was investigated in the as-built state, after optimized T4 and T6 treatments and after overaging at high temperatures in the range of 150–300 °C, starting from the T4 condition. The following conclusions can be drawn from the investigation.
  • The as-built state featured an extremely fine and equiaxed bimodal microstructure with grains 300–600 nm in size at the boundaries of the melt pools and grains 0.8–2.0 μm in size at their center. A complete columnar-to-equiaxed transition was therefore achieved by virtue of the combined action of Zr and Ti. Cubic nucleants corresponding to the Al3(Zr,Ti) phase were observed at the center of grains, while segregation of Cu and Mg was measured at the grain boundaries. No evidence of hot-cracks was detected in the investigated samples.
  • A T4 treatment reached by holding the samples at 490 °C for 45 min, water quenching, and natural aging for at least 5 days allowed for achieving the highest microhardness value of 186.1 HV0.5. The T6 temper, consisting of the same solution-annealing treatment followed by artificial aging at 160 °C for 5 h, led to a microhardness of 173.9 HV0.5.
  • Immediately after water quenching, the measured increase in microhardness from 109.7 to 147.4 HV0.5 was mainly related to the precipitation of additional Zr- and Ti-rich secondary particles during the annealing treatment, as predicted by Thermo-Calc ® simulations.
  • The complex microstructure of the T4 temper was characterized by a large number of precipitates on the micrometer and sub-micrometer size scales. Coarse precipitates, 0.5–1 μm in size, corresponded to Al2Cu particles mainly disposed at the edge of the molten pools. Cubic precipitates of Al3(Zr,Ti) were observed at the center of the grains and were assumed to be the nucleants promoting their formation. Rod-shaped Al3(Zr,Ti) and quasi-spherical precipitates of about 100–300 nm rich in Cu, Mn, and Fe were arranged within the grains. Finally, particles smaller than 80 nm were assumed to be the expected Ω-phase (Al2Cu) strengthening precipitates.
  • Substantial microstructural changes occurred in T4 samples when held for 50 h at 250 °C, with evidence of Cu and Mg segregation at the grain boundaries and slight grain coarsening (reaching a size of 0.8–2.2 µm), which contributed to a decrease in microhardness (from 186.1 to 119.3 HV0.5). The exposure for 50 h at 300 °C led to a further decrease in hardness down to 110.3 HV0.5 and stimulated the spheroidization of Cu and Mg at the grain boundaries.

Author Contributions

Conceptualization, R.C. and M.V.; methodology, R.C. and M.V.; validation, R.C., S.M. and M.V.; investigation, F.L. and S.M.; writing—original draft preparation, F.L.; writing—review and editing, R.C., S.M. and M.V.; funding acquisition, R.C. and M.V. All authors have read and agreed to the published version of the manuscript.

Funding

This research received no external funding.

Institutional Review Board Statement

Not applicable.

Informed Consent Statement

Not applicable.

Data Availability Statement

The data presented in this study are available on request from the corresponding author.

Conflicts of Interest

The authors declare no conflict of interest.

References

  1. Pereira, T.; Kennedy, J.V.; Potgieter, J. A Comparison of Traditional Manufacturing vs Additive Manufacturing, the Best Method for the Job. In Procedia Manufacturing; Elsevier B.V.: Amsterdam, The Netherlands, 2019; Volume 30, pp. 11–18. [Google Scholar]
  2. Zhang, J.; Song, B.; Wei, Q.; Bourell, D.; Shi, Y. A Review of Selective Laser Melting of Aluminum Alloys: Processing, Microstructure, Property and Developing Trends. J. Mater. Sci. Technol. 2019, 35, 270–284. [Google Scholar] [CrossRef]
  3. Li, X.P.; Wang, X.J.; Saunders, M.; Suvorova, A.; Zhang, L.C.; Liu, Y.J.; Fang, M.H.; Huang, Z.H.; Sercombe, T.B. A Selective Laser Melting and Solution Heat Treatment Refined Al-12Si Alloy with a Controllable Ultrafine Eutectic Microstructure and 25% Tensile Ductility. Acta Mater. 2015, 95, 74–82. [Google Scholar] [CrossRef]
  4. Casati, R.; Hamidi Nasab, M.; Tirelli, V.; Vedani, M. Effect of Different Heat Treatment Routes on Microstructure and Mechanical Properties of AlSi7Mg, AlSi10Mg and Al-Mg-Zr-Sc Alloys Produced by Selective Laser Melting. In Proceedings of the EuroPM 2018, Bilbao, Spain, 14–18 October 2018; EPMA European Powder Metallurgy Association: Chantilly, France, 2018. Available online: https://www.epma.com/publications/euro-pm-proceedings/product/ep18-3992767 (accessed on 3 April 2023).
  5. Saravana Kumar, M.; Javidrad, H.R.; Shanmugam, R.; Ramoni, M.; Adediran, A.A.; Pruncu, C.I. Impact of Print Orientation on Morphological and Mechanical Properties of L-PBF Based AlSi7Mg Parts for Aerospace Applications. Silicon 2022, 14, 7083–7097. [Google Scholar] [CrossRef]
  6. Zhao, L.; Song, L.; Santos Macías, J.G.; Zhu, Y.; Huang, M.; Simar, A.; Li, Z. Review on the Correlation between Microstructure and Mechanical Performance for Laser Powder Bed Fusion AlSi10Mg. Addit. Manuf. 2022, 56, 102914. [Google Scholar] [CrossRef]
  7. Martin, J.H.; Yahata, B.D.; Hundley, J.M.; Mayer, J.A.; Schaedler, T.A.; Pollock, T.M. 3D Printing of High-Strength Aluminium Alloys. Nature 2017, 549, 365–369. [Google Scholar] [CrossRef]
  8. Dixit, S.; Liu, S. Laser Additive Manufacturing of High-Strength Aluminum Alloys: Challenges and Strategies. J. Manuf. Mater. Process. 2022, 6, 156. [Google Scholar] [CrossRef]
  9. Elambasseril, J.; Benoit, M.J.; Zhu, S.; Easton, M.A.; Lui, E.; Brice, C.A.; Qian, M.; Brandt, M. Effect of Process Parameters and Grain Refinement on Hot Tearing Susceptibility of High Strength Aluminum Alloy 2139 in Laser Powder Bed Fusion. Prog. Addit. Manuf. 2022, 7, 887–901. [Google Scholar] [CrossRef]
  10. Del Guercio, G.; Simonelli, M. Increasing the Build Rate of High-Strength Aluminium Alloys Produced by Laser Powder Bed Fusion. Opt. Laser Technol. 2023, 161, 109133. [Google Scholar] [CrossRef]
  11. Qi, Y.; Hu, Z.; Zhang, H.; Nie, X.; Zhang, C.; Zhu, H. High Strength Al–Li Alloy Development for Laser Powder Bed Fusion. Addit. Manuf. 2021, 47, 102249. [Google Scholar] [CrossRef]
  12. Li, G.; Li, X.; Guo, C.; Zhou, Y.; Tan, Q.; Qu, W.; Li, X.; Hu, X.; Zhang, M.X.; Zhu, Q. Investigation into the Effect of Energy Density on Densification, Surface Roughness and Loss of Alloying Elements of 7075 Aluminium Alloy Processed by Laser Powder Bed Fusion. Opt. Laser Technol. 2022, 147, 107621. [Google Scholar] [CrossRef]
  13. Belelli, F.; Casati, R.; Vedani, M. Effect of Cu Content on Hot-Crack Resistance of Al-Cu-Mg Alloys Produced by Laser Powder Bed Fusion. Philos Mag. Lett. 2022, 102, 111–119. [Google Scholar] [CrossRef]
  14. Belelli, F.; Casati, R.; Vedani, M.; Volpp, J. Design and Characterization of Al–Mg–Si–Zr Alloys with Improved Laser Powder Bed Fusion Processability. Metall. Mater. Trans. A Phys. Metall. Mater. Sci. 2022, 53, 331–343. [Google Scholar] [CrossRef]
  15. Belelli, F.; Casati, R.; Riccio, M.; Rizzi, A.; Kayacan, M.Y.; Vedani, M. Development of a Novel High-Temperature al Alloy for Laser Powder Bed Fusion. Metals 2021, 11, 35. [Google Scholar] [CrossRef]
  16. Knipling, K.E.; Dunand, D.C.; Seidman, D.N. Criteria for Developing Castable, Creep-Resistant Aluminum-Based Alloys-A Review. Z. Met. 2006, 97, 246–265. [Google Scholar] [CrossRef]
  17. Schmidtke, K.; Palm, F.; Hawkins, A.; Emmelmann, C. Process and Mechanical Properties: Applicability of a Scandium Modified Al-Alloy for Laser Additive Manufacturing. In Physics Procedia; Elsevier B.V.: Amsterdam, The Netherlands, 2011; Volume 12, pp. 369–374. [Google Scholar]
  18. Schimbäck, D.; Mair, P.; Bärtl, M.; Palm, F.; Leichtfried, G.; Mayer, S.; Uggowitzer, P.J.; Pogatscher, S. Alloy Design Strategy for Microstructural-Tailored Scandium-Modified Aluminium Alloys for Additive Manufacturing. Scr. Mater. 2022, 207, 114277. [Google Scholar] [CrossRef]
  19. Deillon, L.; Jensch, F.; Palm, F.; Bambach, M. A New High Strength Al–Mg–Sc Alloy for Laser Powder Bed Fusion with Calcium Addition to Effectively Prevent Magnesium Evaporation. J. Mater. Process. Technol. 2022, 300, 117416. [Google Scholar] [CrossRef]
  20. Geng, Y.; Tang, H.; Xu, J.; Zhang, Z.; Xiao, Y.; Wu, Y. Strengthening Mechanisms of High-Performance Al-Mn-Mg-Sc-Zr Alloy Fabricated by Selective Laser Melting. Sci. China Mater. 2021, 64, 3131–3137. [Google Scholar] [CrossRef]
  21. Hyer, H.; Zhou, L.; Park, S.; Huynh, T.; Mehta, A.; Thapliyal, S.; Mishra, R.S.; Sohn, Y. Elimination of Extraordinarily High Cracking Susceptibility of Aluminum Alloy Fabricated by Laser Powder Bed Fusion. J. Mater. Sci. Technol. 2022, 103, 50–58. [Google Scholar] [CrossRef]
  22. M4p StrengthAl Material Data Sheet. Available online: https://www.metals4printing.com/wp-content/uploads/datasheets/de/Al-Basis/m4p_Datenblatt_StrengthAl_DE.pdf (accessed on 3 April 2023).
  23. Belelli, F.; Casati, R.; Andrianopoli, C.; Cuccaro, F.; Vedani, M. Investigation and Characterization of an Al-Mg-Zr-Sc Alloy with Reduced Sc Content for Laser Powder Bed Fusion. J. Alloys Compd. 2022, 924, 166519. [Google Scholar] [CrossRef]
  24. Addalloy NanoAl Material Data Sheet. Available online: https://www.nanoal.com/addalloy-powder-additive-manufacturing (accessed on 3 April 2023).
  25. Griffiths, S.; Rossell, M.D.; Croteau, J.; Vo, N.Q.; Dunand, D.C.; Leinenbach, C. Effect of Laser Rescanning on the Grain Microstructure of a Selective Laser Melted Al-Mg-Zr Alloy. Mater. Charact. 2018, 143, 34–42. [Google Scholar] [CrossRef]
  26. Belelli, F.; Casati, R.; Larini, F.; Riccio, M.; Vedani, M. Investigation on Two Ti–B Reinforced Al Alloys for Laser Powder Bed Fusion. Mater. Sci. Eng. A 2021, 808, 140944. [Google Scholar] [CrossRef]
  27. Li, G.; Brodu, E.; Soete, J.; Wei, H.; Liu, T.; Yang, T.; Liao, W.; Vanmeensel, K. Exploiting the Rapid Solidification Potential of Laser Powder Bed Fusion in High Strength and Crack-Free Al-Cu-Mg-Mn-Zr Alloys. Addit. Manuf. 2021, 47, 102210. [Google Scholar] [CrossRef]
  28. A20X Eckart Material Data Sheet. Available online: https://www.eckart.net/us/en/am/a20x (accessed on 3 April 2023).
  29. Barode, J.; Vayyala, A.; Virgillito, E.; Aversa, A.; Mayer, J.; Fino, P.; Lombardi, M. Revisiting Heat Treatments for Additive Manufactured Parts: A Case Study of A20X Alloy. Mater. Des. 2023, 225, 111566. [Google Scholar] [CrossRef]
  30. Rometsch, P.A.; Zhu, Y.; Wu, X.; Huang, A. Review of High-Strength Aluminium Alloys for Additive Manufacturing by Laser Powder Bed Fusion. Mater. Des. 2022, 219, 110779. [Google Scholar] [CrossRef]
  31. Leirmo, J.L. High Strength Aluminium Alloys in Laser-Based Powder Bed Fusion—A Review. In Procedia CIRP; Elsevier B.V.: Amsterdam, The Netherlands, 2021; Volume 104, pp. 1747–1752. [Google Scholar]
  32. Schuster, M.; De Luca, A.; Mathur, A.; Hosseini, E.; Leinenbach, C. Precipitation in a 2xxx Series Al-Cu-Mg-Zr Alloy Fabricated by Laser Powder Bed Fusion. Mater. Des. 2021, 211, 110131. [Google Scholar] [CrossRef]
  33. EOS Aluminium Al2139 AM Material Data Sheet. Available online: https://www.eos.info/en/3d-printing-materials/metals/aluminum-al (accessed on 3 April 2023).
  34. Croteau, J.R.; Griffiths, S.; Rossell, M.D.; Leinenbach, C.; Kenel, C.; Jansen, V.; Seidman, D.N.; Dunand, D.C.; Vo, N.Q. Microstructure and Mechanical Properties of Al-Mg-Zr Alloys Processed by Selective Laser Melting. Acta Mater. 2018, 153, 35–44. [Google Scholar] [CrossRef]
  35. Zhang, D.; Prasad, A.; Bermingham, M.J.; Todaro, C.J.; Benoit, M.J.; Patel, M.N.; Qiu, D.; Stjohn, D.H.; Qian, M.A.; Easton, M.A. Grain Refinement of Alloys in Fuson-Based Additive Manufacturing Processes. Metall. Mater. Trans. A 2020, 51A, 4341–4359. [Google Scholar] [CrossRef]
  36. Fan, Z.; Gao, F.; Zhou, L.; Lu, S.Z. A new Concept for Growth Restriction during Solidification. Acta Mater. 2018, 152, 248–252. [Google Scholar] [CrossRef]
  37. Zhang, D.; Atkinson, H.V.; Dong, H.; Zhu, Q. Differential Scanning Calorimetry (DSC) and Thermodynamic Prediction of Liquid Fraction vs Temperature for Two High-Performance Alloys for Semi-Solid Processing (Al-Si-Cu-Mg (319s) and Al-Cu-Ag (201)). Metall. Mater. Trans. A Phys. Metall. Mater. Sci. 2017, 48, 4701–4712. [Google Scholar] [CrossRef]
  38. Zhou, Y.; Liu, Z.; Bai, S.; Ying, P.; Lin, L. Effect of Ag Additions on the Lengthening Rate of Ω Plates and Formation of σ Phase in Al-Cu-Mg Alloys during Thermal Exposure. Mater. Charact. 2017, 123, 1–8. [Google Scholar] [CrossRef]
  39. Xiao, D.H.; Wang, J.N.; Ding, D.Y.; Chen, S.P. Effect of Cu Content on the Mechanical Properties of an Al-Cu-Mg-Ag Alloy. J. Alloys Compd. 2002, 343, 77–81. [Google Scholar] [CrossRef]
  40. Chen, J.; Ling, K.; Deng, P.; Mo, W.; Tang, C.; Ouyang, Z.; Luo, B.; Bai, Z. Effect of Mg Content on Microstructure, Mechanical Properties and Intergranular Corrosion Properties of Al-Cu-Mg-Ag Alloys. Mater. Today Commun. 2023, 34, 105363. [Google Scholar] [CrossRef]
  41. Bai, S.; Zhou, X.; Liu, Z.; Xia, P.; Liu, M.; Zeng, S. Effects of Ag Variations on the Microstructures and Mechanical Properties of Al-Cu-Mg Alloys at Elevated Temperatures. Mater. Sci. Eng. A 2014, 611, 69–76. [Google Scholar] [CrossRef]
  42. Rakhmonov, J.U.; Vo, N.Q.; Croteau, J.R.; Dorn, J.; Dunand, D.C. Laser-Melted Al-3.6Mn-2.0Fe-1.8Si-0.9Zr (Wt%) Alloy with Outstanding Creep Resistance via Formation of α-Al(FeMn)Si Precipitates. Addit. Manuf. 2022, 60, 103285. [Google Scholar] [CrossRef]
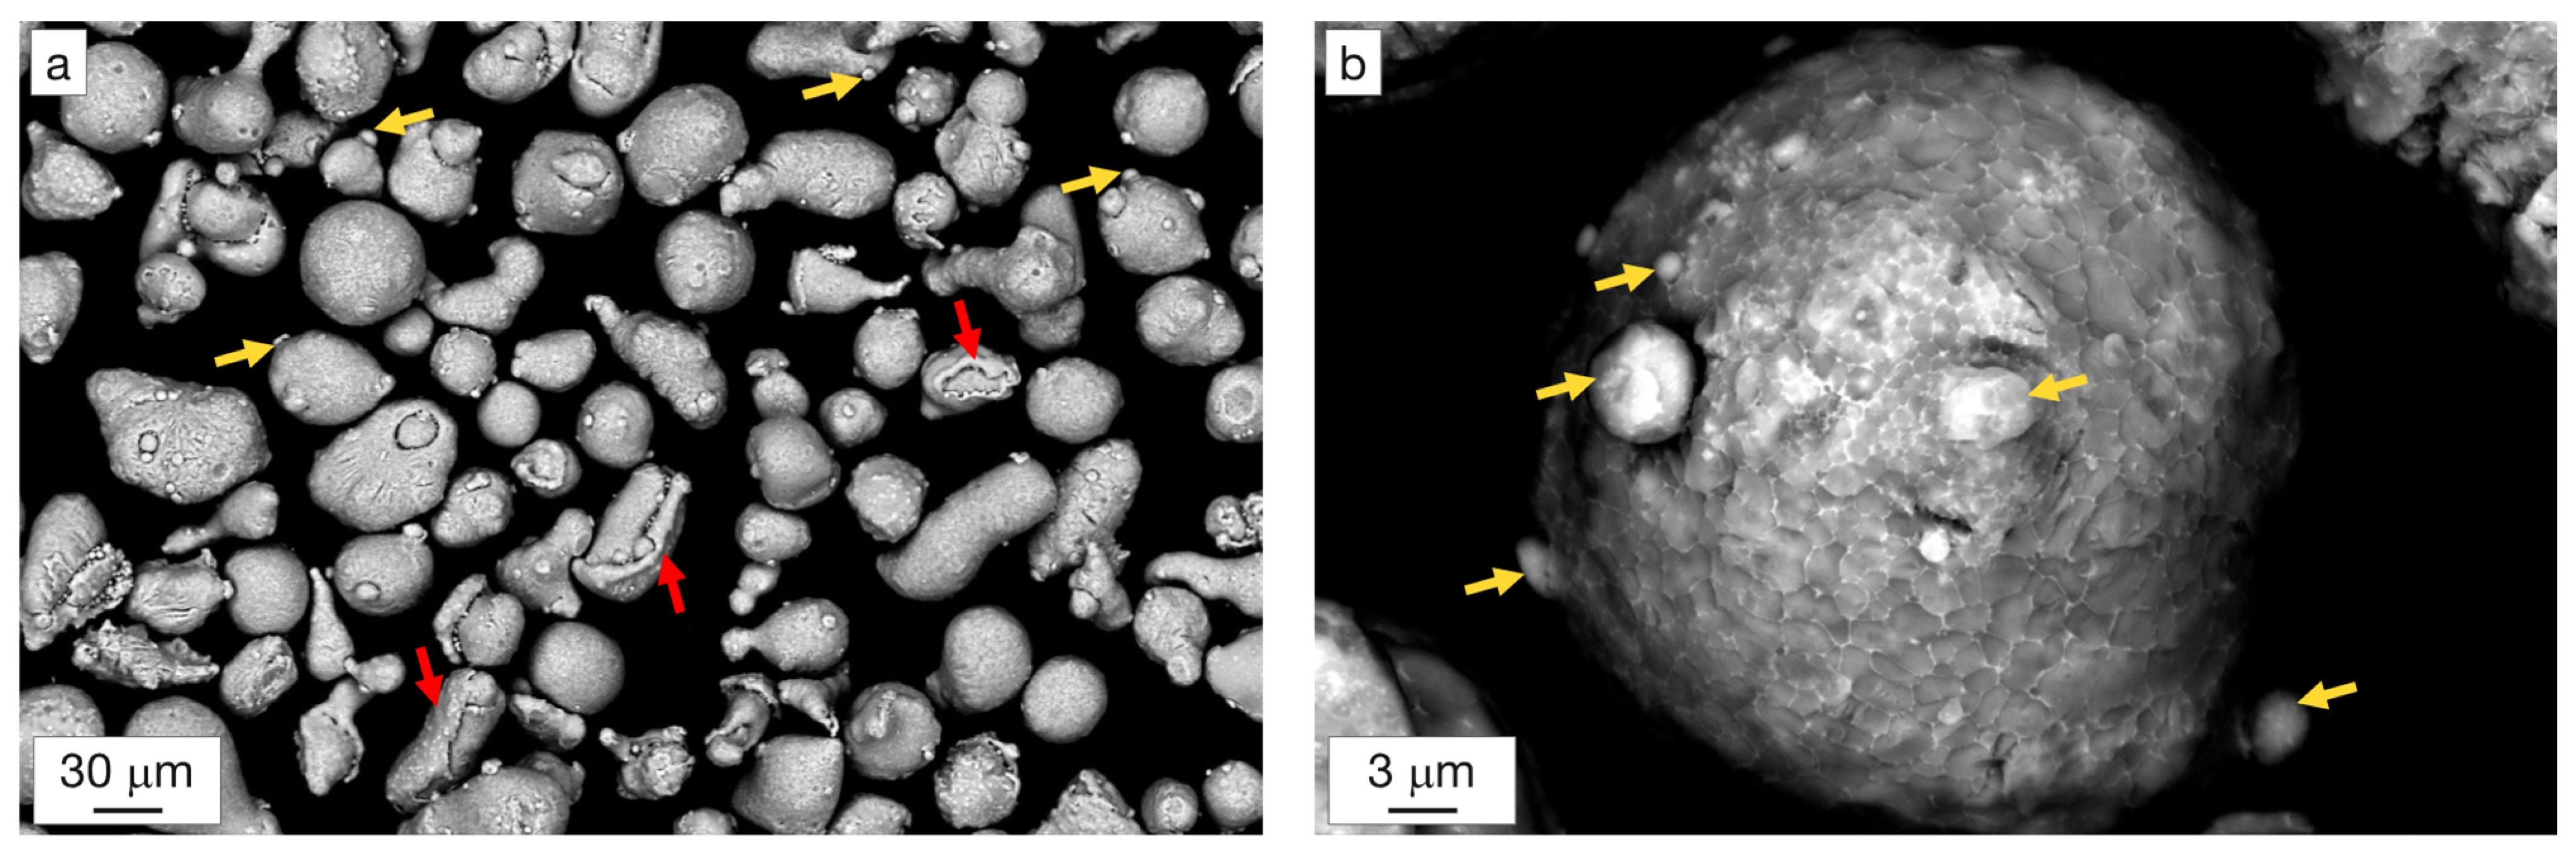
Figure 1. SEM images of the 2139ZrTi powder at (a) low and (b) high magnifications. Red arrows show partially covering layers deposited on pre-existing particles, and yellow arrows show the presence of satellites.
Metals 13 00924 g001
Figure 2. Microstructure and EDS elemental maps of a powder particle section whose surface is partially coated with an additional layer deposited after the powder particle solidification.
Metals 13 00924 g002
Figure 3. Microstructure of the vertical section of as-built sample after chemical etching with Keller’s reagent (a). LOM image and EBSD orientation maps (b) including (c) in the area straddling two laser tracks.
Metals 13 00924 g003
Figure 4. SEM images of as-built sample (vertical sections) captured at various magnification levels. (a) General view, (b) microstructure of the area outlined in (a), (c,d) high-magnification views of the areas outlined in (b). The dashed red line in (b) indicates the edge of the molten pool.
Metals 13 00924 g004
Figure 5. Sequence of phases formed upon solidification according to the Scheil–Gulliver model (the dashed line represents solidification under equilibrium conditions).
Metals 13 00924 g005
Figure 6. Stability of phases of the 2139ZrTi alloy against temperature, under equilibrium. (a) General plot and (b) magnified left-bottom corner to highlight secondary phases.
Metals 13 00924 g006
Figure 7. DSC curves collected on heating and cooling the samples in the as-built and in the as-solution-annealed states. Arrows indicate minor and main peaks.
Metals 13 00924 g007
Figure 8. Microhardness evolution as a function of time (a) during the high-temperature annealing, (b) during natural aging followed by the optimal annealing, and (c) during aging, either natural or artificial under different starting conditions.
Metals 13 00924 g008
Figure 9. SEM images of T4-treated sample (vertical section) captured at various magnifications. (a) General view, (b) microstructure of the area outlined in (a), (c,d) high-magnification views of the areas outlined in (b). The dashed red line in (b) indicates the boundary of the molten pool.
Metals 13 00924 g009
Table 1. Nominal [33] and measured composition (in weight %) of the 2139ZrTi alloy.
AlCrCuFeMgMnSiZnAgVTiZr
NominalBal.<0.054.5–5.5<0.15>0.80.2–0.6<0.1<0.250.15–0.60<0.05Ti + Zr < 4.0
MeasuredBal.0.025.410.110.700.570.04-0.44-1.081.80
Table 2. Microhardness and representative SEM and EDS maps of the 2139ZrTi specimens in five different conditions: as built, T4 state, and T4 state overaged for 50 h at temperatures of 150, 250, and 300 °C.
As-BuiltT4T4 + 50 h @
150 °C
T4 + 50 h @
250 °C
T4 + 50 h @ 300 °C
HV0.5109.7186.1167.9119.3110.3
Metals 13 00924 i001
Cu
Mg
Zr
Ti
Mn
Fe
Disclaimer/Publisher’s Note: The statements, opinions and data contained in all publications are solely those of the individual author(s) and contributor(s) and not of MDPI and/or the editor(s). MDPI and/or the editor(s) disclaim responsibility for any injury to people or property resulting from any ideas, methods, instructions or products referred to in the content.