
Mental Health Continuum—Short Form: Confirmatory Factor Analysis (CFA) of Competing Models with Adolescents from Portugal


Abstract
1. Introduction
2. Materials and Methods
2.1. Participants
2.2. Measures
- Sociodemographic survey
2.2.1. Mental Health Continuum—Short Form
2.2.2. Escala de Avaliação do Eu Resiliente (EAER, Resilient Self-Assessment Scale)
2.2.3. Multidimensional Life Satisfaction Scale for Adolescents (MLSSA)
2.3. Ethical Approval
2.4. Data Analysis
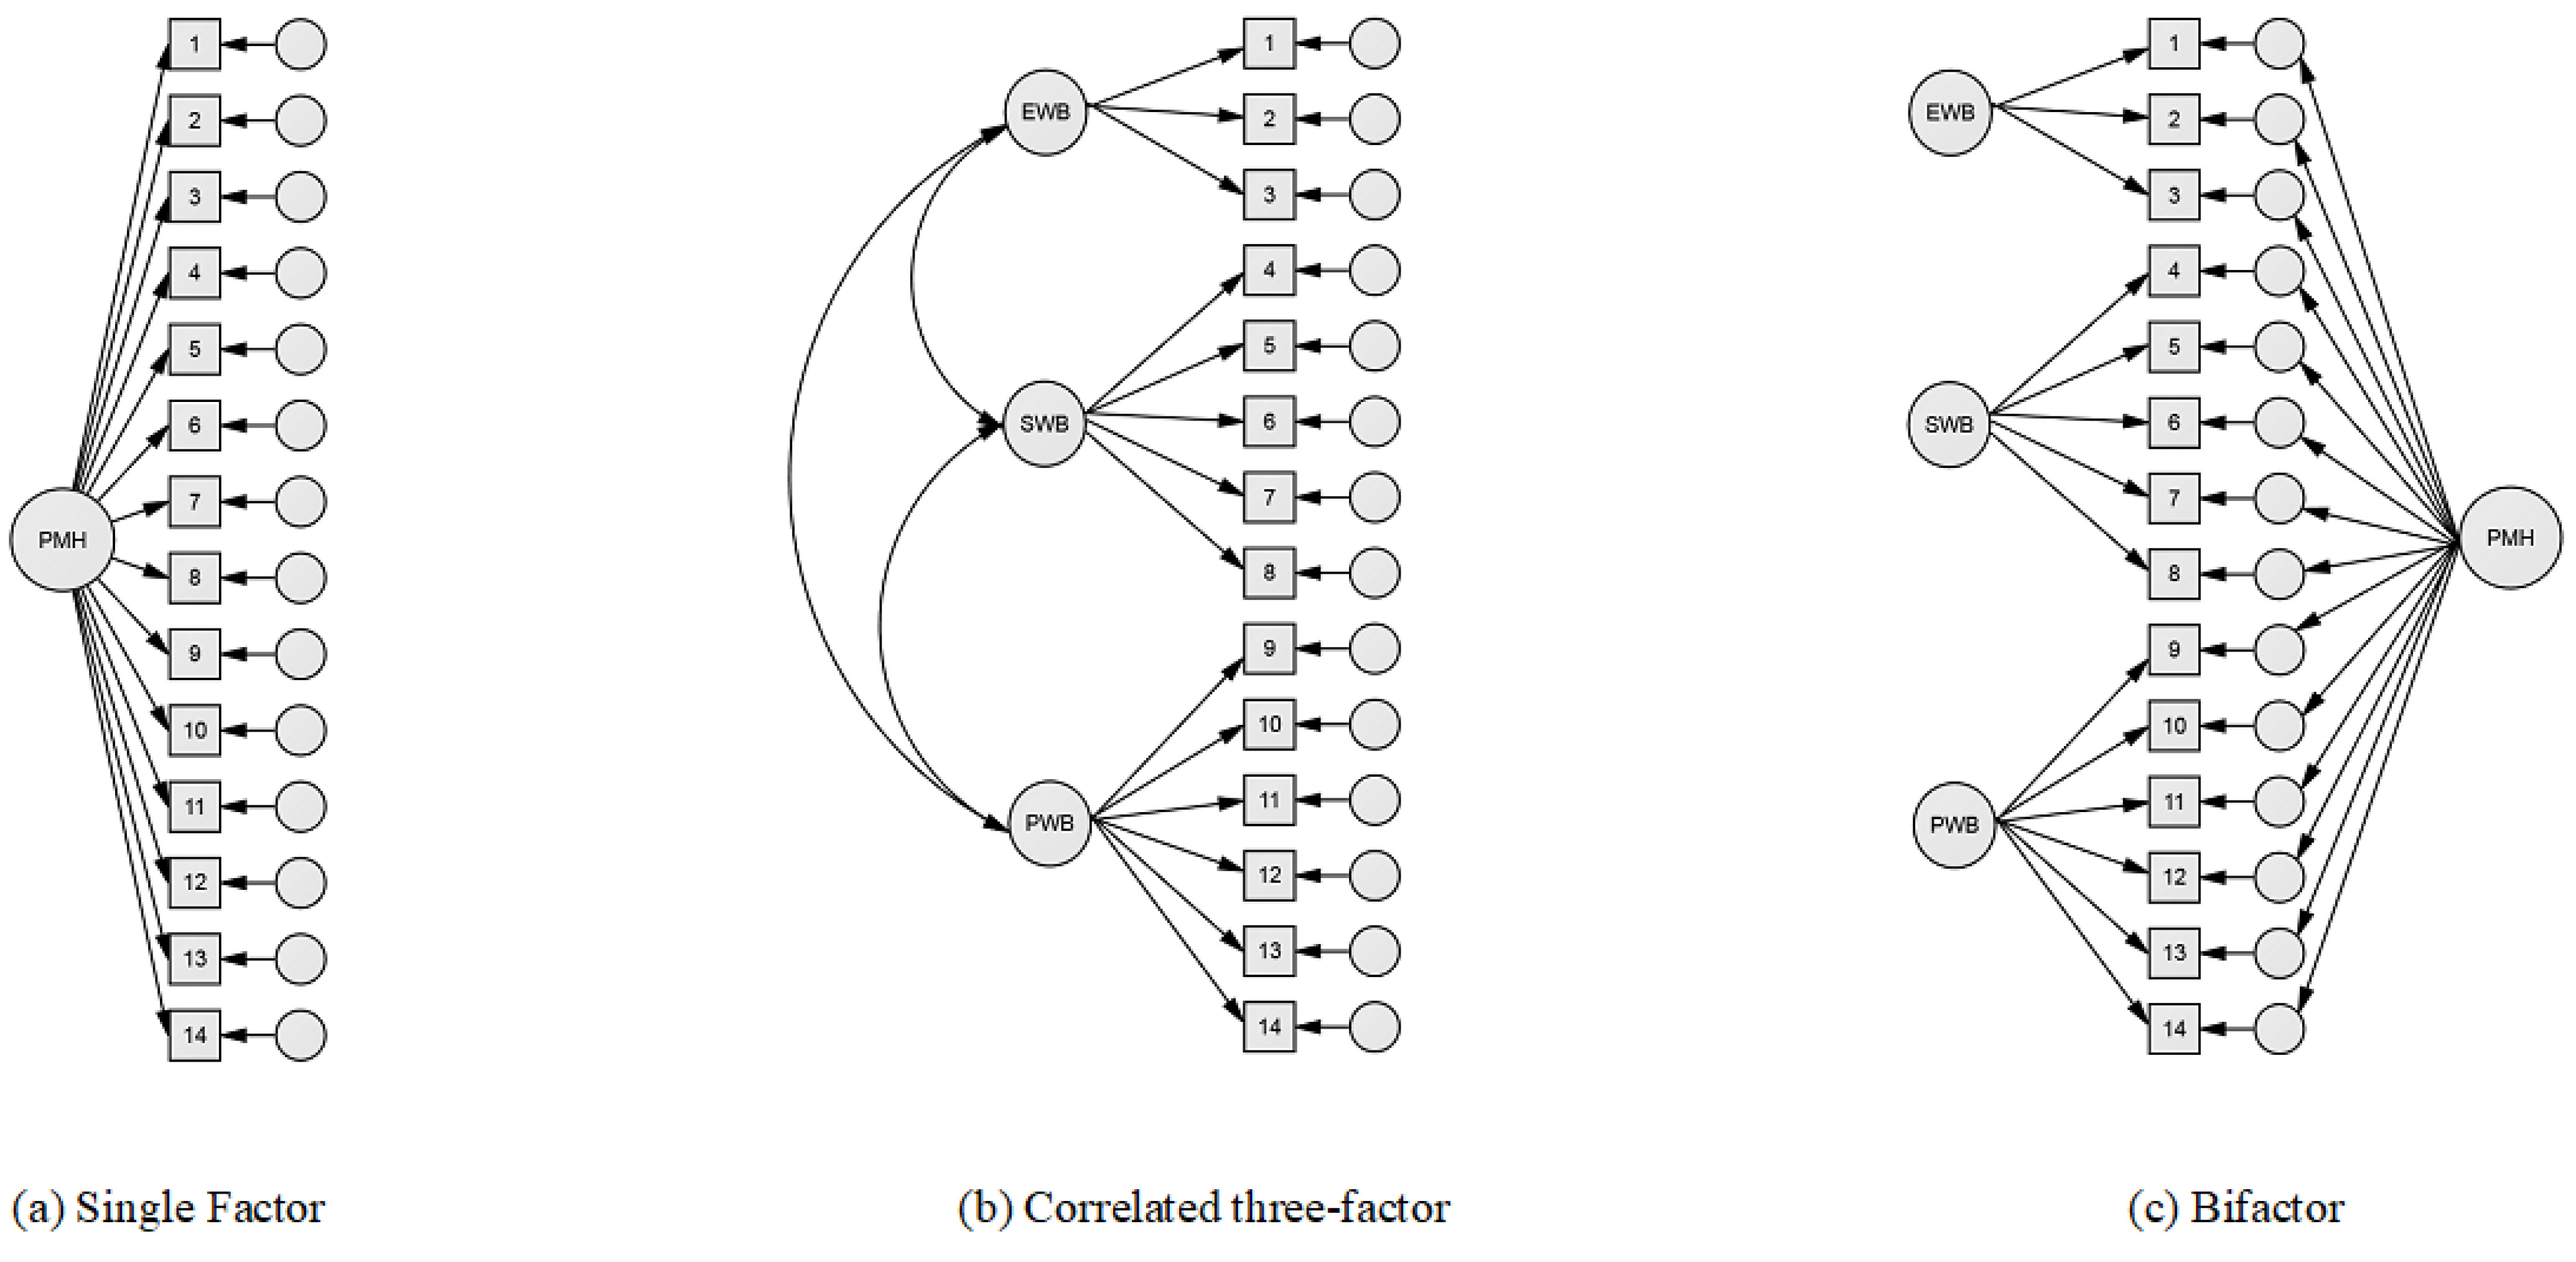
- Confirmatory factor analysis
3. Results
4. Discussion
5. Conclusions
Author Contributions
Funding
Institutional Review Board Statement
Informed Consent Statement
Data Availability Statement
Conflicts of Interest
Abbreviations
| AIC | Akaike information criterion |
| CFA | Confirmatory factor analysis |
| CFI | Comparative fit index |
| Df | Degree of freedom |
| EAER | Escala de Avaliação do Eu Resiliente |
| ECV | Explained common variance |
| EWB | Emotional well-being |
| FD | Factor Determinancy |
| GFI | Goodness of Fit index |
| H | H index |
| Ku | Kurtosis |
| M | Mean |
| MH | Mental Health |
| MHC | Mental Health Continuum |
| MI | Mental Illness |
| MLSSA | Multidimensional Life Satisfaction Scale for Adolescents |
| PMH | Positive mental health |
| PUC | Percent of Uncontaminated Correlations |
| PWB | Psychological well-being |
| RMSEA | Root Mean Square Error of Approximation |
| SD | Standard deviation |
| Sk | Skewness |
| SWB | Social well-being |
| WB | Well-being |
References
- Carvalho, J. S., Pereira, N. S., Pinto, A. M., & Marôco, J. (2016). Psychometric properties of the Mental Health Continuum-Short Form: A study of Portuguese speaking children/youths. Journal of Child and Family Studies, 25(7), 2141–2154. [Google Scholar] [CrossRef]
- Conselho Nacional de Saúde. (2019). Sem mais tempo a perder: Saúde mental em Portugal: Um desafio para a próxima década. Conselho Nacional de Saúde. [Google Scholar]
- de Bruin, G. P., & du Plessis, G. A. (2015). Bifactor analysis of the Mental Health Continuum-Short Form (MHC-SF). Psychological Reports, 116(2), 438–446. [Google Scholar] [CrossRef] [PubMed]
- Dueber, D. M. (2017). Bifactor indices calculator: A microsoft Excel-based tool to calculate various indices relevant to bifactor CFA models. Available online: https://uknowledge.uky.edu/edp_tools/1/ (accessed on 15 March 2025).
- Dunn, K. J., & McCray, G. (2020). The place of the bifactor model in confirmatory factor analysis investigations into construct dimensionality in language testing. Frontiers in Psychology, 11, 1357. [Google Scholar] [CrossRef]
- Echeverría, G., Torres, M., Pedrals, N., Padilla, O., Rigotti, A., & Bitran, M. (2017). Validation of a Spanish version of the Mental Health Continuum-Short Form questionnaire. Psicothema, 29(1), 96–102. [Google Scholar] [CrossRef] [PubMed]
- Fonte, C., Silva, I., Vilhena, E., & Keyes, C. L. M. (2020). The Portuguese adaptation of the Mental Health Continuum-Short Form for adult population. Community Mental Health Journal, 56(2), 368–375. [Google Scholar] [CrossRef]
- Franken, K., Lamers, S. M. A., Ten Klooster, P. M., Bohlmeijer, E. T., & Westerhof, G. J. (2018). Validation of the Mental Health Continuum-Short Form and the dual continua model of well-being and psychopathology in an adult mental health setting. Journal of Clinical Psychology, 74(12), 2187–2202. [Google Scholar] [CrossRef]
- Galderisi, S., Heinz, A., Kastrup, M., Beezhold, J., & Sartorius, N. (2015). Toward a new definition of mental health. World Psychiatry, 14(2), 231–233. [Google Scholar] [CrossRef]
- Gautam, S., Jain, A., Chaudhary, J., Gautam, M., Gaur, M., & Grover, S. (2024). Concept of mental health and mental well-being, it’s determinants and coping strategies. Indian Journal of Psychiatry, 66(Suppl. S2), S231–S244. [Google Scholar] [CrossRef]
- Gurin, G., Veroff, J., & Feld, S. (1969). Americans’ view of their mental health. Basic Books. [Google Scholar]
- Hair, J., Black, W. C., Babin, B. J., & Anderson, R. E. (2010). Multivariate data analysis: A global perspective (7th ed.). Pearson Education, Cop. Available online: https://www.drnishikantjha.com/papersCollection/Multivariate%20Data%20Analysis.pdf (accessed on 15 March 2025).
- Hernández-Torrano, D., Ibrayeva, L., Muratkyzy, A., Lim, N., Nurtayev, Y., Almukhambetova, A., Clementi, A., & Sparks, J. (2021). Validation of a Kazakhstani version of the mental health continuum—Short form. Frontiers in Psychology, 12, 754236. [Google Scholar] [CrossRef] [PubMed]
- Iasiello, M., van Agteren, J., Schotanus-Dijkstra, M., Lo, L., Fassnacht, D. B., & Westerhof, G. J. (2022). Assessing mental wellbeing using the Mental Health Continuum—Short Form: A systematic review and meta-analytic structural equation modelling. Clinical Psychology: Science and Practice, 29(4), 442–456. [Google Scholar] [CrossRef]
- Jahoda, M. (1958). Current concepts of positive mental health. Basic Books. [Google Scholar]
- Jardim, J., & Pereira, A. (2006). Competências pessoais e sociais: Guia prático para a mudança positiva. ASA Editores. [Google Scholar]
- Jovanović, V. (2015). Structural validity of the Mental Health Continuum-Short Form: The bifactor model of emotional, social and psychological well-being. Personality and Individual Differences, 75, 154–159. [Google Scholar] [CrossRef]
- Karaś, D., Cieciuch, J., & Keyes, C. L. M. (2014). The Polish adaptation of the Mental Health Continuum-Short Form (MHC-SF). Personality and Individual Differences, 69, 104–109. [Google Scholar] [CrossRef]
- Kennes, A., Peeters, S., Janssens, M., Reijnders, J., Lataster, J., & Jacobs, N. (2020). Psychometric evaluation of the Mental Health Continuum-Short Form (MHC-SF) for Dutch adolescents. Journal of Child and Family Studies, 29(11), 3276–3286. [Google Scholar] [CrossRef]
- Keyes, C. L. M. (2002). The mental health continuum: From languishing to flourishing in life. Journal of Health and Social Behavior, 43(2), 207–222. [Google Scholar] [CrossRef]
- Keyes, C. L. M. (2005a). Mental illness and/or mental health? Investigating axioms of the complete state model of health. Journal of Consulting and Clinical Psychology, 73(3), 539–548. [Google Scholar] [CrossRef]
- Keyes, C. L. M. (2005b). The subjective well-being of America’s youth: Toward a comprehensive assessment. Adolescent and Family Health, 4, 3–11. [Google Scholar]
- Keyes, C. L. M. (2006). Mental health in adolescence: Is America’s youth flourishing? The American Journal of Orthopsychiatry, 76(3), 395–402. [Google Scholar] [CrossRef]
- Keyes, C. L. M. (2014). Mental health as a complete state: How the salutogenic perspective completes the picture. In Bridging occupational, organizational and public health (pp. 179–192). Springer. [Google Scholar] [CrossRef]
- Keyes, C. L. M., Wissing, M., Potgieter, J. P., Temane, M., Kruger, A., & van Rooy, S. (2008). Evaluation of the mental health continuum-short form (MHC-SF) in Setswana-speaking South Africans. Clinical Psychology & Psychotherapy, 15(3), 181–192. [Google Scholar] [CrossRef]
- Kline, R. B. (2023). Principles and practice of structural equation modeling. Guilford Publications. [Google Scholar]
- Liu, X., Cao, P., Lai, X., Wen, J., & Yang, Y. (2023). Assessing essential unidimensionality of scales and structural coefficient bias. Educational and Psychological Measurement, 83(1), 28–47. [Google Scholar] [CrossRef]
- Loureiro, L. (2024). Acerca dessa coisa a que chamamos literacia em saúde mental. Revista De Enfermagem Referência, 6(3), 1–8. [Google Scholar] [CrossRef]
- Loureiro, L. M. J., Jorm, A. F., Oliveira, R. A., Mendes, A. M. O. C., dos Santos, J. C. P., Rodrigues, M. A., & Sousa, C. S. F. (2015). Mental health literacy about schizophrenia: A survey of Portuguese youth. Early Intervention in Psychiatry, 9(3), 234–241. [Google Scholar] [CrossRef]
- Luijten, C. (2022). Adolescent mental health from a psychosocial perspective: Well-being, internalizing problems, and relationships with parents and friends [Doctoral thesis, Erasmus University Rotterdam]. Available online: https://pure.eur.nl/en/publications/adolescent-mental-health-from-a-psychosocial-perspective-well-bei (accessed on 15 March 2025).
- Luijten, C. C., Kuppens, S., van de Bongardt, D., & Nieboer, A. P. (2019). Evaluating the psychometric properties of the mental health continuum-short form (MHC-SF) in Dutch adolescents. Health and Quality of Life Outcomes, 17(1), 157. [Google Scholar] [CrossRef]
- Marôco, J. (2021). Análise de equações estruturais: Fundamentos teóricos, software & aplicações. ReportNumber. [Google Scholar]
- Matos, A. P., André, R. S., Cherpe, S., Rodrigues, D., Figueira, C., & Pinto, A. M. (2010). Preliminary psychometric study of the Mental Health Continuum—Short Form—For youth, in a sample of Portuguese adolescents. Psychologica, 53, 131–156. [Google Scholar] [CrossRef]
- Monteiro, F., Fonseca, A., Pereira, M., & Canavarro, M. C. (2021). Measuring positive mental health in the postpartum period: The bifactor structure of the Mental Health Continuum-Short Form in Portuguese women. Assessment, 28(5), 1434–1444. [Google Scholar] [CrossRef]
- Morgado, T., Loureiro, L., Rebelo Botelho, M. A., Marques, M. I., Martínez-Riera, J. R., & Melo, P. (2021). Adolescents’ empowerment for mental health literacy in school: A pilot study on ProLiSMental psychoeducational intervention. International Journal of Environmental Research and Public Health, 18(15), 8022. [Google Scholar] [CrossRef]
- Piqueras, J. A., Vidal-Arenas, V., Falcó, R., Moreno-Amador, B., Marzo, J. C., & Keyes, C. L. M. (2022). Validation of the Mental Health Continuum-Short Form (MHC-SF) for multidimensional assessment of subjective well-being in Spanish adolescents. Psicothema, 34(2), 332–343. [Google Scholar] [CrossRef]
- Reinhardt, M., Horváth, Z., Morgan, A., & Kökönyei, G. (2020). Well-being profiles in adolescence: Psychometric properties and latent profile analysis of the mental health continuum model—A methodological study. Health and Quality of Life Outcomes, 18(1), 95. [Google Scholar] [CrossRef]
- Reise, S. P., Bonifay, W. E., & Haviland, M. G. (2013). Scoring and modeling psychological measures in the presence of multidimensionality. Journal of Personality Assessment, 95(2), 129–140. [Google Scholar] [CrossRef]
- Rodriguez, A., Reise, S. P., & Haviland, M. G. (2016). Evaluating bifactor models: Calculating and interpreting statistical indices. Psychological methods, 21(2), 137–150. [Google Scholar] [CrossRef]
- Rosa, A. (2018). Literacia em saúde mental em adolescentes. desenvolvimento de um instrumento de avaliação [PhD thesis, ICBAS—Instituto de Ciências Biomédicas Abel Salazar]. Available online: https://hdl.handle.net/10216/113131 (accessed on 15 March 2025).
- Segabinazi, J. D., Giacomoni, C. H., Dias, A. C. G., Teixeira, M. A. P., & Moraes, D. A. d. O. (2010). Desenvolvimento e validação preliminar de uma escala multidimensional de satisfação de vida para adolescentes. Psicologia: Teoria E Pesquisa, 26(4), 653–659. [Google Scholar] [CrossRef]
- Söderqvist, F., & Larm, P. (2023). Psychometric evaluation of the mental health continuum—Short form in Swedish adolescents. Current Psychology, 42, 2136–2144. [Google Scholar] [CrossRef]
- World Health Organization. (2004). Promoting mental health: Concepts, emerging evidence, practice: Summary report. Available online: https://apps.who.int/iris/handle/10665/42940 (accessed on 15 March 2025).
- World Health Organization. (2024). Mental health of adolescents. World Health Organization. Available online: https://www.who.int/news-room/fact-sheets/detail/adolescent-mental-health (accessed on 15 March 2025).
- Yeo, Z. Z., & Suárez, L. (2022). Validation of the mental health continuum-short form: The bifactor model of emotional, social, and psychological well-being. PLoS ONE, 17(5), e0268232. [Google Scholar] [CrossRef] [PubMed]
- Yousefi Afrashteh, M., & Janjani, P. (2023). Psychometric properties of the mental health continuum-short form in Iranian adolescents. Frontiers in Psychology, 14, 1096218. [Google Scholar] [CrossRef]

| Items | Minimum | Maximum | M | SD | Sk | Ku |
|---|---|---|---|---|---|---|
| MCH1 (EWB) | 1.00 | 5.00 | 3.83 | 0.79 | −0.96 | 1.76 |
| MCH2 (EWB) | 1.00 | 5.00 | 4.05 | 1.11 | −1.13 | 0.56 |
| MCH3 (EWB) | 1.00 | 5.00 | 3.70 | 1.19 | −0.86 | −0.07 |
| MCH4 (SWB) | 1.00 | 5.00 | 3.14 | 1.34 | −0.38 | −1.06 |
| MCH5 (SWB) | 1.00 | 5.00 | 3.56 | 1.39 | −0.68 | −0.81 |
| MCH6 (SWB) | 1.00 | 5.00 | 3.03 | 1.38 | −0.22 | −1.23 |
| MCH7 (SWB) | 1.00 | 5.00 | 3.11 | 1.29 | −0.36 | −1.01 |
| MCH8 (SWB) | 1.00 | 5.00 | 2.92 | 1.35 | −0.12 | −1.25 |
| MCH9 (PWB) | 1.00 | 5.00 | 3.62 | 1.30 | −0.79 | −0.47 |
| MCH10 (PWB) | 1.00 | 5.00 | 3.58 | 1.20 | −0.81 | −0.19 |
| MCH11 (PWB) | 1.00 | 5.00 | 3.89 | 1.15 | −1.1 | 0.58 |
| MCH12 (PWB) | 1.00 | 5.00 | 3.68 | 1.25 | −0.83 | −0.25 |
| MCH13 (PWB) | 1.00 | 5.00 | 3.40 | 1.26 | −0.58 | −0.63 |
| MCH14 (PWB) | 1.00 | 5.00 | 3.69 | 1.35 | −0.78 | −0.61 |
| Multivariate | 66.86 | |||||
| EWB | 3.00 | 15.00 | 11.60 | 2.76 | −10.55 | 5.14 |
| SWB | 3.00 | 25.00 | 15.48 | 5.97 | −5.18 | −2.32 |
| PWB | 4.00 | 30.00 | 21.74 | 6.12 | −9.55 | 3.59 |
| Total MHC | 6.00 | 68.00 | 48.77 | 13.47 | −7.64 | 1.50 |
| Models | χ2 | df | χ2/df | CFI | RMSEA | AIC | GFI |
|---|---|---|---|---|---|---|---|
| Single-factor | 547.73 | 77 | 6.96 *** | 0.88 | 0.11 | 603.73 | 0.84 |
| Three-factor | 254.86 | 74 | 3.44 *** | 0.96 | 0.07 | 316.86 | 0.93 |
| Bifactor | 141.10 | 63 | 2.24 *** | 0.98 | 0.05 | 225.10 | 0.96 |
| Items | Single-Factor | Three-Factor | Bifactor | |||||
|---|---|---|---|---|---|---|---|---|
| PMH | EWB | SWB | PWB | PMH | EWB | SWB | PWB | |
| MCH1 (EWB) | 0.64 *** | 0.71 *** | 0.61 *** | 0.40 *** | ||||
| MCH2 (EWB) | 0.76 *** | 0.84 *** | 0.76 *** | 0.35 *** | ||||
| MCH3 (EWB) | 0.78 *** | 0.86 *** | 0.77 *** | 0.40 *** | ||||
| MCH4 (SWB) | 0.77 *** | 0.76 *** | 0.76 *** | 0.18 *** | ||||
| MCH5 (SWB) | 0.62 *** | 0.60 *** | 0.63 *** | 0.07 | ||||
| MCH6 (SWB) | 0.73 *** | 0.84 *** | 0.66 *** | 0.61 *** | ||||
| MCH7 (SWB) | 0.74 *** | 0.81 *** | 0.68 *** | 0.45 *** | ||||
| MCH8 (SWB) | 0.77 *** | 0.85 *** | 0.72 *** | 0.46 *** | ||||
| MCH9 (PWB) | 0.76 *** | 0.80 *** | 0.76 *** | 0.22 *** | ||||
| MCH10 (PWB) | 0.65 *** | 0.67 *** | 0.65 *** | 0.17 *** | ||||
| MCH11 (PWB) | 0.67 *** | 0.67 *** | 0.69 *** | 0.02 | ||||
| MCH12 (PWB) | 0.58 *** | 0.61 *** | 0.56 *** | 0.25 *** | ||||
| MCH13 (PWB) | 0.67 *** | 0.71 *** | 0.66 *** | 0.33 *** | ||||
| MCH14 (PWB) | 0.77 *** | 0.81 *** | 0.79 *** | 0.23 *** | ||||
| Explained Common Variance (ECV) | 0.81 | 0.22 | 0.26 | 0.10 | ||||
| Factor Determinancy (FD) | 0.95 | 0.68 | 0.81 | 0.53 | ||||
| H Index | 0.93 | 0.34 | 0.53 | 0.25 | ||||
| Omega (ω) | 0.95 | 0.88 | 0.89 | 0.87 | ||||
| Omega Hierarchical (ωH) | 0.89 | 0.19 | 0.19 | 0.07 | ||||
| Relative Omega (Rω) | 0.94 | 0.23 | 0.21 | 0.08 | ||||
| Cronbach’s Alpha (α) | 0.93 | 0.84 | 0.87 | 0.86 | ||||
| Category Diagnosis of PMH | Gender | Total | |
|---|---|---|---|
| Male | Female | ||
| Languishing | 5 (23.8) | 16 (76.2) | 21 (4.2) |
| Moderate | 68 (37.6) | 113 (62.4) | 181 (36.6) |
| Flourishing | 164 (56.0) | 129 (44.0) | 293 (59.2) |
| Total | 237 (47.9) | 258 (52.1) | 495 |
Disclaimer/Publisher’s Note: The statements, opinions and data contained in all publications are solely those of the individual author(s) and contributor(s) and not of MDPI and/or the editor(s). MDPI and/or the editor(s) disclaim responsibility for any injury to people or property resulting from any ideas, methods, instructions or products referred to in the content. |
© 2025 by the authors. Published by MDPI on behalf of the University Association of Education and Psychology. Licensee MDPI, Basel, Switzerland. This article is an open access article distributed under the terms and conditions of the Creative Commons Attribution (CC BY) license (https://creativecommons.org/licenses/by/4.0/).
Share and Cite
Loureiro, L.; Santos, J.; Loureiro, C. Mental Health Continuum—Short Form: Confirmatory Factor Analysis (CFA) of Competing Models with Adolescents from Portugal. Eur. J. Investig. Health Psychol. Educ. 2025, 15, 43. https://doi.org/10.3390/ejihpe15040043
Loureiro L, Santos J, Loureiro C. Mental Health Continuum—Short Form: Confirmatory Factor Analysis (CFA) of Competing Models with Adolescents from Portugal. European Journal of Investigation in Health, Psychology and Education. 2025; 15(4):43. https://doi.org/10.3390/ejihpe15040043
Chicago/Turabian StyleLoureiro, Luís, José Santos, and Cândida Loureiro. 2025. "Mental Health Continuum—Short Form: Confirmatory Factor Analysis (CFA) of Competing Models with Adolescents from Portugal" European Journal of Investigation in Health, Psychology and Education 15, no. 4: 43. https://doi.org/10.3390/ejihpe15040043
APA StyleLoureiro, L., Santos, J., & Loureiro, C. (2025). Mental Health Continuum—Short Form: Confirmatory Factor Analysis (CFA) of Competing Models with Adolescents from Portugal. European Journal of Investigation in Health, Psychology and Education, 15(4), 43. https://doi.org/10.3390/ejihpe15040043