


Validation Study of the Spanish Version of the Measure of Happiness (MH) Questionnaire
 , ,
, ,  and
and 
Abstract
1. Introduction
1.1. Background
1.2. Research Aim
2. Method
2.1. Participants
2.2. Instruments
2.3. Procedure
2.4. Data Analysis
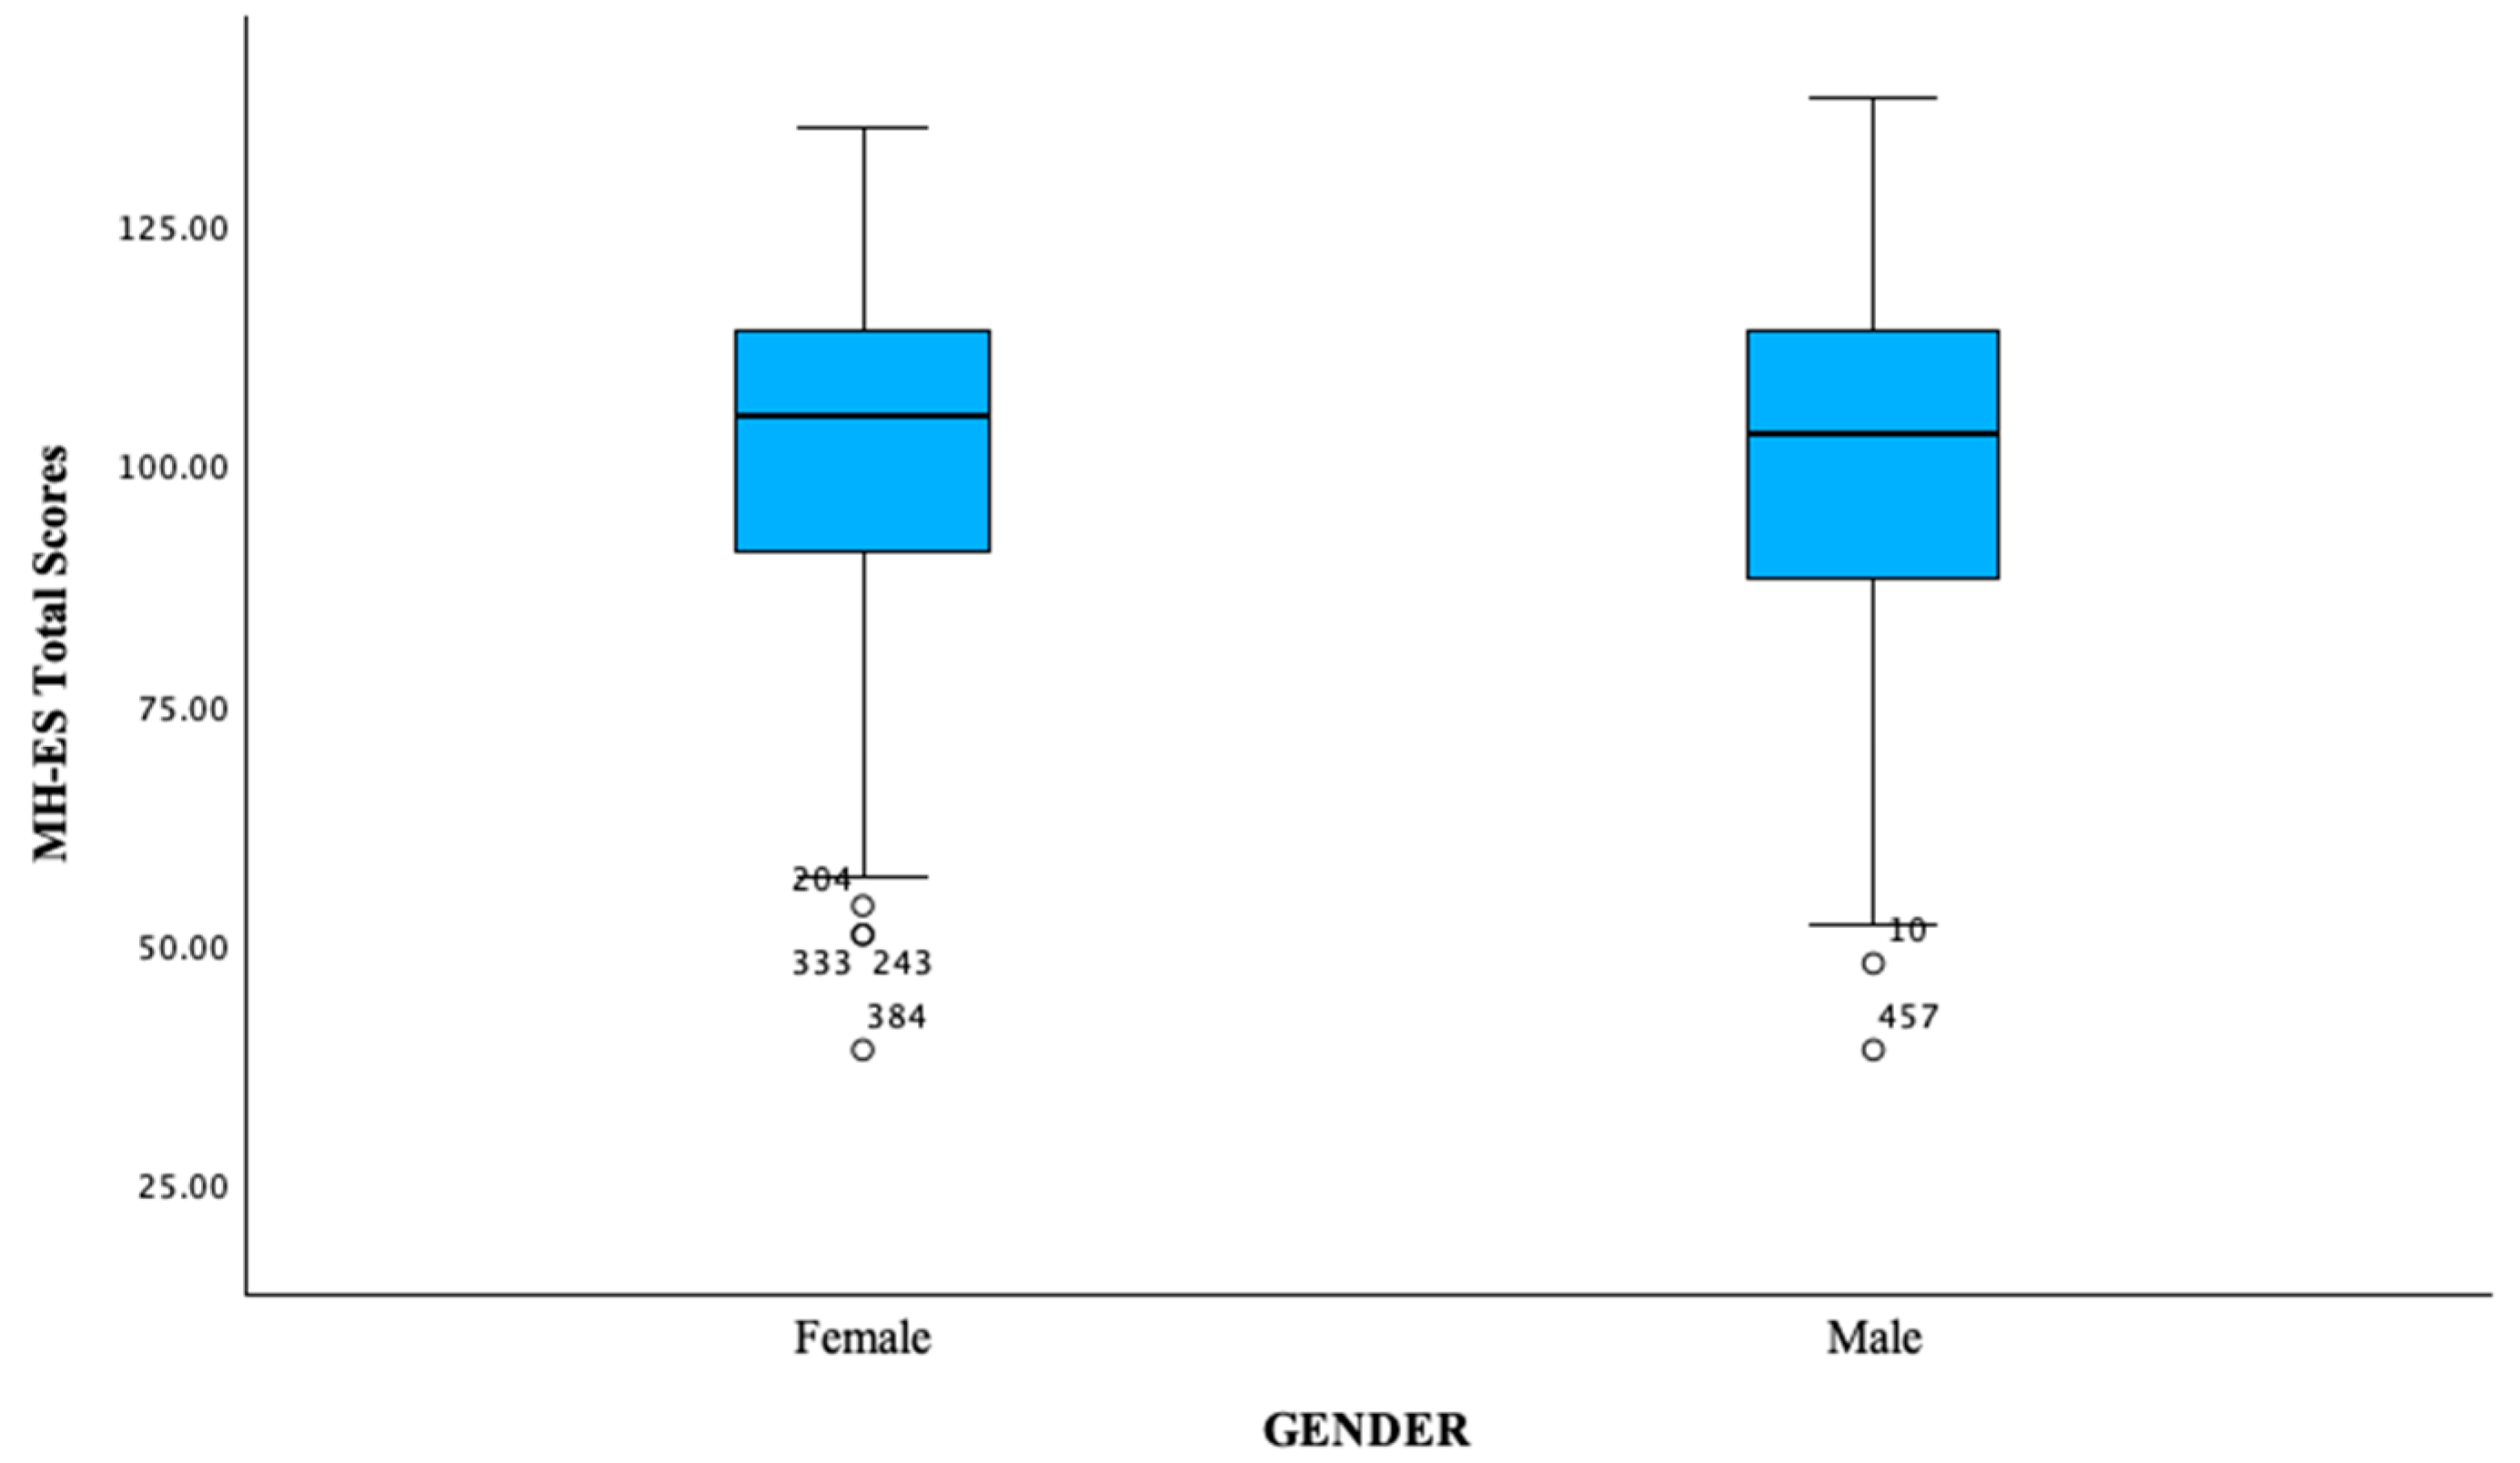
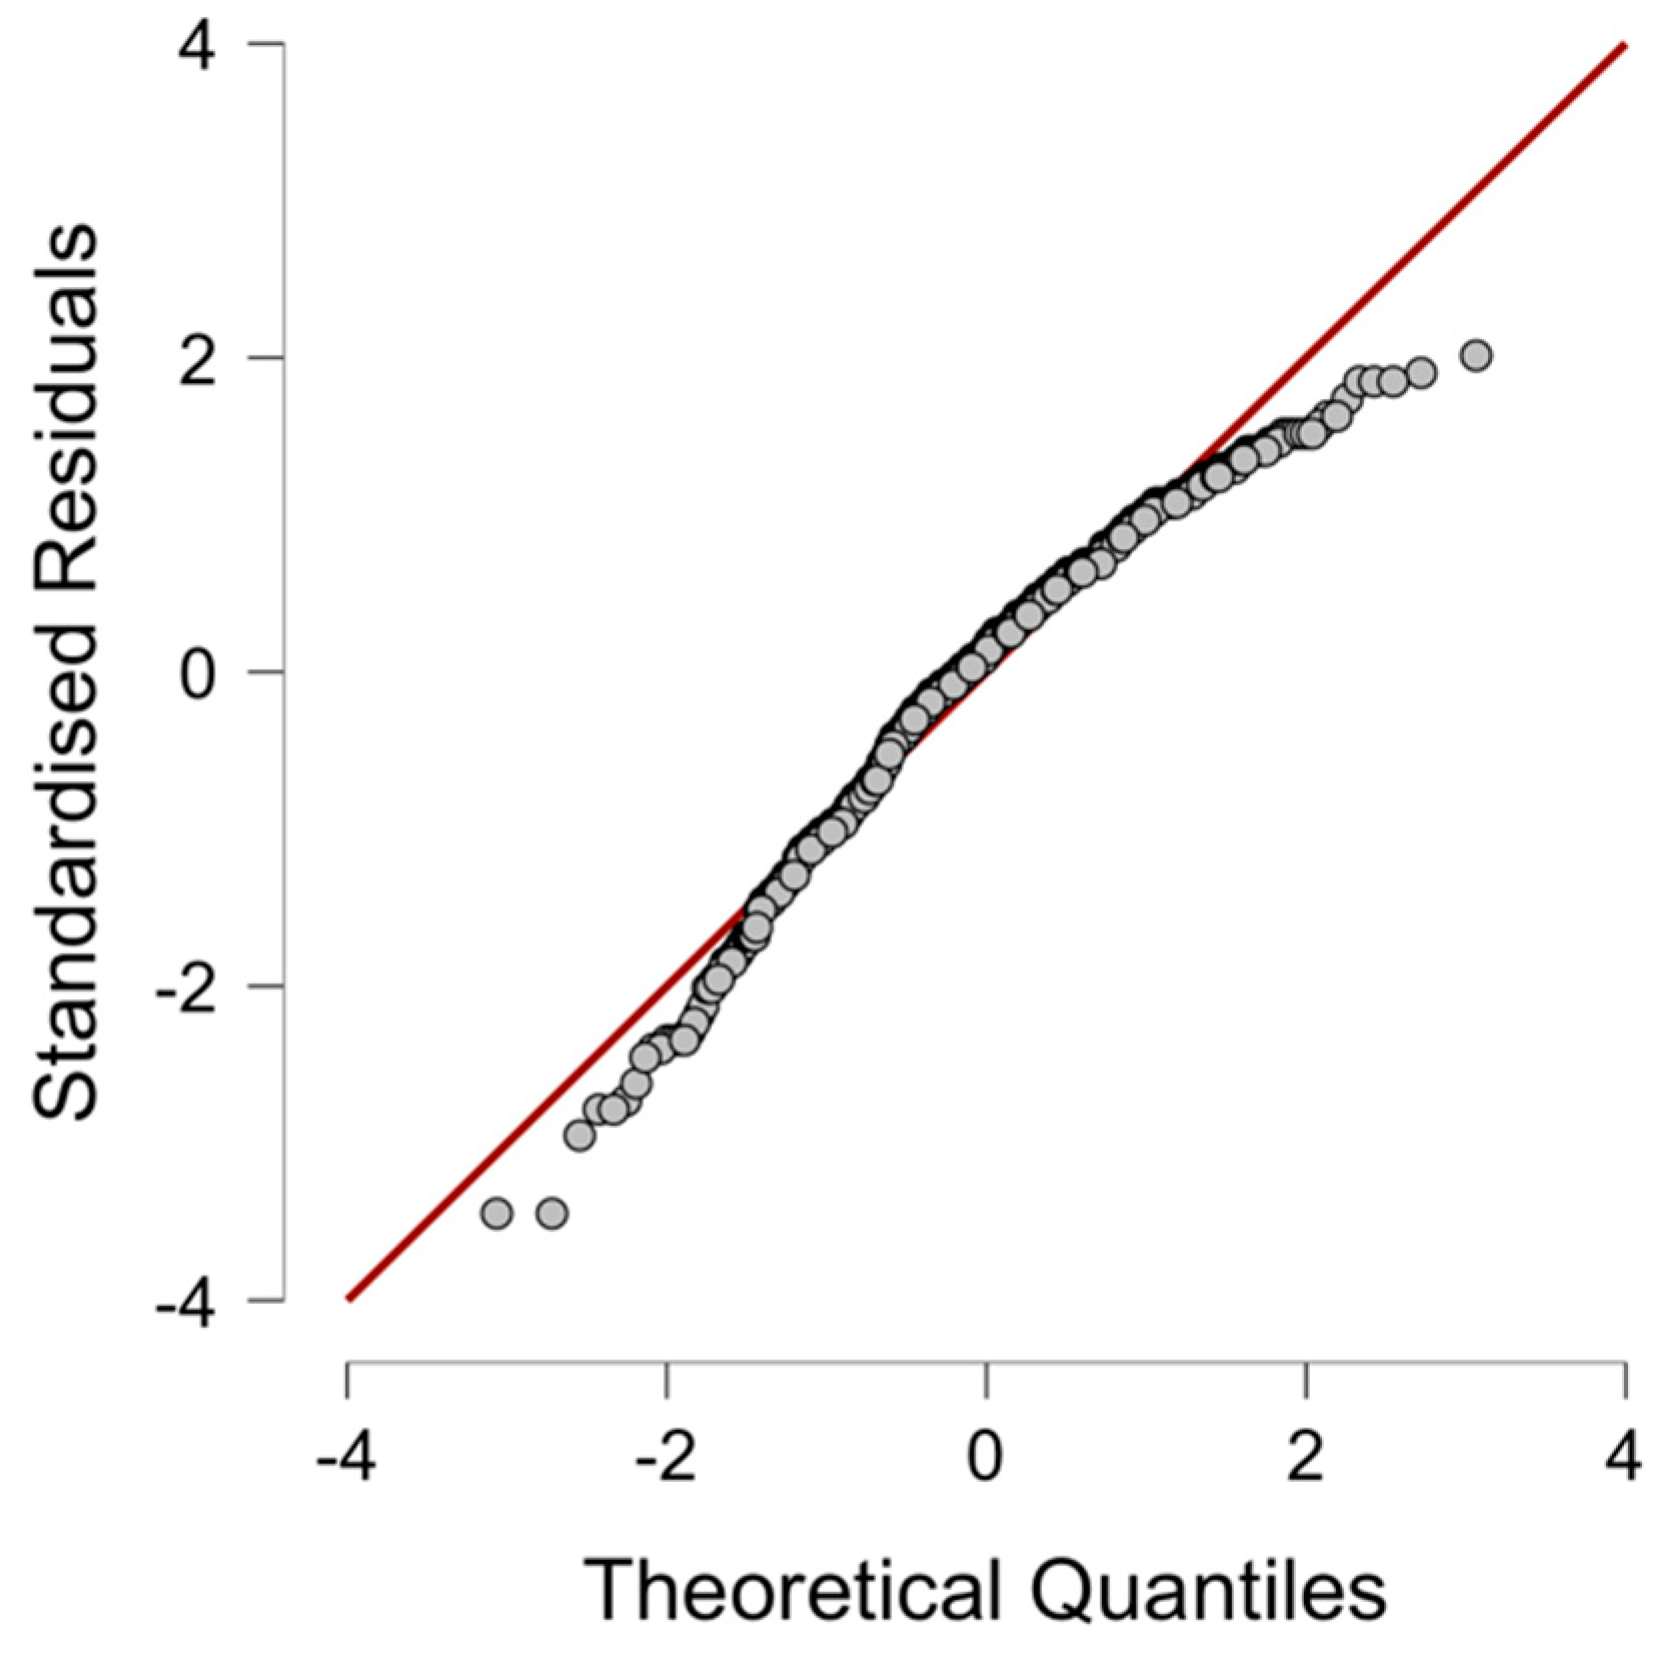
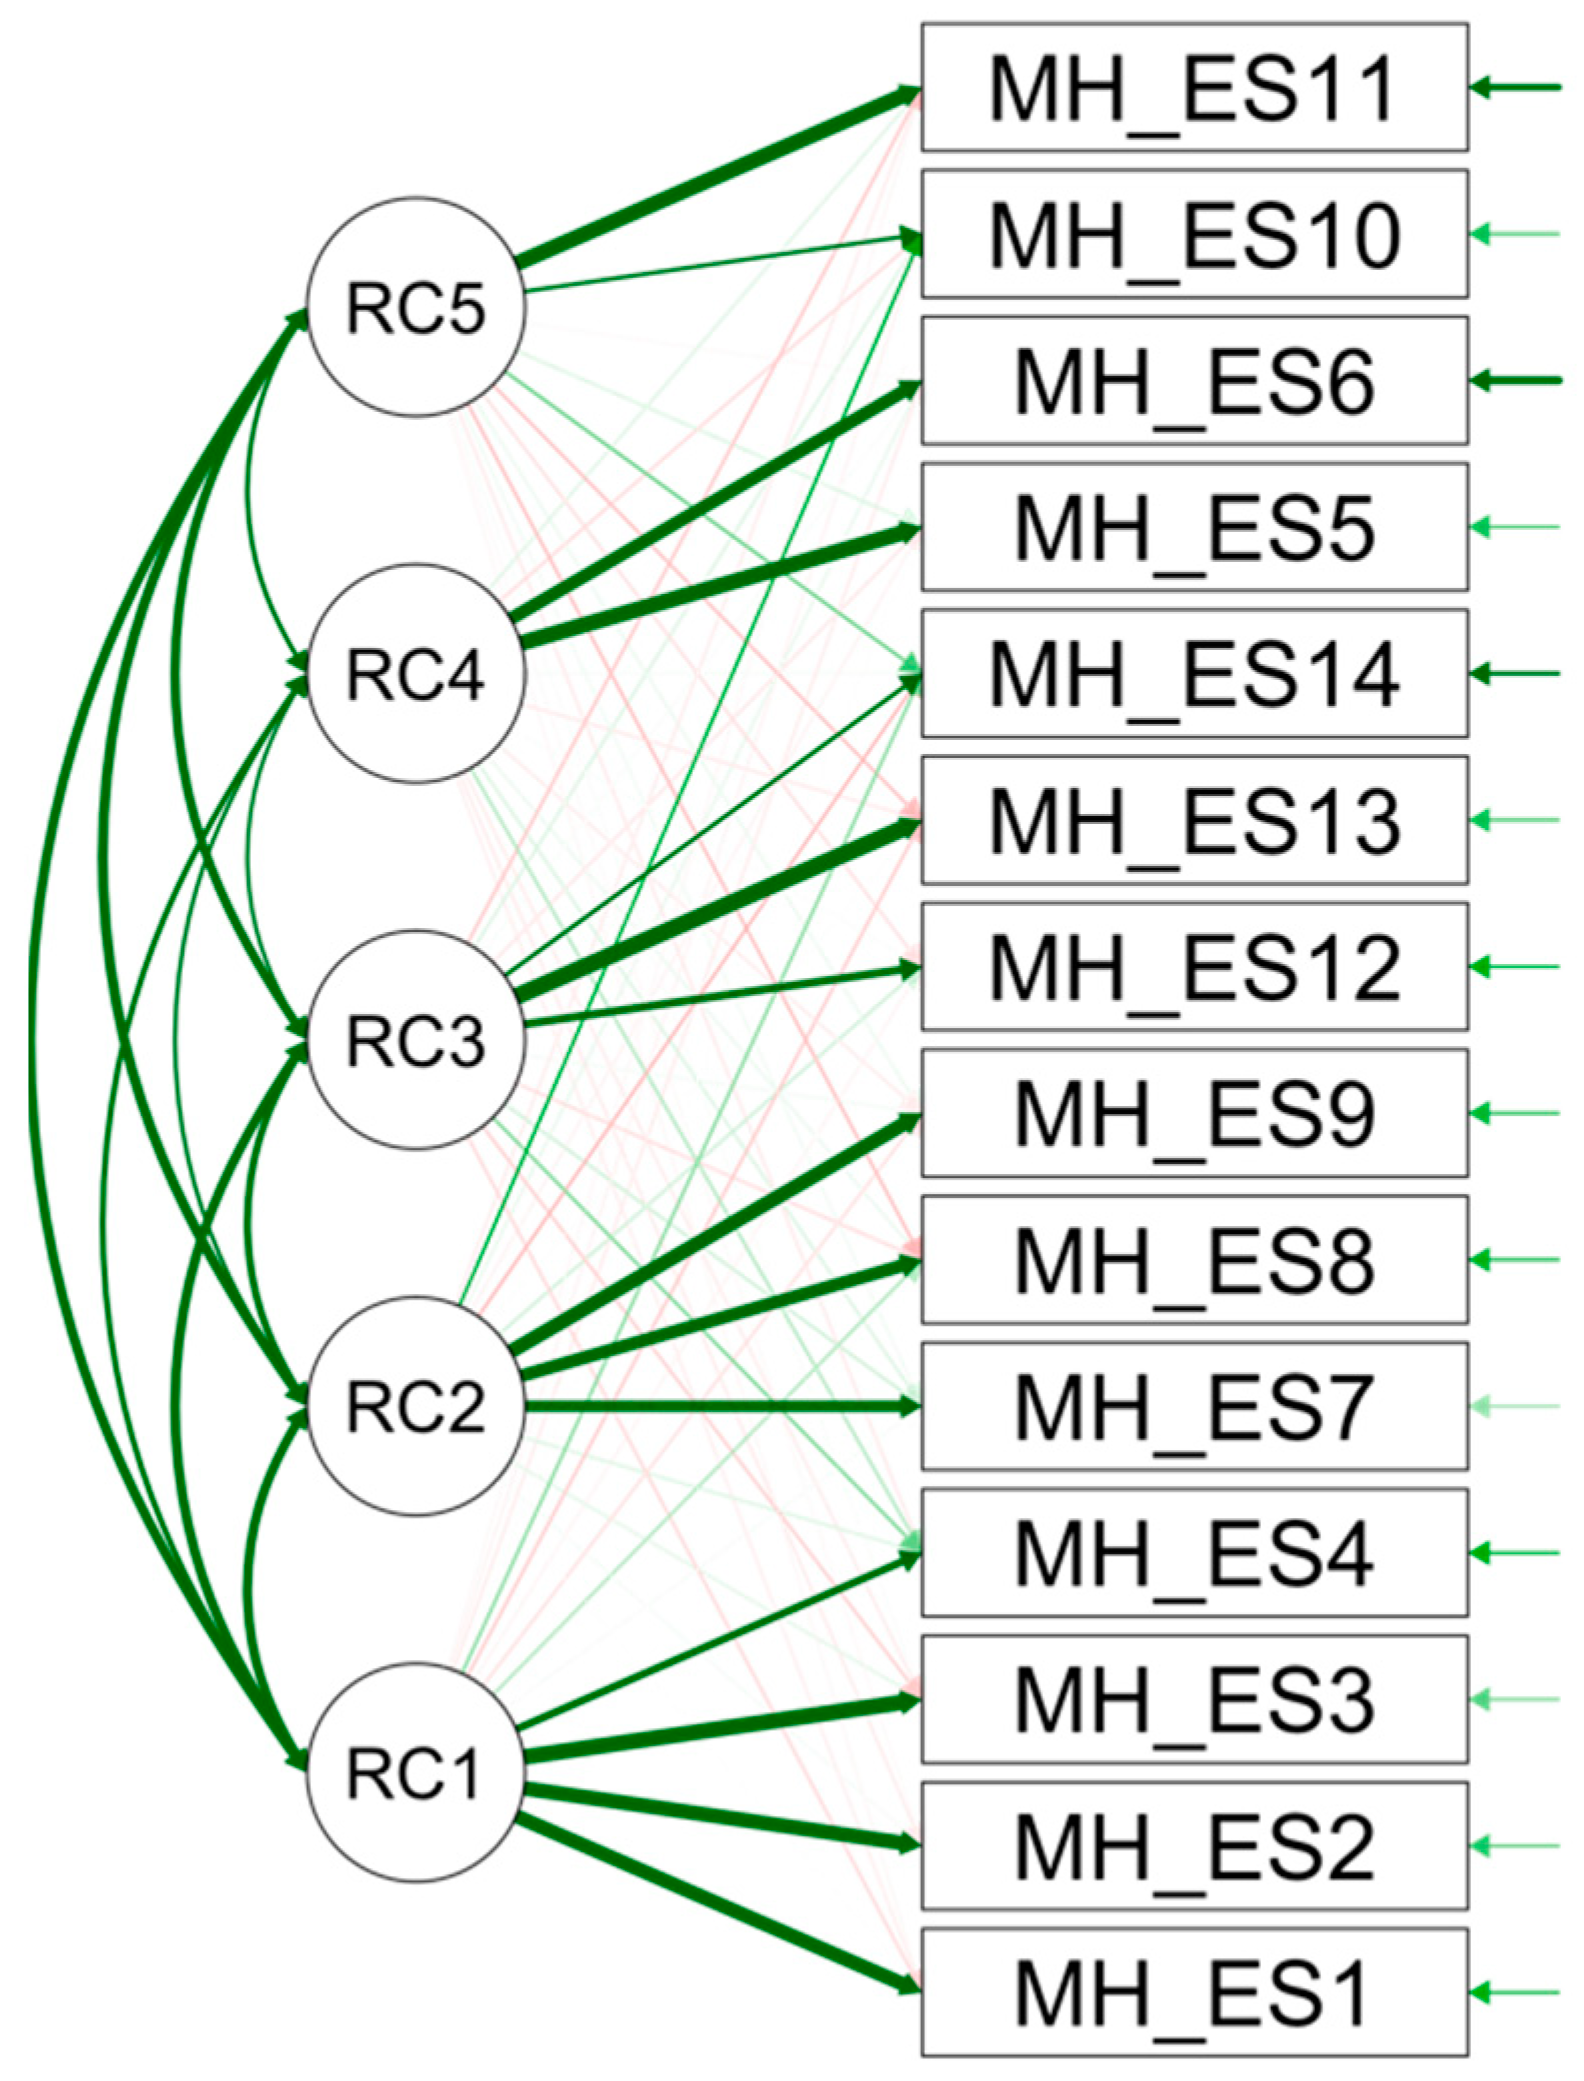
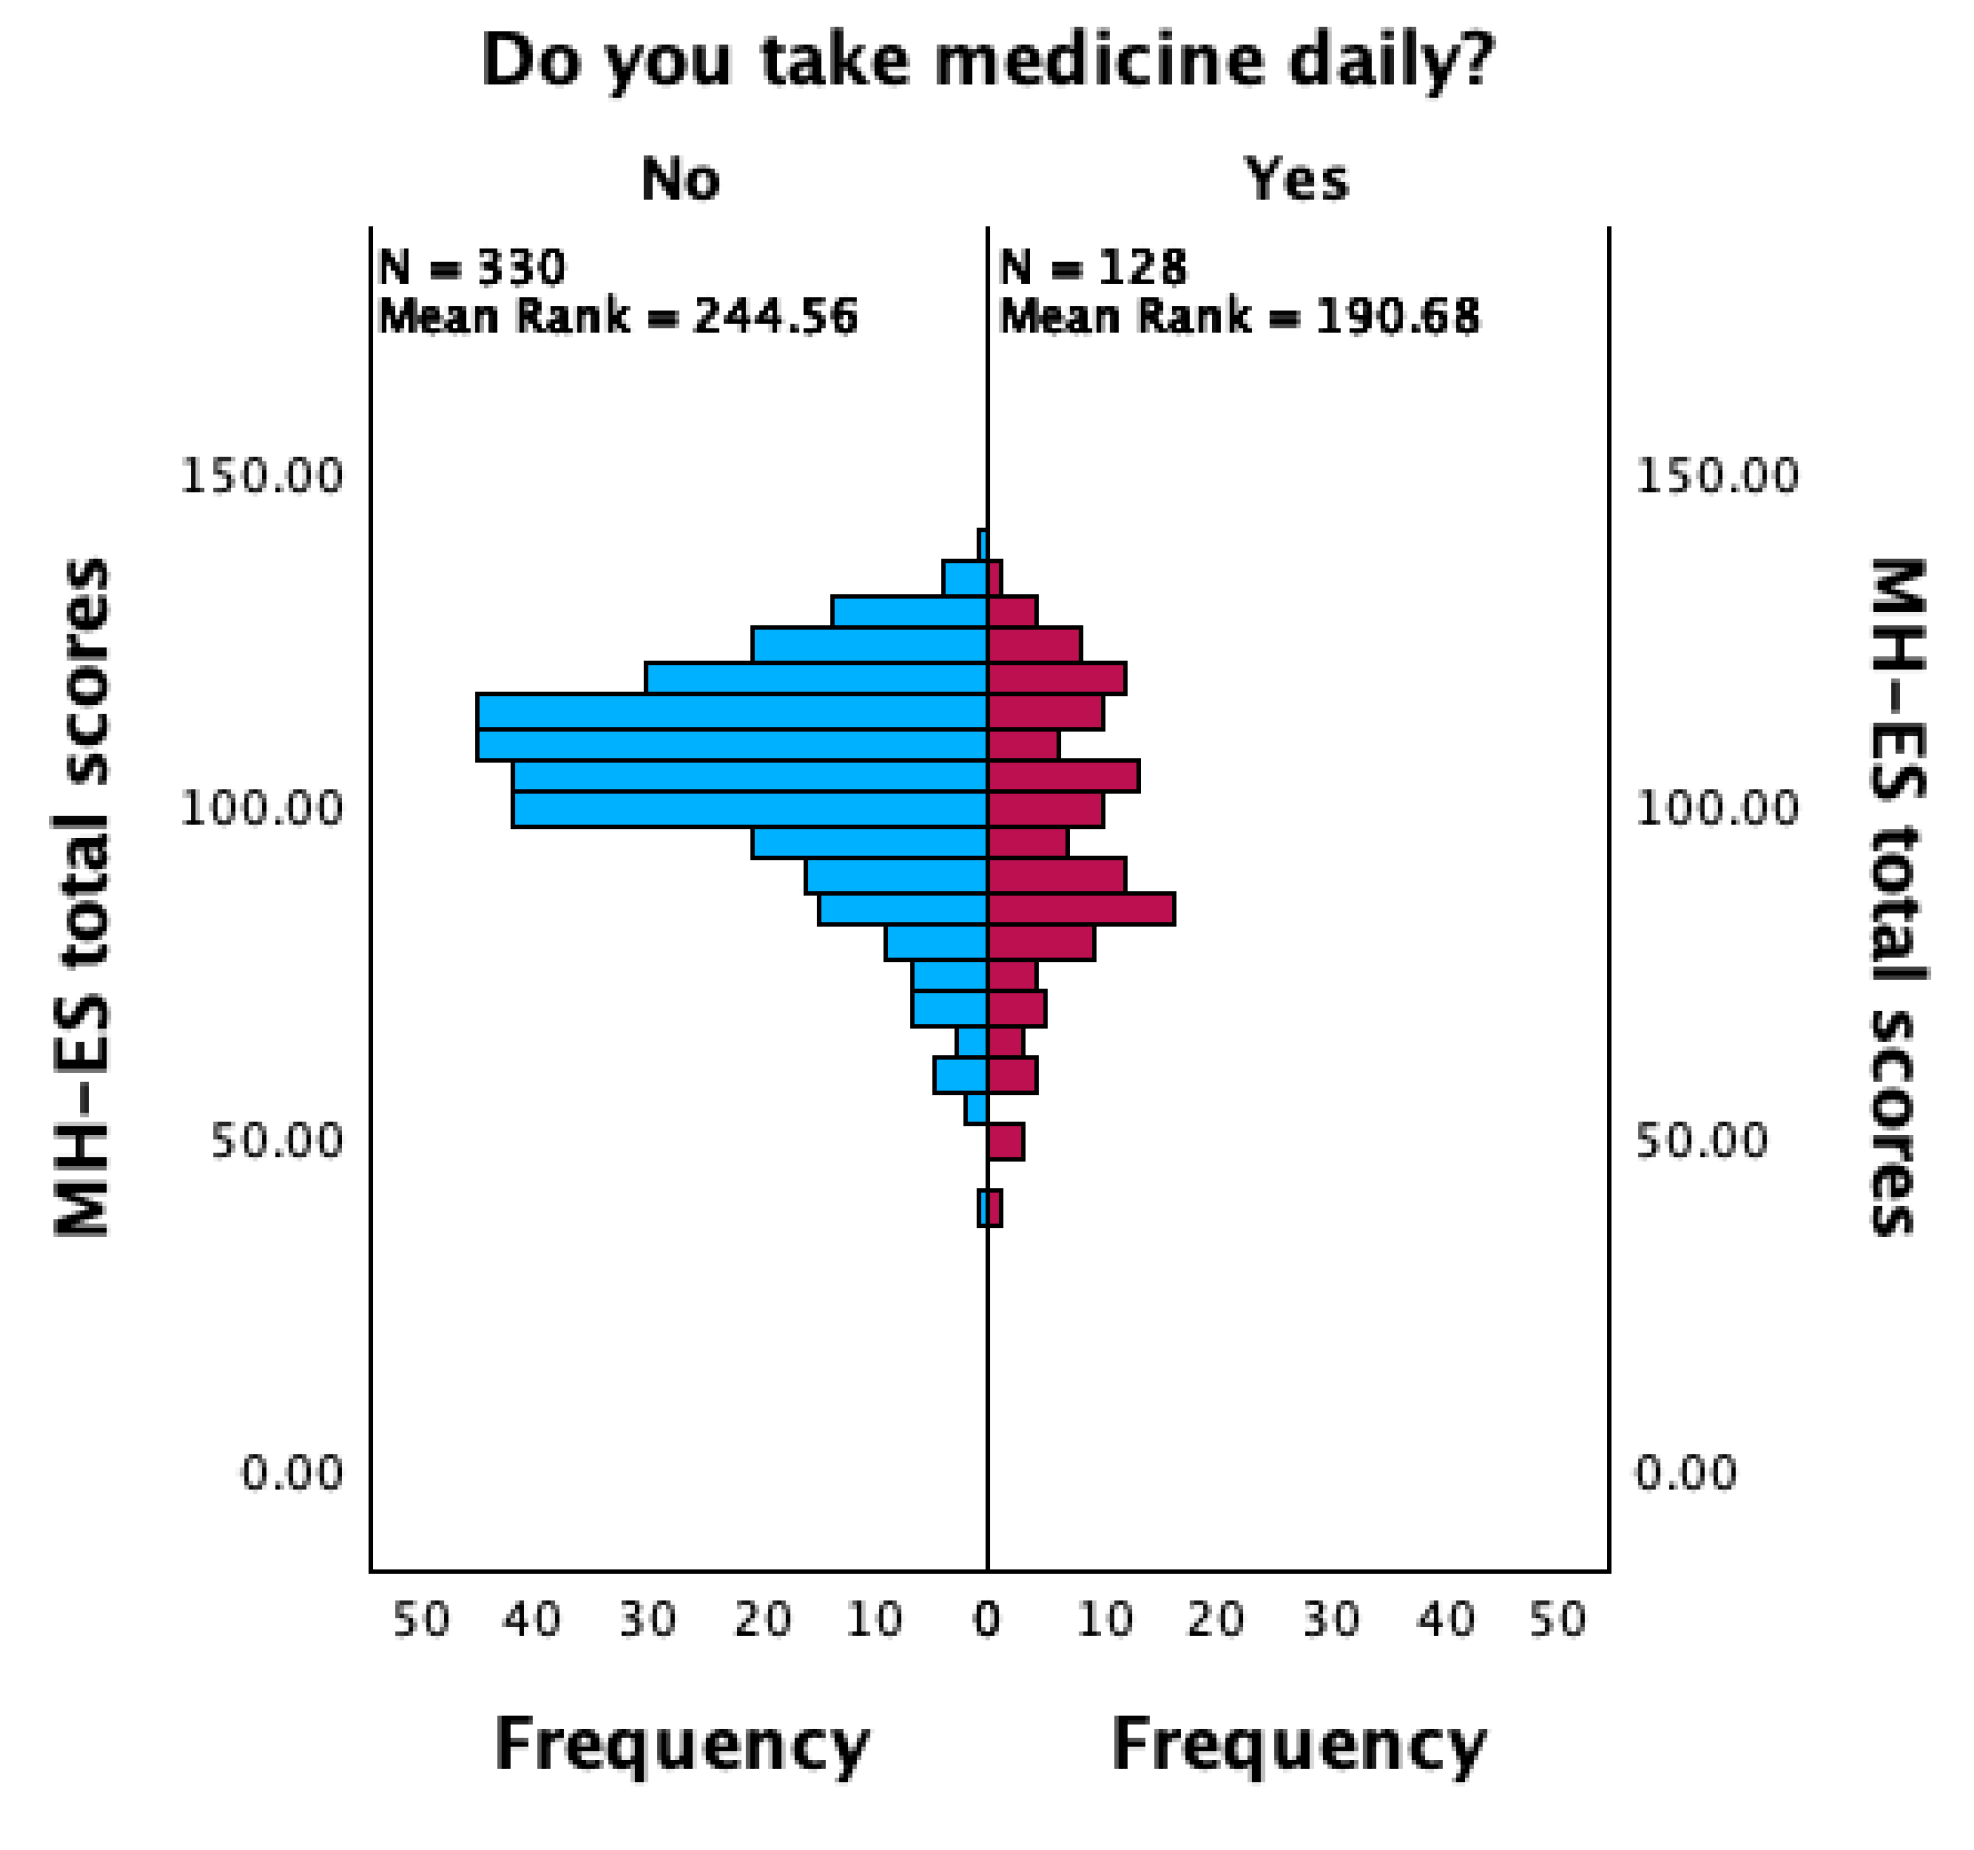
3. Results
4. Discussion
- ¿Cómo valoras la relación con tu cuerpo?
- ¿Cómo evalúas tu nivel de equilibrio mental y físico?
- ¿Cómo evalúas tu relación contigo mismo?
- ¿Cómo de realizado te sientes con tu vida en este momento?
- 5.
- ¿En qué medida estás satisfecho con su situación económica?
- 6.
- ¿En qué medida consideras que su situación financiera es sólida?
- 7.
- ¿Cómo valoras la calidad de tus relaciones con tus seres queridos?
- 8.
- ¿Hasta qué punto estás satisfecho con el ambiente de tu hogar actual?
- 9.
- En tu opinión, ¿en qué medida te valoran los miembros de su familia?
- 10.
- En tu opinión, ¿hasta qué punto la gente, en general, se siente feliz relacionándose contigo?
- 11.
- ¿Cuánto crees que se valoran tus comportamientos en la sociedad?
- 12.
- ¿Qué importancia crees que tiene marcarse objetivos a largo plazo?
- 13.
- ¿Cómo de interesado estás en tu propia superación personal?
- 14.
- ¿Cómo de adaptable te sientes ante los cambios importantes en tu vida?
4.1. Potential Applications
4.2. Study Limitations
5. Conclusions
Supplementary Materials
Author Contributions
Funding
Institutional Review Board Statement
Informed Consent Statement
Data Availability Statement
Conflicts of Interest
References
- Kim-Prieto, C.; Diener, E.; Tamir, M.; Scollon, C.; Diener, M. Integrating the diverse definitions of happiness: A time-sequential framework of subjective well-being. J. Happiness Stud. 2005, 6, 261–300. [Google Scholar] [CrossRef]
- Rizzato, M.; Di Dio, C.; Miraglia, L.; Sam, C.; D’Anzi, S.; Antonelli, M.; Donelli, D. Are You Happy? A Validation Study of a Tool Measuring Happiness. Behav. Sci. 2022, 12, 295. [Google Scholar] [CrossRef] [PubMed]
- Brülde, B. Happiness, morality, and politics. J. Happiness Stud. 2010, 11, 567–583. [Google Scholar] [CrossRef]
- Haybron, D.M.J. Two Philosophical Problems in the Study of Happiness. J. Happiness Stud. 2000, 1, 207–225. [Google Scholar] [CrossRef]
- Jugureanu, A.; Hughes, J.; Hughes, K. Towards a developmental understanding of happiness. Sociol. Res. Online 2014, 19, 1–13. [Google Scholar] [CrossRef]
- Seligman, M.E. Authentic Happiness: Using the New Positive Psychology to Realize Your Potential for Lasting Fulfillment; Simon and Schuster: New York, NY, USA, 2002. [Google Scholar]
- Seligman, M.E. Flourish: A Visionary New Understanding of Happiness and Well-Being; Simon and Schuster: New York, NY, USA, 2011. [Google Scholar]
- Peterson, C.; Ruch, W.; Beermann, U.; Park, N.; Seligman, M.E. Strengths of character, orientations to happiness, and life satisfaction. J. Posit. Psychol. 2007, 2, 149–156. [Google Scholar] [CrossRef]
- Argyle, M.; Martin, M. The psychological causes of happiness. Subj. Well-Being Interdiscip. Perspect. 1991, 10, 77–100. [Google Scholar]
- Crossley, A.; Langdridge, D. Perceived sources of happiness: A network analysis. J. Happiness Stud. 2005, 6, 107–135. [Google Scholar] [CrossRef]
- Delsignore, G.; Aguilar-Latorre, A.; Oliván-Blázquez, B. Measuring happiness in the social sciences: An overview. J. Sociol. 2021, 57, 1044–1067. [Google Scholar] [CrossRef]
- Ludwigs, K.; Henning, L.; Arends, L.R. Measuring Happiness—A Practical Review. In Perspectives on Community Well-Being; Kee, Y., Lee, S.J., Phillips, R., Eds.; Springer International Publishing: Berlin/Heidelberg, Germany, 2019; pp. 1–34. [Google Scholar] [CrossRef]
- Veenhoven, R. Measures of Happiness: Which to Choose? In Metrics of Subjective Well-Being: Limits and Improvements; Brulé, G., Maggino, F., Eds.; Springer International Publishing: Berlin/Heidelberg, Germany, 2017; pp. 65–84. [Google Scholar] [CrossRef]
- Bradburn, N.M. The Structure of Psychological Well-Being; Aldine: Oxford, UK, 1969; Volume 318, Available online: https://psycnet.apa.org/fulltext/1970-19058-000.pdf (accessed on 10 April 2023).
- Harding, S.D. Psychological well-being in great Britain: An evaluation of the Bradburn Affect Balance Scale. Personal. Individ. Differ. 1982, 3, 167–175. [Google Scholar] [CrossRef]
- Watson, D.; Clark, L.A.; Tellegen, A. Development and validation of brief measures of positive and negative affect: The PANAS scales. J. Personal. Soc. Psychol. 1988, 54, 1063–1070. [Google Scholar] [CrossRef] [PubMed]
- Diener, E.; Emmons, R.A.; Larsen, R.J.; Griffin, S. The Satisfaction With Life Scale. J. Personal. Assess. 1985, 49, 71–75. [Google Scholar] [CrossRef] [PubMed]
- Andrews, F.M.; Withey, S.B. Social Indicators of Well-Being: Americans’ Perceptions of Life Quality; Springer Science & Business Media: Berlin/Heidelberg, Germany, 2012; Available online: https://play.google.com/store/books/details?id=4g7rBwAAQBAJ (accessed on 10 April 2023).
- Rizzato, M.; Antonelli, M.; Sam, C.; Di Dio, C.; Lazzeroni, D.; Donelli, D. Happiness and Socio-Demographic Factors in an Italian Sample: A Propensity-Matched Study. Healthcare 2023, 11, 1557. [Google Scholar] [CrossRef] [PubMed]
- Lyubomirsky, S.; Lepper, H.S. Subjective Happiness Scale [dataset]. In PsycTESTS Dataset; American Psychological Association (APA): Washington, DC, USA, 2012. [Google Scholar] [CrossRef]
- Extremera, N.; Fernández-Berrocal, P. The Subjective Happiness Scale: Translation and Preliminary Psychometric Evaluation of a Spanish Version. Soc. Indic. Res. 2014, 119, 473–481. [Google Scholar] [CrossRef]
- Raymond, B.S.; Ivan, H.; Jackson, D.D. The meaning and measurement of neuroticism and anxiety. J. Nerv. Ment. Dis. 1962, 135, 370. [Google Scholar] [CrossRef]
- Spielberger, C.D. Assessment of state and trait anxiety: Conceptual and methodological issues. South. Psychol. 1985, 2, 6–16. [Google Scholar]
- Spielberger, C.D. State-trait anxiety inventory for adults [dataset]. In PsycTESTS Dataset; American Psychological Association (APA): Washington, DC, USA, 2012. [Google Scholar] [CrossRef]
- Arles Spielberg, C.H. Development of the Spanish Edition of the State-Trait Anxiety Inventory1. Rev. Interam. De Psicol. Interam. J. Psychol. 1971, 5, 3–4. [Google Scholar]
- Beck, A.T.; Steer, R.A.; Carbin, M.G. Psychometric properties of the Beck Depression Inventory: Twenty-five years of evaluation. Clin. Psychol. Rev. 1988, 8, 77–100. [Google Scholar] [CrossRef]
- Bonicatto, S.; Dew, A.M.; Soria, J.J. Analysis of the psychometric properties of the Spanish version of the Beck Depression Inventory in Argentina. Psychiatry Res. 1998, 79, 277–285. [Google Scholar] [CrossRef]
- WHOQOL Group. Development of the World Health Organization WHOQOL-BREF quality of life assessment. WHOQOL Group. Psychol. Med. 1998, 28, 551–558. [Google Scholar] [CrossRef]
- Lucas-Carrasco, R. The WHO quality of life (WHOQOL) questionnaire: Spanish development and validation studies. Qual. Life Res. 2012, 21, 161–165. [Google Scholar] [CrossRef] [PubMed]
- Hox, J.J.; Maas, C.J.M.; Brinkhuis, M.J.S. The effect of estimation method and sample size in multilevel structural equation modeling. Stat. Neerl. 2010, 64, 157–170. [Google Scholar] [CrossRef]
- Browne, M.W.; Cudeck, R. Alternative Ways of Assessing Model Fit. Sociol. Methods Res. 1992, 21, 230–258. [Google Scholar] [CrossRef]
- Byrne, B.M.; Baron, P.; Balev, J. The Beck Depression Inventory: A cross-validated test of second-order factorial structure for Bulgarian adolescents. Educ. Psychol. Meas. 1998, 58, 241–251. [Google Scholar] [CrossRef]
- Wu, A.D.; Li, Z.; Zumbo, B.D. Decoding the meaning of factorial invariance and updating the practice of multi-group confirmatory factor analysis: A demonstration with TIMSS data. Pract. Assess. Res. Eval. 2007, 12, 3. [Google Scholar] [CrossRef]
- Kaiser, H.F. The varimax criterion for analytic rotation in factor analysis. Psychometrika 1958, 23, 187–200. [Google Scholar] [CrossRef]
- Cattell, R.B. The Scree Test For The Number Of Factors. Multivar. Behav. Res. 1966, 1, 245–276. [Google Scholar] [CrossRef]
- Zwick, W.R.; Velicer, W.F. Comparison of five rules for determining the number of components to retain. Psychol. Bull. 1986, 99, 432–442. [Google Scholar] [CrossRef]
- Ortuzar, I.; Renart, G.; Xabadia, A. Effects of public healthcare budget cuts on life satisfaction in Spain. Soc. Indic. Res. 2021, 156, 311–337. [Google Scholar] [CrossRef]
- López-Ruiz, V.-R.; Huete-Alcocer, N.; Alfaro-Navarro, J.-L.; Nevado-Peña, D. The relationship between happiness and quality of life: A model for Spanish society. PLoS ONE 2021, 16, e0259528. [Google Scholar] [CrossRef]
- Vowels, L.M.; Francois-Walcott, R.R.R.; Carnelley, K.B.; Checksfield, E.L. Adapting to change: How has COVID-19 affected people’s work and personal goals? PLoS ONE 2022, 17, e0262195. [Google Scholar] [CrossRef] [PubMed]
- Cronbach, L.J. Coefficient alpha and the internal structure of tests. Psychometrika 1951, 16, 297–334. [Google Scholar] [CrossRef]


| Sociodemographic Characteristics | Sample N = 458 |
|---|---|
| Age, mean ± SD | 24.14 ± 8.45 |
| Gender | N (%) |
| Male | 157 (65.7%) |
| Female | 301 (34.3%) |
| Nationality | N (%) |
| Spanish | 445 (97.2%) |
| Other | 13 (2.8%) |
| Educational level | N (%) |
| Primary school | 5 (1.1%) |
| Secondary school | 3 (0.7%) |
| High school | 181 (39.5%) |
| Professional training | 67 (14.6%) |
| Bachelor’s degree | 202 (44.1%) |
| Marital status | N (%) |
| Single | 215 (53.1%) |
| In a relationship | 243 (46.9%) |
| Medicine daily | N (%) |
| Yes | 128 (27.9%) |
| No | 330 (72.1%) |
| Range of Scores | Skewness | Kurtosis | ||||||
|---|---|---|---|---|---|---|---|---|
| Min. | Max. | M (SD) | α | Statistic | SE | Statistic | SE | |
| MH-ES | 39 | 138 | 101.49 (18.13) | 0.90 | −0.700 | 0.11 | 0.297 | 0.23 |
| MH-ES F1 (Psychophysics Status) | 4 | 40 | 26.92 (7.08) | 0.90 | −0.490 | 0.11 | −0.254 | 0.23 |
| MH-ES F2 (Financial Status) | 2 | 20 | 12.33 (4.24) | 0.86 | −0.527 | 0.11 | −0.180 | 0.23 |
| MH-ES F3 (Relational Private Sphere) | 3 | 30 | 23.74 (5.34) | 0.72 | −1.080 | 0.11 | 0.908 | 0.23 |
| MH-ES F4 (Socio-Relational Sphere) | 2 | 20 | 14.84 (2.98) | 0.86 | −0.934 | 0.11 | 1.312 | 0.23 |
| MH-ES F5 (Life Perspective) | 9 | 30 | 23.66 (4.17) | 0.72 | −0.775 | 0.11 | 0.459 | 0.23 |
| Factor 1 (Psychophysics Status) | Factor 2 (Financial Status) | Factor 3 (Relational Private Sphere) | Factor 4 (Socio-Relational Sphere) | Factor 5 (Life Perspective) | |
|---|---|---|---|---|---|
| Item 1 | 0.962 | ||||
| Item 2 | 0.865 | ||||
| Item 3 | 0.906 | ||||
| Item 4 | 0.649 | ||||
| Item 5 | 0.889 | ||||
| Item 6 | 0.955 | ||||
| Item 7 | 0.765 | ||||
| Item 8 | 0.908 | ||||
| Item 9 | 0.879 | ||||
| Item 10 | 0.530 | ||||
| Item 11 | 1.014 | ||||
| Item 12 | 0.908 | ||||
| Item 13 | 0.899 | ||||
| Item 14 | 0.596 | ||||
| Extraction Method: Principal Component Analysis. Rotation Method: Promax with Kaiser Normalization. a | |||||
| Recommended Value | Value Obtained | |
|---|---|---|
| χ2/df | ≤3.00 | 2.42 |
| CFI | ≥0.90 | 0.946 |
| TLI | ≥0.90 | 0.926 |
| SRMR | ≤0.05 | 0.044 |
| RMSEA | ≤0.08 | 0.078 ([CI] = 0.063–0.09) |
| Overall Fit Indices | |||||
|---|---|---|---|---|---|
| χ2/df | CFI | TLI | SRMR | RMSEA | |
| Recommended value | ≤3.00 | ≥0.90 | ≥0.90 | ≤0.05 | ≤0.08 |
| Configural | 1.71 | 0.95 | 0.93 | 0.05 | 0.07 |
| Metric | 1.75 | 0.95 | 0.93 | 0.06 | 0.08 |
| Strict | 2.05 | 0.90 | 0.90 | 0.07 | 0.09 |
| Psychophysics Status (MH-ES F1) | Financial Status (MH-ES F2) | Relational Private Sphere (MH-ES F3) | Socio-Relational Sphere (MH-ES F4) | Life Perspective (MH-ES F5) | |
|---|---|---|---|---|---|
| SHS | 0.69 ** | 0.31 ** | 0.50 ** | 0.58 ** | 0.53 ** |
| WHOQOL—Environmental | 0.54 ** | 0.35 ** | 0.33 ** | 0.32 ** | 0.47 ** |
| WHOQOL—Physical | 0.82 ** | 0.39 ** | 0.51 ** | 0.46 ** | 0.45 ** |
| WHOQOL—Social relationships | 0.47 ** | 0.33 ** | 0.53 ** | 0.45 ** | 0.33 ** |
| WHOQOL—Psychological | 0.59 ** | 0.54 ** | 0.53 ** | 0.52 ** | 0.43 ** |
| WHOQOL overall | 0.60 ** | 0.43 ** | 0.45 ** | 0.40 ** | 0.38 ** |
| STAI | −0.50 ** | −0.21 ** | −0.22 ** | −0.22 ** | −0.25 ** |
| BDI | −0.65 ** | −0.35 ** | −0.38 ** | −0.32 ** | −0.39 ** |
Disclaimer/Publisher’s Note: The statements, opinions and data contained in all publications are solely those of the individual author(s) and contributor(s) and not of MDPI and/or the editor(s). MDPI and/or the editor(s) disclaim responsibility for any injury to people or property resulting from any ideas, methods, instructions or products referred to in the content. |
© 2024 by the authors. Licensee MDPI, Basel, Switzerland. This article is an open access article distributed under the terms and conditions of the Creative Commons Attribution (CC BY) license (https://creativecommons.org/licenses/by/4.0/).
Share and Cite
Rizzato, M.; Miraglia, L.; Arnau Mollà, A.F.; Romero Naranjo, F.J.; Di Dio, C.; Antonelli, M.; Donelli, D. Validation Study of the Spanish Version of the Measure of Happiness (MH) Questionnaire. Eur. J. Investig. Health Psychol. Educ. 2024, 14, 1369-1382. https://doi.org/10.3390/ejihpe14050090
Rizzato M, Miraglia L, Arnau Mollà AF, Romero Naranjo FJ, Di Dio C, Antonelli M, Donelli D. Validation Study of the Spanish Version of the Measure of Happiness (MH) Questionnaire. European Journal of Investigation in Health, Psychology and Education. 2024; 14(5):1369-1382. https://doi.org/10.3390/ejihpe14050090
Chicago/Turabian StyleRizzato, Matteo, Laura Miraglia, Antonio Francisco Arnau Mollà, Francisco Javier Romero Naranjo, Cinzia Di Dio, Michele Antonelli, and Davide Donelli. 2024. "Validation Study of the Spanish Version of the Measure of Happiness (MH) Questionnaire" European Journal of Investigation in Health, Psychology and Education 14, no. 5: 1369-1382. https://doi.org/10.3390/ejihpe14050090
APA StyleRizzato, M., Miraglia, L., Arnau Mollà, A. F., Romero Naranjo, F. J., Di Dio, C., Antonelli, M., & Donelli, D. (2024). Validation Study of the Spanish Version of the Measure of Happiness (MH) Questionnaire. European Journal of Investigation in Health, Psychology and Education, 14(5), 1369-1382. https://doi.org/10.3390/ejihpe14050090