Developing a Messaging Graphic for Storage Times of Refrigerated Ready to Eat (RTE) Foods for a Consumer Food Safety Health Campaign


Abstract
1. Introduction
2. Literature Review
2.1. Consumer Food Safety Practices
2.2. Food Safety Education Programs for Consumers
2.3. Determining Trade-Offs
3. Methods
3.1. Consumers
3.2. Conjoint Analysis (CA)
3.3. Concept “Cards”
3.4. Concept Categories and Attributes
3.5. Consumer Test Procedure
3.6. Data Analysis
4. Results and Discussion
4.1. Relative Importanc of Categories for the Graphical Schematic of Message
4.2. Individual Attributes of the Graphical Schematic
4.3. Demographic Subgroup Information
4.4. Overall Graphical Schematic—Maximum Score
5. Limitations and Future Research Needs
6. Conclusions
Author Contributions
Funding
Conflicts of Interest
References
- Altekruse, S.F.; Cohen, M.L.; Swerdlow, D.L. Emerging Foodborne Diseases. Emerg. Infect. Dis. 1997, 3, 285–293. [Google Scholar] [CrossRef] [PubMed]
- van Loo, E.J.; Ricke, S.C.; Milillo, S.R.; Seideman, S.; Crandall, P.G. Consumer food safety perceptions of ready-to-eat deli foods in Northwest Arkansas. Food Prot. Trends 2010, 30, 635–643. [Google Scholar]
- Phan, U.T.X.; Chambers, E. Motivations for choosing various food groups based on individual foods. Appetite 2016, 105, 204–211. [Google Scholar] [CrossRef] [PubMed]
- Phan, U.T.X.; Chambers, E. Application of An Eating Motivation Survey to Study Eating Occasions. J. Sens. Stud. 2016, 31, 114–123. [Google Scholar] [CrossRef]
- Makinde, O.M.; Ayeni, K.I.; Sulyok, M.; Krska, R.; Adeleke, R.A.; Ezekiel, C.N. Microbiological safety of ready-to-eat foods in low- and middle-income countries: A comprehensive 10-year (2009 to 2018) review. Compr. Rev. Food Sci. Food Saf. 2020, 19, 703–732. [Google Scholar] [CrossRef]
- Gombas, D.E.; Chen, Y.; Clavero, R.S.; Scott, V.N. Survey of Listeria monocytogenes in ready-to-eat foods. J. Food Prot. 2003, 66, 559–569. [Google Scholar] [CrossRef]
- US Food and Drug Administration. What You Need to Know about Preventing Listeria Infections. Available online: https://www.fda.gov/food/buy-store-serve-safe-food/what-you-need-know-about-preventing-listeria-infections (accessed on 22 July 2020).
- Levine, P.; Rose, B.; Green, S.; Ransom, G.; Hill, W. Pathogen testing of ready-to-eat meat and poultry products collected at federally inspected establishments in the united states, 1990 to 1999. J. Food Prot. 2001, 64, 1188–1193. [Google Scholar] [CrossRef]
- Sagoo, S.K.; Little, C.L.; Mitchell, R.T. Microbiological quality of open ready-to-eat salad vegetables: Effectiveness of food hygiene training of management. J. Food Prot. 2003, 66, 1581–1586. [Google Scholar] [CrossRef]
- Hereu, A.; Dalgaard, P.; Garriga, M.; Aymerich, T.; Bover-Cid, S. Analysing and modelling the growth behaviour of Listeria monocytogenes on RTE cooked meat products after a high pressure treatment at 400 MPa. Int. J. Food Microbiol. 2014, 186, 84–94. [Google Scholar] [CrossRef]
- Necidová, L.; Mrňousová, B.; Haruštiaková, D.; Bursová, Š.; Janštová, B.; Golian, J. The effect of selected preservatives on the growth of Listeria monocytogenes in ready-to-eat foods. LWT 2019, 116, 108459. [Google Scholar] [CrossRef]
- Sant’Anna, P.B.; de Melo Franco, B.D.G.; Maffei, D.F. Microbiological safety of ready-to-eat minimally processed vegetables in Brazil: An overview. J. Sci. Food Agric. 2020. [Google Scholar] [CrossRef]
- Serra-Castelló, C.; Jofré, A.; Garriga, M.; Bover-Cid, S. Modeling and designing a Listeria monocytogenes control strategy for dry-cured ham taking advantage of water activity and storage temperature. Meat Sci. 2020, 165, 108131. [Google Scholar] [CrossRef] [PubMed]
- Szymczak, B.; Szymczak, M.; Trafiałek, J. Prevalence of Listeria species and L. monocytogenes in ready-to-eat foods in the West Pomeranian region of Poland: Correlations between the contamination level, serogroups, ingredients, and producers. Food Microbiol. 2020, 91, 103532. [Google Scholar] [CrossRef] [PubMed]
- Farias, A.; Akutsu, R.D.C.C.D.A.; Botelho, R.B.A.; Coelho Araújo, W.M.; Silva, I.C.; Sávio, K.E.; Zandonadi, R.P. Food Safety Conditions in Home-Kitchens: A Cross-Sectional Study in the Federal District/Brazil. Int. J. Environ. Res. Public Health 2020, 17, 4897. [Google Scholar] [CrossRef] [PubMed]
- Jevšnik, M.; Ovca, A.; Bauer, M.; Fink, R.; Oder, M.; Sevšek, F. Food safety knowledge and practices among elderly in Slovenia. Food Control 2013, 31, 284–290. [Google Scholar] [CrossRef]
- Donelan, A.K.; Chambers, D.H.; Chambers, E.; Godwin, S.L.; Cates, S.C. Consumer Poultry Handling Behavior in the Grocery Store and In-Home Storage. J. Food Prot. 2016, 79, 582–588. [Google Scholar] [CrossRef] [PubMed]
- Phang, H.S.; Bruhn, C.M. Burger preparation: What consumers say and do in the home. J. Food Prot. 2011, 74, 1708–1716. [Google Scholar] [CrossRef] [PubMed]
- Borrusso, P.; Quinlan, J. Development and Piloting of a Food Safety Audit Tool for the Domestic Environment. Foods 2013, 2, 572–584. [Google Scholar] [CrossRef]
- Duong, M.; Shumaker, E.T.; Cates, S.C.; Shelley, L.; Goodson, L.; Bernstein, C.; Lavallee, A.; Kirchner, M.; Goulter, R.; Jaykus, L.A.; et al. An Observational Study of Thermometer Use by Consumers When Preparing Ground Turkey Patties. J. Food Prot. 2020, 83, 1167–1174. [Google Scholar] [CrossRef]
- Maughan, C.; Chambers, E.; Godwin, S.; Chambers, D.; Cates, S.; Koppel, K. Food handling behaviors observed in consumers when cooking poultry and eggs. J. Food Prot. 2016, 79, 970–977. [Google Scholar] [CrossRef]
- Sneed, J.; Phebus, R.; Duncan-Goldsmith, D.; Milke, D.; Sauer, K.; Roberts, K.R.; Johnson, D. Consumer food handling practices lead to cross-contamination. Food Prot. Trends 2015, 35, 36–48. [Google Scholar]
- Cates, S.C.; Kosa, K.M.; Karns, S.A.; Godwin, S.; Chambers, D. Consumer storage practices for refrigerated ready-to-eat foods: Results of a Web-enabled survey. Food Prot. Trends 2007, 27, 530–543. [Google Scholar]
- Kosa, K.M.; Cates, S.C.; Godwin, S.; Chambers, E. Barriers to using a food thermometer when cooking poultry at home: Results from a national survey. Food Prot. Trends 2017, 37, 116–125. [Google Scholar]
- Evans, E.W.; Redmond, E.C. Older adult consumer knowledge, attitudes, and self-reported storage practices of ready-To-eat food products and risks associated with listeriosis. J. Food Prot. 2016, 79, 263–272. [Google Scholar] [CrossRef] [PubMed]
- Godwin, S.L.; Chen, F.; Chambers, E.I.; Coppings, R.; Chambers, D. A comprehensive evaluation of temperatures within home refrigerators. Food Prot. Trends 2007, 27, 168–173. [Google Scholar]
- Evans, E.W.; Redmond, E.C. Time-Temperature profiling of United Kingdom consumers’ domestic refrigerators. J. Food Prot. 2016, 79, 2119–2127. [Google Scholar] [CrossRef]
- Clayton, D.A.; Griffith, C.J.; Price, P. An investigation of the factors underlying consumers’ implementation of specific food safety practices. Br. Food J. 2003, 105, 434–453. [Google Scholar] [CrossRef]
- Alcorn, M.; Roberts, K.; Sauer, K.; Paez, P.; Watkins, T. Assessing Food Safety Behavior: Salient Beliefs of School Nutrition Employees. Available online: http://ovidsp.ovid.com/ovidweb.cgi?T=JS&CSC=Y&NEWS=N&PAGE=fulltext&D=cagh&AN=20193351288%0Ahttp://sfx.library.cdc.gov/cdc?sid=OVID:caghdb&id=pmid:&id=&issn=1541-9576&isbn=&volume=39&issue=4&spage=305&pages=305-316&date=2019&title=Food+Protection+Trends&at (accessed on 22 July 2020).
- Maughan, C.; Chambers, E.; Godwin, S. Food safety behaviors observed in celebrity chefs across a variety of programs. J. Public Health 2017, 39, 105–112. [Google Scholar] [CrossRef][Green Version]
- Maughan, C.; Godwin, S.; Chambers, D.; Chambers, E. Recipe modification improves food safety practices during cooking of poultry. J. Food Prot. 2016, 79, 1436–1439. [Google Scholar] [CrossRef]
- Chambers, E.; Godwin, S.; Terry, T. Recipes for Determining Doneness in Poultry Do Not Provide Appropriate Information Based on US Government Guidelines. Foods 2018, 7, 126. [Google Scholar] [CrossRef]
- Partnership for Food Safety Education FightBac! Available online: https://www.fightbac.org/about-us/partnership-history/ (accessed on 9 July 2020).
- United States Department of Agriculture. Keep Food Safe! Food Safety Basics. Available online: https://www.fsis.usda.gov/wps/portal/fsis/topics/food-safety-education/get-answers/food-safety-fact-sheets/safe-food-handling/keep-food-safe-food-safety-basics/CT_Index (accessed on 9 July 2020).
- Center for Disease Control and Prevention. Simply Put: A Guide for Creating Easy-to-Understand Materials. Available online: https://www.cdc.gov/healthliteracy/pdf/Simply_Put.pdf (accessed on 15 March 2018).
- Wilson, A.M.; Meyer, S.B.; Webb, T.; Henderson, J.; Coveney, J.; McCullum, D.; Ward, P.R. How food regulators communicate with consumers about food safety. Br. Food J. 2015, 117, 2129–2142. [Google Scholar] [CrossRef]
- Yeung, H.F.; Bruhn, C.; Blackburn, M.; Ganthavorn, C.; Martin, A.; Mendoza, C.; Neelon, M.; Smith, D.; Soule, K.; Spezzano, T.M.; et al. Evaluation of in-person and on-line food safety education programs for community volunteers. Food Control 2019, 99, 34–39. [Google Scholar] [CrossRef]
- Patten, E.; Sneed, J. Food Handling Practices and Food Safety Messaging Preferences of African-American and Latino Consumers. J. Hum. Sci. Ext. 2018, 6, 1–17. [Google Scholar]
- Barrett, T.; Feng, Y.; Chen, H.; Chuang, E.; Feist, S.; Choate, M. Evaluation of the fight BAC! The story of your dinner campaign video: A multistate study. J. Food Prot. 2020, 83, 584–598. [Google Scholar] [CrossRef] [PubMed]
- Chambers, D.H.; Meck Higgins, M.; Roeger, C.; Allison, A.M.A. Nutrition education displays for young adults and older adults. Health Educ. 2004, 104, 45–54. [Google Scholar] [CrossRef]
- Chambers, D.H.; Muñoz, A.M. Focus-group evaluation of nutrition education displays by Hispanic adults who live in the USA. Health Educ. 2009, 109, 439–450. [Google Scholar] [CrossRef]
- Wolf, H.V.; Perko, T.; Thijssen, P. How to Communicate Food Safety after Radiological Contamination: The Effectiveness of Numerical and Narrative News Messages. Int. J. Environ. Res. Public Health 2020, 17, 4189. [Google Scholar] [CrossRef]
- Redmond, E.C.; Griffith, C.J. A pilot study to evaluate the effectiveness of a social marketing-based consumer food safety initiative using observation. Br. Food J. 2006, 108, 753–770. [Google Scholar] [CrossRef]
- Carrete, L.; Arroyo, P. Social marketing to improve healthy dietary decisions: Insights from a qualitative study in Mexico. Qual. Mark. Res. 2014, 17, 239–263. [Google Scholar] [CrossRef]
- Nobles, J.; Thomas, C.; Gross, Z.B.; Hamilton, M.; Trinder-Widdess, Z.; Speed, C.; Gibson, A.; Davies, R.; Farr, M.; Jago, R.; et al. “Let’s Talk about Physical Activity”: Understanding the Preferences of Under-Served Communities When Messaging Physical Activity Guidelines to the Public. Int. J. Environ. Res. Public Health 2020, 17, 2782. [Google Scholar] [CrossRef]
- Patten, C.A.; Lando, H.; Resnicow, K.; Decker, P.A.; Smith, C.M.; Hanza, M.M.; Burhansstipanov, L.; Scott, M. Developing health communication messaging for a social marketing campaign to reduce tobacco use in pregnancy among Alaska native women. J. Commun. Healthc. 2018, 11, 252–262. [Google Scholar] [CrossRef] [PubMed]
- World Health Organization. Make It Visual. Available online: https://www.who.int/about/communications/understandable/visuals (accessed on 24 August 2020).
- Schaupp, L.C.; Belanger, F. A Conjoint Analysis of Online Consumer Satisfaction 1. J. Electron. Commer. Res. 2005, 6, 95–111. [Google Scholar]
- Della, L.J.; D’Silva, M.U.; Best, L.E.; Smith, S.E.; Carthan, Q.N.; Rajack-Talley, T.A. Modeling message preferences: An adaptive conjoint analysis of persuasive messaging to increase fruit and vegetable consumption. J. Commun. Healthc. 2016, 9, 164–177. [Google Scholar] [CrossRef]
- Schiøtz, M.; Bøgelund, M.; Almdal, T.; Willaing, I. Discrete choice as a method for exploring education preferences in a Danish population of patients with type 2 diabetes. Patient Educ. Couns. 2012, 87, 217–225. [Google Scholar] [CrossRef] [PubMed]
- Di Vita, G.; Blanc, S.; Mancuso, T.; Massaglia, S.; La Via, G.; D’Amico, M. Harmful Compounds and Willingness to Buy for Reduced-Additives Salami. An Outlook on Italian Consumers. Int. J. Environ. Res. Public Health 2019, 16, 2605. [Google Scholar] [CrossRef] [PubMed]
- Yu, H.; Bogue, J. Concept optimisation of fermented functional cereal beverages. Br. Food J. 2013, 115, 541–563. [Google Scholar] [CrossRef]
- Moskowitz, H.; Beckley, J.; Minkus-Mckenna, D. Use of conjoint analysis to assess web-based communications on functional foods. Appetite 2004, 43, 85–92. [Google Scholar] [CrossRef] [PubMed]
- Cunningham, C.E.; Chen, Y.; Deal, K.; Rimas, H.; McGrath, P.; Reid, G.; Lipman, E.; Corkum, P. The interim service preferences of parents waiting for children’s mental health treatment: A discrete choice conjoint experiment. J. Abnorm. Child Psychol. 2013, 41, 865–877. [Google Scholar] [CrossRef]
- Ryan, M. Taking conjoint analysis to task. Value Health 2011, 14, 401–402. [Google Scholar] [CrossRef]
- Amoroso, S.F. Trade-off analysis works best as fine-tuning tool for solving tactical marketing problems. Mark. News 1983, 17, 22–23. [Google Scholar]
- Feliciano, D.; Albisu, L.M. A new ready-to-eat dish for a traditional market. J. Foodserv. 2006, 17, 124–134. [Google Scholar] [CrossRef]
- Skolos, N.; Wedell, T. Type, Image, Message: A Graphic Design Layout Workshop; Rockport Publishers: Gloucester, MA, USA, 2006; ISBN 9781616735913. [Google Scholar]
- Johnson, J. Designing with the Mind in Mind: Simple Guide to Understanding User Interface Design Rules; Morgan Kauffman Publishers: Burlington, MA, USA, 2010; ISBN 9780123750303. [Google Scholar]
- Pettersson, R. Introduction to Message Design. J. Vis. Lit. 2012, 31, 93–104. [Google Scholar] [CrossRef]
- United States Department of Agriculture. Food Safety Inspection Service Is It Done Yet? (Downloadable Magnet). Available online: https://www.fsis.usda.gov/wps/portal/fsis/topics/food-safety-education/teach-others/download-materials (accessed on 1 July 2020).
- Cafarelli, B.; Pilone, V.; Conte, A.; Gammariello, D.; Del Nobile, M.A. Development of Consumer Acceptable Products using CUB Analysis: An Example with burgers from Dairy Cattle. J. Sens. Stud. 2015, 30, 413–424. [Google Scholar] [CrossRef]
- Rao, V.R. Applied Conjoint Analysis; Springer: Berlin/Heidelberg, Germany, 2014; ISBN 9783540877530. [Google Scholar]
- Arboretti Giancristofaro, R.; Bordignon, P. Consumer preferences in food packaging: CUB models and conjoint analysis. Br. Food J. 2016, 118, 527–540. [Google Scholar] [CrossRef]
- Jinkarn, T.; Suwannaporn, P. Trade-off analysis of packaging attributes for foods and drinks. Br. Food J. 2015, 117, 139–156. [Google Scholar] [CrossRef]
- Kobayashi, M.L.; Benassi, M.d.T. Impact of Packaging Characteristics on Consumer Purchase Intention: Instant Coffee in Refill Packs and Glass Jars. J. Sens. Stud. 2015, 30, 169–180. [Google Scholar] [CrossRef]
- Moskowitz, H.R. New Directions for Product Testing and Sensory Analysis of Food; Food and Nutrition Press, Inc.: Westport, CT, USA, 1985. [Google Scholar]
- Meyerding, S.; Schaffmann, A.-L.; Lehberger, M. Consumer Preferences for Different Designs of Carbon Footprint Labelling on Tomatoes in Germany—Does Design Matter? Sustainability 2019, 11, 1587. [Google Scholar] [CrossRef]
- Taylor, C.R. The imminent return of the advertising jingle. Int. J. Advert. 2015, 34, 717–719. [Google Scholar] [CrossRef]
- Carcamo, J. Sonic boom: Television, YouTube and other electronic media are constant sources of marketing tunes, melodies and jingles. Casino J. 2018, 31, 18. [Google Scholar]
- International Association for Food Protection. Food Safety Icons. Available online: https://www.foodprotection.org/resources/food-safety-icons/ (accessed on 22 July 2020).
- Mena, B.; Ashman, H.; Dunshea, F.R.; Hutchings, S.; Ha, M.; Warner, R.D. Exploring Meal and Snacking Behaviour of Older Adults in Australia and China. Foods 2020, 9, 426. [Google Scholar] [CrossRef]
- Danaher, P.J. Using conjoint analysis to determine the relative importance of service attributes measured in customer satisfaction surveys. J. Retail. 1997, 73, 235–260. [Google Scholar] [CrossRef]
- Shan, L.; Wang, S.; Wu, L.; Tsai, F.-S. Cognitive Biases of Consumers’ Risk Perception of Foodborne Diseases in China: Examining Anchoring Effect. Int. J. Environ. Res. Public Health 2019, 16, 2268. [Google Scholar] [CrossRef] [PubMed]
- Graham, A.L.; Papandonatos, G.D.; Jaco, M.A.; Amato, M.S.; Cha, S.; Cohn, A.M.; Abro, L.C.; Whittaker, R. Optimizing text messages to promote engagement with internet smoking cessation treatment: Results from a factorial screening experiment. J. Med. Internet Res. 2020, 22, e17734. [Google Scholar] [CrossRef] [PubMed]
- Roșcan, A. The use of slogans in influence campaigns. In Proceedings of the International Scientific Conference “Strategies XXI”, Bucharest, Romania, 10–11 April 2017; Volume 3, pp. 76–81. [Google Scholar]
- Chambers, E.; Godwin, S.L.; Vecchio, F.A. Cognitive strategies for reporting portion sizes using dietary recall procedures. J. Am. Diet. Assoc. 2000, 100, 891–897. [Google Scholar] [CrossRef]
- Chambers, E.; McGuire, B.; Godwin, S.; McDowell, M.; Vecchio, F. Quantifying portion sizes for selected snack foods and beverages in 24-hour dietary recalls. Nutr. Res. 2000, 20, 315–326. [Google Scholar] [CrossRef]
- Godwin, S.; McGuire, B.; Chambers, E.; McDowell, M.; Cleveland, L.; Edwards-Perry, E.; Ingwersen, L. Evaluation of portion size estimation aids used for meat in dietary surveys. Nutr. Res. 2001, 21, 1217–1233. [Google Scholar] [CrossRef]
- Godwin, S.; Chambers, E.; Cleveland, L.; Ingwersen, L. A New Portion Size Estimation Aid for Wedge-Shaped Foods. J. Am. Diet. Assoc. 2006, 106, 1246–1250. [Google Scholar] [CrossRef]
- Hough, G.; Wakeling, I.; Mucci, A.; Chambers, E.; Gallardo, I.M.; Alves, L.R. Number of consumers necessary for sensory acceptability tests. Food Qual. Prefer. 2006, 17, 522–526. [Google Scholar] [CrossRef]
- Chambers, E.; Wolf, M. Sensory Testing Methods, 2nd ed.; ASTM International: Philadelphia, PA, USA, 1996. [Google Scholar]
- Meilgaard, M.C.; Civille, G.V.; Carr, B.T. Sensory Evaluation Techniques, 5th ed.; CRC Press Taylor & Francis Group: Boca Raton, FL, USA, 2016; ISBN 9781482276459. [Google Scholar]
- International Organization for Standardization. 11136:2014: Sensory Analysis—Methodology—General Guidance for Conducting Hedonic Tests with Consumers in a Controlled Area; Internation Organization for Standardization: Geneva, Switzerland, 2014. [Google Scholar]


| Titles | |
| Title 1 | Recommended Storage Times For Ready To Eat Foods |
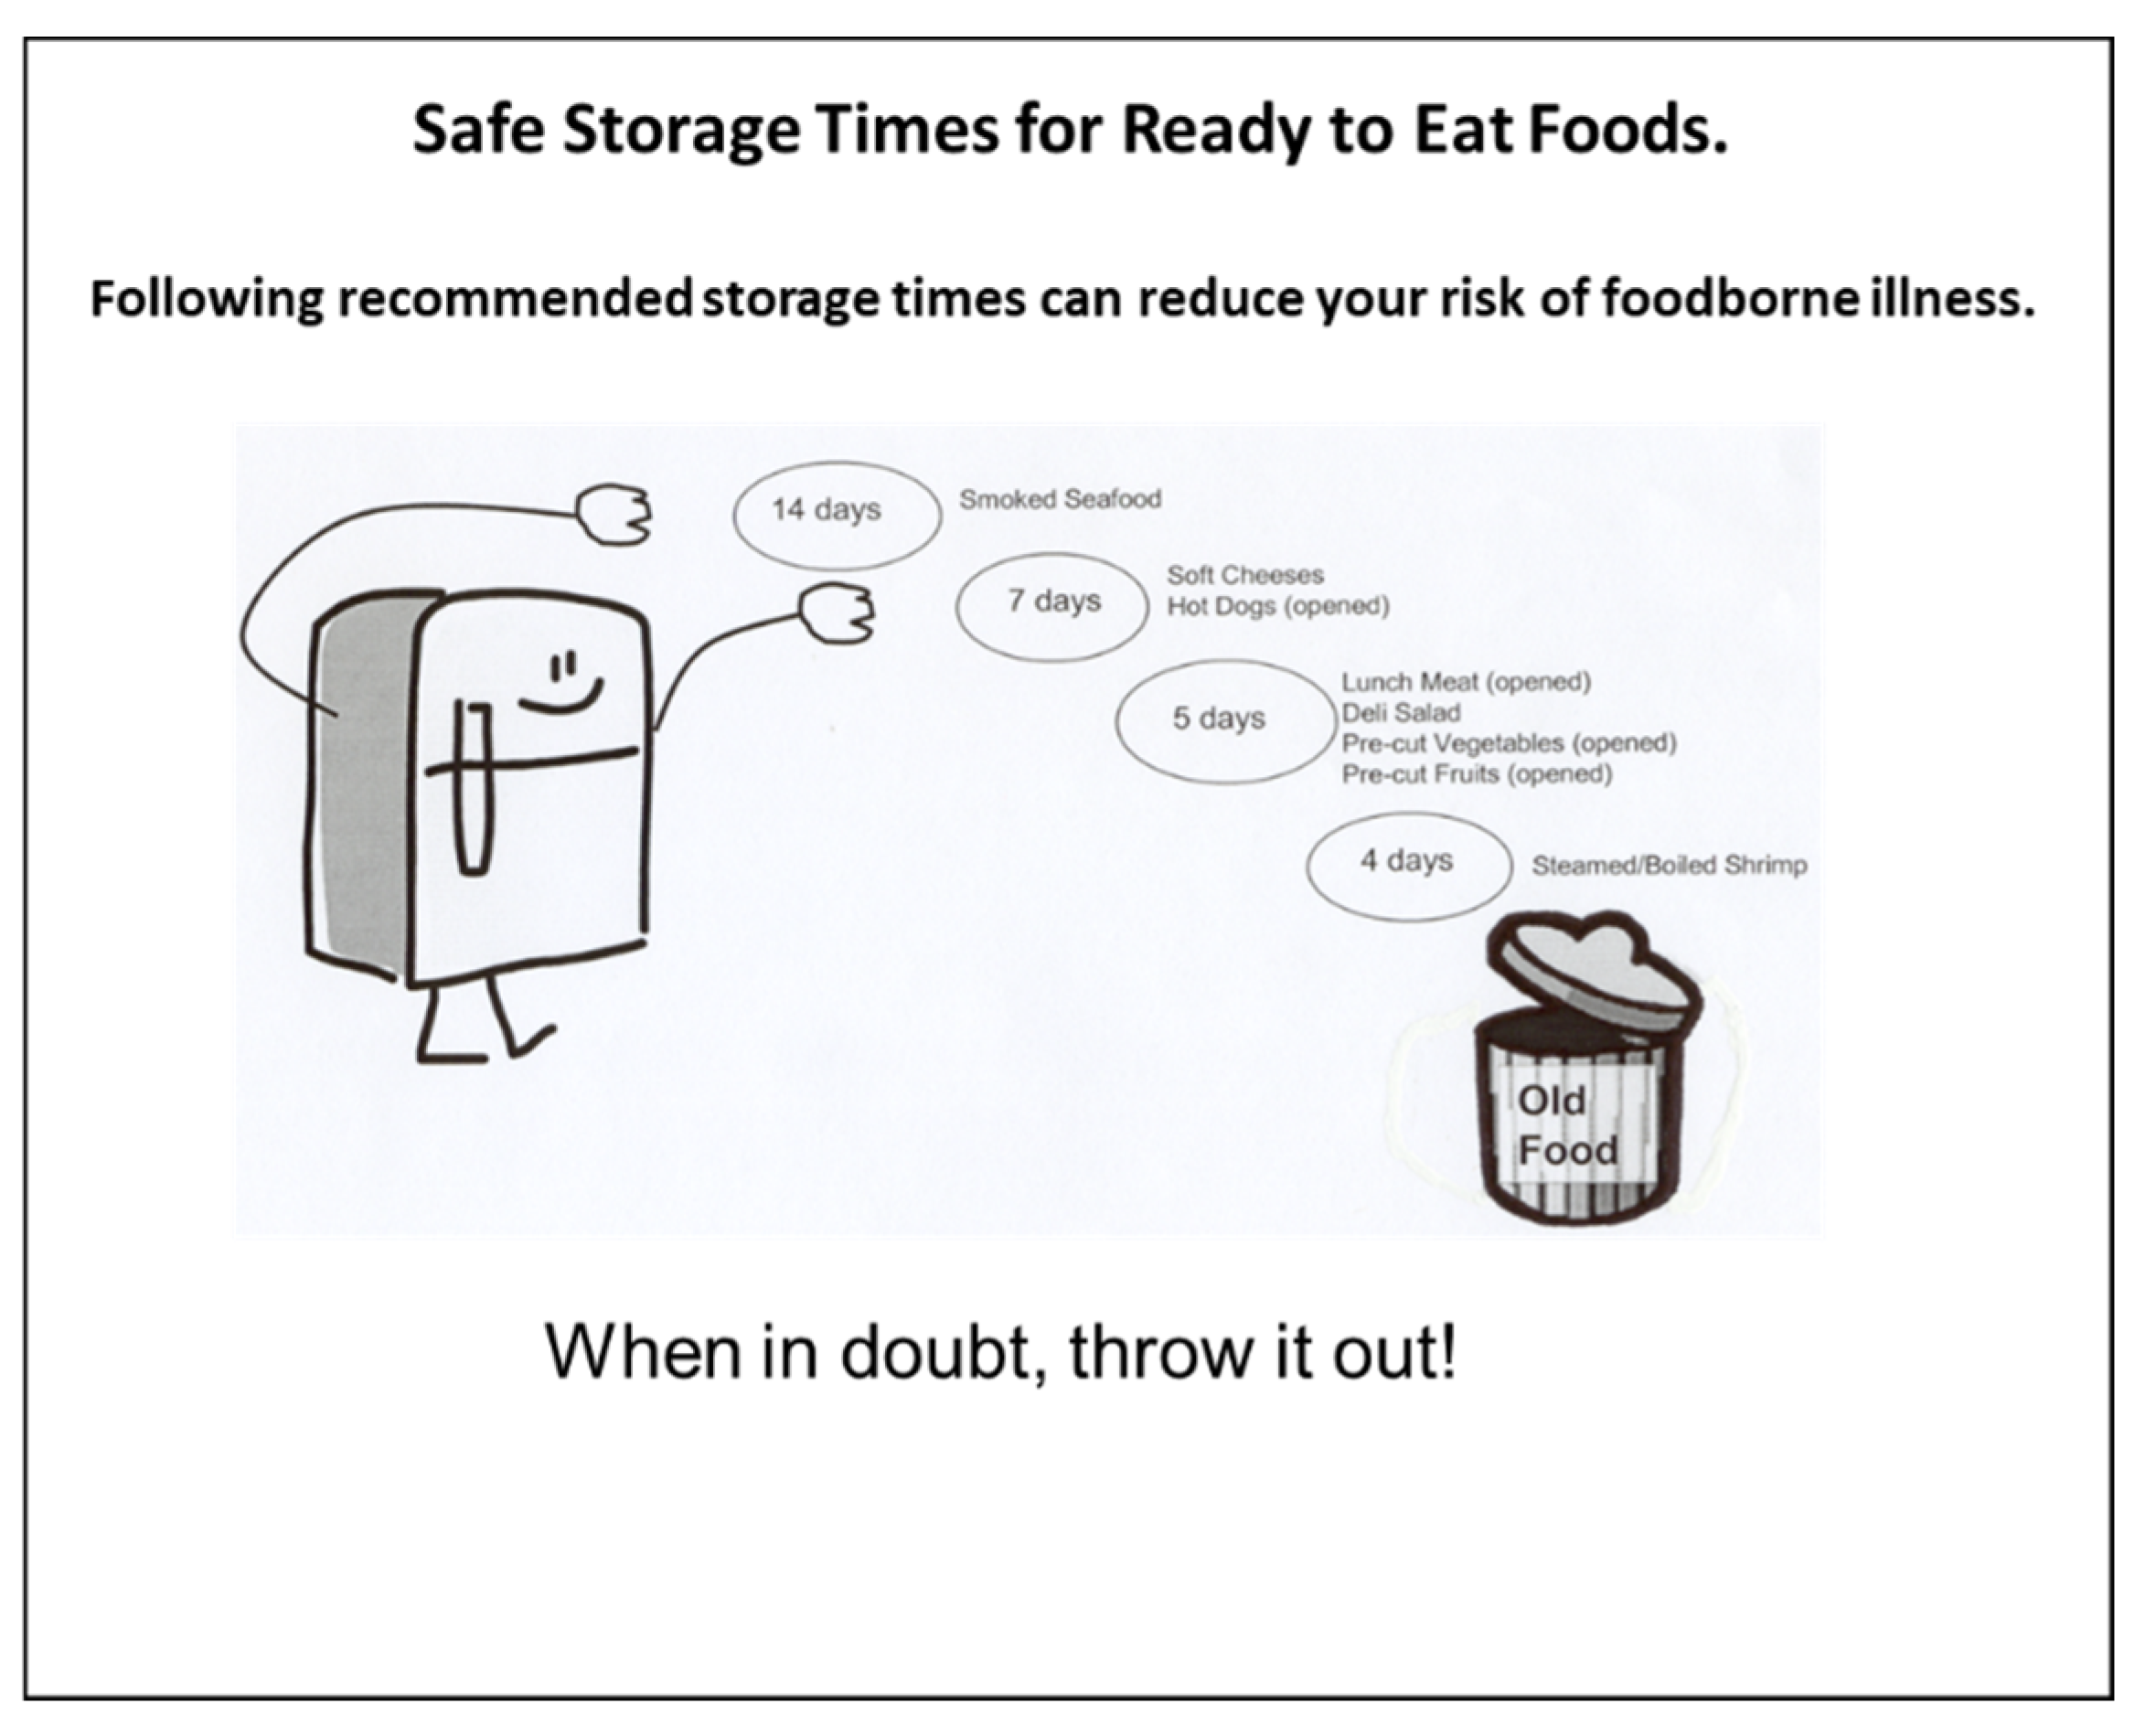
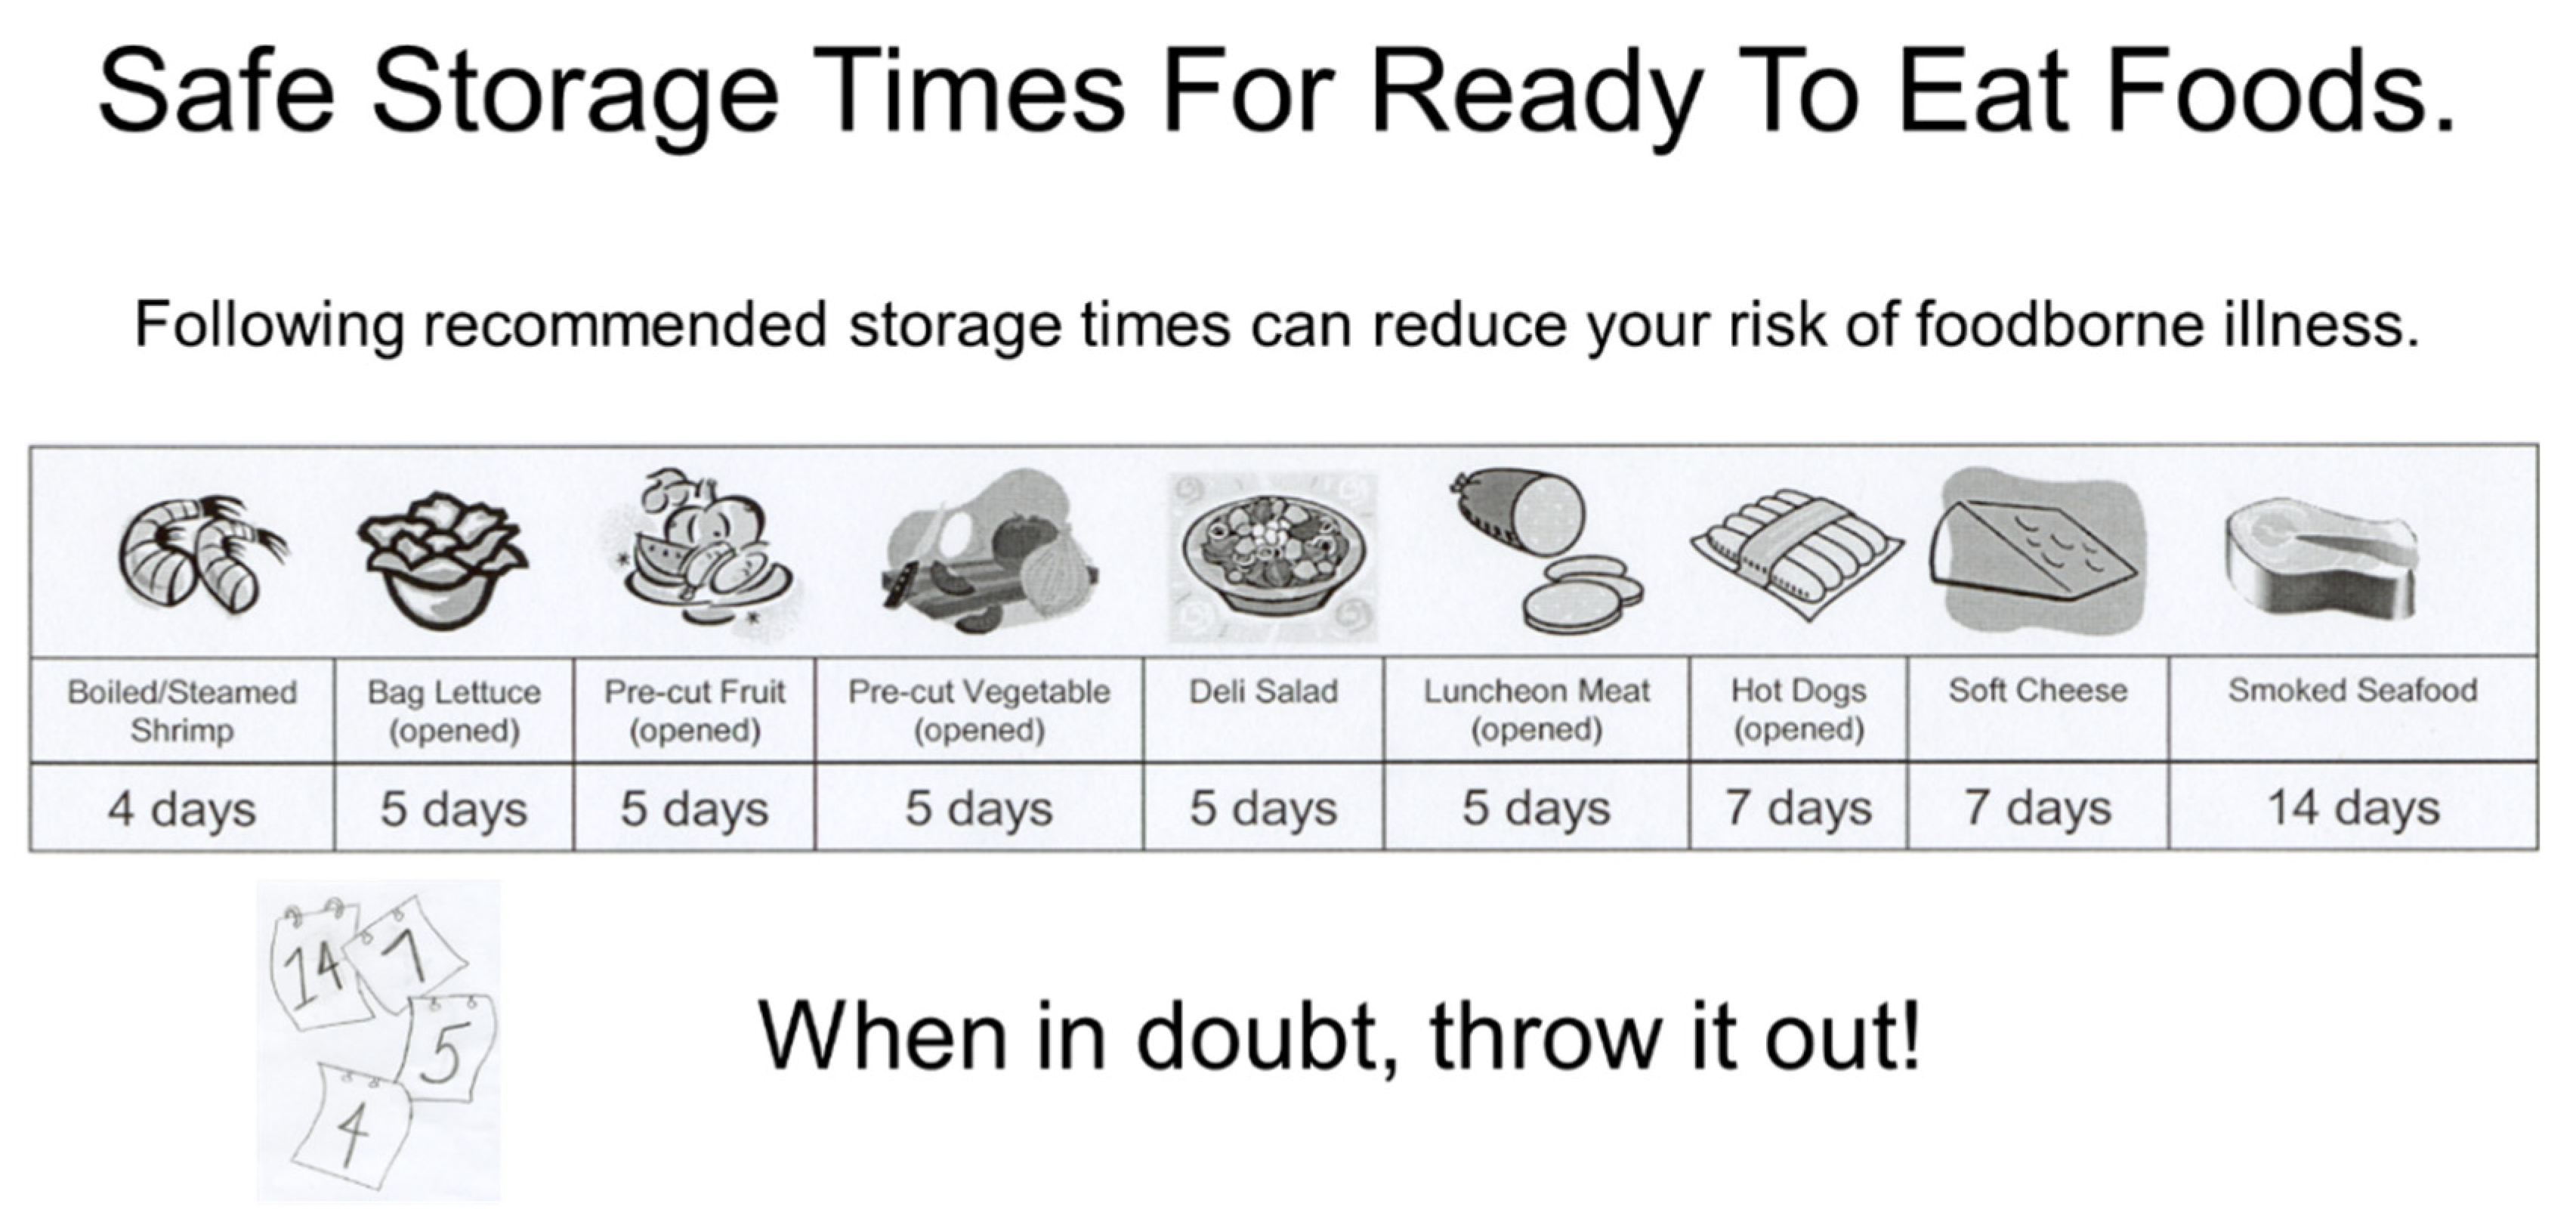
| Title 2 | Safe Storage Times For Ready To Eat Foods |
| Title 3 | How Long Can I Keep It? |
| Messages | |
| Message 1 | Storing foods too long can make you or your children sick. |
| Message 2 | Short storage times will keep refrigerated foods safe to eat. |
| Message 3 | FDA & USDA have recommended storage times for ready to eat foods. |
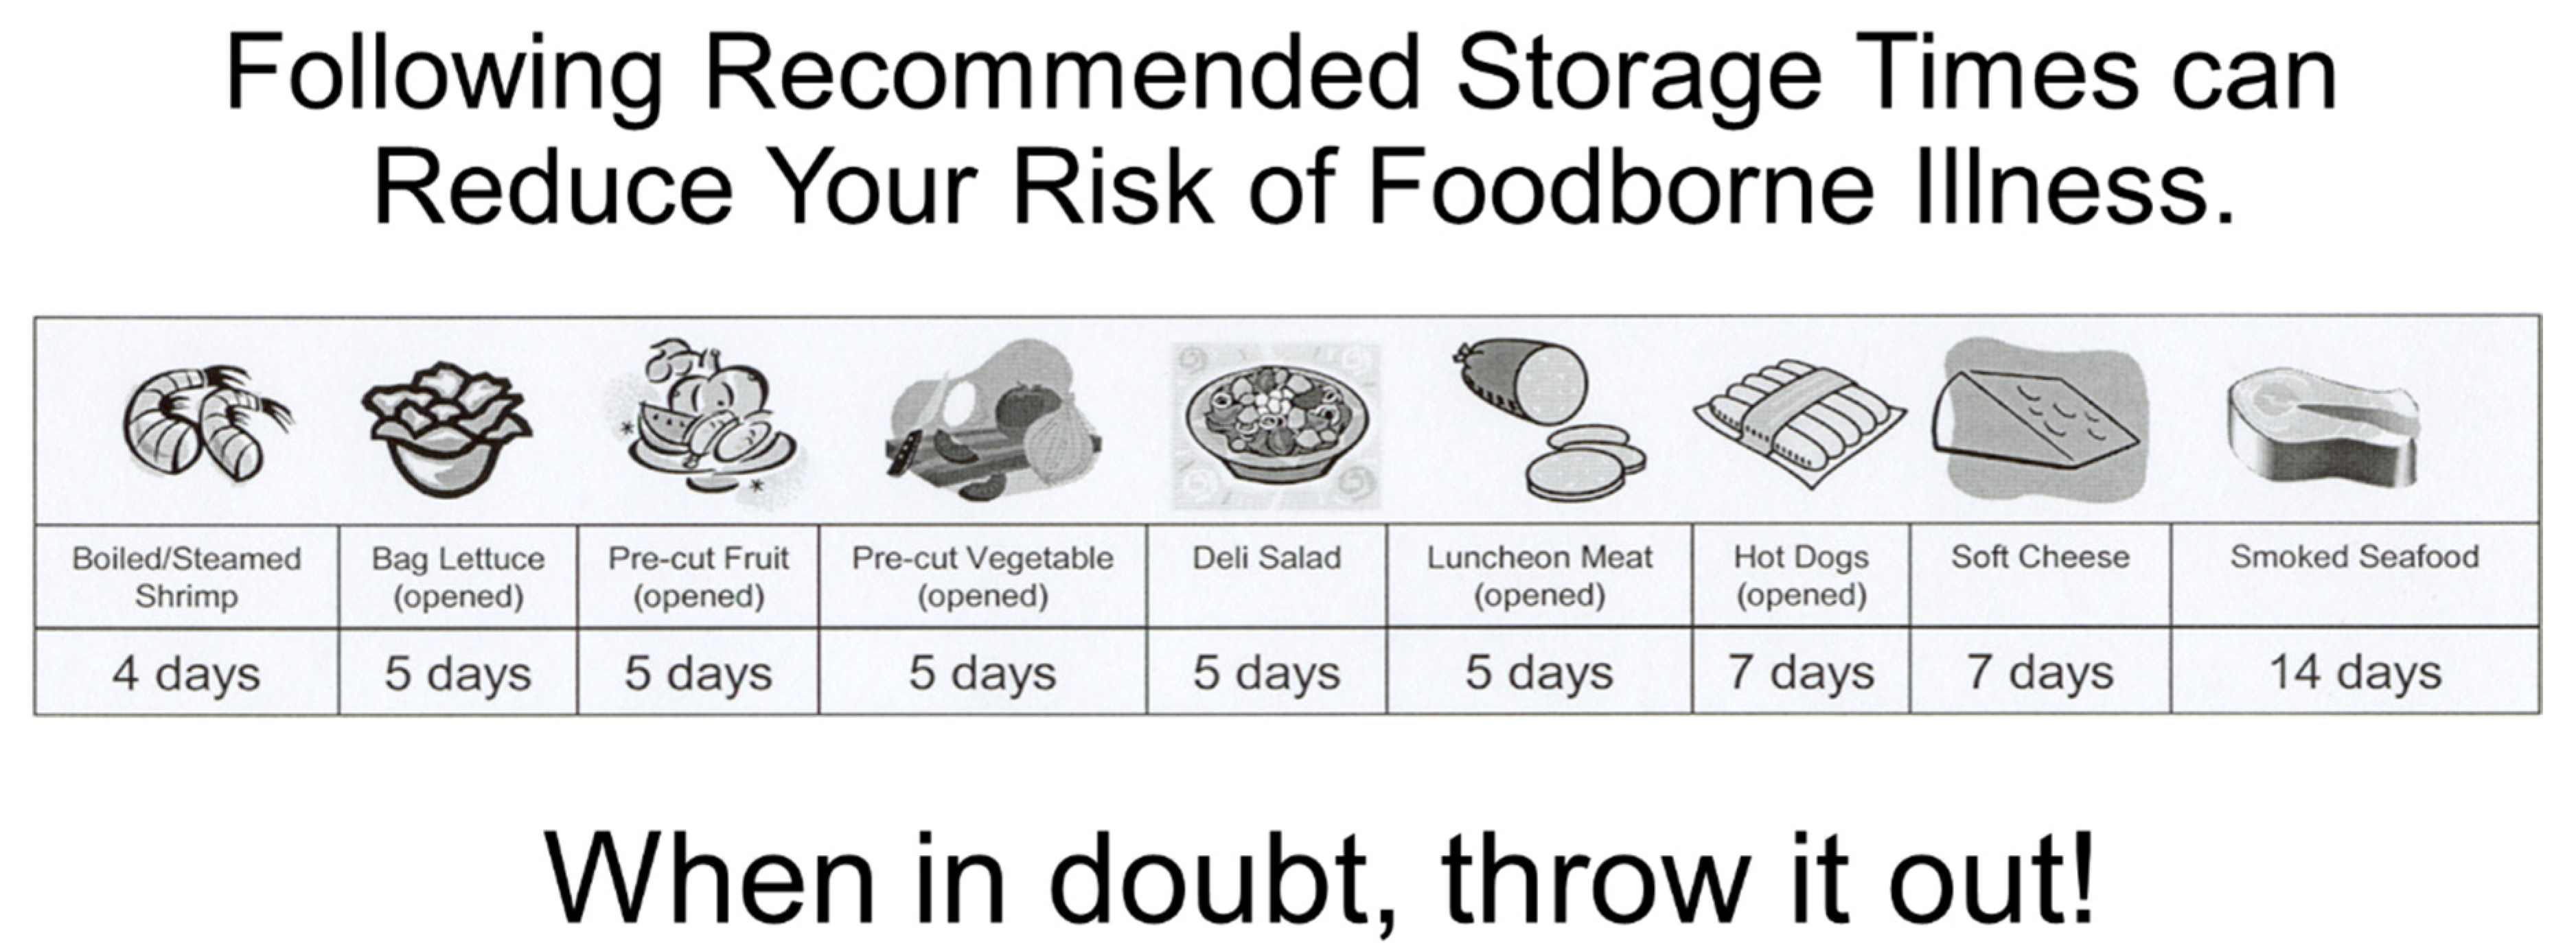
| Message 4 | Following recommended storage times can reduce your risk of foodborne illness. |
| Message 5 | Do not store foods longer than recommended. |
| Message 6 * | None |
| Slogans | |
| Slogan 1 | When in doubt, throw it out! |
| Slogan 2 | How long is it safe? |
| Slogan 3 | Use it or throw it? |
| Slogan 4 | Eat it or toss it! |
| Slogan 5 | Toss it or toss it! |
| Slogan 6 * | None |
| Category | Relative Importance, % |
|---|---|
| Title | 3.8 |
| Message | 17.1 |
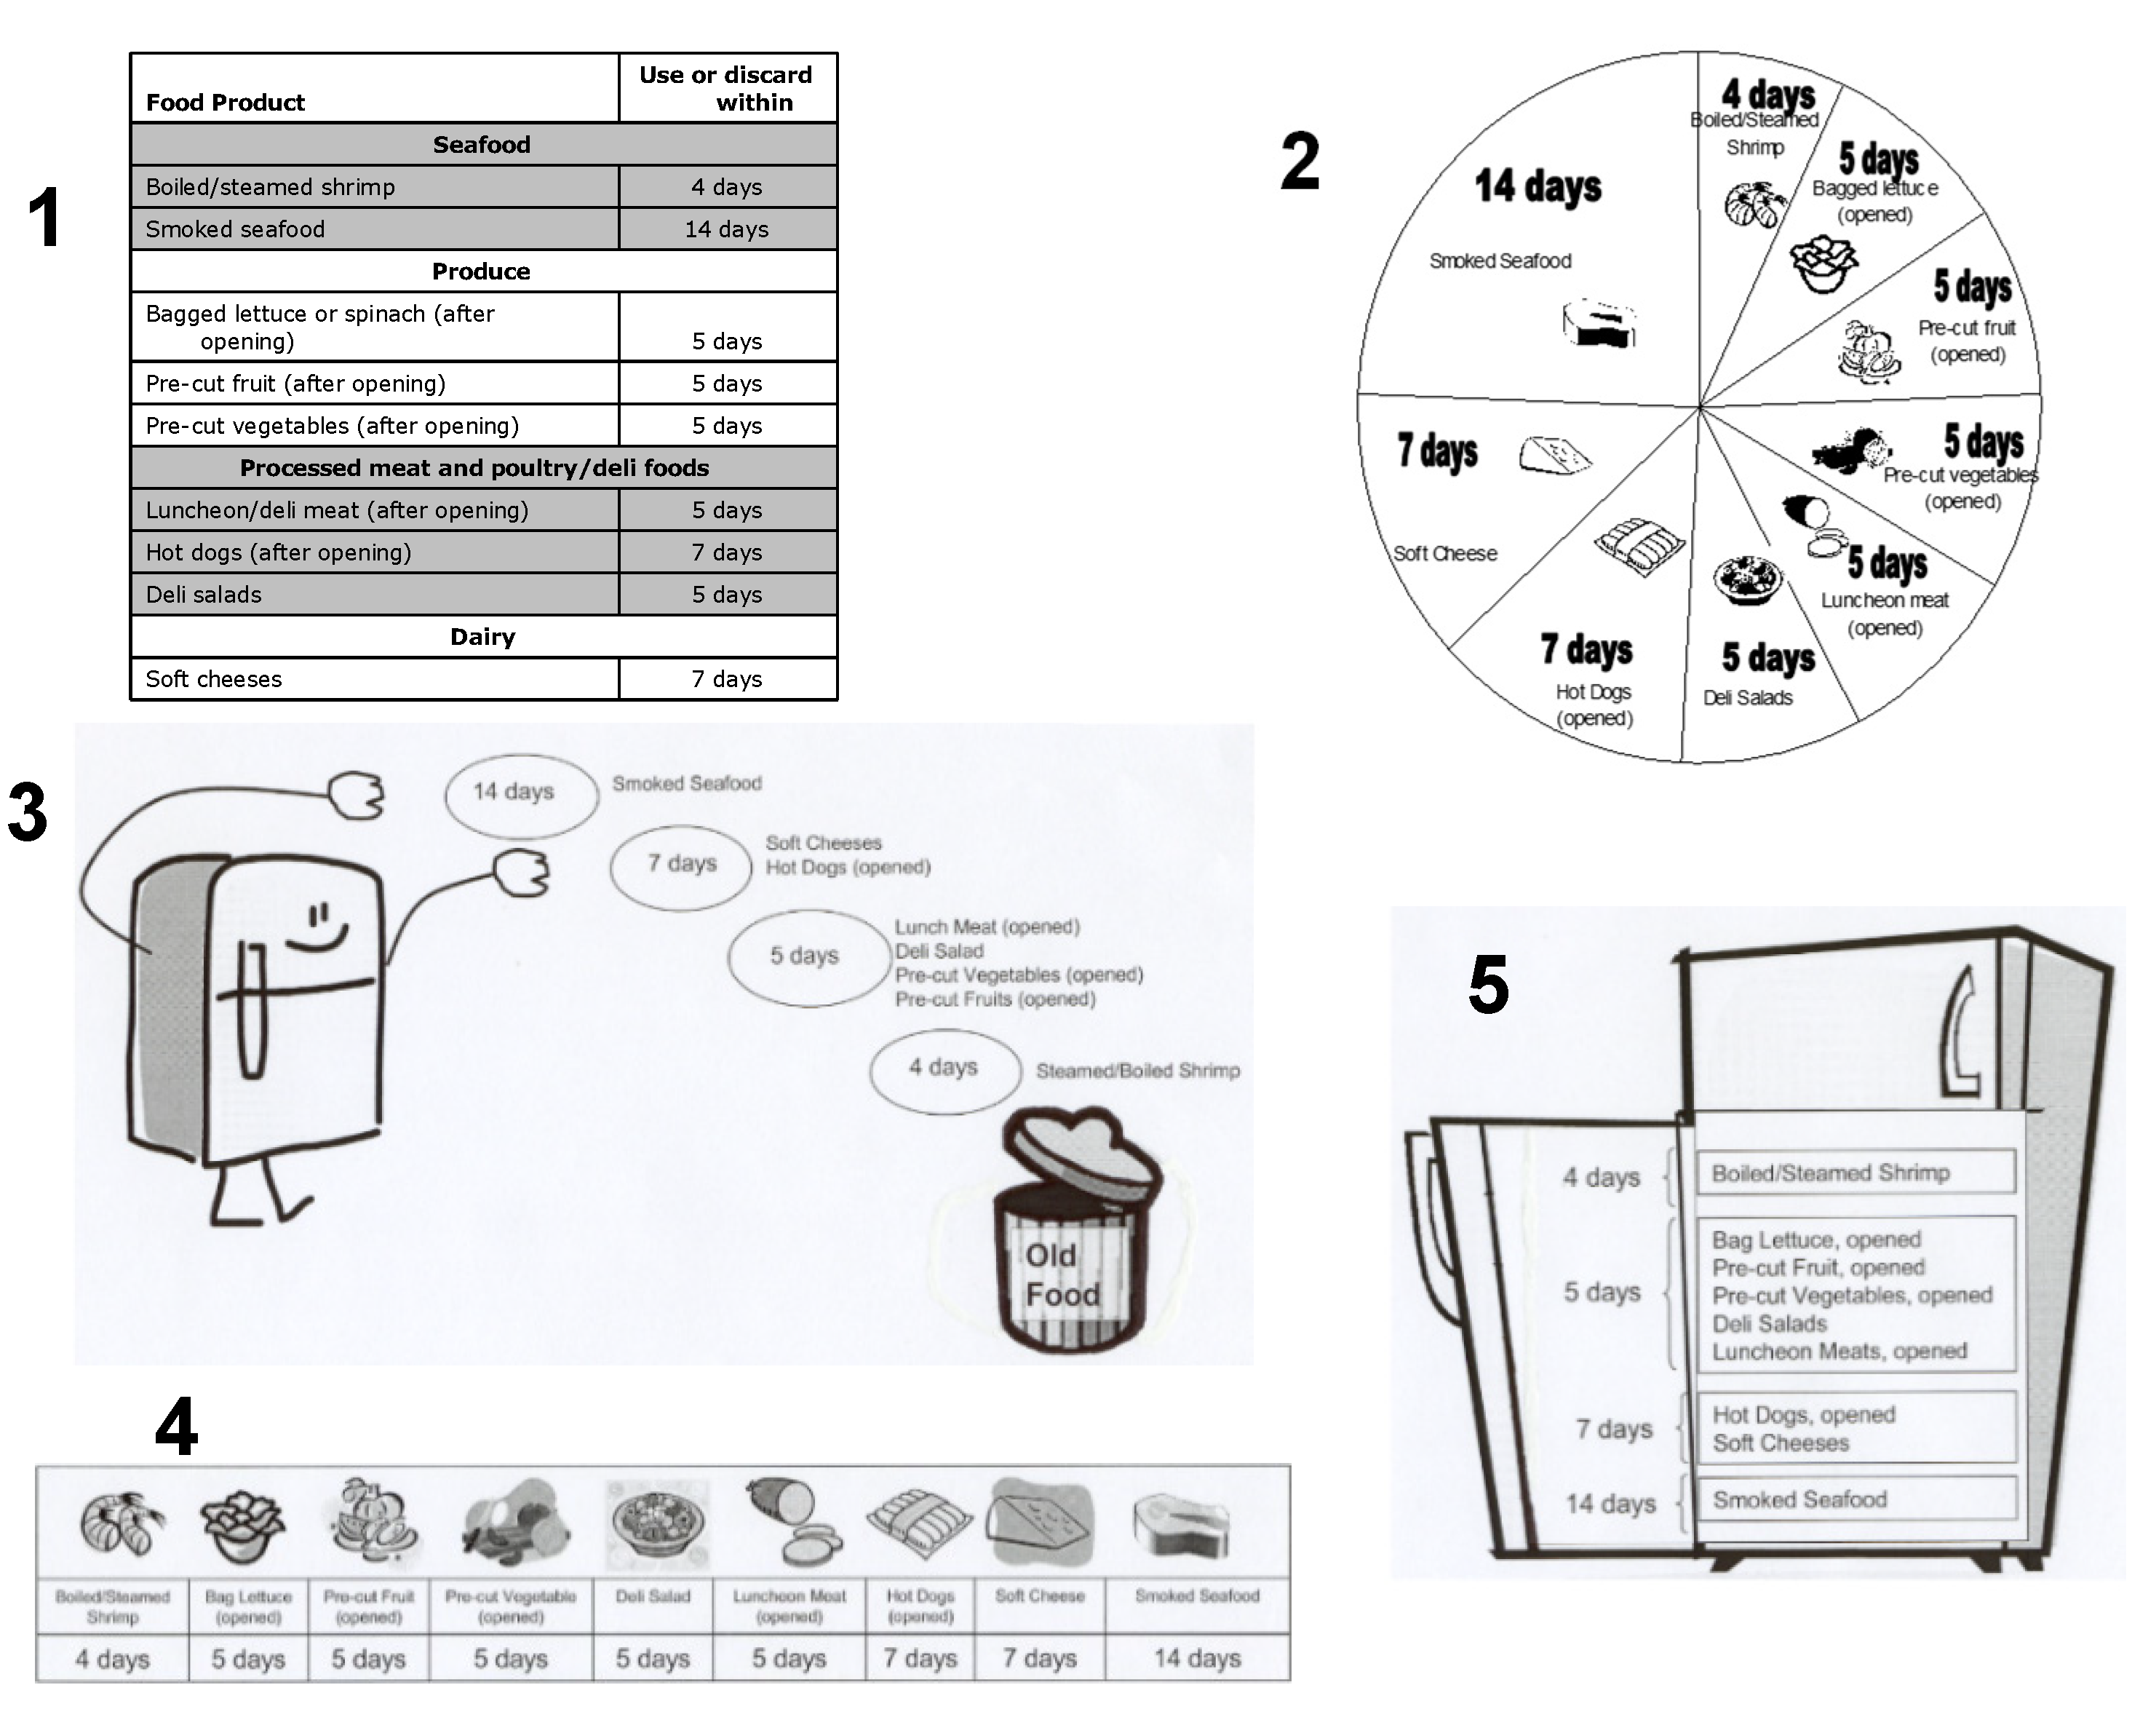
| Graphic | 51.2 |
| Slogan | 18.9 |
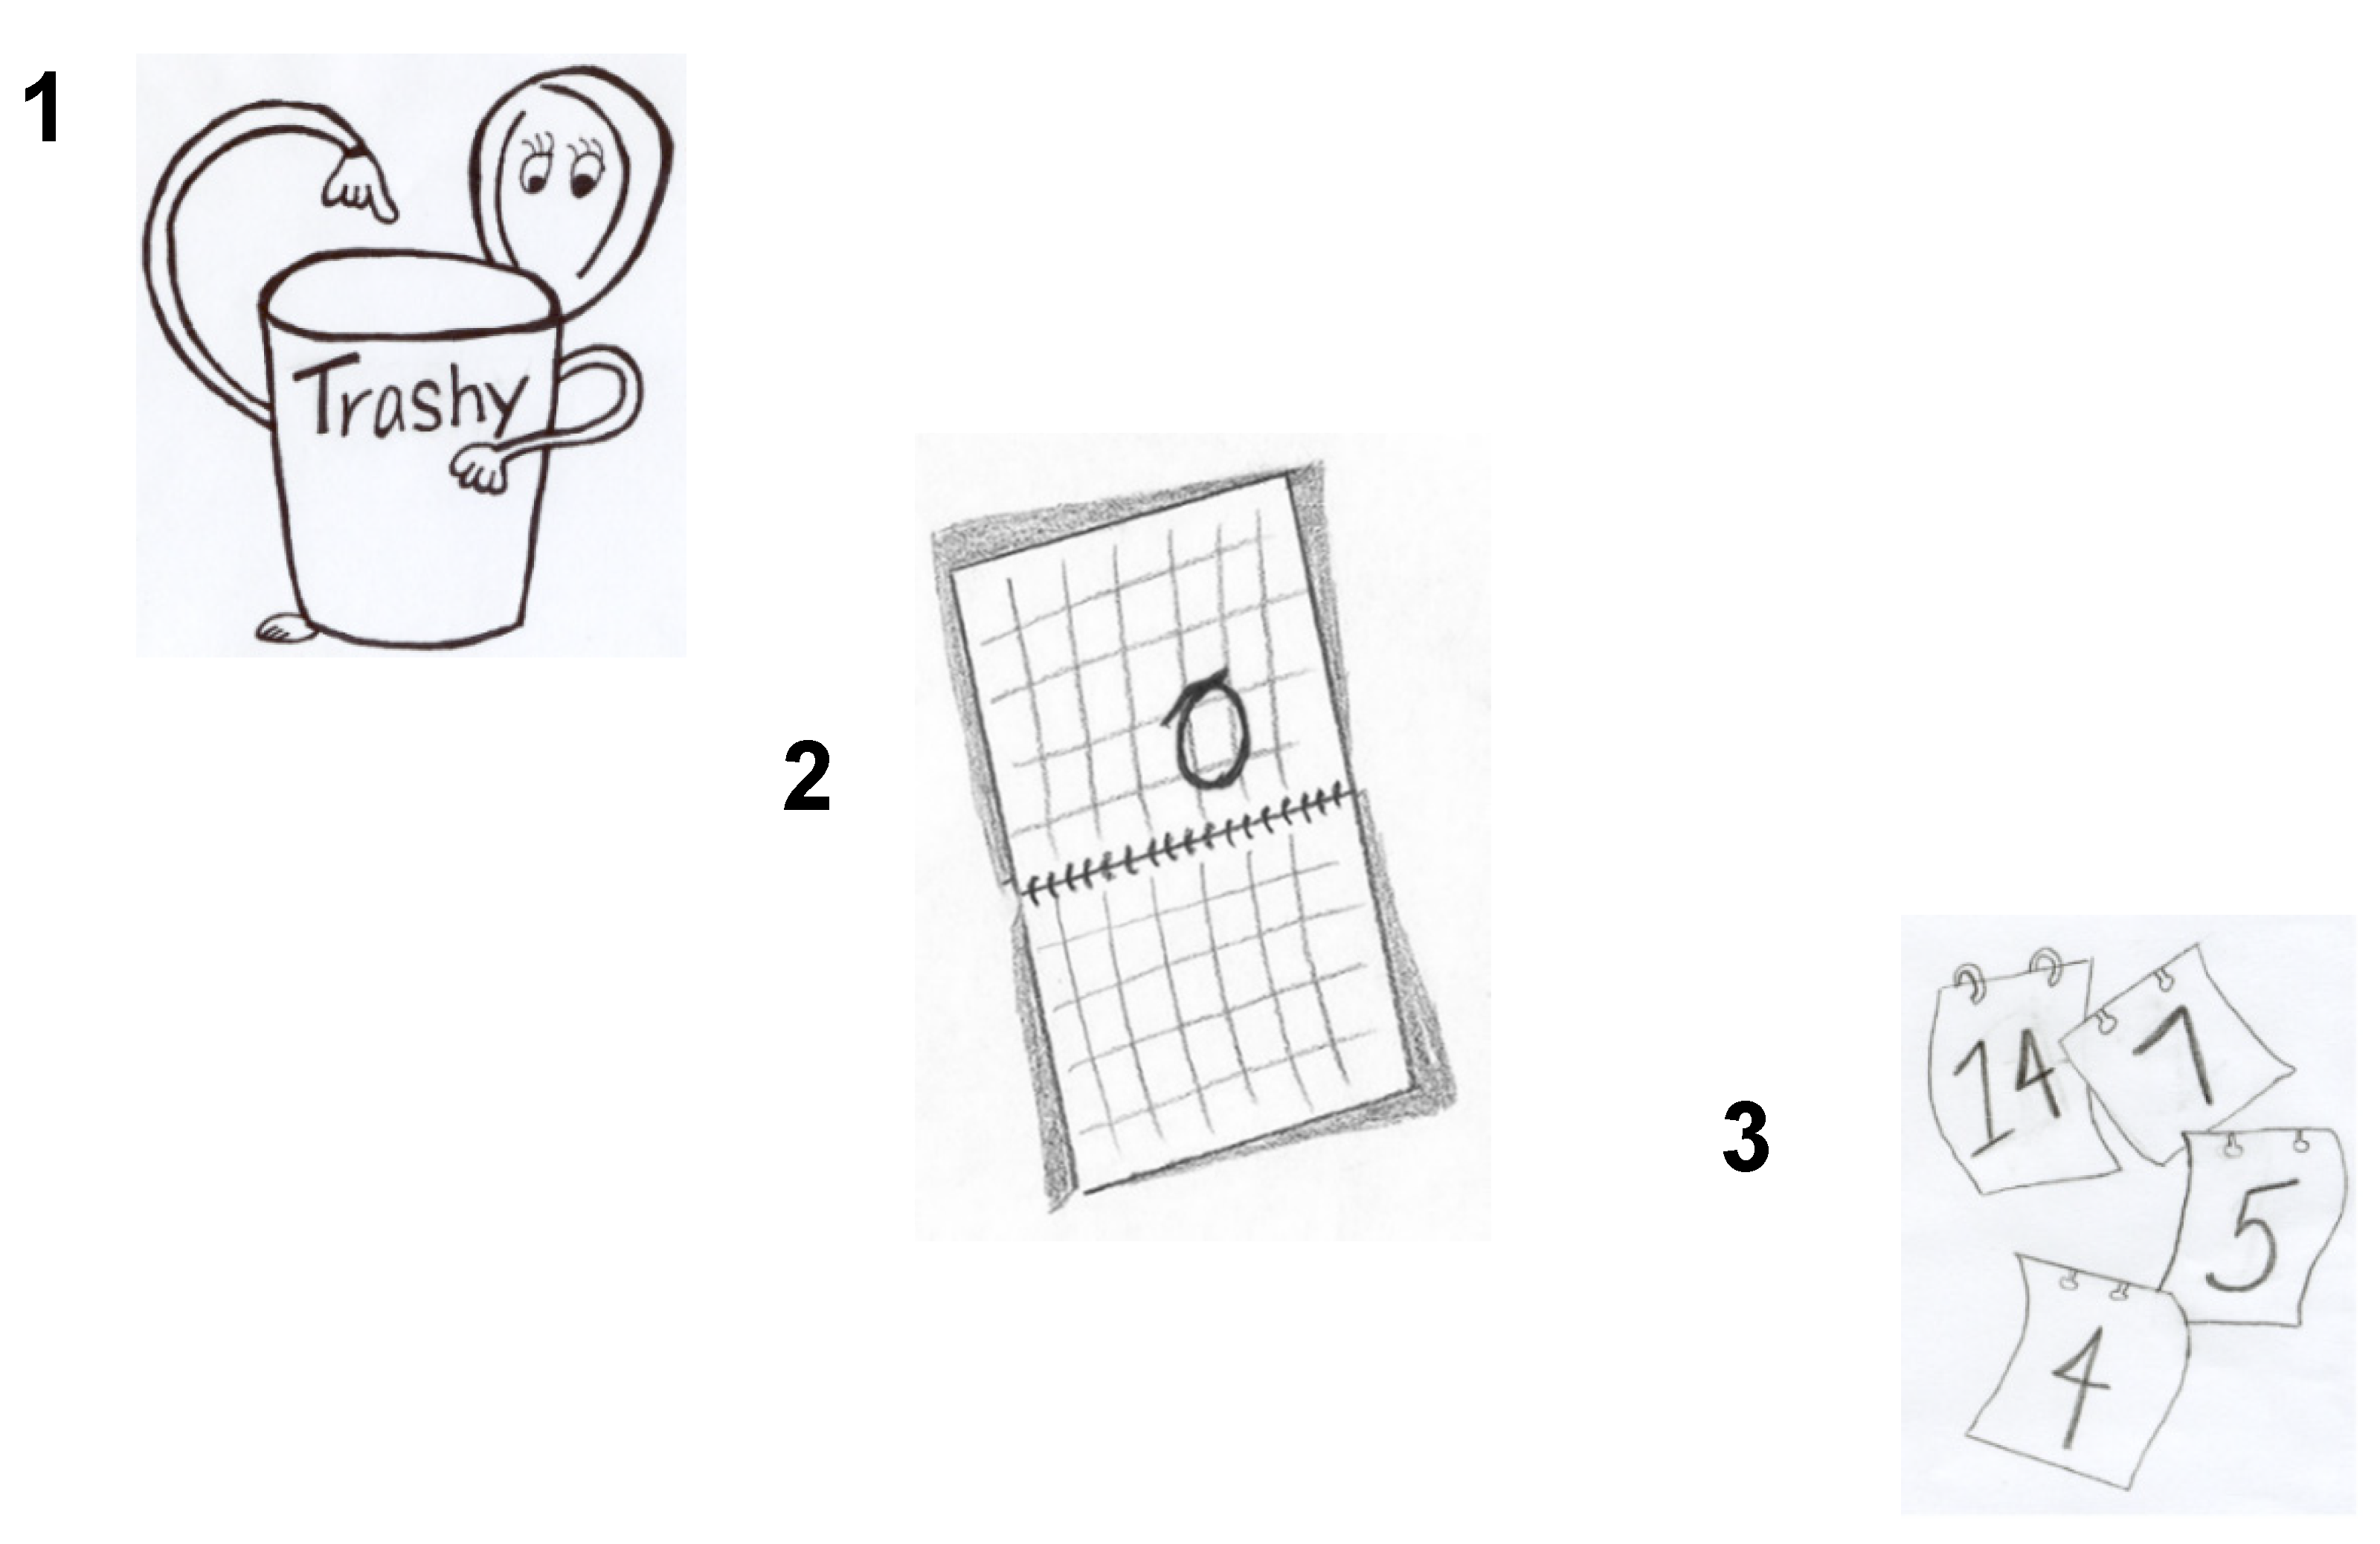
| Icon | 9.1 |
| Category | Attribute Label from Schematic | Utility Score for Category Attribute | Attribute Differences |
|---|---|---|---|
| Title | Title 1 | −0.0260 | NS |
| Title 2 | 0.0496 | ||
| Title 3 | −0.0236 | ||
| Message | Message 1 | 0.0138 | NS |
| Message 2 | 0.0626 | ||
| Message 3 | 0.0900 | ||
| Message 4 | 0.1173 | ||
| Message 5 | −0.0640 | ||
| Message 6 | −0.2197 | ||
| Graphic | Graphic 1 | 0.0873b | <0.0001 |
| Graphic 2 | −0.0158c | ||
| Graphic 3 | −0.4613c | ||
| Graphic 4 | 0.5501a | ||
| Graphic 5 | −0.1602c | ||
| Slogan | Slogan 1 | 0.2031 | <0.10 |
| Slogan 2 | 0.0833 | ||
| Slogan 3 | −0.034 | ||
| Slogan 4 | −0.0724 | ||
| Slogan 5 | −0.1697 | ||
| Slogan 6 | −0.0104 | ||
| Icon | Icon 1 | −0.0191 | NS |
| Icon 2 | 0.0397 | ||
| Icon 3 | 0.0796 | ||
| Icon 4 | −0.1001 |
© 2020 by the authors. Licensee MDPI, Basel, Switzerland. This article is an open access article distributed under the terms and conditions of the Creative Commons Attribution (CC BY) license (http://creativecommons.org/licenses/by/4.0/).
Share and Cite
Chambers, D.; Chambers, E.; Godwin, S.; Doan, A.; Cates, S. Developing a Messaging Graphic for Storage Times of Refrigerated Ready to Eat (RTE) Foods for a Consumer Food Safety Health Campaign. Eur. J. Investig. Health Psychol. Educ. 2020, 10, 859-875. https://doi.org/10.3390/ejihpe10030062
Chambers D, Chambers E, Godwin S, Doan A, Cates S. Developing a Messaging Graphic for Storage Times of Refrigerated Ready to Eat (RTE) Foods for a Consumer Food Safety Health Campaign. European Journal of Investigation in Health, Psychology and Education. 2020; 10(3):859-875. https://doi.org/10.3390/ejihpe10030062
Chicago/Turabian StyleChambers, Delores, Edgar Chambers, Sandria Godwin, Alisa Doan, and Sheryl Cates. 2020. "Developing a Messaging Graphic for Storage Times of Refrigerated Ready to Eat (RTE) Foods for a Consumer Food Safety Health Campaign" European Journal of Investigation in Health, Psychology and Education 10, no. 3: 859-875. https://doi.org/10.3390/ejihpe10030062
APA StyleChambers, D., Chambers, E., Godwin, S., Doan, A., & Cates, S. (2020). Developing a Messaging Graphic for Storage Times of Refrigerated Ready to Eat (RTE) Foods for a Consumer Food Safety Health Campaign. European Journal of Investigation in Health, Psychology and Education, 10(3), 859-875. https://doi.org/10.3390/ejihpe10030062