
Numerical Simulation of the Novel Coronavirus Spread in Commercial Aircraft Cabin


Department of Air Traffic, College of Civil Aviation, Nanjing 211106, China
*
Author to whom correspondence should be addressed.
Processes 2021, 9(9), 1601; https://doi.org/10.3390/pr9091601
Submission received: 19 July 2021
/
Revised: 30 August 2021
/
Accepted: 2 September 2021
/
Published: 7 September 2021
(This article belongs to the Special Issue Air Quality Monitoring for Smart Cities and Industrial Applications)
Abstract
:Passengers carrying the severe acute respiratory syndrome coronavirus 2 (SARS-CoV-2) in a commercial aircraft cabin may infect other passengers and the cabin crew. In this study, a cabin model of the seven-row Airbus A320 aircraft is constructed and meshed for simulating the SARS-CoV-2 spread in the cabin with a virus carrier using the Computational Fluid Dynamics (CFD) modeling tool. The passengers’ infection risk is also quantified with the susceptible exposure index (SEI) method. The results show that the virus spreads to the ceiling of the cabin within 50 s of the virus carrier’s normal breathing. Coughing makes the virus spread to the front three rows with a higher mass fraction. While the high mass fraction areas always stay on the same side of the aisle as the virus carrier, the adjacent passengers and the passengers in the back two rows are affected more than the others when the virus carrier breathes normally. Spread patterns under the carrier’s two breath conditions, normal breath and cough, were numerically simulated.
1. Introduction
In late December 2019, a novel coronavirus disease (COVID-19) broke out. The severe acute respiratory syndrome coronavirus 2 (SARS-CoV-2) is a highly infectious pathogen that can spread quickly. This pandemic not only impacts human health and community but also impacts global economics severely [1]. As of 13 July 2021, the total number of confirmed COVID-19 cases has exceeded 188 million, and the total number of deaths has exceeded 4 million, among which many cases have been defined as air travel infections.
There are more than two billion people traveling by air every year [2]. The microenvironment in the commercial aircraft cabin is enclosed, which provides a good place for the virus to spread among passengers [3,4]. Long-distance air travel makes the virus spread broadly and rapidly. When a virus carrier boards onto a commercial airliner, the surfaces inside the cabin might be contaminated by his/her breath, saliva, and mucus. The in-cabin air can also be contaminated by his/her exhalation. Other passengers may be infected if they touch the contaminated surfaces or breathe in the virus from the contaminated air. For example, the severe acute respiratory syndrome (SARS) pandemic caused by the SARS coronavirus (SARS-CoV) broke out in China in 2003. During that pandemic, 20 passengers on the Air China F112 flight traveling from Hong Kong to Beijing were infected by a virus carrier [5]. In most cases of virus spread, the fomite route plays the dominant role. The China National Health Commission (CNHC) has issued a policy in 2020, which defines the passengers sitting three rows in front of or behind a SARS-CoV-2 carrier as “close contacts”. According to this policy, all “close contacts” shall be quarantined for at least 14 days after traveling [6].
Lei et al. indicate that passengers in aisle seats had a higher norovirus infection risk than others when traveling with a virus carrier in the same aircraft cabin, and the predicted infection risk from the fomite route for aisle seat passengers is 2.2 times higher than that for non-aisle seat passengers [7]. Viruses can be transmitted through either aerosols (≤5 μm) or droplets (>5–10 μm) exhaled by the carriers [8,9]. Larger respiratory virus droplets deposit to surfaces quicker due to gravity sedimentation, which may lead to contact transmission. Aerosols (≤5 μm) evaporate faster than settling, so they are buoyant. These aerosols will be transported with the airflow in the aircraft cabin [9]. The particle size of a SARS-CoV-2 molecule is about 65–125 nm [10], which is in the ultrafine particle range (<100 nm). This is slightly smaller than SARS-CoV (80–220 nm). Studies have confirmed that SARS-CoV-2 can spread by aerosol [8,9,11,12]. The exposure risk of passengers traveling with the SARS-CoV-2 carrier inside an aircraft cabin increases with the cabin ventilation rate’s increase [13].
There are two commonly used methods to simulate the aerosol systems with virus particles, or virus-carrying particles. One is to treat the system as one continuous substance and use Euler’s method to solve a convective diffusion equation to obtain the virus concentration and distribution [14,15,16]. The other is to treat solid particles or droplets as a discrete phase material and use the Lagrangian’s method to calculate the motion characteristics of each particle [14,15,16]. Some in-cabin studies use the discretization method to obtain the trajectory of virus particles [4,17,18]. In addition, Sandro et al. replaced respiratory pathogens with smoke particles and concluded that 60% of the particles sink to the surfaces of the cabin due to gravity during the propagation process [19]. Research studies have been conducted to calculate the virus concentrations inside commercial aircraft cabins with a virus carrier using the computational fluid dynamics (CFD) technique. Mazumdar et al. found that the seats and passengers tended to obstruct the lateral transport of the contaminants and confined their spread to the aisle of the cabin [20]. Gupta et al. found that the bulk airflow pattern in the cabin played the most important role in droplet transport [21]. Davis et al. used the CFD tool to calculate the propagation paths of particles released by the coughing passengers in different seats in a Boeing B737 aircraft [17].
To simplify the aerosol transmission process in the commercial aircraft cabin, N2O is used as a tracer gas to establish a continuous system, and Euler’s method is applied in the CFD tool to simulate the SARS-CoV-2 concentration and distribution in this study. The virus distribution changes in the cabin under the carrier’s normal breathing and coughing are compared based on the simulation data. When a virus carrier presents in a commercial aircraft cabin, these results can provide guidance for risk-reducing policies, which is of great significance to the operation of commercial aircraft during a pandemic.
2. Methods
2.1. Cabin Physical Model and Meshing
As the CNHC requires, when a SARS-CoV-2 carrier is found in a commercial aircraft cabin, the passengers sitting three rows in front of and behind the virus carrier are defined as “close contacts” [6]. Based on this policy, this study builds a physical model with seven-row seats inside an Airbus A320 aircraft cabin to study the SARS-CoV-2 mass fraction around the virus carrier. The dimensions are from the A320 maintenance manual (Table 1) [22].
The seats are numbered from 1A to 7F in this seven-row aircraft cabin model. We assume the virus carrier is sitting in the 4th row middle seat (Seat 4E; Figure 1a). To facilitate the analysis of the virus mass fraction distribution in the passengers’ breathing zone, a plane at 1.11 m height (y = 1.11 m; Plane 1 on Figure 1b) from the cabin floor is set up. Since the virus carrier is sitting at a distance of 1.04 m from the midline of the cabin aisle, a vertical plane is set up parallel to the midline of the cabin (x = 1.04 m; Plane 2 on Figure 1b). The cabin physical model was meshed with the ANSYS Meshing (Pittsburgh, PA, USA) to achieve an accurate and efficient solution [23]. The maximum grid size is set to 0.05 m, in order to achieve the best resolution with the capacity of a regular personal computer. The total number of grids was finally calculated to be 2,822,402.
2.2. Boundary Condition Setting
The cabin air supply and outlet are simplified to rectangles. The temperature (T) of the air inlet is set to 18 °C, the air velocity (v) near the ceiling and on both side walls are set to 1 m·s−1, and the temperature of the wall and the cabin air is set to 22 °C to meet the requirements of ASHRAE 161-2018 [24].The airflow velocity generated by human coughing is 6–22 m·s−1 [25]. The initial airflow speed from the virus carrier’s mouth after coughing is set to 10 m·s−1 and the initial air temperature is set to 37.5 °C. The initial airflow speed is set to 1 m·s−1 for the virus carrier’s normal breathing. The body temperature of other passengers is set to 36.5 °C. Table 2 summarizes the boundary conditions of the seven-row Airbus A320 Aircraft cabin model constructed in this study, including the boundary location, name, type and parameter.
2.3. SARS-CoV-2 Mass Fraction Numerical Simulation
The commercial CFD software ANSYS Fluent 19.1 (Pittsburgh, PA, USA) is used for numerical simulation of the dynamic propagation process of viruses inside the aircraft cabin [18]. The initial scenarios are the time points when the SARS-CoV-2 is introduced to the cabin air by the virus carrier’s normal breathing (initial airflow velocity = 1 m·s−1) or coughing (initial airflow velocity = 10 m·s−1).
Most of the droplets from coughing change to droplet nuclei (≤5 μm) in less than 1 s, and the diameter becomes about 1/3 of the original [26]. Because of the tiny size of the nuclei, tracer gases have been widely used to simulate the aerosol dynamics in recent studies. For example, Liu et al. simulated the aerosol transmission using nitrous oxide (N2O) as a trace gas, and Tsoukias et al. established a human exhalation profile using N2O to represent the tiny droplet nuclei [27,28]. The volume fraction of (N2O) in the exhaled air is about 4 %, which is about the same volume fraction of CO2 [27,29,30]. Therefore, in this study, N2O is used as the tracer gas to simulate the virus’s distribution after being exhaled by the virus carrier in the A320 aircraft cabin model.
The initial mass fraction of N2O needs to be set in the Fluent software. First, suppose the volume of the mixed gas exhaled by the virus carrier is , then the volume of N2O is and the mass of N2O is:
The total mixed gas mass is:
The N2O mass fraction is:
where , and represent, respectively, the mass, density and volume of N2O, where . represents the density of aircraft cabin air, and . represents the mass of . The initial mass fraction of N2O calculated from Equations (1)–(3) is 0.038.
More particularly, the numerical solution of Reynolds Averaged Navier-Stokes equations with Re-Normalization Group (RNG) turbulence closure is employed to simulate the continuum phase [31]. According to Zhang et al., the RNG model fits the propagation and diffusion of pollutants in the cabin, so this study chooses the RNG turbulence model [32,33,34,35,36].
2.4. Susceptible Exposure Index (SEI) Calculation
To quantify the exposure risks of other passengers in the aircraft cabin, this study utilizes the Susceptible Exposure Index (SEI) to quantify the passengers’ exposure to the virus [27,37]. The SEI is defined with Formula (4) [27]:
where , , and are the virus mass fraction at the air outlet, in the inhaled air of the receiving individual, and at air supply, respectively.
The virus mass fraction of the supply air is assumed to be zero in this study, then the SEI calculation formula can be simplified to .
A high SEI means a high exposure of the receiving individual to the airborne substances exhaled by the virus carrier, and if the SEI is greater than 1, it means that the passenger is at risk of exposure [27].
3. Results and Discussion
3.1. Virus Mass Fraction Dynamics
Virus spread patterns on plane 1 and plane 2 are numerically simulated. Figure 2 and Figure 3 show the virus mass fraction patterns on the two planes at 5 s, 50 s, 100 s, 150 s and 200 s after the virus is exhaled under normal breathing and coughing, respectively.
As shown in Figure 2a,b, when the virus carrier breathes normally, the high mass fraction (>9 × 10⁻⁴) virus area stays near the virus carrier at T = 5 s (Figure 2a,b). At T = 50 s, the boundary of contaminated air extends to the cabin ceiling, the adjacent seat (seats 4D and 4F) breathing zone, and the aisle area. However, the high mass fraction areas shrink on both planes (Figure 2c,d). At T = 100 s, the low mass fraction contaminant disperses to the cabin floor, the same side back row breathing zone (seats 5D, 5E and 5F), and front row breathing zone (seats 3E and 3F), except for the aisle seat (seat 3D). At T = 150 s and T = 200 s, the spread patterns are similar, and the very low mass fraction (<1 × 10⁻⁴) contaminant spreads to the other side of the aisle (seats 4A–4C and seats 5A–5C) (Figure 2e–j).
This result shows the vertical spread is much faster than the horizontal spread due to the fixed lateral rows of the passenger seats, which partially block the horizontal airflow. The aisle makes the virus travel farther, and the virus spread after normal breathing affects the back rows more than the front rows due to the ventilation of the airliner cabin. However, the higher initial airflow velocity after coughing overcomes the cabin airflow generated by the ventilation, which makes the virus spread farther to the front rows. This is consistent with the results of Mazumdar et al. [20].
As shown in Figure 3a,b, when the virus carrier coughs, the high mass fraction (>9 × 10⁻⁴) of the virus instantly spreads to the same side front row (seat 3D) breathing zone at T = 5 s, but the adjacent passengers’ breathing zones in seats 4D and 4F stay unaffected at that moment (Figure 3a,b). The high virus mass fraction area continues to spread forward at T = 50 s, and reaches the cabin ceiling and the 2nd front row (seats 2D-2F) breathing zone on the same side. At the same time, the low mass fraction area (<1 × 10⁻⁴) extends to the cabin floor, the 3rd front row (seats 1D–1F) and the back row (seats 5D-5F) on the same side. The low mass fraction of the virus also spreads to the other side of the aisle in rows 4 and 5 (Figure 3c,d). At T = 100 s, the high mass fraction area covers rows 2–4 on the same side, while the low mass fraction area reaches rows 1–6 on both sides (Figure 3e,f). At T = 150 s and T = 200 s, the high mass fraction area stays at rows 2–4 on the same side, and the low mass fraction area stays in rows 1–6 on both sides (Figure 3e–j). Row 7 (seats 7A–7F) stays uncontaminated all the time (Figure 3).
Comparing Figure 2 and Figure 3, we can find that when the virus carrier breathes normally, the virus spreads to the back seats more than the front seats. However, when the virus carrier coughs, the virus spreads to the front seats more than the back seats. This is due to the higher initial airflow velocity from coughing (Table 2). For the same reason, the spread of the virus is much faster after coughing than normal breathing. However, the passengers in the 7th row stay away from the virus contamination under both situations. This is not necessarily implying that the 7th row passengers, who are three rows back from the virus carrier, could be exempted from the “close contacts” group and the mandatory quarantine. This is because this study only simulates an ideal situation that the virus carrier only breathes or coughs once (single breath or cough), and all passengers and cabin crew members stay still in the cabin. According to other studies, when people are moving in the aisle, the wake can carry the virus to the far most in the cabin [20,38]. Although the 7th row in this model stays safe and clean under both breathing situations, in a realistic environment it cannot stay uncontaminated all the time.
In general, no matter whether the virus carrier breathes or coughs in the aircraft cabin, the virus spreads to the front seats easier than the back seats. This implies that arranging the virus carriers in front of other passengers might be of help for reducing the infection risks.
The complete simulation results can be found in the Supplemental Information Section.
3.2. SEI
The virus mass fraction after a single breath or cough was calculated for each time point at the virus carrier breathing zone, and the results are shown in Figure 4.
As shown in Figure 4, the initial virus mass fraction at the virus carrier’s mouth is 0.038 at T = 0 s. When the virus carrier breathes normally, the virus mass fraction decreases sharply to 0.018 within 5 s, and then goes up to 0.021 at 5–15 s, then drop again at 15–25 s. After T = 25 s, the virus mass fraction tends to get stabilized with little fluctuation. When the passenger coughs, the virus mass fraction decreases from the initial 0.038 at T = 0 s sharply to 0.019 within 10 s but stabilized much faster than normal breathing. After that, the fluctuations are also milder than normal breathing (Figure 4). The simulation data of a Boeing 737 cabin show that the virus concentration around the cougher experienced an exponential decay, and 95% of the particles were removed in 2.3 to 4.5 min [17]. The simulation results in this study show a similar decay; however, the decay is much faster in the A320 model, and the fraction curve becomes flat after 20 s.
During 5–15 s, the virus mass fraction at the virus carrier’s mouth shows the opposite trends between normal breathing and coughing, because the curve under normal breathing bounces up, while the curve after coughing goes flat. The virus mass fraction stays higher under normal breathing during 10–190 s than under coughing. This is because the initial airflow velocity of coughing is higher (10 m·s−1) than the air velocity during normal breath (1 m·s−1), although the initial value is the same. This is because in the higher volume of air blown out from the virus carrier’s mouth during coughing, while counting the total number of the virus molecules, more viruses are released from the virus carrier’s mouth with the airflow.
Because of the high initial airflow velocity blowing away the virus aerosols and droplets, the virus carrier who coughs reduces the virus mass fraction at his/her mouth. At the same time, because the high volume of contaminated air is spread out into the cabin, this cough may increase the other passengers’ chances of exposure.
To quantify the exposure risk of other passengers sitting around the virus carrier, the SEI is calculated for each passenger in this physical cabin model at T = 140 s, 160 s, 180 s and 200 s, and the results are shown in Figure 5.
Based on the SEI definition, we assume when the passenger calculated SEI is higher than 1, he/she has a risk for virus infection. It can be seen from Figure 5 that, when the virus carrier breathes normally, the SEI of the passengers in rows 3–6 are all greater than 1 except for seat 6F. This indicates that the passengers in rows 3–6 have exposure risks (Figure 5a). When the virus carrier coughs, the SEI of passengers in rows 1–4 and passengers 5D–5F is greater than 1 (Figure 5b). Through comparison, it can be found that the passengers in rows 3 and 4 (front row and same row of the virus carrier) and passengers in seats 5D and 5F in the rear seats always have exposure risks under the two conditions (Figure 5a,b).
When the virus carrier breathes normally, the tiny droplets exhaled from his/her mouth spread to the passengers in the back two rows with the airflow in the cabin. However, when the virus carrier coughs, the passengers sitting in the three rows in front of the virus carrier have higher exposure risks. This is due to the higher initial airflow velocity, as discussed. This is consistent with previous studies; for example, Liu et al. found that when a virus carrier coughs, the SEI remained greater than 1, even if the exposed person is 3 m away from the carrier, in an indoor environment [27]. In this study, the row spacing is set to 85 cm, and it is found that, when a virus carrier coughs, it can cause the SEI of the passengers in the three rows of seats in front to be greater than 1, the total virus travel distance is about 2.55 m inside this cabin model, which is a little shorter than the 3 m in a regular indoor environment. This is because the fixed lateral seat setup blocks the airflow to some extent.
Each passenger’s SEI ratio after the virus carrier’s coughing over normal breathing is calculated, and the results are shown in Figure 6 of each passenger in the cabin under the two breath conditions of the virus carrier to provide guidance for passengers to choose their seats.
As shown in Figure 6, the SEI of passenger 1F can reach up to 55 at T = 140 s (Figure 6a). The calculated ratio is always higher than 1 for rows in front of the virus carrier, while the ratio for the same row and the back row passengers is always lower than 1. The ratio for the seats on the same side of the virus carrier is always higher than the ratio for the seats on the other side of the aisle in the same row (Figure 6). This shows that when the virus carrier coughs, the passengers behind him are relatively safer than the situation when he/she breathes normally, but the passengers in front are at a much greater risk of exposure compared with his/her normal breathing. These results indicate that, while a coughing passenger is observed in an airliner cabin, sitting on the opposite side of the aisle or in the rear of the passenger might be effective to lower the risk of infection.
As mentioned, due to the limitations and the restrictions of this research, we only studied one single breath or cough of one virus carrier in this seven-row A320 airliner cabin model. Realistic situations can be much more complicated, such as continuous breathing or coughing, and the wake introduced by moving people in the cabin is not considered. However, we build, for the first time, this seven-row airliner model with the CFD tool that complies with the policy issued by the CNHC, and numerically simulate the SARS-CoV-2 spread effectively with this model. Further studies can be projected for more realistic situations with this or a similar CFD method.
4. Conclusions
Based on our numerical simulation results calculated within the seven-row A320 airliner cabin model, the vertical spread of the virus is always faster than the horizontal spread due to the lateral seat organization in the cabin, and the high virus mass fraction area (>9 × 10⁻⁴) always stays in the same side of the aisle with the virus carrier. When the virus carrier breathes normally, the virus can spread to the seats in the front row, the same row and to the back two rows. When the virus carrier coughs, more viruses are carried into the air with higher initial airflow velocity, and the passengers sitting in the three rows in front, in the same row with the virus carrier, and in the two rows behind might have an SEI greater than 1, which indicates the risk for infection. In general, when a virus carrier coughs, more surrounding passengers are at risk than the situation when the virus carrier breathes normally. Avoiding sitting in front of the coughing virus carrier might lower the risk for infection.
Supplementary Materials
The following is available at https://doi.org/10.6084/m9.figshare.16570599.v6, Simulation video of the spread of the SARS-CoV-2 in an A320 cabin model.
Author Contributions
Conceptualization, M.Z. and N.Y.; methodology, N.Y.; software, M.Z.; validation, N.Y., M.Z., Y.Z., X.Z. and Y.C.; formal analysis, M.Z.; investigation, Y.Z., X.Z. and Y.C.; resources, M.Z.; data curation, M.Z. and X.Z; writing—original draft preparation, M.Z.; writing—review and editing, N.Y. and Y.Z.; visualization, M.Z. and N.Y.; supervision, N.Y.; project administration, N.Y.; funding acquisition, N.Y. and M.Z. All authors have read and agreed to the published version of the manuscript.
Funding
This research was funded by the Nanjing University of Aeronautics and Astronautics New Faculty Start-up fund, grant number 90YAH19018; This research was also funded by the Postgraduate Research & Practice Innovation Program of Jiangsu Province, grant number SJCX20_0067.
Institutional Review Board Statement
Not applicable.
Informed Consent Statement
Not applicable.
Data Availability Statement
Not applicable.
Acknowledgments
The authors sincerely thank Yao Zhang for helping with the field measurement and preliminary data processing. Special thanks should also be given to Nu Yu for providing the help of model processing and writing original paper.
Conflicts of Interest
The authors declare no conflict of interest.
References
- World Health Organization. Report of the WHO—China Joint Mission on Coronavirus Disease 2019 (COVID-19); WHO: Geneva, Switzerland, 2020. [Google Scholar]
- Mboreha, C.A.; Abdallah, C.S.; Kumar, G. Risk and prevention of COVID-19 in a commercial aircraft cabin: An overview. Int. J. Eng. Appl. Sci. Technol. 2020, 5, 661–670. [Google Scholar] [CrossRef]
- Mangili, A.; Gendreau, M.A.J.L. Transmission of infectious diseases during commercial air travel. Lancet 2005, 365, 989–996. [Google Scholar] [CrossRef]
- Yan, Y.; Li, X.; Fang, X.; Yan, P.; Tu, J. Transmission of COVID-19 virus by cough-induced particles in an airliner cabin section. Eng. Appl. Comput. Fluid Mech. 2021, 15, 934–950. [Google Scholar] [CrossRef]
- Olsen, S.J.; Chang, H.-L.; Cheung, T.Y.-Y.; Tang, A.F.-Y.; Fisk, T.L.; Ooi, S.P.-L.; Kuo, H.-W.; Jiang, D.D.-S.; Chen, K.-T.; Lando, J.; et al. Transmission of the severe acute respiratory syndrome on aircraft. N. Engl. J. Med. 2003, 349, 2416–2422. [Google Scholar] [CrossRef]
- National Health Commission. Novel Coronavirus Pneumonia Prevention and Control Plan, 5th ed.; National Health Commission: Beijing, China, 2020. (In Chinese) [Google Scholar]
- Lei, H.; Li, Y.; Xiao, S.; Yang, X.; Lin, C.H.; Norris, S.L.; Wei, D.; Hu, Z.; Ji, S.J.R. Logistic growth of a surface contamination network and its role in disease spread. Sci. Rep. 2017, 7, 14826. [Google Scholar] [CrossRef] [PubMed]
- Ahlawat, A.; Wiedensohler, A.; Mishra, S.K. An Overview on the Role of Relative Humidity in Airborne Transmission of SARS-CoV-2 in Indoor Environments. Aerosol Air Qual. Res. 2020, 20, 1856–1861. [Google Scholar] [CrossRef]
- Prather, K.A.; Wang, C.C.; Schooley, R.T.J.S. Reducing transmission of SARS-CoV-2. Science 2020, 368, eabc6197. [Google Scholar] [CrossRef] [PubMed]
- Astuti, I.; Diabetes, Y.J. Severe Acute Respiratory Syndrome Coronavirus 2 (SARS-CoV-2): An overview of viral structure and host response. Diabetes Metab. Syndr. Clin. Res. Rev. 2020, 14, 407–412. [Google Scholar] [CrossRef]
- Morawska, L.; Milton, D.K. It Is Time to Address Airborne Transmission of Coronavirus Disease 2019 (COVID-19). Clin. Infect. Dis. 2020, 71, 2311–2313. [Google Scholar] [CrossRef] [PubMed]
- Asadi, S.; Bouvier, N.; Wexler, A.S.; Ristenpart, W.D. The coronavirus pandemic and aerosols: Does COVID-19 transmit via expiratory particles? Aerosol Sci. Technol. 2020, 54, 635–638. [Google Scholar] [CrossRef] [Green Version]
- To, G.S.; Wan, M.P.; Chao, C.; Fang, L.; Melikov, A. Experimental Study of Dispersion and Deposition of Expiratory Aerosols in Aircraft Cabins and Impact on Infectious Disease Transmission. Aerosol Sci. Technol. 2009, 43, 466–485. [Google Scholar] [CrossRef]
- Wang, G.Q.; Ji, S.C. Summary of the analysis of the spread of germs in the cabin. Acta Aeronautica et Astronautica Sinica. 2015, 36, 2577–2587. (In Chinese) [Google Scholar] [CrossRef]
- Mazumdar, S.; Chen, Q.J. Influence of cabin conditions on placement and response of contaminant detection sensors in a commercial aircraft. J. Environ. Monit. 2008, 10, 71–81. [Google Scholar] [CrossRef] [Green Version]
- Zhang, Z.; Chen, Q. Comparison of the Eulerian and Lagrangian methods for predicting particle transport in enclosed spaces. Atmos. Environ. 2007, 41, 5236–5248. [Google Scholar] [CrossRef]
- Davis, A.C.; Zee, M.; Clark, A.D.; Wu, T.; Olson, N.A. Computational Fluid Dynamics Modeling of Cough Transport in an Aircraft Cabin. bioRxiv 2021, 2, 15. [Google Scholar] [CrossRef]
- Talaat, K.; Abuhegazy, M.; Mahfoze, O.A.; Anderoglu, O.; Poroseva, S.V. Simulation of aerosol transmission on a Boeing 737 airplane with intervention measures for COVID-19 mitigation. Phys. Fluids 2021, 33, 033312. [Google Scholar] [CrossRef] [PubMed]
- Conceição, S.T.; Pereira, M.L.; Tribess, A. A Review of Methods Applied to Study Airborne Biocontaminants inside Aircraft Cabins. Int. J. Aerosp. Eng. 2011, 2011, 824591. [Google Scholar] [CrossRef] [Green Version]
- Mazumdar, S.; Poussou, S.B.; Lin, C.-H.; Isukapalli, S.S.; Plesniak, M.W.; Chen, Q. Impact of scaling and body movement on contaminant transport in airliner cabins. Atmos. Environ. 2011, 45, 6019–6028. [Google Scholar] [CrossRef]
- Gupta, J.K.; Lin, C.H.; Chen, Q. Transport of expiratory droplets in an aircraft cabin. Indoor Air 2011, 21, 3–11. [Google Scholar] [CrossRef]
- AIRBUS. Aircraft Characteristics Airport and Maintenance Plannin; AIRBUS: Blagnac, France, 2005. [Google Scholar]
- Available online: https://www.ansys.com/products/meshing (accessed on 2 July 2021).
- ASHRAE. Standard 161-2018. Air Quality within Commercial Aircraft (ANSI Approved); ASHRAE: Atlanta, GA, USA, 2021. [Google Scholar]
- Gupta, J.K.; Lin, C.H.; Chen, Q. Flow dynamics and characterization of a cough. Indoor Air 2010, 19, 517–525. [Google Scholar] [CrossRef]
- Nicas, M.; Nazaroff, W.W.; Hubbard, A. Toward understanding the risk of secondary airborne infection: Emission of respirable pathogens. J. Occup. Environ. Hyg. 2005, 2, 143–154. [Google Scholar] [CrossRef] [PubMed]
- Liu, L.; Li, Y.; Nielsen, P.V.; Wei, J.; Jensen, R.L. Short-range airborne transmission of expiratory droplets between two people. Indoor Air 2016, 27, 452–462. [Google Scholar] [CrossRef]
- Tsoukias, N.M.; Tannous, Z.; Wilson, A.F.; George, S.C. Single-exhalation profiles of NO and CO2 in humans: Effect of dynamically changing flow rate. Jpn. J. Physiol. 1998, 85, 642–652. [Google Scholar] [CrossRef] [Green Version]
- Chang, T.B.; Sheu, J.J.; Huang, J.W.; Lin, Y.S.; Chang, C.C. Development of a CFD model for simulating vehicle cabin indoor air quality. Transp. Res. Part D Transp. Environ. 2018, 62, 433–440. [Google Scholar] [CrossRef]
- Scott, J.L.; Kraemer, D.G.; Keller, R.J. Occupational hazards of carbon dioxide exposure. ACS Chem. Health Saf. 2009, 16, 18–22. [Google Scholar] [CrossRef]
- Yakhot, V.; Orszag, S.A.; Thangam, S.; Gatski, T.B.; Speziale, C.G. Development of turbulence models for shear flows by a double expansion technique. Phys. Fluids 1992, 4, 1510–1520. [Google Scholar] [CrossRef] [Green Version]
- Acikgoz, M.B.; Akay, B.; Miguel, A.F.; Aydin, M. Airborne Pathogens Transport in an Aircraft Cabin. Defect Diffus. Forum 2011, 312–315, 865–870. [Google Scholar] [CrossRef]
- Zhang, Z. Modeling of Airflow and Contaminant Transport in Enclosed Environments. Ph.D. Thesis, Purdue University, West Lafayette, OH, USA, 2007. [Google Scholar]
- Shengcheng, J.; Jinglei, X.; Shanggui, C.; Zhongmin, H. Numerical Study of Virus Droplet Transport in Civil Aircraft Cabin. Int. J. Astronaut. Aeronaut. Eng. 2018, 3, 1–13. [Google Scholar] [CrossRef] [Green Version]
- Chen, Q. Comparison of different k-ε models for indoor air flow computations. Numer. Heat Transf. Part B Fundam. 1995, 28, 353–369. [Google Scholar] [CrossRef]
- Liu, W.; Wen, J.; Lin, C.H.; Liu, J.; Long, Z.; Chen, Q.J.B. Evaluation of various categories of turbulence models for predicting air distribution in an airliner cabin. Build. Environ. 2013, 65, 118–131. [Google Scholar] [CrossRef]
- Qian, H.; Li, Y. Removal of exhaled particles by ventilation and deposition in a multibed airborne infection isolation room. Indoor Air 2010, 20, 284–297. [Google Scholar] [CrossRef] [PubMed]
- Han, Z.Y.; To, G.N.S.; Fu, S.C.; Chao, C.Y.H.; Weng, W.G.; Huang, Q.Y. Effect of human movement on airborne disease transmission in an airplane cabin: Study using numerical modeling and quantitative risk analysis. BMC Infect. Dis. 2014, 14, 434. [Google Scholar] [CrossRef] [PubMed] [Green Version]
Figure 1.
The physical model of the seven-row A320 cabin: (a) virus carrier seat in red; (b) plane 1 and plane 2.
Figure 1.
The physical model of the seven-row A320 cabin: (a) virus carrier seat in red; (b) plane 1 and plane 2.
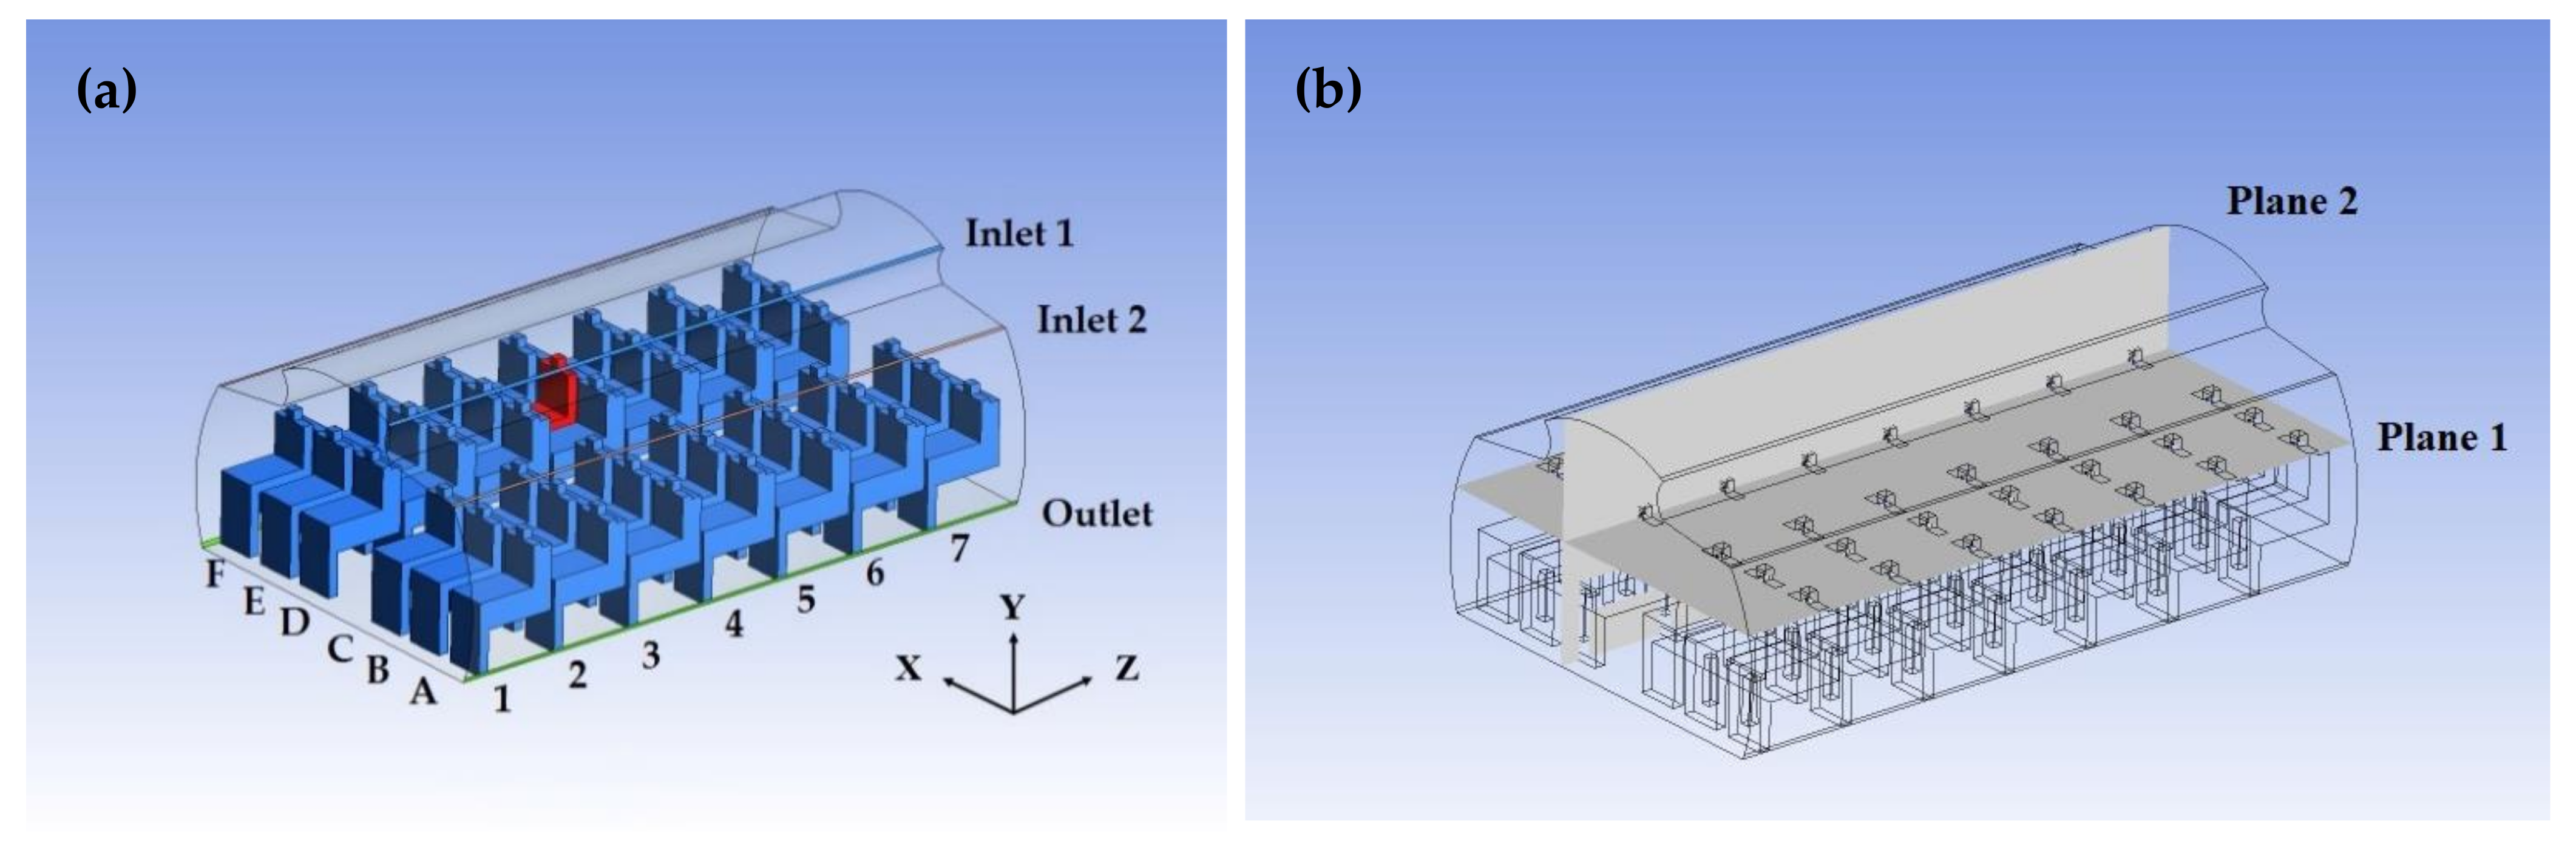
Figure 2.
The dynamic propagation process of pathogens 5 s, 50 s, 100 s, 150 s 200 s after the virus carrier’s single normal breath (left: (a,c,e,g,i)-Plane 1; right: (b,d,f,h,j)-Plane 2).
Figure 2.
The dynamic propagation process of pathogens 5 s, 50 s, 100 s, 150 s 200 s after the virus carrier’s single normal breath (left: (a,c,e,g,i)-Plane 1; right: (b,d,f,h,j)-Plane 2).
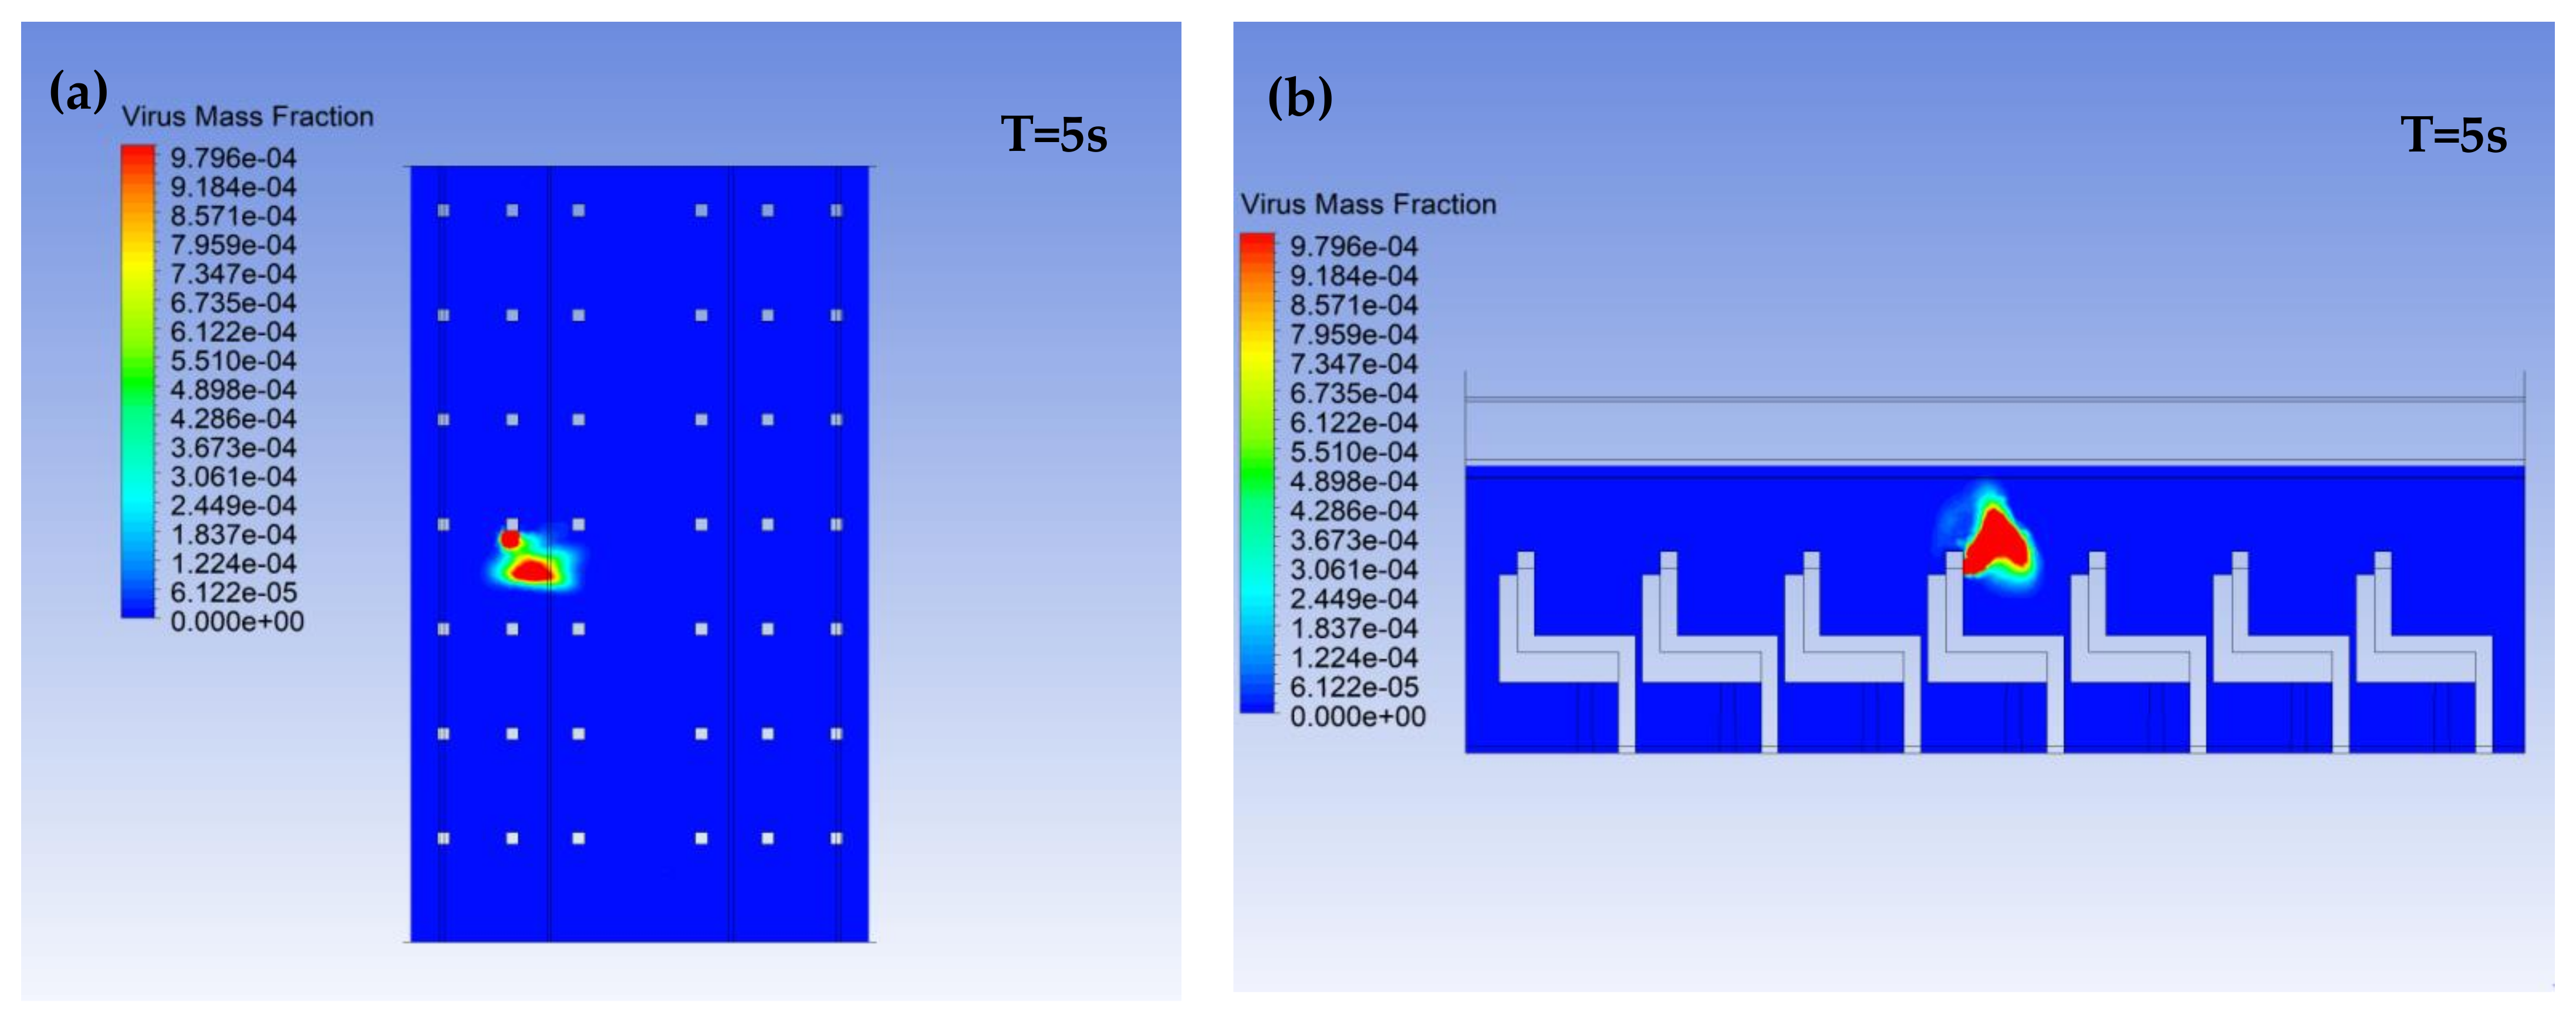
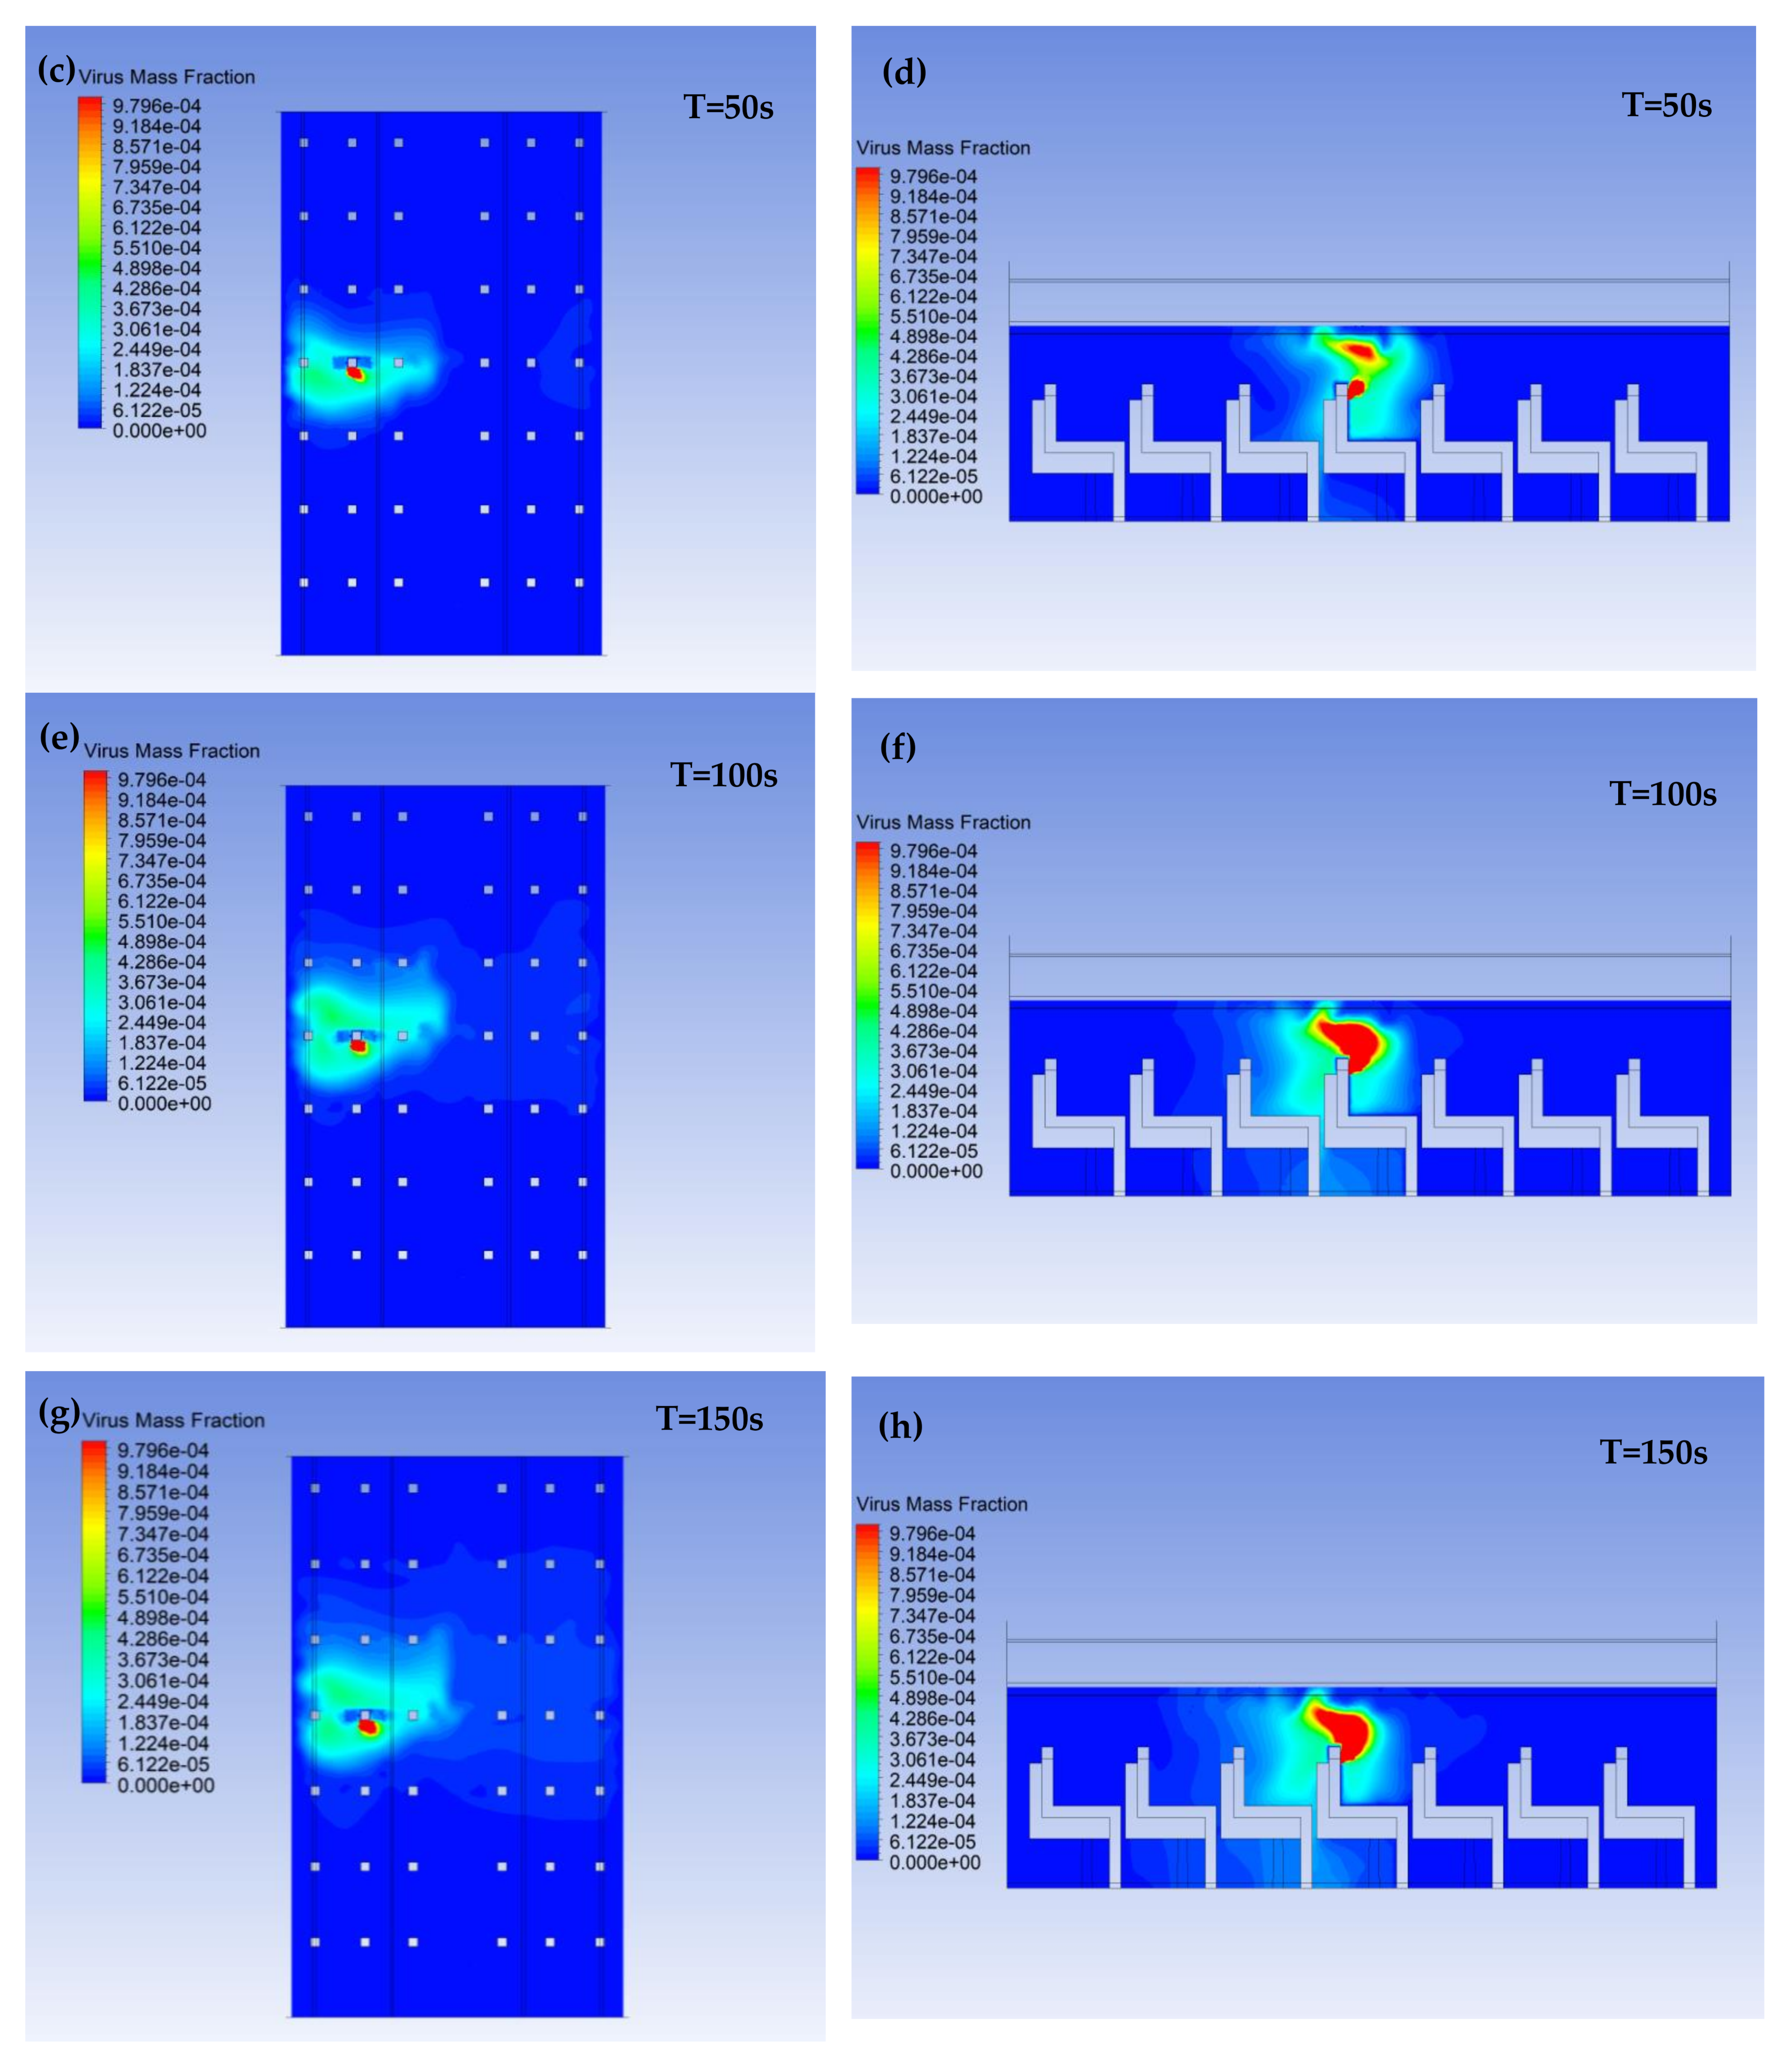
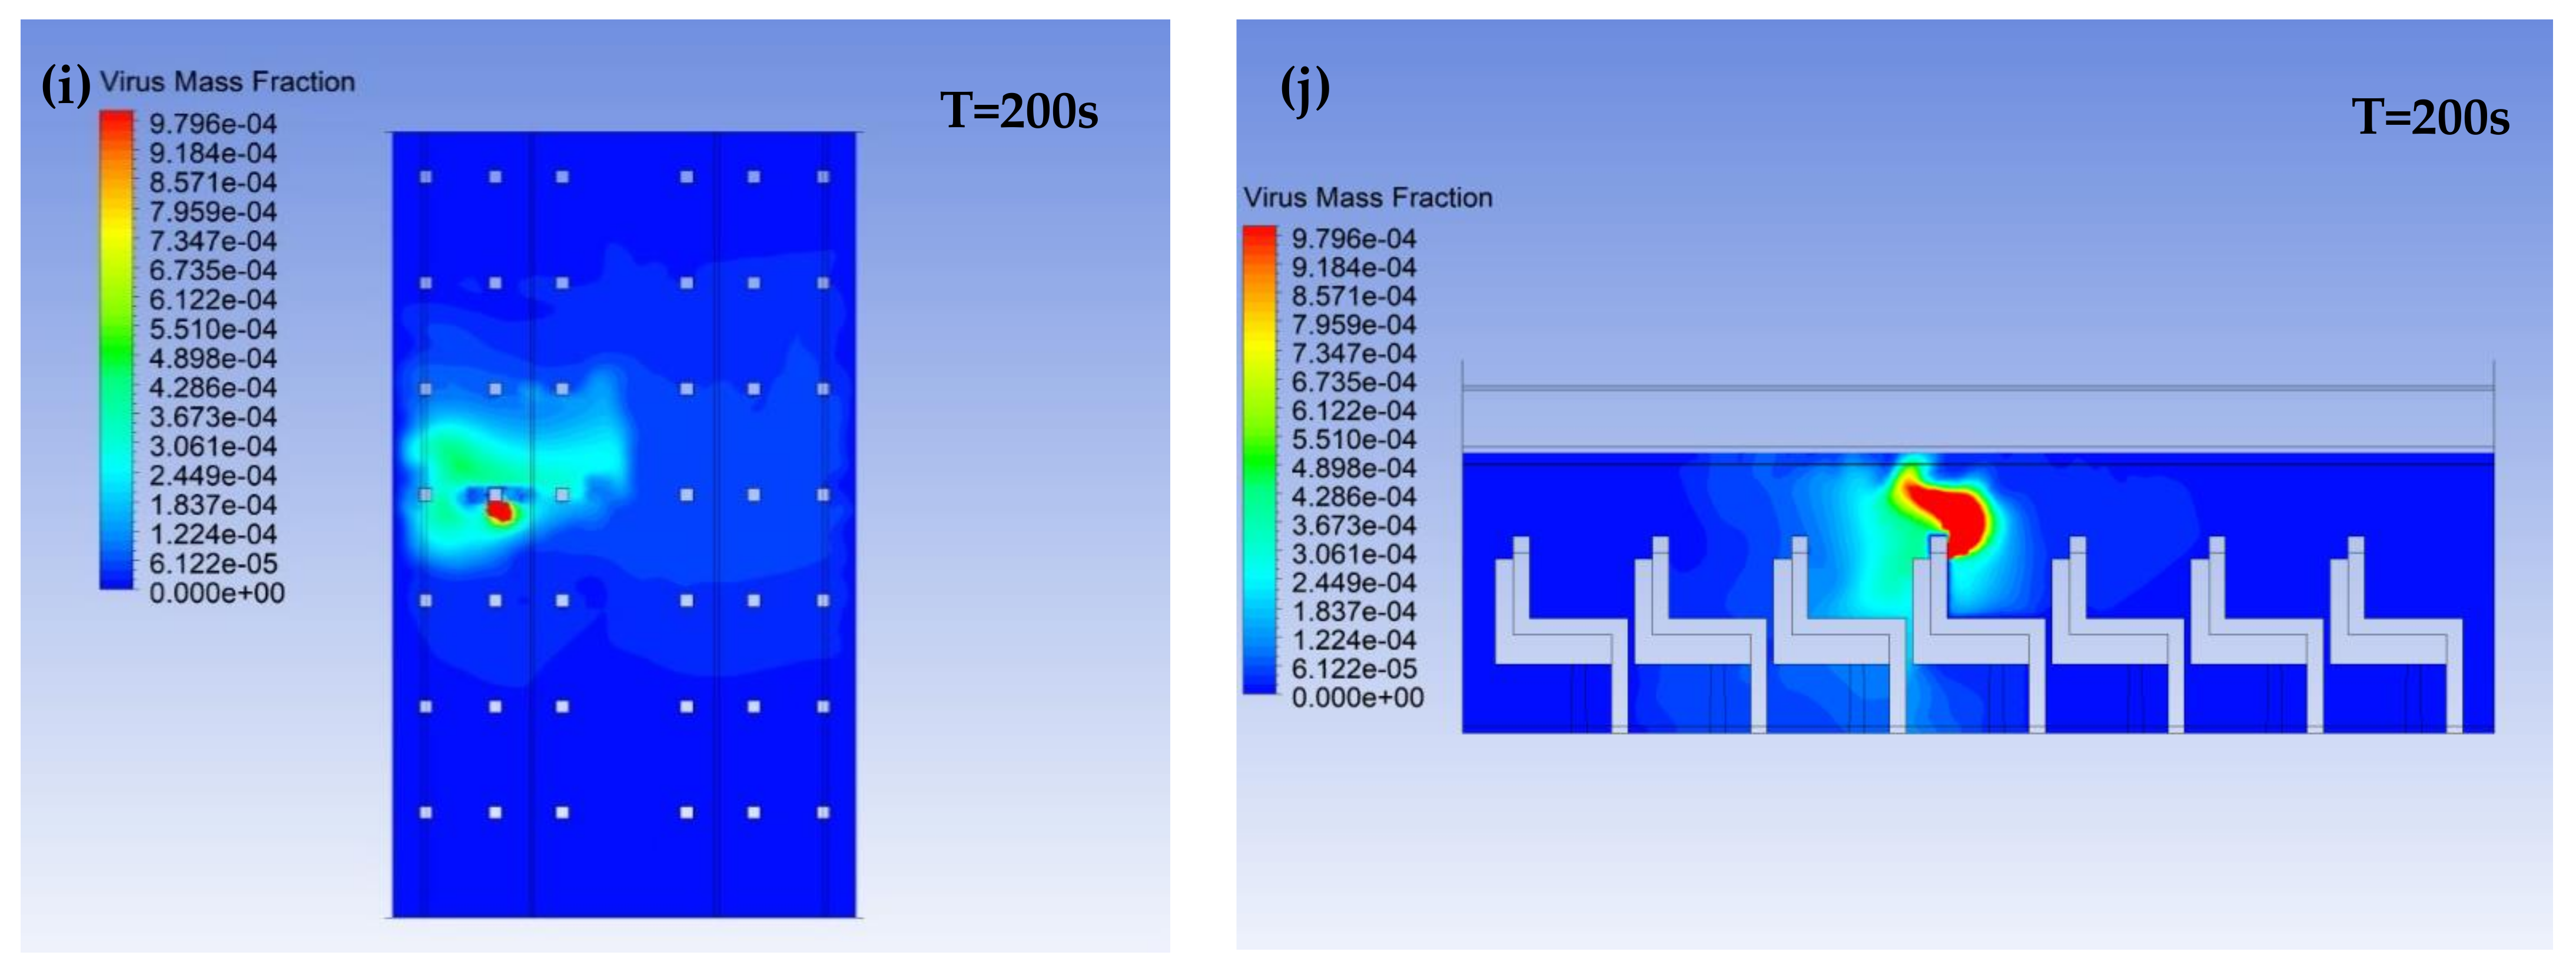
Figure 3.
The dynamic 5 s, 50 s, 100 s, 150 s, 200 s after the virus carrier’s single cough (left: (a,c,e,g,i)-Plane 1; right: (b,d,f,h,j)-Plane 2).
Figure 3.
The dynamic 5 s, 50 s, 100 s, 150 s, 200 s after the virus carrier’s single cough (left: (a,c,e,g,i)-Plane 1; right: (b,d,f,h,j)-Plane 2).
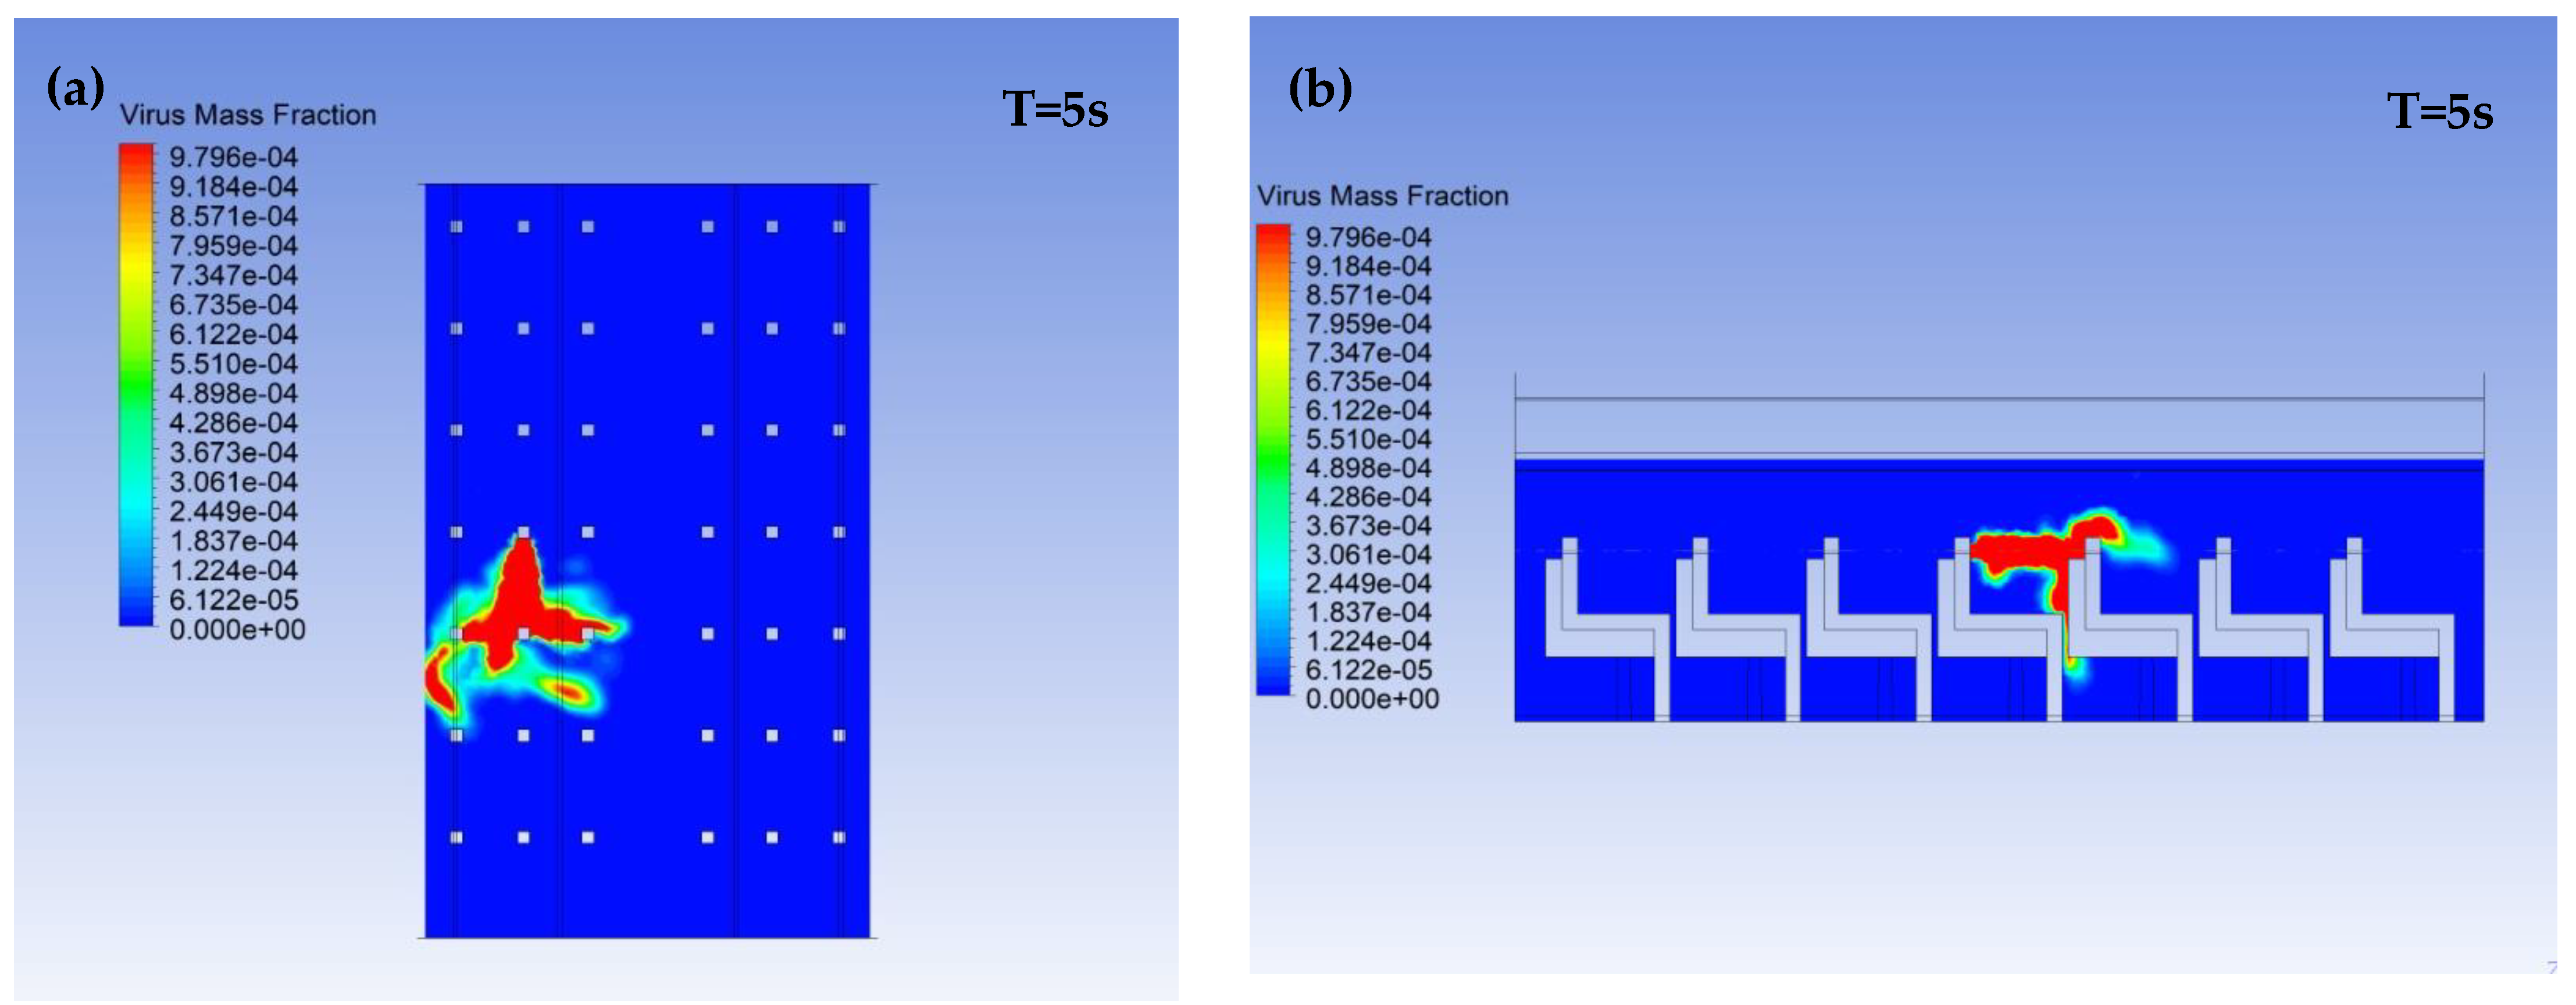


Figure 4.
Virus mass fraction at the virus carrier’s breathing zone after a single breath or cough.
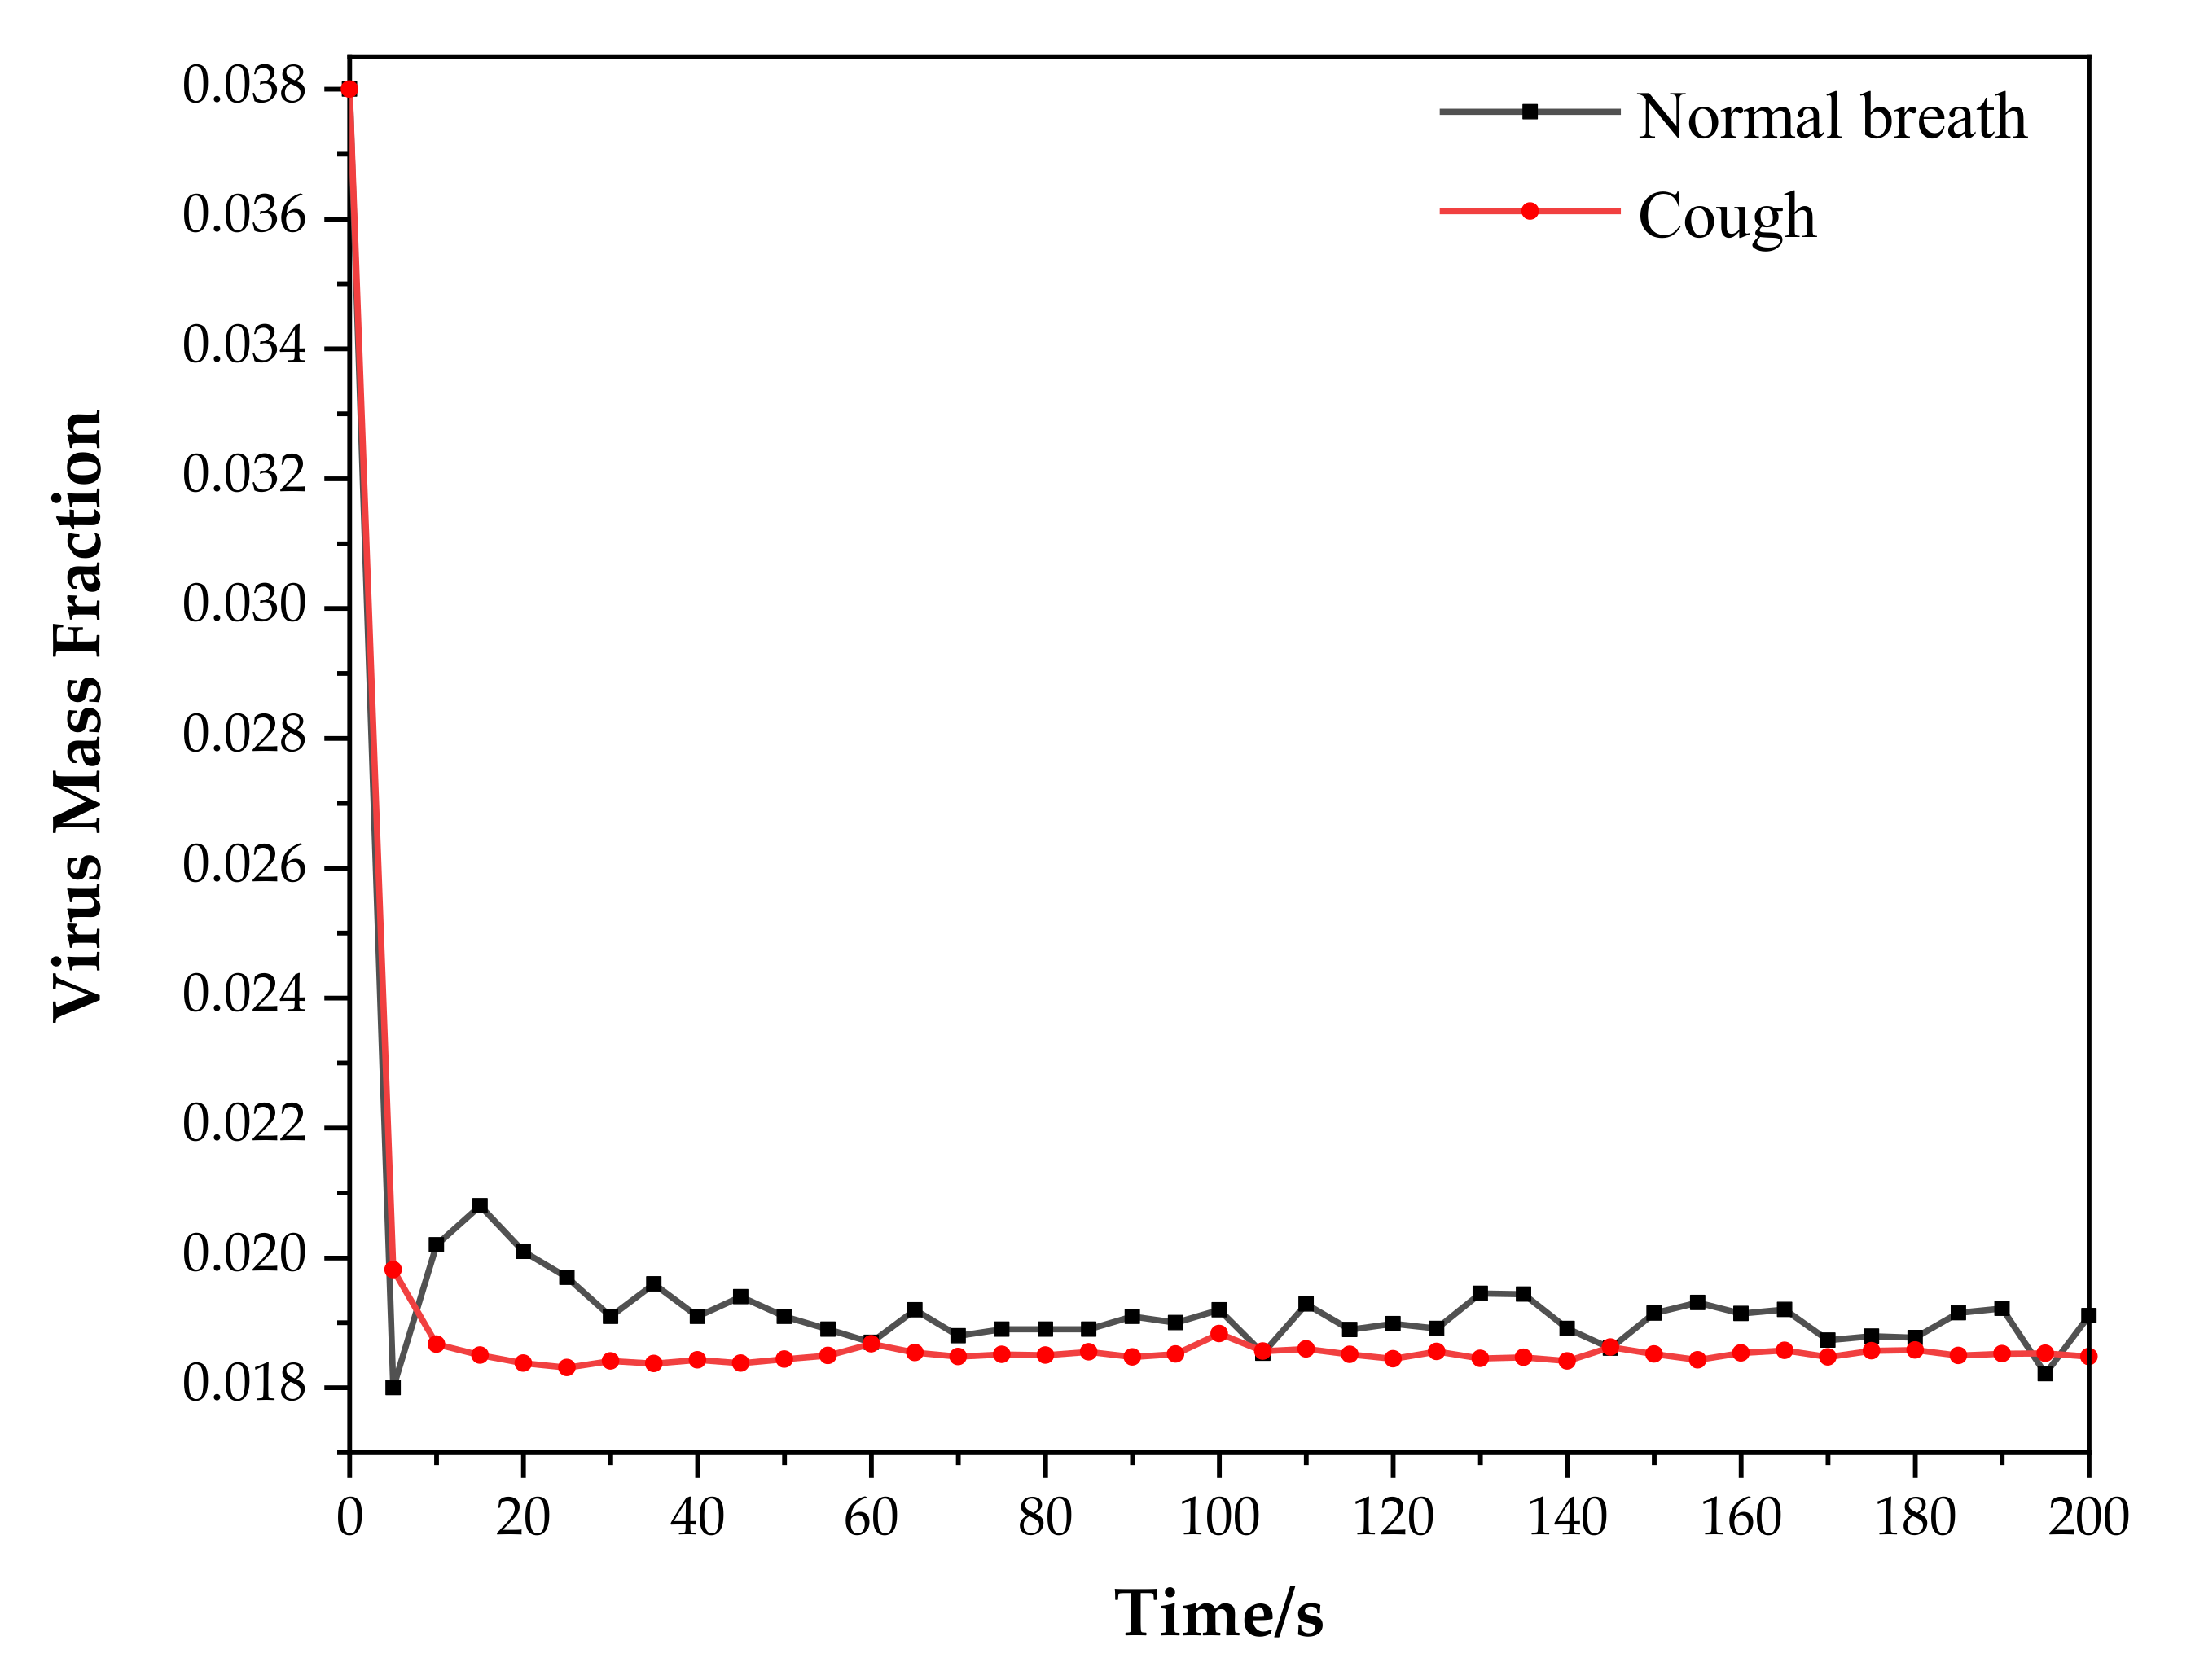
Figure 5.
SEI results under when T = 140 s, 160 s, 180 s and 200 s: (a) normal breath; (b) cough.

Figure 6.
Passenger SEI ratio under virus carrier’s cough over normal breath ((a)SEI ration; (b) the results for passengers in rows 4 to 7 are enlarged in (b)).
Figure 6.
Passenger SEI ratio under virus carrier’s cough over normal breath ((a)SEI ration; (b) the results for passengers in rows 4 to 7 are enlarged in (b)).


Table 1.
Dimensions of the seven-row cabin model.
| Dimension | Size |
|---|---|
| Length | 6.3 m |
| Width | 3.7 m |
| Height | 2.26 m |
| Passenger breathing zone height | 1.11 m |
| Inlet width | 0.04 m |
| Outlet width | 0.04 m |
| Passenger’s mouth area | 0.03 m2 |
| Row distance | 0.85 m |
Table 2.
Boundary condition settings.
| Location | Name | Parameter |
|---|---|---|
| Ceiling air inlet | Inlet 1 | v = 1 m·s−1, T = 18 °C |
| Side wall air inlet | Inlet 2 | v = 1 m·s−1, T = 18 °C |
| Near-ground air outlet | Outlet | P = 84,475.3 Pa |
| Cabin wall | Wall 1 | T = 22 °C |
| Virus carrier | Virus | Normal breath: v = 1 m·s−1, T = 37.5 °C; Cough: v = 10 m·s−1, T = 37.5 °C |
| Non-ill passengers | Wall 2 | T = 36.5 °C |
Publisher’s Note: MDPI stays neutral with regard to jurisdictional claims in published maps and institutional affiliations. |
© 2021 by the authors. Licensee MDPI, Basel, Switzerland. This article is an open access article distributed under the terms and conditions of the Creative Commons Attribution (CC BY) license (https://creativecommons.org/licenses/by/4.0/).
Share and Cite
MDPI and ACS Style
Zhang, M.; Yu, N.; Zhang, Y.; Zhang, X.; Cui, Y. Numerical Simulation of the Novel Coronavirus Spread in Commercial Aircraft Cabin. Processes 2021, 9, 1601. https://doi.org/10.3390/pr9091601
AMA Style
Zhang M, Yu N, Zhang Y, Zhang X, Cui Y. Numerical Simulation of the Novel Coronavirus Spread in Commercial Aircraft Cabin. Processes. 2021; 9(9):1601. https://doi.org/10.3390/pr9091601
Chicago/Turabian StyleZhang, Mengya, Nu Yu, Yao Zhang, Xin Zhang, and Yu Cui. 2021. "Numerical Simulation of the Novel Coronavirus Spread in Commercial Aircraft Cabin" Processes 9, no. 9: 1601. https://doi.org/10.3390/pr9091601
Note that from the first issue of 2016, this journal uses article numbers instead of page numbers. See further details here.