Article

Particulate Matter Exposures under Five Different Transportation Modes during Spring Festival Travel Rush in China

1
Department of Air Traffic, College of Civil Aviation, Nanjing 211106, China
2
Department of Computer Science, School of Electronics and Information Engineering, Lanzhou Jiaotong University, Lanzhou 730070, China
*
Author to whom correspondence should be addressed.
These two authors contributed equally to this work.
Processes 2021, 9(7), 1133; https://doi.org/10.3390/pr9071133
Submission received: 31 May 2021 / Revised: 26 June 2021 / Accepted: 27 June 2021 / Published: 29 June 2021
(This article belongs to the Special Issue Air Quality Monitoring for Smart Cities and Industrial Applications)

Abstract

:
Serious traffic-related pollution and high population density during the spring festival (Chinese new year) travel rush (SFTR) increases the travelers’ exposure risk to pollutants and biohazards. This study investigates personal exposure to particulate matter (PM) mass concentration when commuting in five transportation modes during and after the 2020 SFTR: China railway high-speed train (CRH train), subway, bus, car, and walking. The routes are selected between Nanjing and Xuzhou, two major transportation hubs in the Yangtze Delta. The results indicate that personal exposure levels to PM on the CRH train are the lowest and relatively stable, and so it is recommended to take the CRH train back home during the SFTR to reduce the personal PM exposure. The exposure level to PM2.5 during SFTR is twice as high as the average level of Asia, and it is higher than the WHO air quality guideline (AQG).

1. Introduction

In-vehicle air quality can affect the exposure level of commuters. Those pollutants related to traffic emissions may include ultrafine particles (particles with aerodynamic diameter ≤ 100 nm, UFPs), fine particles (particles with aerodynamic diameter ≤ 2.5 μm, PM2.5), black carbon (BC), carbon monoxide (CO), nitrogen dioxide (NO2), and volatile organic compounds (VOCs) [1]. Previous studies indicate that people spend about 5.5% and 7.6% of their day in vehicles and outdoors, respectively [2]. About 26.7% of commuters have the preference of choosing public transportations in Nanjing in recent years [3]. There is a population of 1.4 billion in China. During the Chinese spring festival travel rush (SFTR), workers and college students buy tickets to return home, which is the largest human migration on earth happening annually. The investigated SFTR started on 10 January 2020, with an estimate of 3 billion passengers over 40 days. Public transportation was fully loaded during the SFTR. In late December 2019, a novel coronavirus disease (COVID-19) broke out in Wuhan, Hubei province, China. Before the suddenly announced strict quarantine starting from 23 January 2020, many unknowns remain. COVID-19 is both deadly and highly transmissible. Recently, the airborne mode of COVID-19 transmission occurring primarily in indoor places has been recognized by many countries and research communities, suggesting proper mask use in transportation facilities such as cars and trains [4,5,6,7,8]. As of June 2021, the number of global confirmed cases is over 190 million, and the death toll is 3.9 million. Air pollution during transportation can have other adverse health effects, including respiratory and cardiovascular diseases and death [9]. A study by Goel et al. shows changes in traffic density for multiple weeks may not induce immediate PM2.5 or BC exposure changes, but some toxic elements such as P, S, As, Cu, and Pb may change significantly [10]. Despite the exposure time in a vehicle being relatively limited, the chemical species and their concentrations can represent a significant health risk to commuters [11].
Large proportions of aerosol exposure are experienced during daily commuting trips due to heavy traffic, which contributes to a serious problem for public health [12,13]. High levels of PM2.5 in traffic exposure are associated with systemic inflammatory response and respiratory injury [14,15]. The study of Xu et al. indicates that the carbonyl compounds emitted by private cars in Nanjing are harmful to passengers, and most people prefer to take public transports for convenience [16]. Commuting using light rail and the subway have potential health benefits when compared to driving on roadways for the general population [17]. Commuters’ PM2.5 exposure level in public transport modes is always impacted by wind speed and the number of passengers [18]. In addition, commuting via walking and bus has more exposure to a larger particle concentration and PM2.5 mass concentrations for commuters in Beijing [19].
Traffic-related air pollution is a serious health risk, especially for susceptible people [20]. Heavy traffic and various public transport modes also increase the risk of cross-infection during the SFTR. However, in recent years, there have been no articles about the exposure risk of passengers on public transport during the SFTR. Public transportation is always fully or overloaded during the SFTR, as well as the roads and highways being congested. This study was conducted during the worst transportation scenario in Yangtze Delta, which is the most populated area in China. In this study, (1) the personal exposure to PM mass concentrations of five transportation modes was investigated. (2) PM mass concentrations were analyzed during and after the Chinese SFTR with the impact of the COVID-19 outbreak.

2. Methods

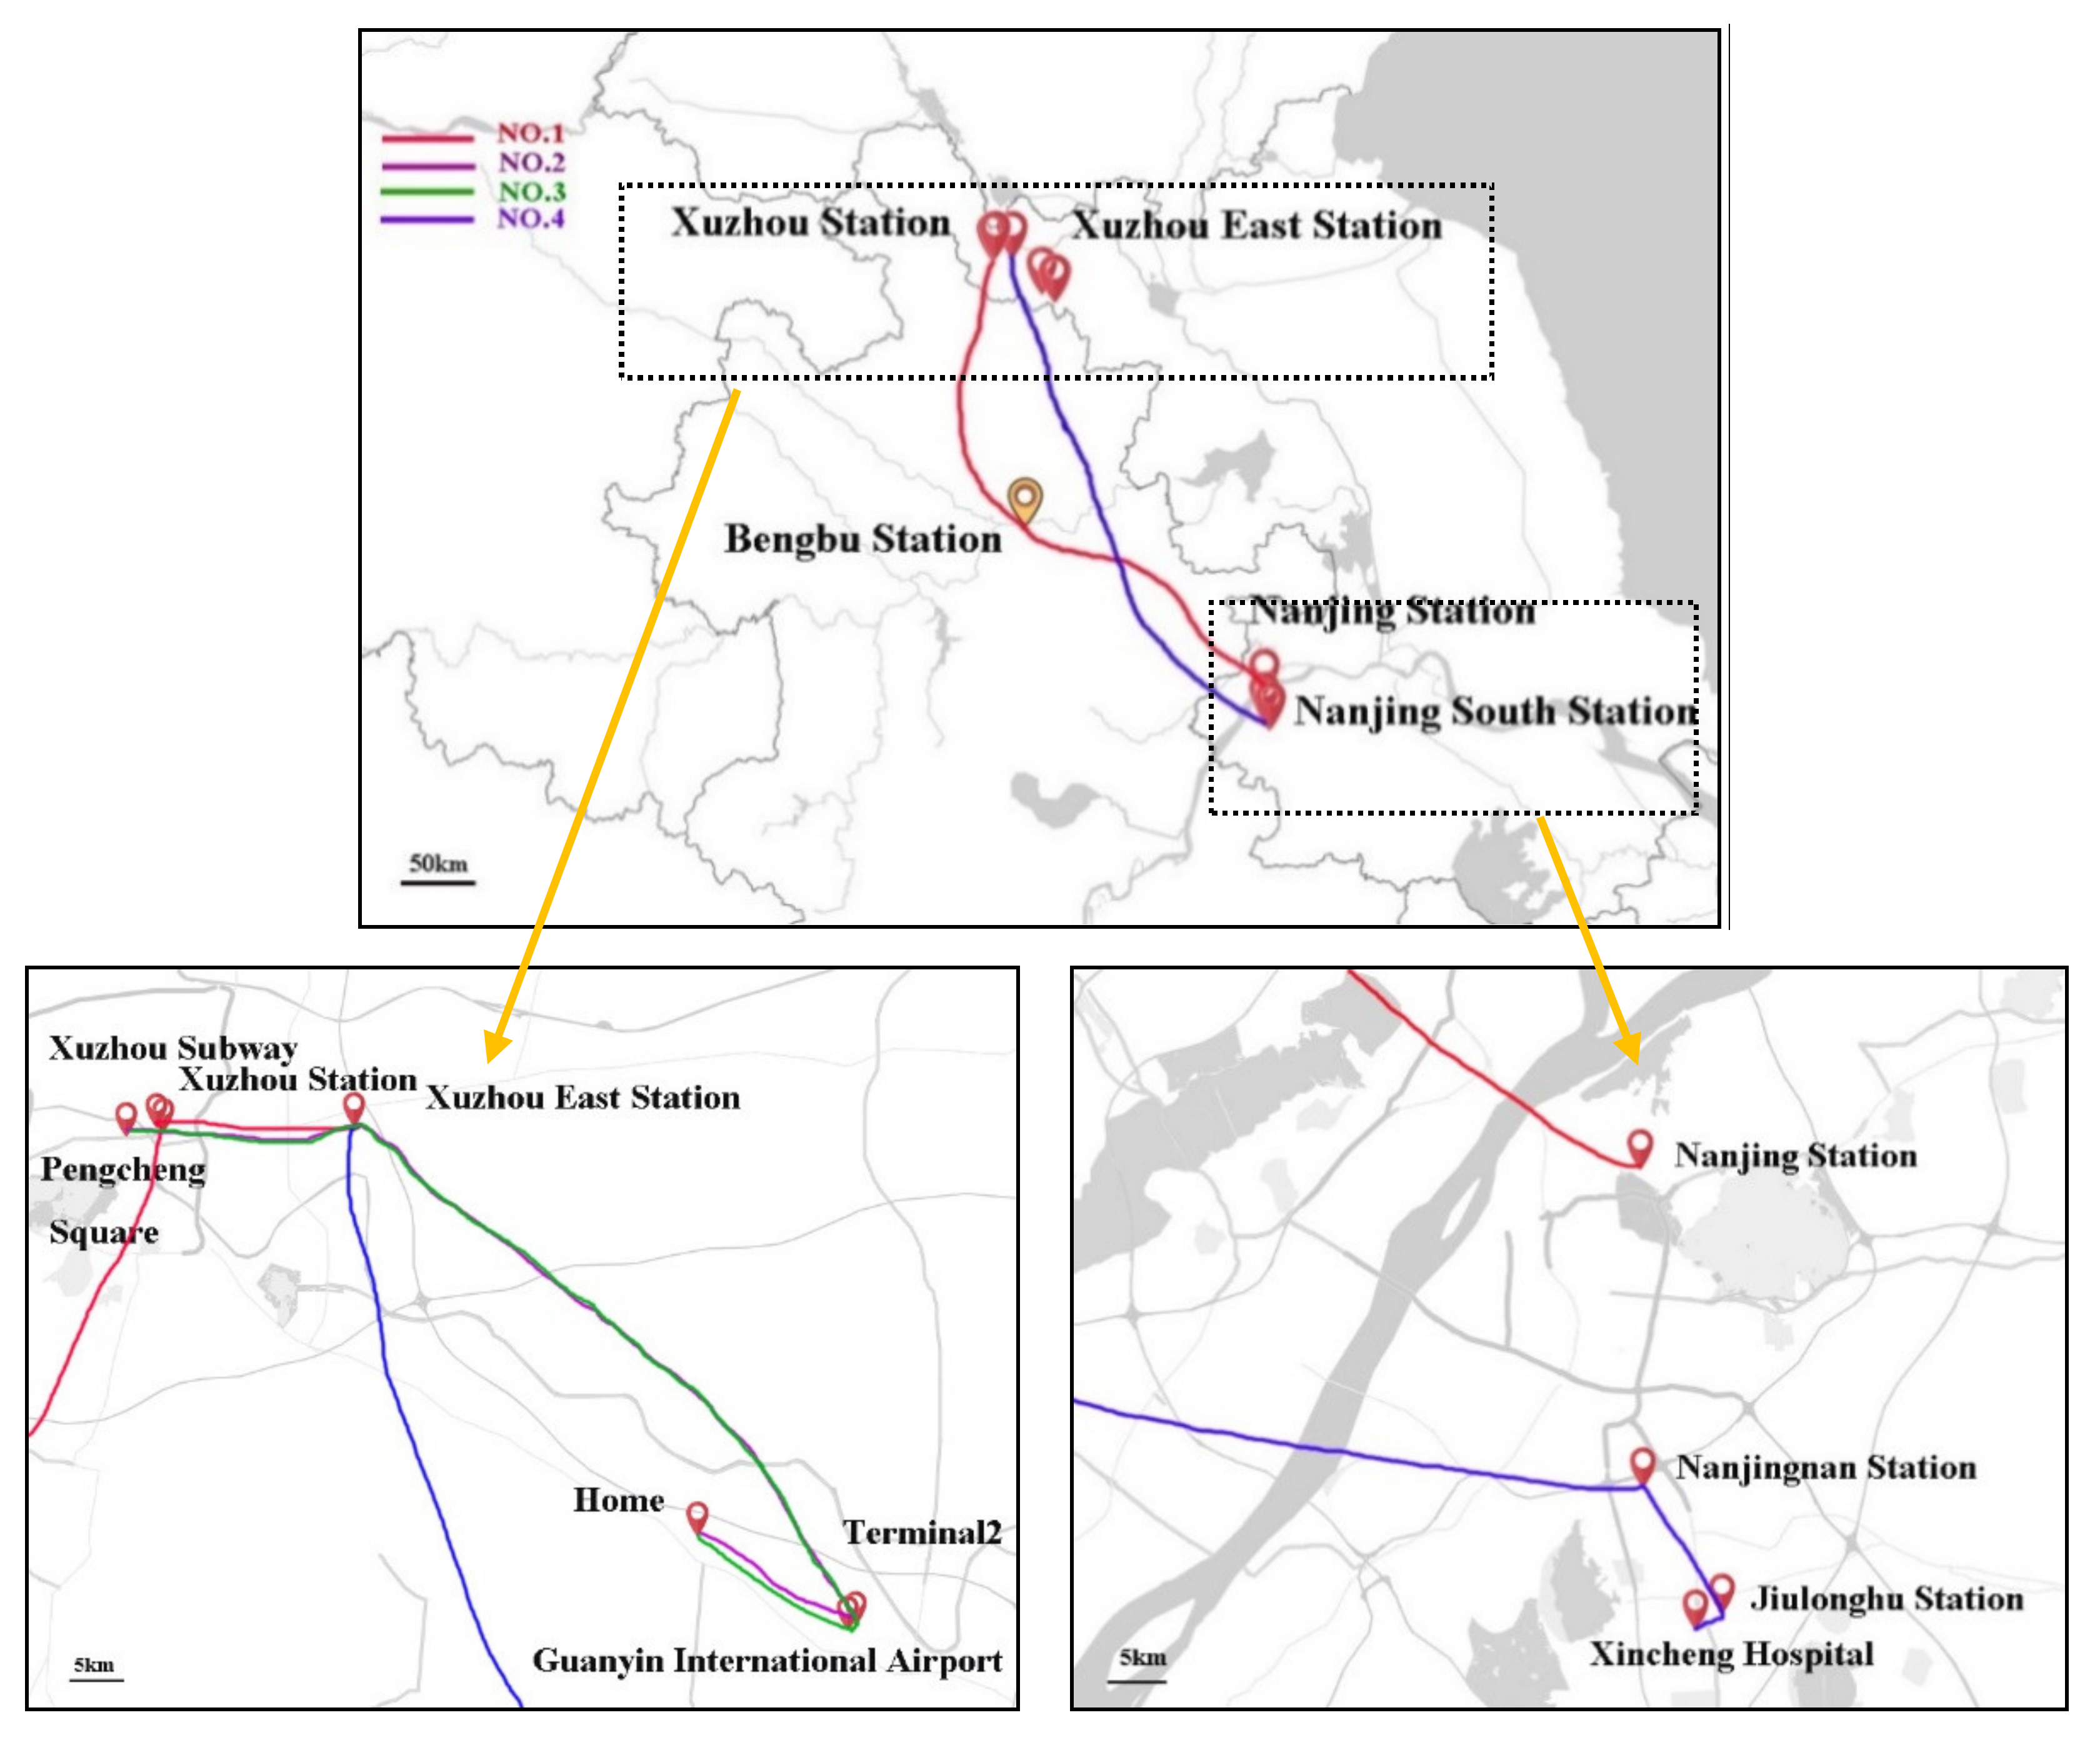
2.1. Sampling Routes

Nanjing Railway Station, servicing approximately 210,000 passengers daily during the SFTR, is the center of transportation and tourism in the Yangtze Delta [21]. Passengers are mostly made up of workers and students, and public transport is their first choice. Figure 1 shows the four routes of commuter monitoring data, namely NO.1, 2, 3, 4. The travel routes are connecting Nanjing Railway Station, Nanjing South Railway Station, Xuzhou Railway Station, Xuzhou East Railway Station, and Guanyin International Airport. Xuzhou Railway Station, as the main railway station, services approximately 33,200 passengers daily during the SFTR. Meanwhile, the Xuzhou Subway Line 1 is also selected as the typical route to approach Xuzhou East Railway Station for convenience, and it services approximately 85,700 passengers every day. A total of 1.06 million people is the highest single-day passenger volume of Nanjing Subway Line 3.
Table 1 shows the specific segments of the four routes during and after the SFTR. Table 2 summarizes the basic information of four selected travel routes, such as ventilation type, duration, and distance. Five transport modes are included, which are China railway high-speed train (CRH train), subway, bus, passenger car, and walking. Air conditioning (AC) is used in CRH trains, subways, and busses. The passenger car did not use AC (Non-AC), and the windows were opened (WO) when NO.1–3 routes are selected, but the car AC mode was on when NO.4 route is selected. The carriages of the CRH train and bus are fully loaded. In addition, walking is also considered open-air. There is a distance between Xuzhou Railway Station and Xuzhou Subway Station, and passengers walk along the street for about 24 min for the transfer. The NO.4 route was operated after the strictest quarantine was lifted, and students and workers were back in their original places. The other routes were operated during the SFTR with the beginning of the COVID-19 outbreak.

2.2. Measurements

In this study, personal exposure monitoring began when the researcher left school for winter vacation. The first experiment was performed on 19 January 2020 from 11:03 to 17:25 (NO.1). The second experiment was performed on 21 January 2020, from 10:06 to 18:23 (NO.2, 3). The third experiment was performed on 6 May 2020, from 09:58 to 13:39 (NO.4). The PM mass concentrations were measured using a portable air quality monitor (BoHu model BH1-B3, China), and the instrument’s detailed information is shown in Table 3. This instrument uses the light scattering method to measure the PM from 0 to 1999 μg·m−3 (PM1, PM2.5, PM10). This instrument has been calibrated against a TSI DustTrak 8532 for PM2.5 indoor and outdoor use before the experiment (R2 = 0.89). Weather parameters such as temperature (T) and relative humidity (RH) were also measured by the same instrument. All collected data are stored in the memory card inside the instrument with a 1 min sampling interval.
The ambient PM mass concentration is usually affected by meteorological conditions. However, the in-cabin microenvironment in trains, passenger cars, subway cabins, and buses was mainly affected by the air conditioning systems when the doors and windows were tightly closed. The ambient relative humidity (RH) and temperature (T) mostly affected the walking exposure in our study. The air quality index (AQI) has been set up based on the ambient environment. However, in terms of personal exposure, the ambient and in-cabin exposure levels were both important because nowadays, people spend more time in microenvironments, such as buildings and cabins. The average temperature (T) and relative humidity (RH) of four transportation routes are summarized in Table 4. The outdoor T and RH during the walking mode were similar to the in-cabin conditions in this study. The cabin microenvironment in different transportation modes was affected by the air conditioning/ventilation systems, mostly when the cabin doors and windows were tightly closed.
The maximum speed of the CRH train is about 250 km/h. The Xuzhou Subway Line 1 started operation on 28 September 2019, and Nanjing Subway Line 3 has operated from 1 January 2015. The bus is free for the airport to shuttle passengers who get off from the Guanyin international airport. The private passenger car is a Mazda-6 four-door sedan with a 2.0 L engine (gasoline) and high-performance cabin air filter VF2018, which was used during SFTR. After the strictest quarantine was lifted, a new (less than 1 year) Lynkco-03 four-door SUV with a 1.5 L engine (gasoline) and a high-efficiency particulate air filter (HEPA) was driven from home to the Guanyin international airport. During exposure measurement, the instrument was positioned outside a laptop backpack and fixed with tape, which has no threat to the security check during the SFTR.

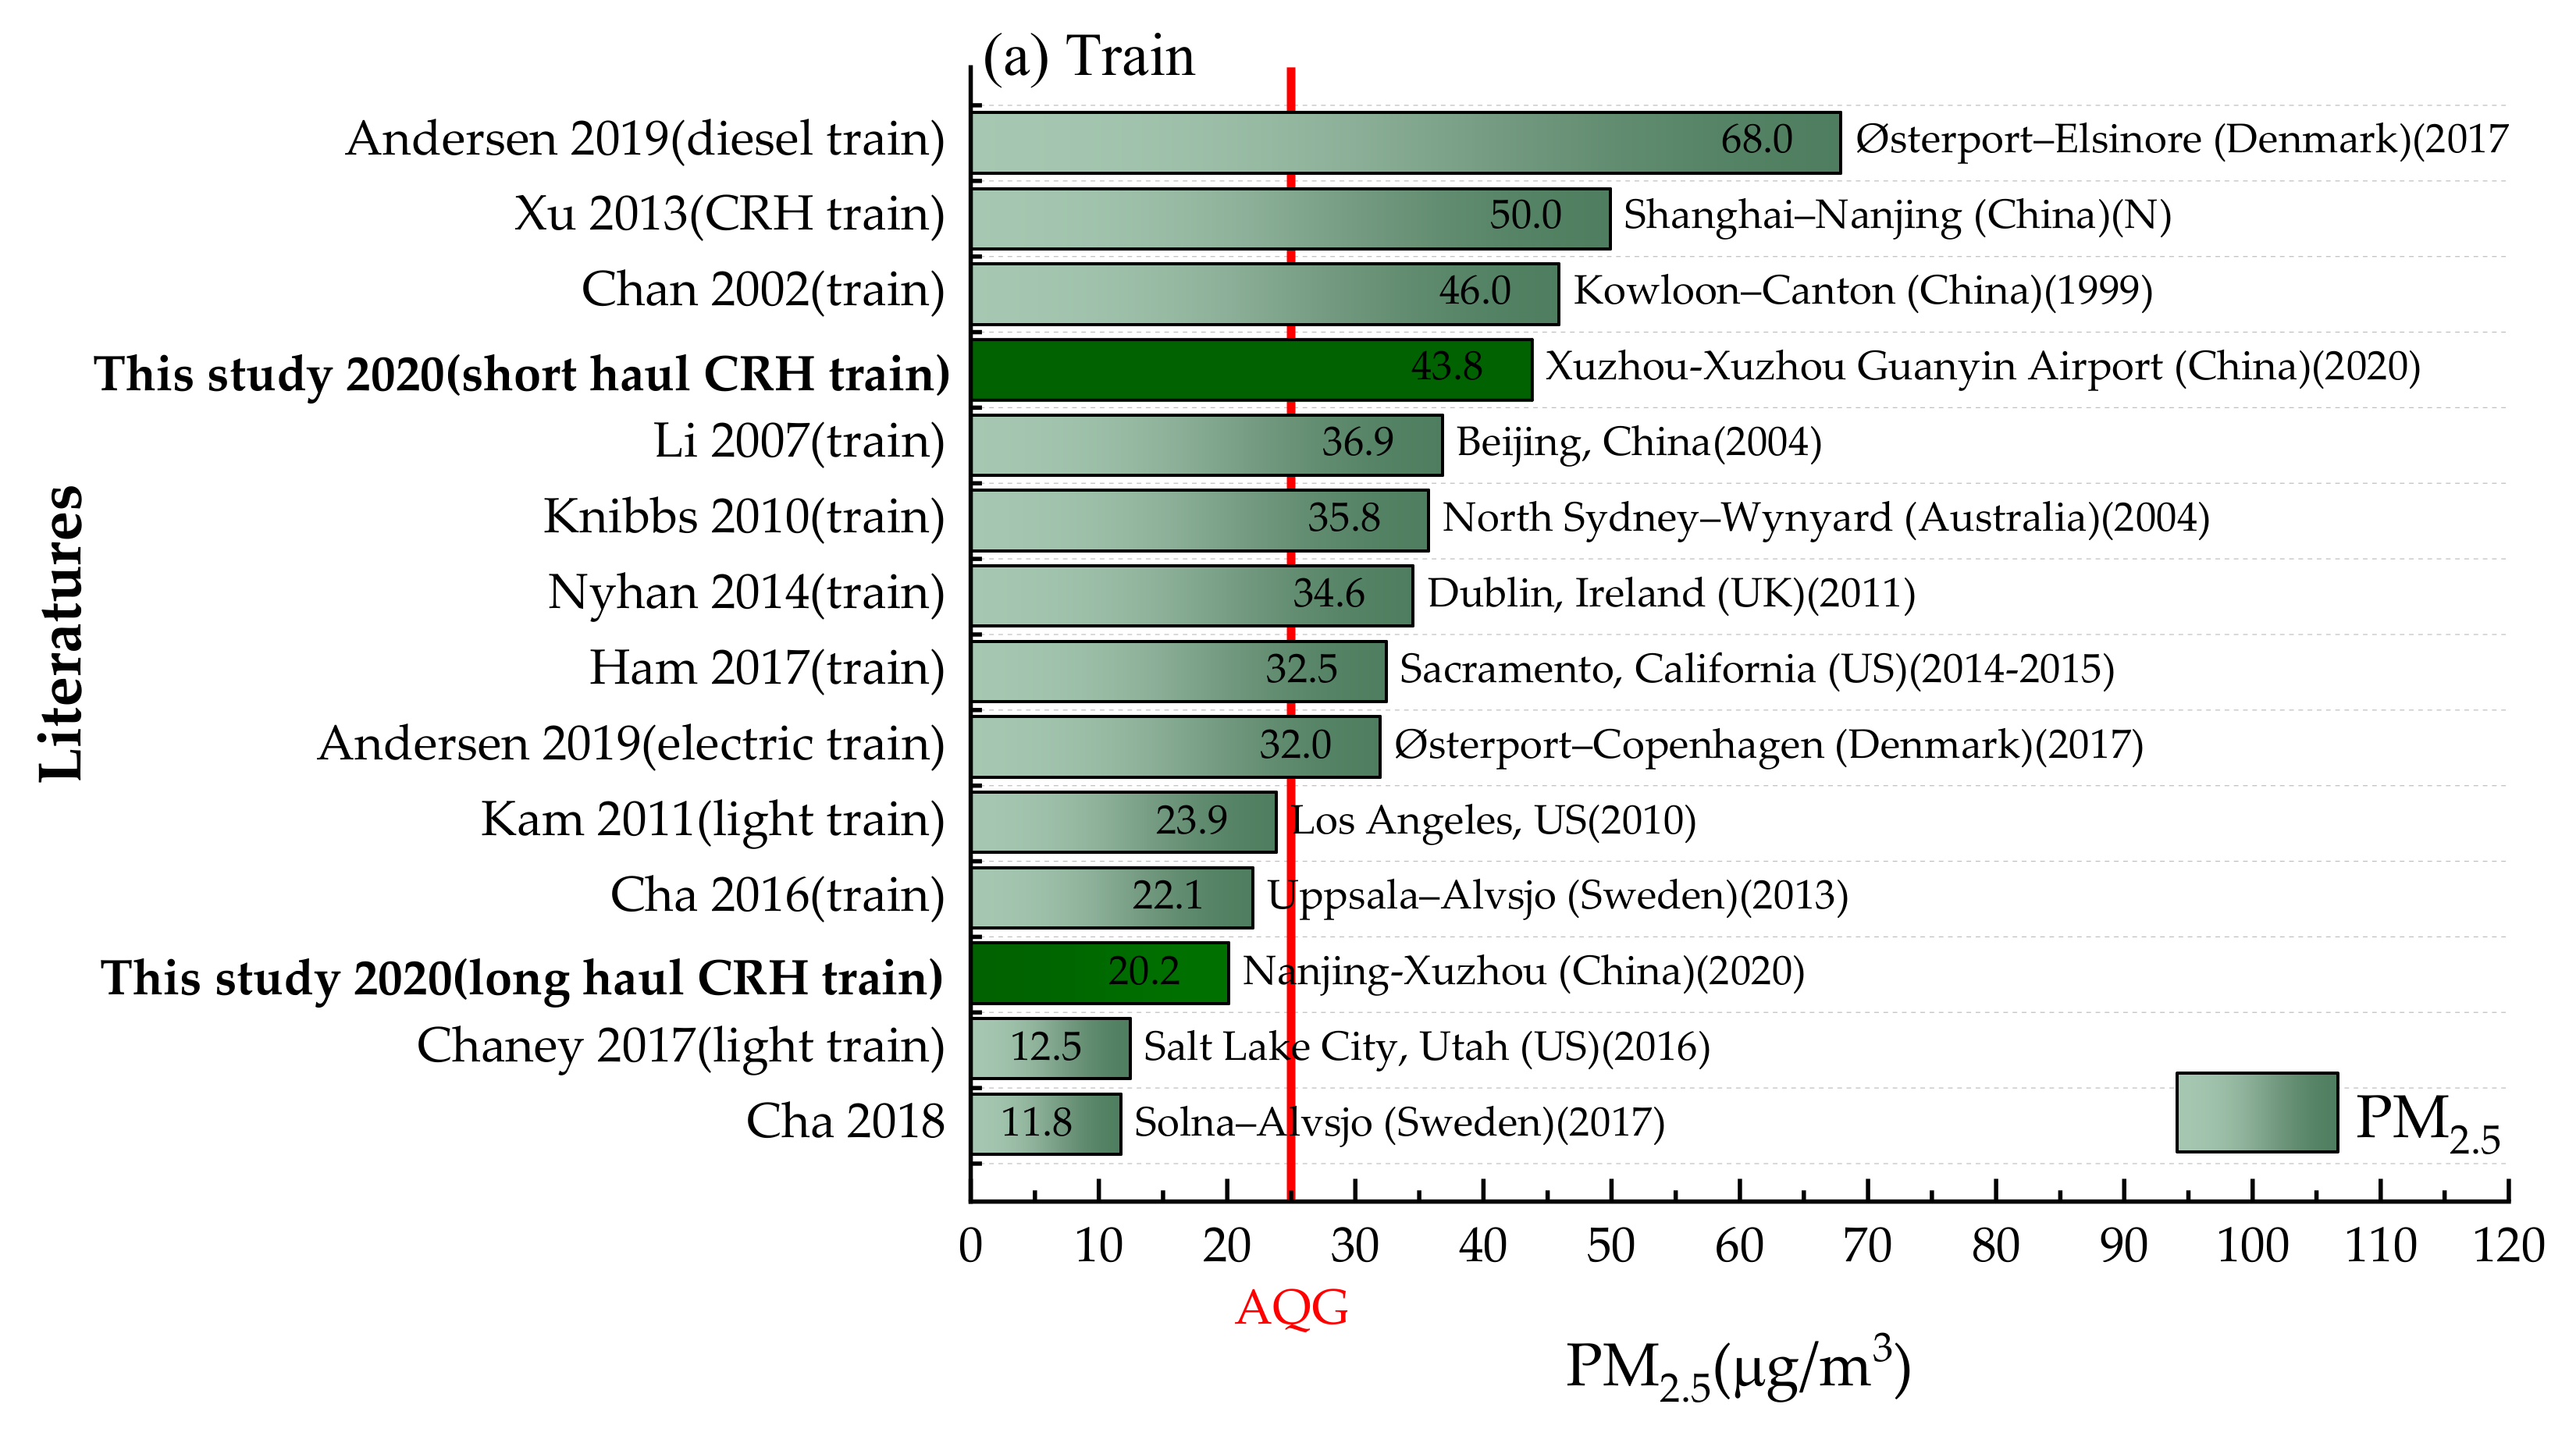
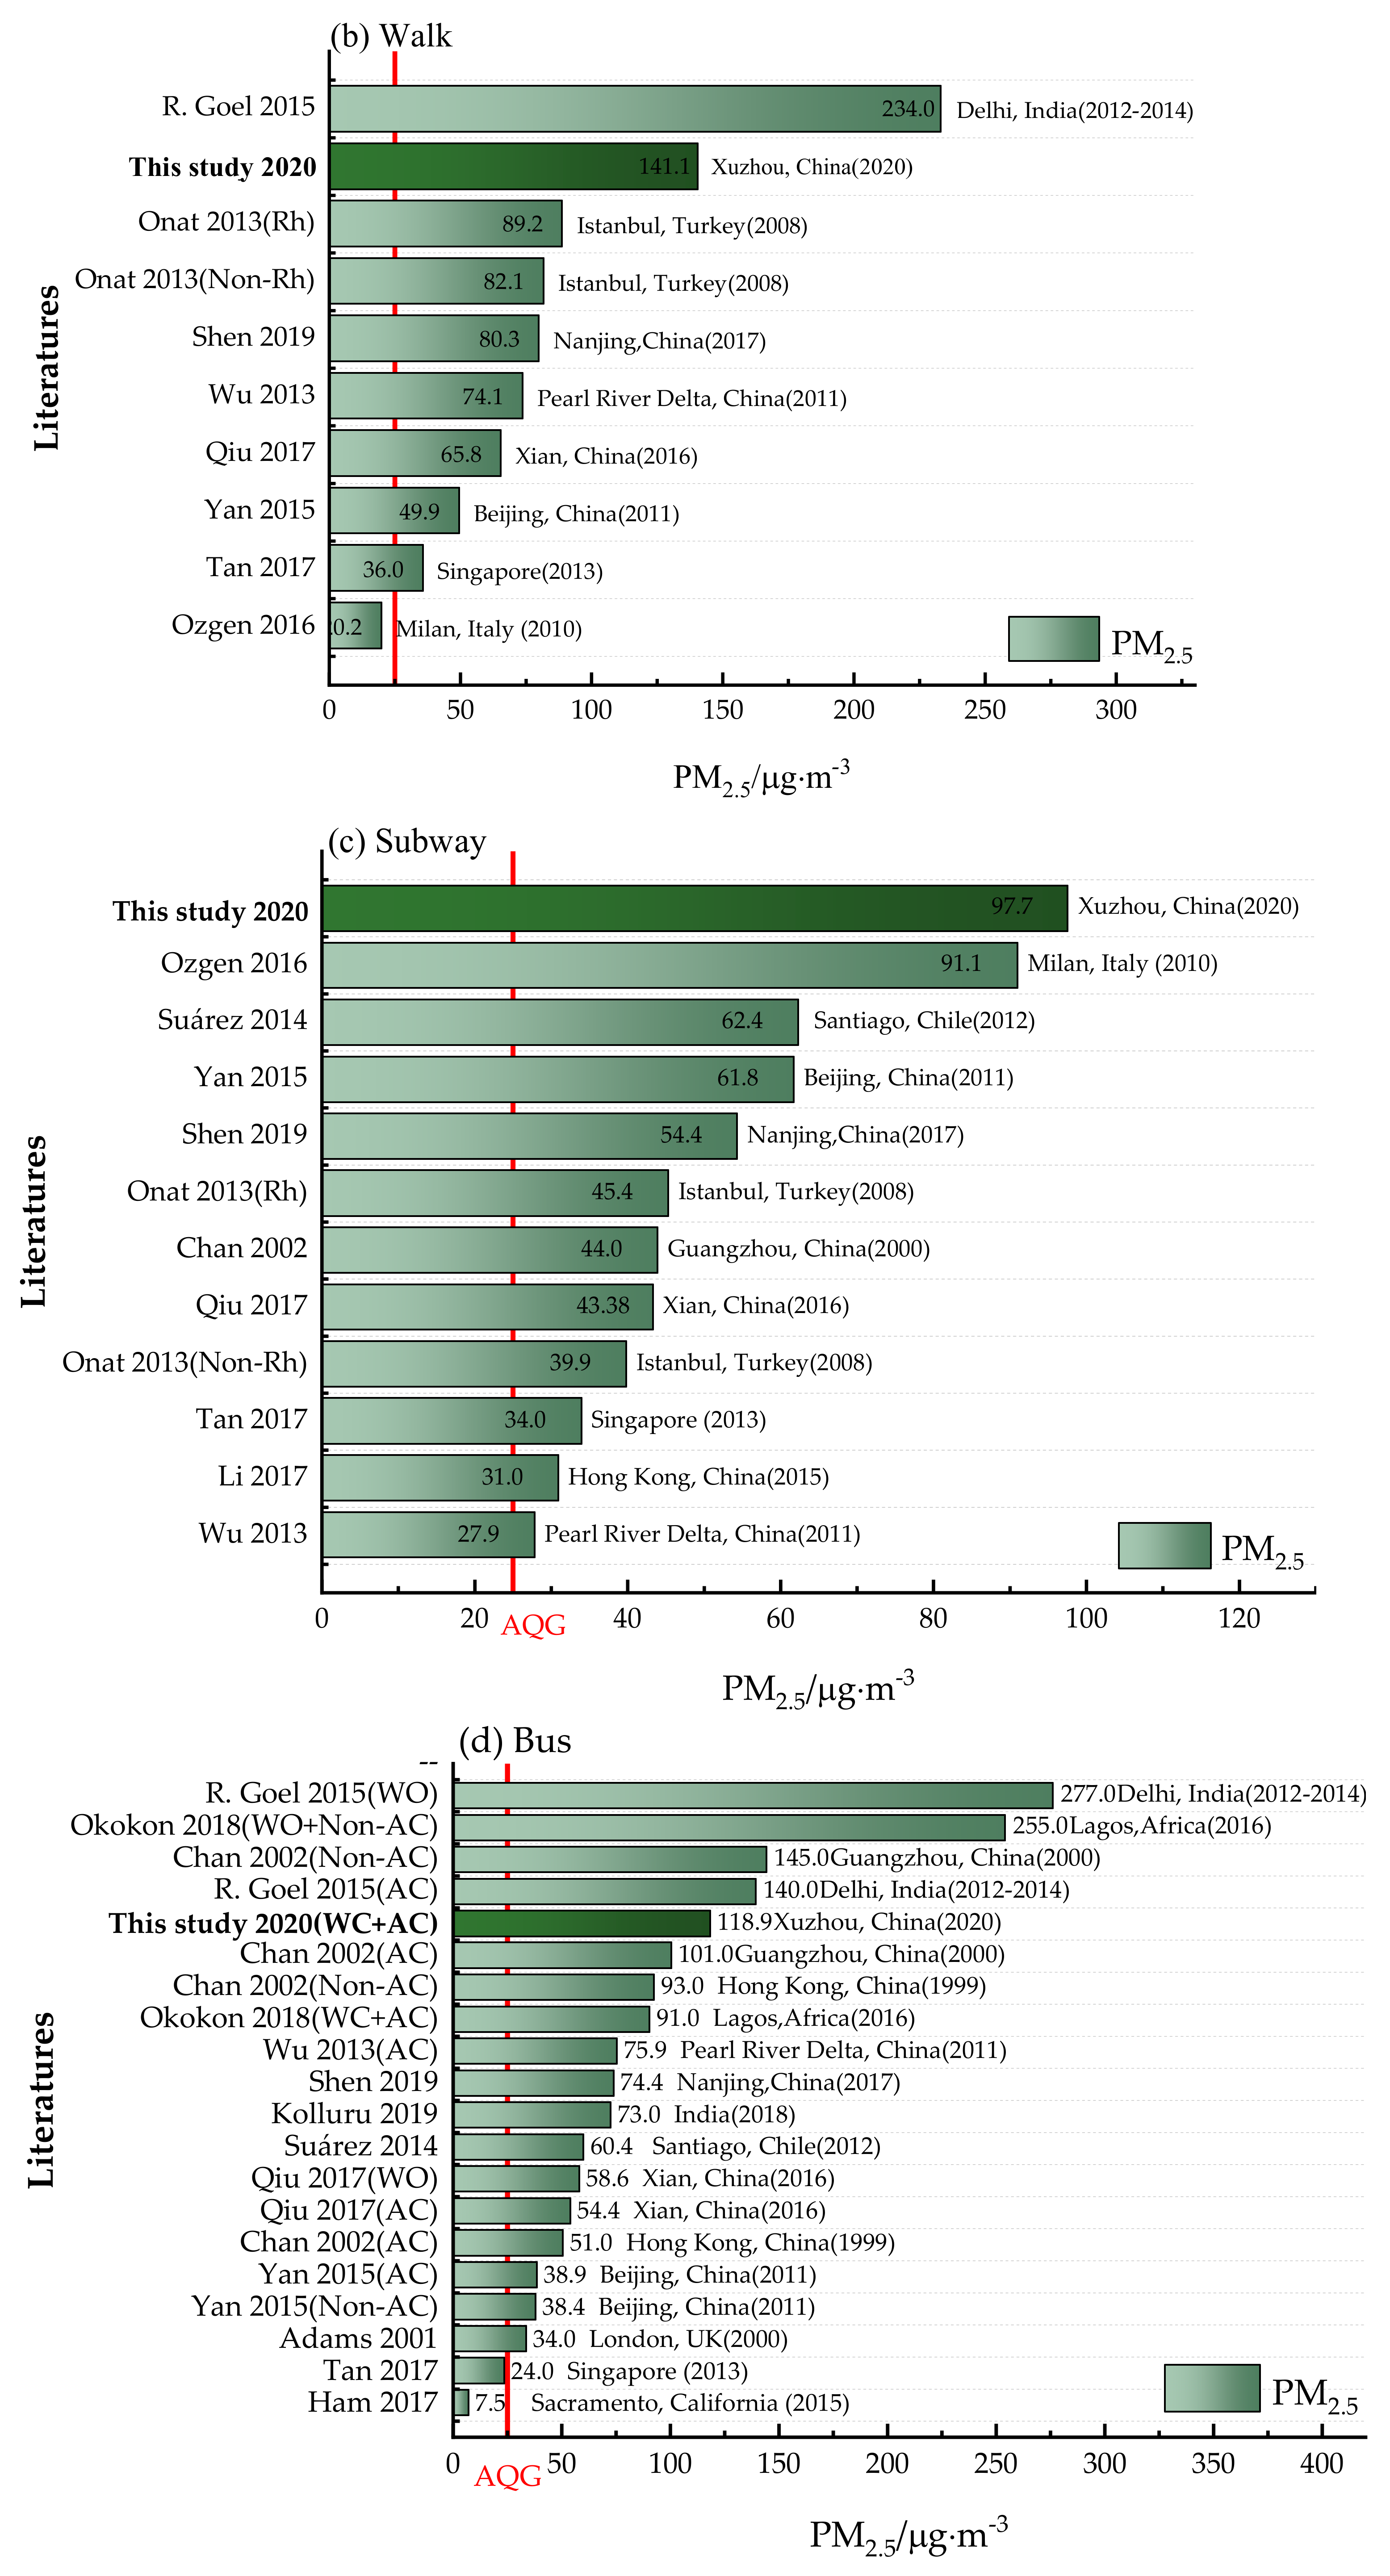
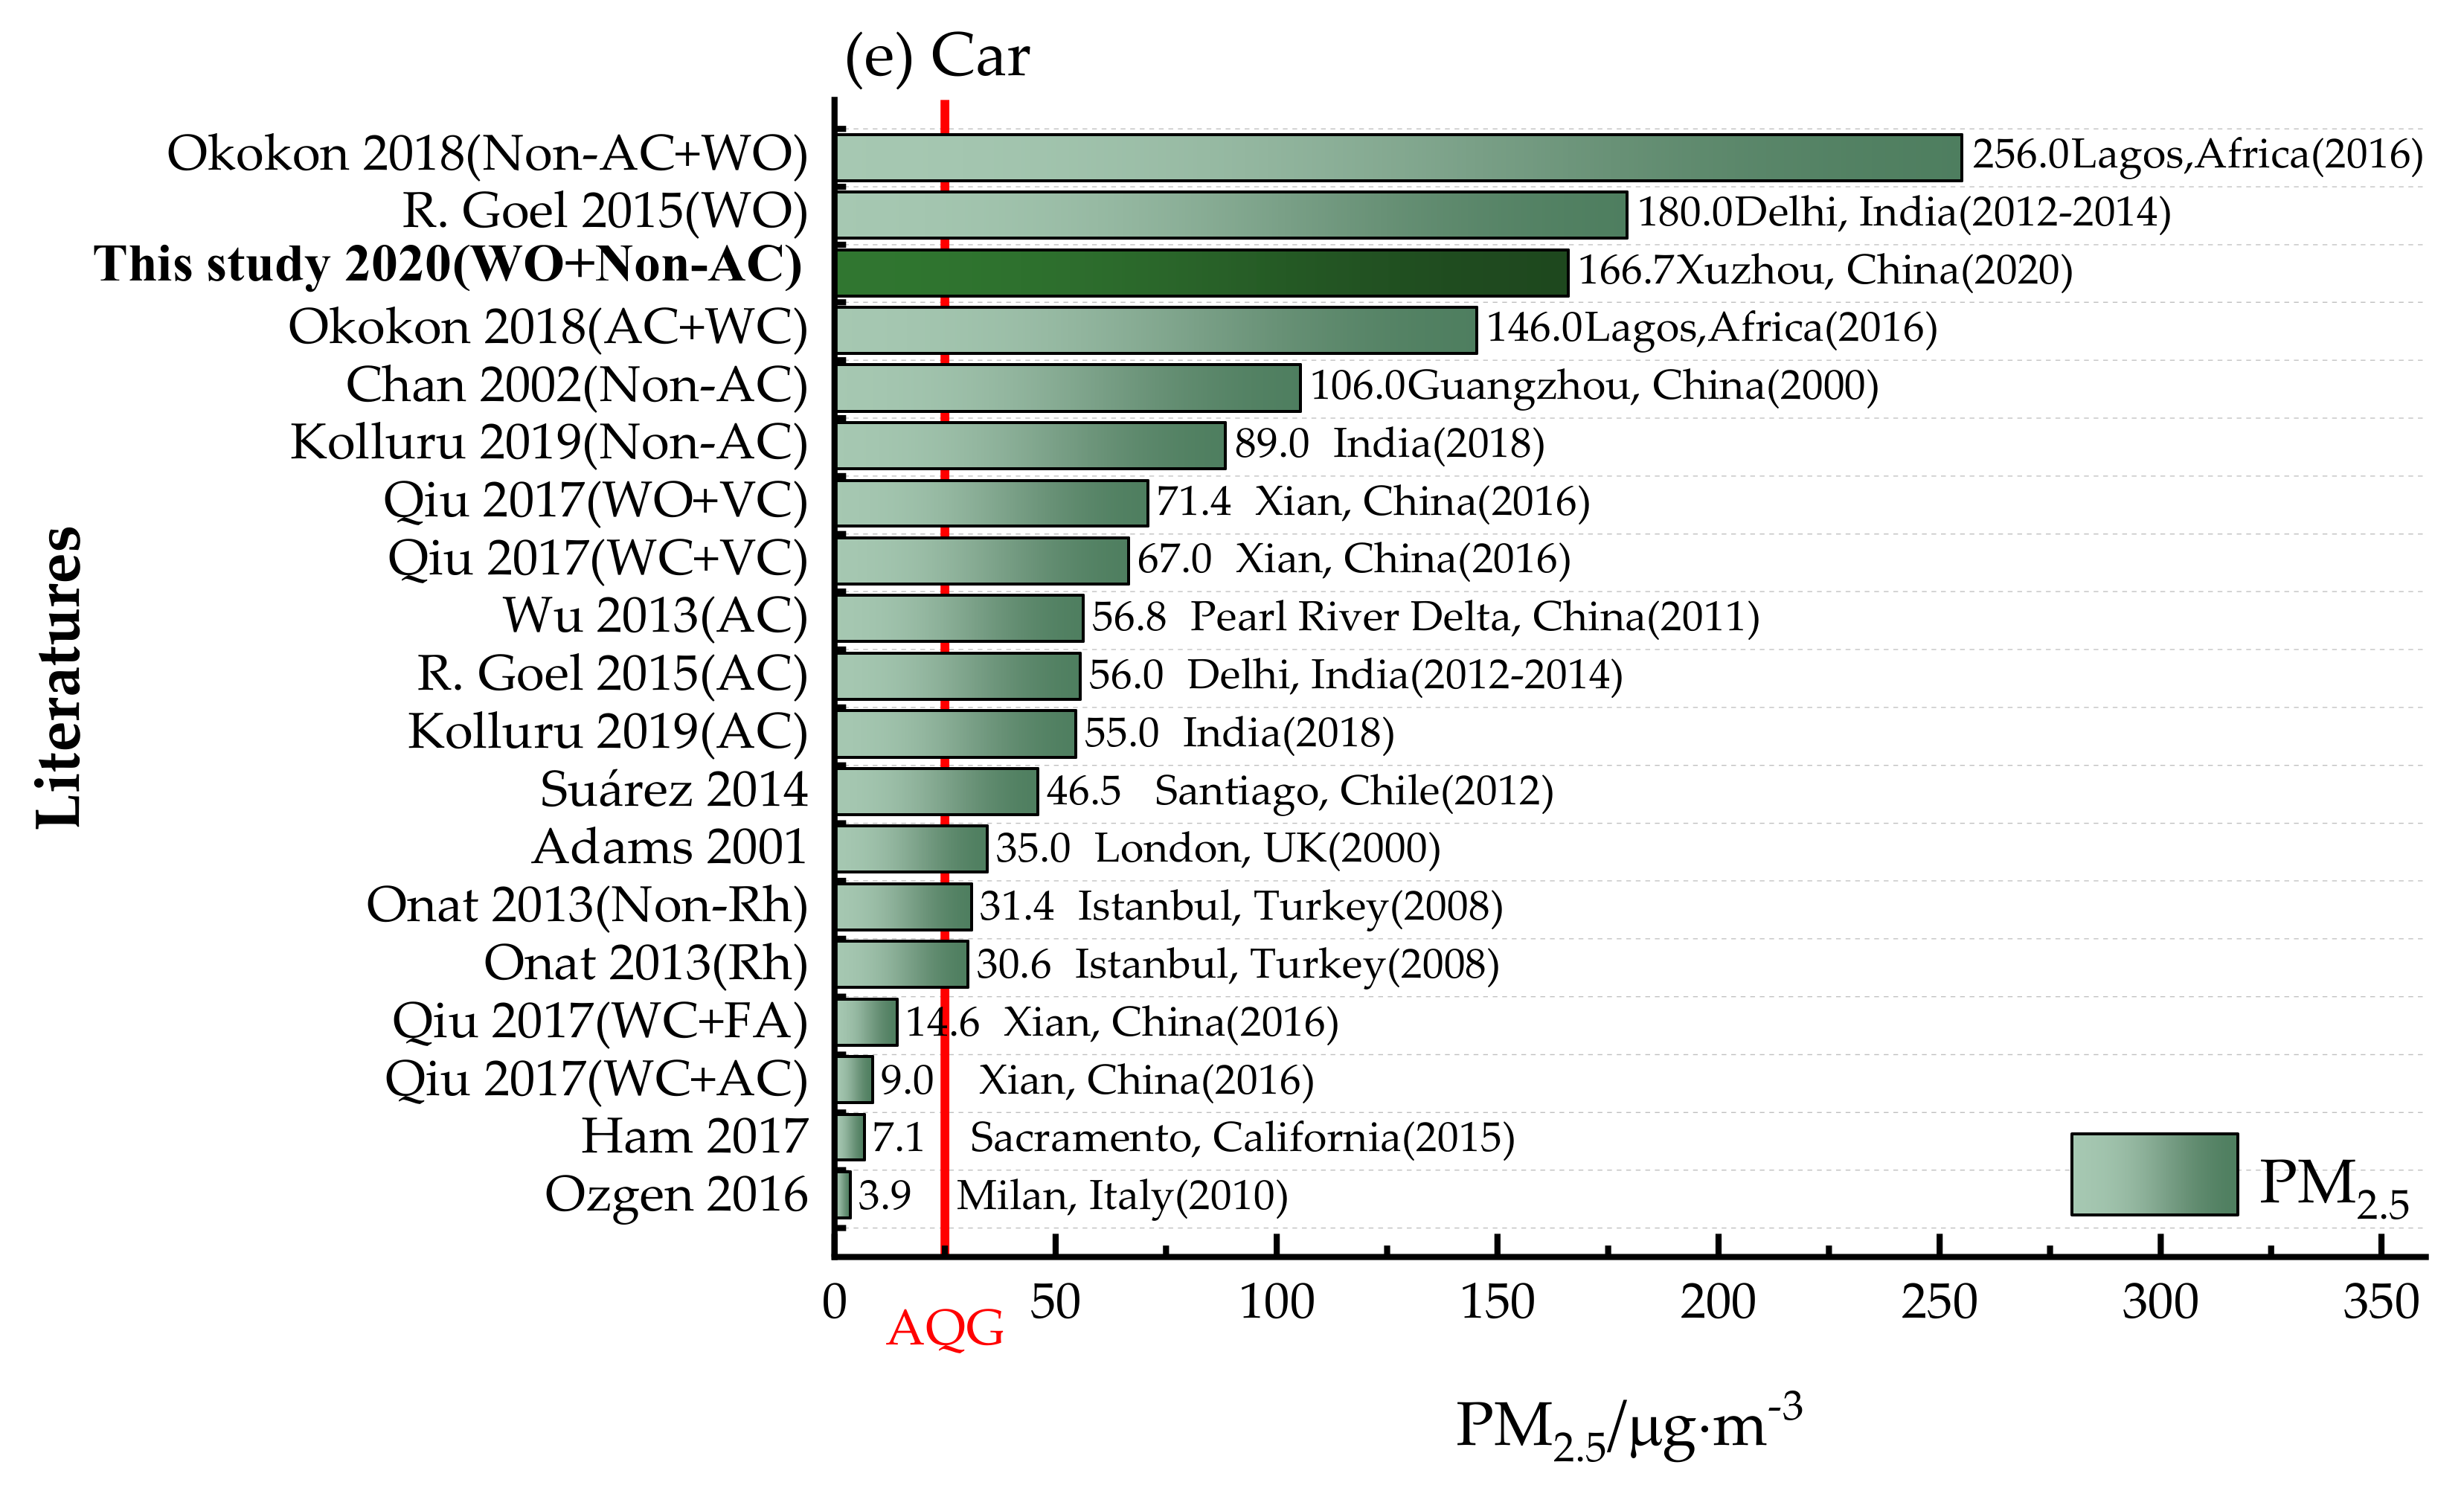
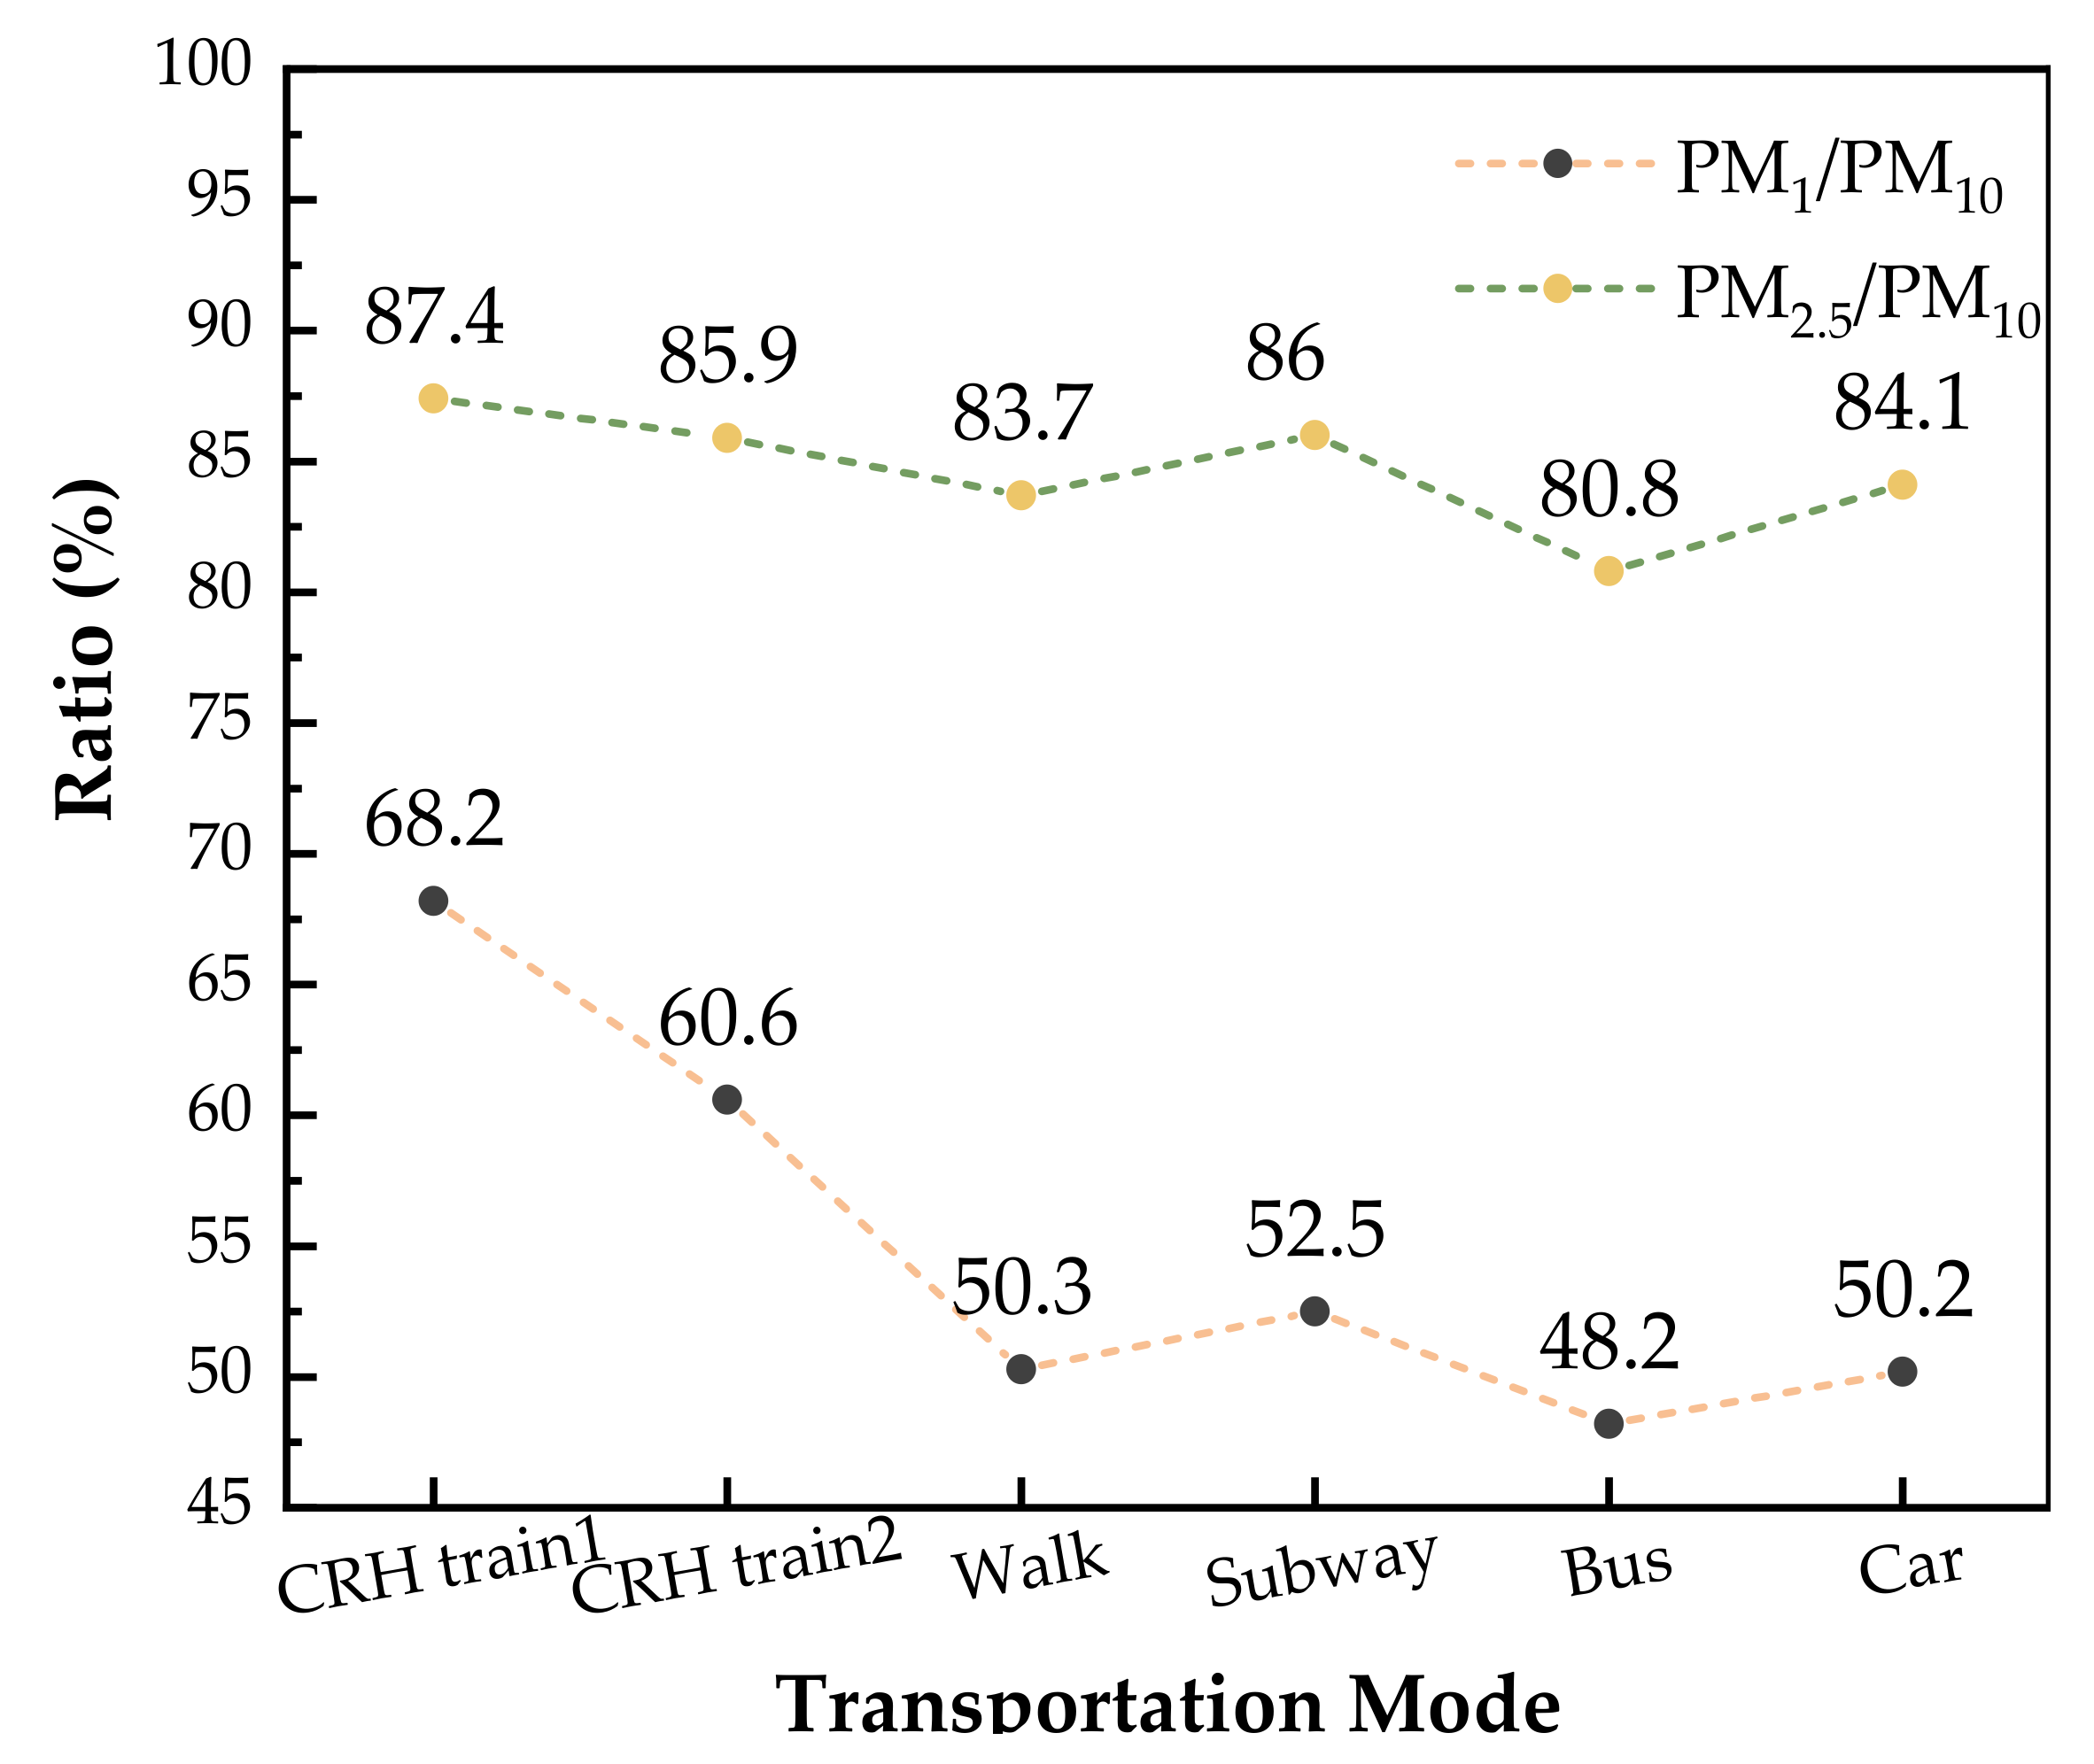
3. Results and Discussion

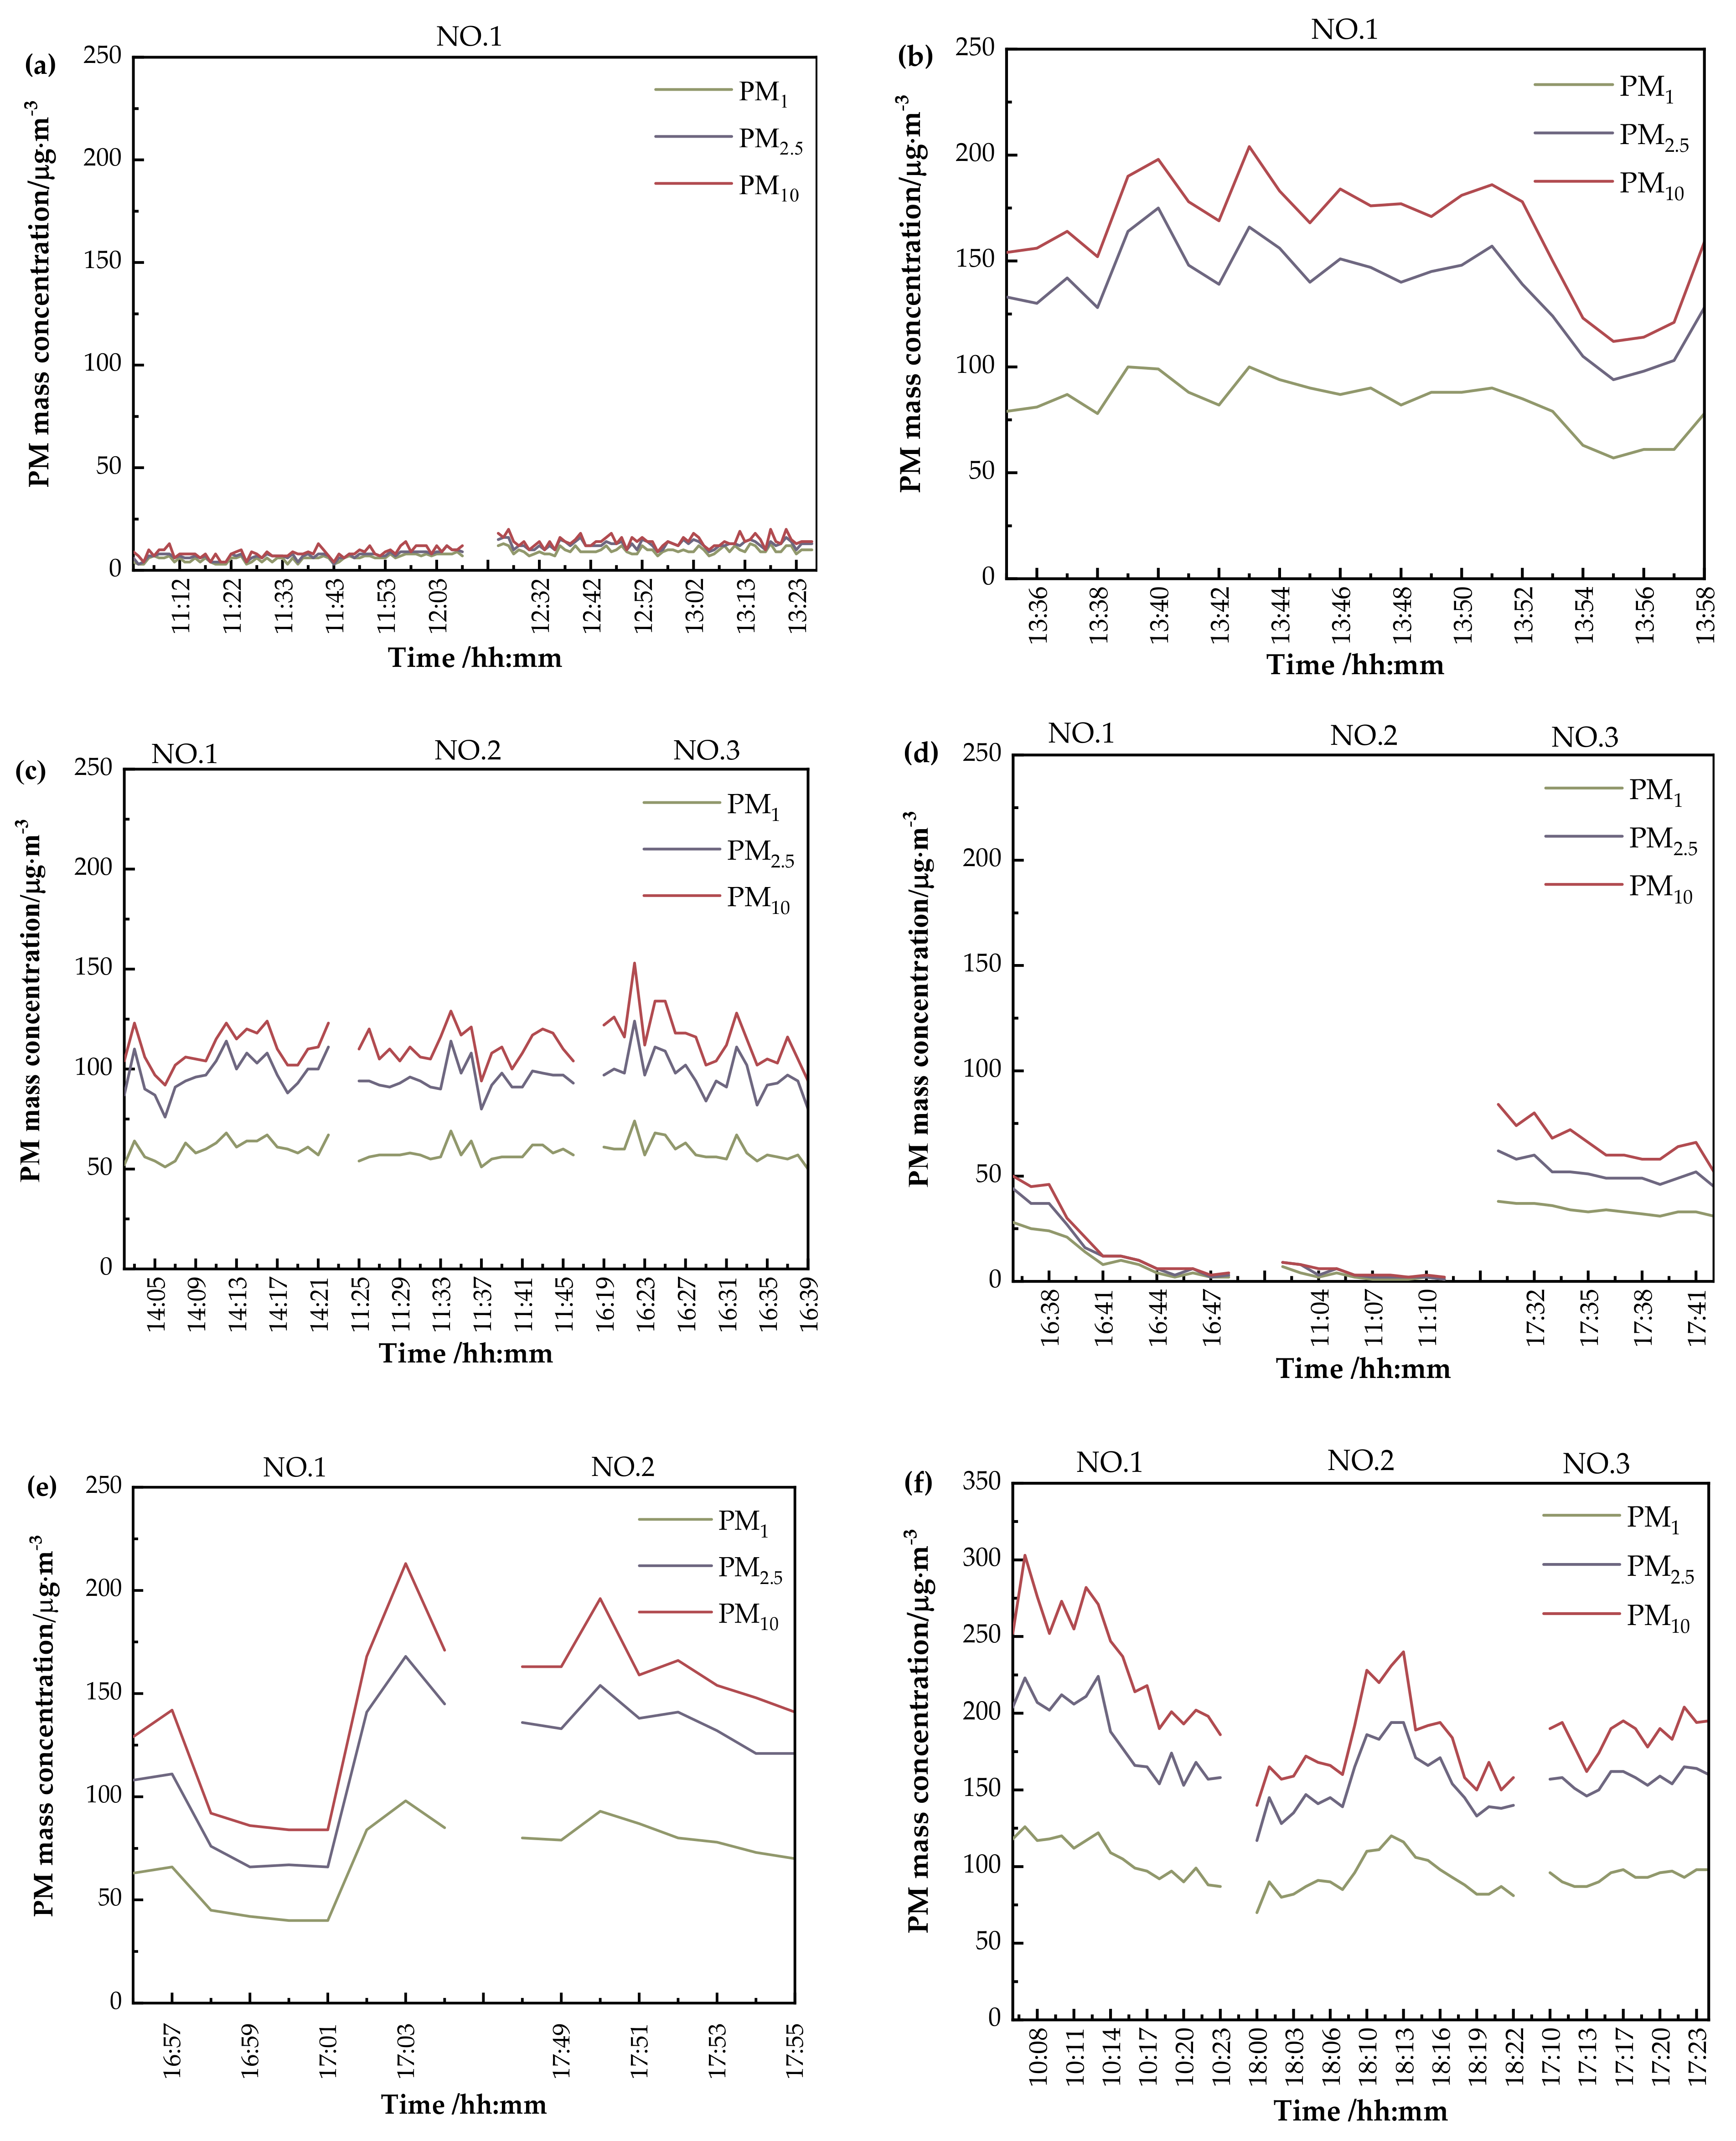
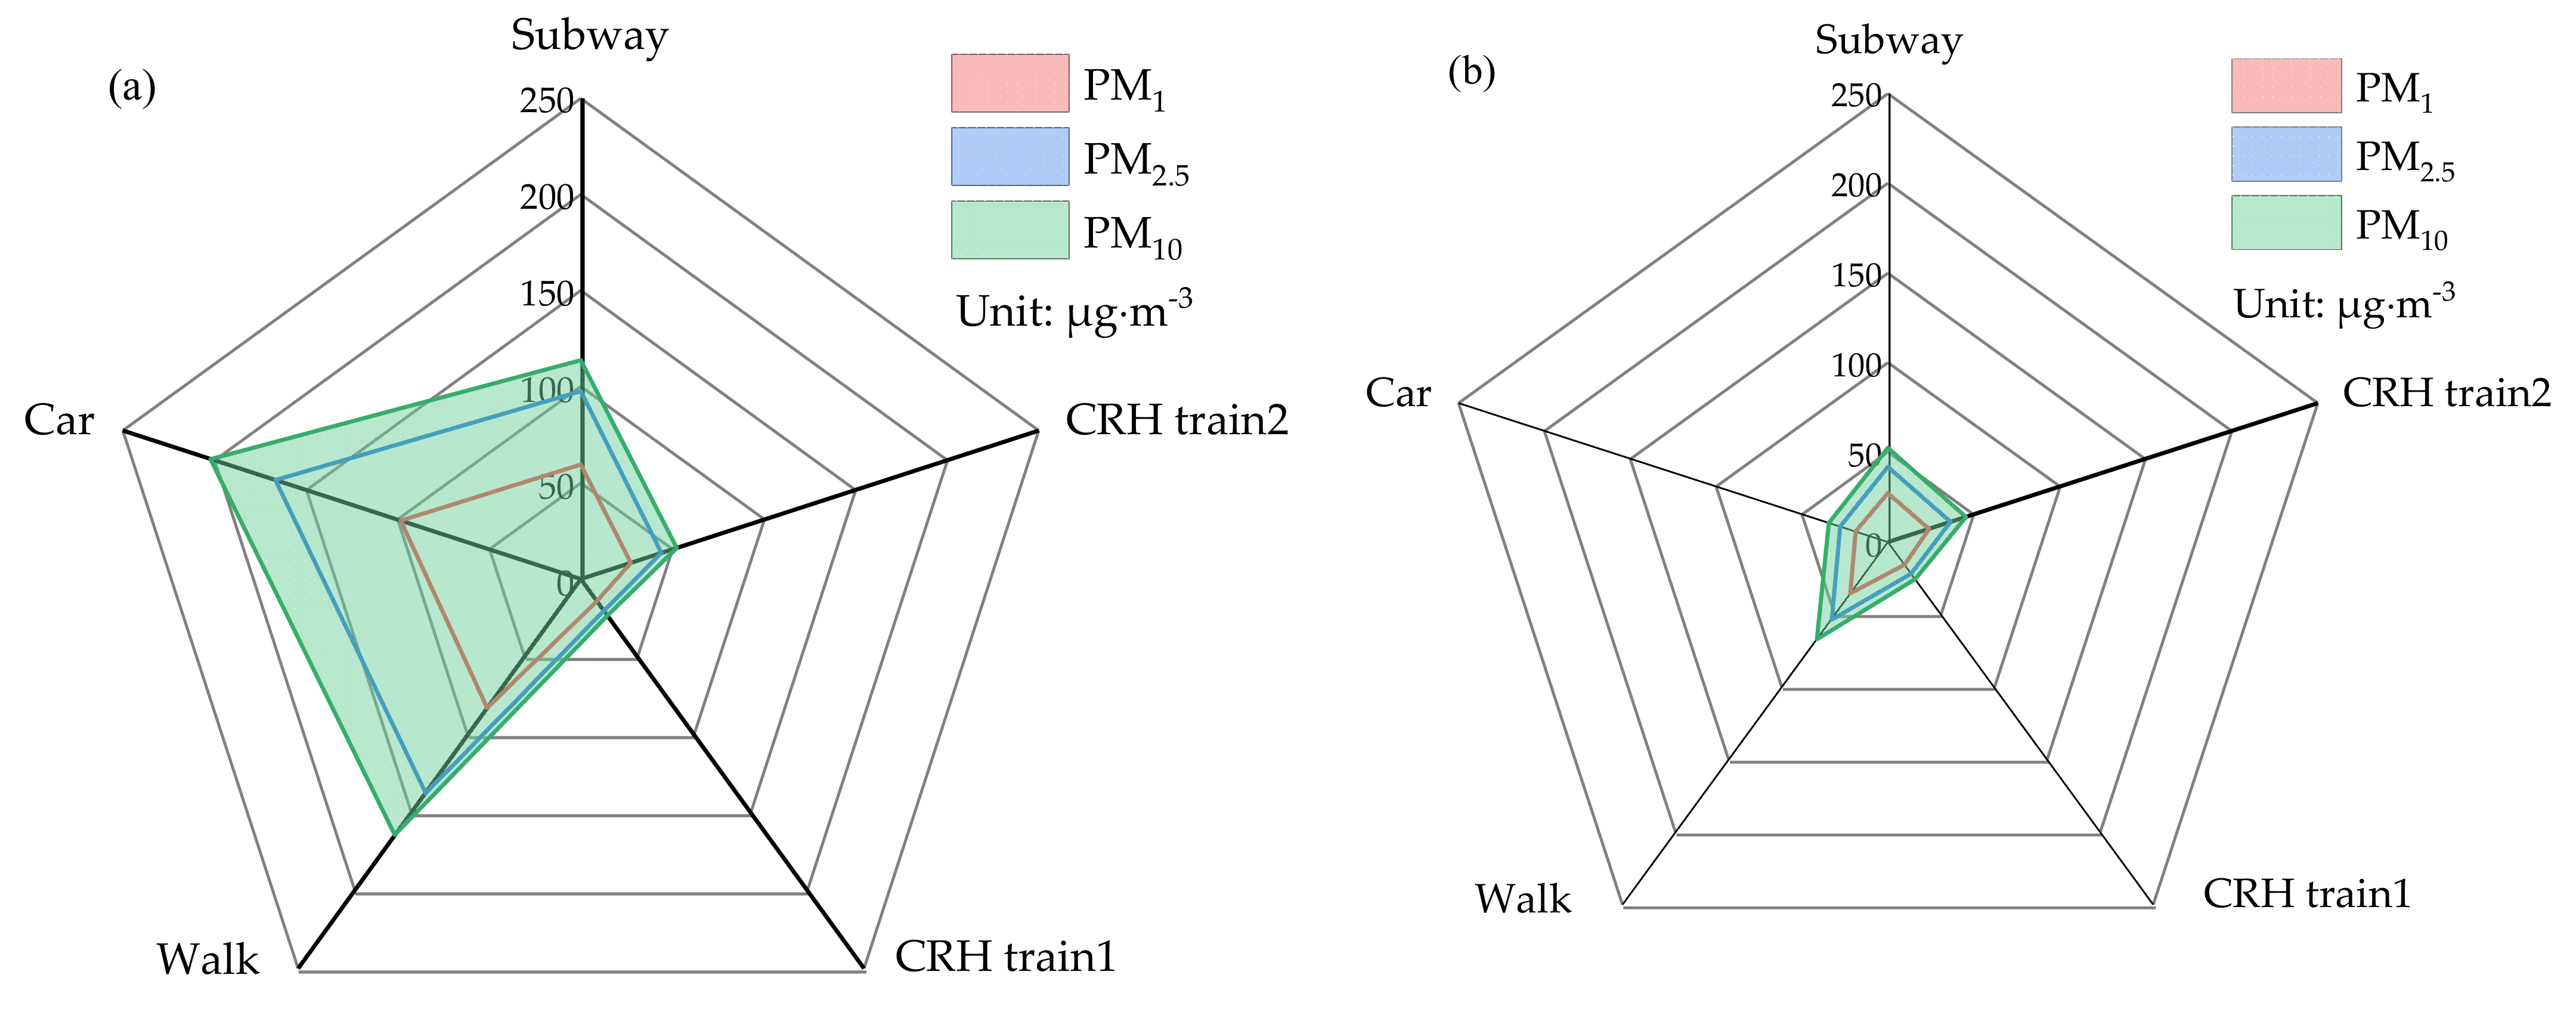
3.1. During the SFTR

The World Health Organization (WHO) air quality guideline (AQG) for 24-h mean PM2.5 and PM10 are 25 μg·m−3 and 50 μg·m−3, respectively. The AQG is the lowest level at which total cardiopulmonary and lung cancer mortality have been shown to increase with more than 95% confidence in response to PM2.5 in the American Cancer Society study [22]. There is no related guideline of PM for the health of commuters in public transportations in China. Figure 2 shows the box plot of PM mass concentrations during the SFTR. Average PM10 mass concentrations of five different transport modes range from 23.4 to 202.3 μg·m−3.
When passengers commute using the subway and car, the exposure levels of PM10 mass concentrations are all higher and about twice as high as the results of Qiu et al. (subway: 58.2 μg·m−3; car: 95.9 μg·m−3; walking: 110.0 μg·m−3) [9]. However, when commuting on the bus, the exposure level to PM10 mass concentration in this study is similar to the results of Qiu et al. (123.6 μg·m−3) and Chan et al.(184.0 μg·m−3) [9,23]. The exposure level of passengers in a car and by walking is higher than other transport modes, and the mean PM10 mass concentrations of car and walking are 202.3 μg·m−3 and 164.5 μg·m−3, respectively. However, the average PM10 mass concentration of commuter exposure in CRH train1 is the lowest, which is one ninth of the commuting in car level. Average PM2.5 mass concentrations for six segments are 20.2 μg·m−3, 137.5 μg·m−3, 97.7 μg·m−3, 43.8 μg·m−3, 118.9 μg·m−3, and 166.7 μg·m−3, when commuters travel by CRH train1, walk, subway, CRH train2, bus, and car, respectively. During the SFTR, the exposure levels of PM2.5 mass concentrations in five tested transport modes are 2 to 4 times the results of other researchers, as shown in Figure 3 [9,19,24,25,26,27,28].
As Figure 3a shows the exposure level to particles when passengers take the CRH train, due to less research on pollution in CRH train cabins, this study makes a comparison with other electronic trains and diesel trains. According to Figure 3a, the exposure level in diesel trains are two times that in electronic trains [29]. Overall, the average exposure levels of electronic trains in Europe, China, and America are close, and they are 33.7 μg·m−3, 38.3 μg·m−3, and 22.5 μg·m−3, respectively [30,31,32,33,34,35,36,37,38]. In this study, the PM mass concentrations in the long-haul CRH train (CRH train1) are half of the short-haul CRH train (CRH train2). The fast speed (no more than 250 km/h) and frequent air exchange of the air conditioner might decrease the PM mass concentration.
Figure 3b indicates that the PM2.5 mass concentration is close to 2.4 and 2 times higher in this study (141.1 μg·m−3) when commuting via walking during the SFTR compared to the usual level in China (59.4 μg·m−3) and Asia (71.7 μg·m−3), respectively [9,13,19,24,25,39,40]. According to the study of Ozgen et al., the mean exposure level of SFTR in China is seven times that of Italy [40]. In India, PM pollution is more serious (234 μg·m−3), which is 1.7 times that of China during the SFTR [41]. In addition, the pollution level of China’s surrounding environment is getting worse compared with this study when commuting via walking, and 5.3 times that of the study of Yan et al. in Beijing (26.7 μg·m−3) [19].
Figure 3c shows that the mean PM2.5 mass concentration is 97.7 μg·m−3 when commuting on the subway during the SFTR, which is about 2.2, 2, and 1.6 times higher than the usual level in China (43.7 μg·m−3), Asia (47.95 μg·m−3, and Chile (62.4 μg·m−3), respectively [9,13,19,24,25,28,38,39,40,42]. When commuting on the subway, the exposure level to PM2.5 mass concentration in this study is similar to the results of Ozgen et al. in Italy (91.1 μg·m−3), and the PM pollution on the subway is the most serious compared to other public travel modes in the study by Ozgen et al. in Italy [40]. In particular, in Milan, a well-known European hot-spot for PM pollution, which may contribute to the high and similar PM exposure level with China during the SFTR. As shown in Figure 3c, the PM pollution in China is more and more serious, and in particular during the SFTR. In addition, the subway is the primary choice for commuters’ transit plans, which may do harm to the health of commuters and increase the exposure risk to COVID-19.
When commuting on the bus, the windows are all closed with the air conditioner working. The mean level of PM2.5 mass concentration is 118.9 μg·m−3 during the SFTR in this study. As shown in Figure 3d, the measured mean PM2.5 mass concentration during the SFTR is 1.6 times that of the regular time in India and the non-SFTR in China, 1.5 times that of the regular time in Europe, and 3.5 times that of the United States [9,19,23,24,25,28,34,38,39,43,44]. According to Yan et al., whether working or not, the air conditioner is not a critical factor influencing the exposure level of passengers on the bus (AC: 38.9 μg·m−3; Non-AC:38.4 μg·m−3) [19]. However, the study of Chan et al. issued in 2002 indicates that the exposure level of a Non-AC bus (145.0 μg·m−3) is 1.4 times that of an AC bus (101.0 μg·m−3) in Guangzhou [23]. In addition, the exposure level to PM2.5 mass concentration on the bus is similar to the results of Okokon et al.’s study, which was researched in Africa when commuting on the bus with the AC on and the windows closed (91.0 μg·m−3) [45]. When the bus windows were opened in Non-AC mode, higher exposure levels to PM2.5 mass concentration were found in Okokon et al.’s study (255.0 μg·m−3), which are 2.1 and 2.8 times that of this study and Okokon et al.’s study in AC mode [45], respectively. However, similar exposure levels were obtained in the WO mode bus (58.6 μg·m−3) and AC mode bus (54.4 μg·m−3) in the study of Qiu et al. [9]. Due to more serious ambient pollution in Africa compared to China, which contributes to more difference between the inside and outside of the bus.
In this study, when commuting in a car with WO and VC mode during the SFTR in 2020, the mean exposure level to PM2.5 mass concentration is 166.7 μg·m−3, which is 2.3 times that of Qiu et al.’s study [9]. However, when the car windows are all closed with FA, VC, or AC modes, a lower exposure level was found in Qiu et al.’s study, as shown in Figure 3e [9]. Furthermore, the mean exposure level of commuting in a car is similar to commuting via walking, which is 3, 4.3, 24, and 2.3 times that of Non-SFTR, UK, US, and India, respectively [9,23,24,25,28,34,41,43,44,45].
In summary, the exposure levels to PM2.5 on public transport are apparently higher than AQG. Short-term exposure to PM2.5 can trigger cardiovascular disease-related mortality and nonfatal events, which also can affect healthy human lymphocyte subsets [46,47]. Therefore, it is critical for commuters, for instance, to wear a facial mask to decrease the risk of pollutants exposure and avoid inhalation of PM into the lungs. In this study, workers and students were found to have higher exposure levels to PM mass concentrations when commuting via subway, bus, car, and walking during the SFTR. Although the average PM mass concentrations of commuting by car are the highest, the standard deviations (SDs) of them are the lowest. Car windows are opened during the non-AC mode, which can provide a relatively stable in-cabin microenvironment. The mean exposure level to particles is lowest in the CRH train, and following is the subway, bus, walking, and car. While the SDs of PM mass concentration are higher than the average, which is contributed to by the speed of the CRH train suddenly slowing down when approaching the destination, the pollutants in the ambient air will enter the cabin via AC system or by air pressure. Therefore, it is recommended that the passengers choose the better combination of CRH train and subway during the SFTR.
The time series of the CRH train1, CRH train2, subway, and the car started from the closing of the cabin door to reopening. When walking, the researchers are exposed to the open environment. According to Figure 4a,d time series PM mass concentrations in CRH trains are similar. When CRH trains approached destinations, about 100 times PM mass concentrations were monitored in the cabin microenvironment. The study of Adams et al. indicates that wind speed negatively affects the PM mass concentration [43].
As shown in Figure 4, the gaps of PM1, PM2.5, PM10 in CRH train1 and CRH train2 are the smallest when the cabin door is closed compared to other transportation modes. As shown in Figure 4b, the mean PM mass concentrations decrease when walking into the subway and preparing to check out under the ground from 13:52 to 13:54. After the safety check, the mean PM mass concentrations increased from 13:54 to 13:58, which might be affected by passengers’ activities. Figure 4b,c,e indicate that the exposure levels to particles via subway and bus are similar to commuting via walking during the SFTR. In addition, there are more fluctuations in the PM mass concentrations when commuting via subway, which may be contributed to by frequent stopping (9 stops) during operation. Figure 4e shows a little higher PM mass concentration from 17:01 to 17:04, which might be affected by the fresh air mode of the air conditioner and the number of passengers, which can introduce more particles into the bus. When the bus door opened, passengers aboard the bus experience a personal exposure level to PM mass concentrations similar to commuting via walking (Figure 4b) and car (Figure 4f).
The WHO recommends the use of PM2.5 as an indicator and a PM2.5/PM10 ratio of 0.5 (50%) is used to derive an appropriate PM10 guideline value [22]. This ratio of 0.5 is close to that typically observed in urban areas in developing countries and at the bottom of the range (0.5–0.8) found in urban areas in developed countries [22]. For the five transport modes, PM ratios consist of PM1/PM10 and PM2.5/PM10, as shown in Figure 5. Figure 5 indicates PM2.5/PM10 are all higher than the typical guideline value of the WHO, which shows more PM2.5 on public transportation in China. In this study, the PM1/PM10 and PM2.5/PM10 in CRH train1 are the highest, and they are 68.2% and 87.4%, respectively. These ratios on CRH trains and the subway are significantly higher than that of the other three transport modes, which indicates that there are more fine particles on CRH trains and the subway. When the cabin door is closed, the air conditioner exchanges cabin air for passengers. According to the study on traffic environmental pollution exposure of Yu Nu et al., the exposure levels of road traffic pollution sources PM2.5, and ultrafine particles (UFPs) were significantly correlated with the increase of the body’s oxidation marker malondialdehyde among taxi driver groups in Los Angeles [48]. The PM1/PM10 and PM2.5/PM10 on the bus are the lowest, and they are 48.2% and 80.8%, respectively. Although the ventilation on the bus is supported by an air conditioner, the air filtration performance is not good. Considering the health of passengers, the bus driver should change the air conditioning filter regularly. Overall, the PM2.5/PM10 in the microenvironment of the subway, bus, car, and walking are all higher than PM1/PM10, and the exposure levels to fine particles are most serious on CRH trains and the subway, which is similar to the study of Qiu et al. [9].

3.2. After the SFTR

Figure 6a is the radar chart of the mass concentration of PM1, PM2.5, and PM10 on different transportation from Nanjing to Xuzhou during the SFTR. Figure 6b is the return route from Xuzhou to Nanjing after the SFTR. The results show that the mass concentrations of PM1, PM2.5, and PM10 are reduced by varying degrees in different modes except for the CRH train1 after the SFTR. For instance, the PM2.5 mass concentration is reduced by 2.6, 2.2, and 5.9 times for walking, subway, and car, respectively. However, the PM1, PM2.5, and PM10 mass concentrations did not show much variation for the CRH train1 and CRH train2 during and after the SFTR. Although the strictest quarantine was removed and passengers returned, the factories in China have not yet been fully restored. Therefore, the exposure level is apparently lower than during the SFTR, and NASA stated: the industrial shutdown caused a significant improvement in global air quality affected by COVID-19.
The results of t-tests among different modes during and after the SFTR are shown in Table 5. There are no significant differences among the PM1, PM2.5, and PM10 mass concentrations on the CRH train1 and the CRH train2 during and after the SFTR (Sig > 0.05). However, there are significant differences among the PM1, PM2.5, and PM10 mass concentrations for the subway, car, and walking, during and after the SFTR (Sig < 0.05). For the long-haul CRH train (> 1 h), the exposure level to PM2.5 on the CRH train1 (21.77 μg m−3) is lower than the AQG. For the short-haul CRH train (< 20 min), the exposure level to PM2.5 in CRH train2 (36.41 μg·m−3) is similar to the AQG. As mentioned above, the CRH trains are always fully loaded during and after the SFTR, and it maintains high-speed operation (≤250 km/h) for the long term. The microenvironment of the CRH train is more stable than subway, car, and walking. Therefore, it is recommended for passengers to take the CRH train during the SFTR to lower the PM exposure level.

4. Conclusions

This study monitors personal exposure using different transport modes during and after the SFTR. Commuters have the lowest personal exposure to PM on the CRH trains. The PM2.5 mass concentration is reduced by 2.6, 2.2, and 5.9 times for walking, subway, and car, respectively, while there is no change on CRH train1 and CRH train2 during and after the SFTR. The results of t-tests indicate that personal exposure level is relatively stable in the CRH trains, and it is no more than the WHO guideline (AQG). Personal exposure to particles is similar to commuting by walking if the air conditioning filter is not replaced in time. Therefore, to reduce personal exposure for passengers, the CRH train is the best choice during the SFTR.

Author Contributions

Conceptualization, N.Y. and Y.Z.; methodology, N.Y.; software, Y.Z.; validation, N.Y., Y.Z. and M.Z.; formal analysis, Q.Y.; investigation, Y.Z.; resources, Y.Z.; data curation, Y.Z.; writing—original draft preparation, Y.Z.; writing—review and editing, N.Y.; visualization, Y.Z. and Q.Y.; supervision, N.Y.; project administration, N.Y.; funding acquisition, N.Y. and M.Z. All authors have read and agreed to the published version of the manuscript.

Funding

This research was funded by the Nanjing University of Aeronautics and Astronautics New Faculty Start-up fund, grant number 90YAH19018; this research was also funded by the Postgraduate Research and Practice Innovation Program of Jiangsu Province, grant number SJCX20_0067.

Data Availability Statement

Not applicable.

Acknowledgments

The authors sincerely thank Mengya Zhang and Quan Ye for helping with the field measurement and preliminary data processing. Special thanks should also be given to Nu Yu for providing the needed instruments during experiments.

Conflicts of Interest

The authors declare no conflict of interest.

References

  1. Weichenthal, S.; Van Ryswyk, K.; Kulka, R.; Sun, L.; Wallace, L.; Joseph, L. In-Vehicle Exposures to Particulate Air Pollution in Canadian Metropolitan Areas: The Urban Transportation Exposure Study. Environ. Sci. Technol. 2015, 49, 597–605. [Google Scholar] [CrossRef]
  2. Klepeis, N.E.; Nelson, W.C.; Ott, W.R.; Robinson, J.P.; Tsang, A.M.; Switzer, P.; Behar, J.V.; Hern, S.C.; Engelmann, W.H. The National Human Activity Pattern Survey (NHAPS): A resource for assessing exposure to environmental pollutants. J. Expo. Sci. Environ. Epidemiol. 2001, 11, 231–252. [Google Scholar] [CrossRef] [PubMed] [Green Version]
  3. Bi, X.; Luo, W. Analysis of travel characteristics and transportation improvement strategies of small and medium-sized cities. Technol. Econ. Area Commun. 2018, 20, 28–31. [Google Scholar] [CrossRef]
  4. Asadi, S.; Bouvier, N.; Wexler, A.S.; Ristenpart, W.D. The coronavirus pandemic and aerosols: Does COVID-19 transmit via expiratory particles? Aerosol Sci. Technol. 2020, 54, 635–638. [Google Scholar] [CrossRef] [PubMed] [Green Version]
  5. Prather, K.A.; Wang, C.C.; Schooley, R.T. Reducing transmission of SARS-CoV-2. Science 2020, 368, 1422–1424. [Google Scholar] [CrossRef] [PubMed]
  6. Morawska, L.; Milton, D.K. It Is Time to Address Airborne Transmission of Coronavirus Disease 2019 (COVID-19). Clin. Infect. Dis. 2020, 71, 2311–2313. [Google Scholar] [CrossRef]
  7. Morawska, L.; Tang, J.W.; Bahnfleth, W.; Bluyssen, P.M.; Boerstra, A.; Buonanno, G.; Cao, J.; Dancer, S.; Floto, A.; Franchimon, F.; et al. How can airborne transmission of COVID-19 indoors be minimised? Environ. Int. 2020, 142, 105832. [Google Scholar] [CrossRef]
  8. Ahlawat, A.; Wiedensohler, A.; Mishra, S.K. An Overview on the Role of Relative Humidity in Airborne Transmission of SARS-CoV-2 in Indoor Environments. Aerosol Air Qual. Res. 2020, 20, 1856–1861. [Google Scholar] [CrossRef]
  9. Qiu, Z.; Song, J.; Xu, X.; Luo, Y.; Zhao, R.; Zhou, W.; Xiang, B.; Hao, Y. Commuter exposure to particulate matter for different transportation modes in Xi’an, China. Atmos. Pollut. Res. 2017, 8, 940–948. [Google Scholar] [CrossRef]
  10. Goel, V.; Mishra, S.K.; Ahlawat, A.; Sharma, C.; Vijayan, N.; Radhakrishnan, S.R.; Dimri, A.P.; Kotnala, R.K. Effect of Reduced Traffic Density on Characteristics of Particulate Matter Over Delhi. Curr. Sci. 2018, 115, 315–319. [Google Scholar] [CrossRef]
  11. Yang, T.; Zhang, P.; Xu, B.; Xiong, J. Predicting VOC emissions from materials in vehicle cabins: Determination of the key parameters and the influence of environmental factors. Int. J. Heat Mass Transf. 2017, 110, 671–679. [Google Scholar] [CrossRef]
  12. Maji, K.J.; Arora, M.; Dikshit, A.K. Burden of disease attributed to ambient PM2.5 and PM10 exposure in 190 cities in China. Environ. Sci. Pollut. Res. 2017, 24, 11559–11572. [Google Scholar] [CrossRef] [PubMed]
  13. Tan, S.H.; Roth, M.; Velasco, E. Particle exposure and inhaled dose during commuting in Singapore. Atmos. Environ. 2017, 170, 245–258. [Google Scholar] [CrossRef]
  14. Zhao, J.; Bo, L.; Gong, C.; Cheng, P.; Kan, H.; Xie, Y.; Song, W. Preliminary study to explore gene-PM2.5 interactive effects on respiratory system in traffic policemen. Int. J. Occup. Med. Environ. Health 2015, 28, 971–983. [Google Scholar] [CrossRef] [PubMed]
  15. Zhao, J.; Gao, Z.; Tian, Z.; Xie, Y.; Xin, F.; Jiang, R.; Kan, H.; Song, W. The biological effects of individual-level PM2.5 exposure on systemic immunity and inflammatory response in traffic policemen. Occup. Environ. Med. 2013, 70, 426–431. [Google Scholar] [CrossRef]
  16. Xu, H.; Song, N.; Ji, G.; Shi, L.; Zhang, Q.; Guo, M. Personal exposure and health risk assessment of carbonyls in family cars and public transports—a comparative study in Nanjing, China. Environ. Sci. Pollut. Res. 2017, 24, 26111–26119. [Google Scholar] [CrossRef]
  17. Kam, W.; Delfino, R.J.; Schauer, J.J.; Sioutas, C. A comparative assessment of PM2.5 exposures in light-rail, subway, freeway, and surface street environments in Los Angeles and estimated lung cancer risk. Environ. Sci. Process. Impacts 2012, 15, 234–243. [Google Scholar] [CrossRef] [PubMed]
  18. Gómez-Perales, J.; Colvile, R.; Nieuwenhuijsen, M.; Fernández-Bremauntz, A.; Gutiérrez-Avedoy, V.; Páramo-Figueroa, V.; Blanco-Jiménez, S.; Bueno-López, E.; Mandujano, F.; Bernabé-Cabanillas, R.; et al. Commuters’ exposure to PM2.5, CO, and benzene in public transport in the metropolitan area of Mexico City. Atmos. Environ. 2004, 38, 1219–1229. [Google Scholar] [CrossRef]
  19. Yan, C.; Zheng, M.; Yang, Q.; Zhang, Q.; Qiu, X.; Zhang, Y.; Fu, H.; Li, X.; Zhu, T.; Zhu, Y. Commuter exposure to particulate matter and particle-bound PAHs in three transportation modes in Beijing, China. Environ. Pollut. 2015, 204, 199–206. [Google Scholar] [CrossRef]
  20. Ruttens, D.; Verleden, S.E.; Bijnens, E.M.; Winckelmans, E.; Gottlieb, J.; Warnecke, G.; Meloni, F.; Morosini, M.; Van Der Bij, W.; Verschuuren, E.A.; et al. An association of particulate air pollution and traffic exposure with mortality after lung transplantation in Europe. Eur. Respir. J. 2016, 49, 1600484. [Google Scholar] [CrossRef]
  21. Television, C.C. Nanjing Railway Station Sent 210,000 Passengers on the First Day of Spring Festival Transport. Available online: https://haokan.baidu.com/v?pd=wisenatural&vid=13281730742068025235 (accessed on 11 January 2021).
  22. World Health Organization. Air Quality Guidelines: Global Update 2005: Particulate Matter, Ozone, Nitrogen Dioxide, and Sulfur Dioxide; World Health Organization: Geneva, Switzerland, 2006; pp. 277–279. [Google Scholar]
  23. Chan, L.; Lau, W.; Zou, S.; Cao, Z.; Lai, S. Exposure level of carbon monoxide and respirable suspended particulate in public transportation modes while commuting in urban area of Guangzhou, China. Atmos. Environ. 2002, 36, 5831–5840. [Google Scholar] [CrossRef]
  24. Onat, B.; Stakeeva, B. Personal exposure of commuters in public transport to PM2.5 and fine particle counts. Atmos. Pollut. Res. 2013, 4, 329–335. [Google Scholar] [CrossRef] [Green Version]
  25. Wu, D.-L.; Lin, M.; Chan, C.-Y.; Li, W.-Z.; Tao, J.; Li, Y.-P.; Sang, X.-F.; Bu, C.-W. Influences of Commuting Mode, Air Conditioning Mode and Meteorological Parameters on Fine Particle (PM2.5) Exposure Levels in Traffic Microenvironments. Aerosol Air Qual. Res. 2013, 13, 709–720. [Google Scholar] [CrossRef] [Green Version]
  26. Kumar, P.; Patton, A.; Durant, J.L.; Frey, H.C. A review of factors impacting exposure to PM2.5, ultrafine particles and black carbon in Asian transport microenvironments. Atmos. Environ. 2018, 187, 301–316. [Google Scholar] [CrossRef]
  27. Kumar, P.; Rivas, I.; Singh, A.P.; Ganesh, V.J.; Ananya, M.; Frey, H.C. Dynamics of coarse and fine particle exposure in transport microenvironments. npj Clim. Atmos. Sci. 2018, 1, 11. [Google Scholar] [CrossRef]
  28. Suárez, L.; Mesías, S.; Iglesias, V.; Silva, C.; Cáceres, D.D.; Ruiz-Rudolph, P. Personal exposure to particulate matter in commuters using different transport modes (bus, bicycle, car and subway) in an assigned route in downtown Santiago, Chile. Environ. Sci. Process. Impacts 2014, 16, 1309–1317. [Google Scholar] [CrossRef] [PubMed]
  29. Andersen, M.H.G.; Johannesson, S.; Fonseca, A.S.; Clausen, P.A.; Saber, A.T.; Roursgaard, M.; Loeschner, K.; Koponen, I.K.; Loft, S.; Vogel, U.; et al. Exposure to Air Pollution inside Electric and Diesel-Powered Passenger Trains. Environ. Sci. Technol. 2019, 53, 4579–4587. [Google Scholar] [CrossRef] [PubMed] [Green Version]
  30. Cha, Y.; Tu, M.; Elmgren, M.; Silvergren, S.; Olofsson, U. Factors affecting the exposure of passengers, service staff and train drivers inside trains to airborne particles. Environ. Res. 2018, 166, 16–24. [Google Scholar] [CrossRef]
  31. Cha, Y.; Abbasi, S.; Olofsson, U. Indoor and outdoor measurement of airborne particulates on a commuter train running partly in tunnels. Proc. Inst. Mech. Eng. Part F J. Rail Rapid Transit 2016, 232, 3–13. [Google Scholar] [CrossRef]
  32. Chaney, R.A.; Sloan, C.D.; Cooper, V.C.; Robinson, D.R.; Hendrickson, N.R.; Mccord, T.A.; Johnston, J.D. Personal exposure to fine particulate air pollution while commuting: An examination of six transport modes on an urban arterial roadway. PLoS ONE 2017, 12, e0188053. [Google Scholar] [CrossRef]
  33. Kam, W.; Cheung, K.; Daher, N.; Sioutas, C. Particulate matter (PM) concentrations in underground and ground-level rail systems of the Los Angeles Metro. Atmos. Environ. 2011, 45, 1506–1516. [Google Scholar] [CrossRef]
  34. Ham, W.; Vijayan, A.; Schulte, N.; Herner, J.D. Commuter exposure to PM2.5, BC, and UFP in six common transport microenvironments in Sacramento, California. Atmos. Environ. 2017, 167, 335–345. [Google Scholar] [CrossRef]
  35. Nyhan, M.; McNabola, A.; Misstear, B. Comparison of particulate matter dose and acute heart rate variability response in cyclists, pedestrians, bus and train passengers. Sci. Total. Environ. 2014, 468-469, 821–831. [Google Scholar] [CrossRef]
  36. Knibbs, L.; De Dear, R.J. Exposure to ultrafine particles and PM2.5 in four Sydney transport modes. Atmos. Environ. 2010, 44, 3224–3227. [Google Scholar] [CrossRef] [Green Version]
  37. Li, T.-T.; Bai, Y.-H.; Liu, Z.-R.; Li, J.-L. In-train air quality assessment of the railway transit system in Beijing: A note. Transp. Res. Part D Transp. Environ. 2007, 12, 64–67. [Google Scholar] [CrossRef]
  38. Chan, L.; Lau, W.; Lee, S.-C.; Chan, C. Commuter exposure to particulate matter in public transportation modes in Hong Kong. Atmos. Environ. 2002, 36, 3363–3373. [Google Scholar] [CrossRef]
  39. Shen, J.; Gao, Z. Commuter exposure to particulate matters in four common transportation modes in Nanjing. Build. Environ. 2019, 156, 156–170. [Google Scholar] [CrossRef]
  40. Ozgen, M.S.; Ripamonti, G.; Malandrini, A.; Ragettli, M.S.; Lonati, G. Particle number and mass exposure concentrations by commuter transport modes in Milan, Italy. AIMS Environ. Sci. 2016, 3, 168–184. [Google Scholar] [CrossRef] [Green Version]
  41. Goel, R.; Gani, S.; Guttikunda, S.; Wilson, D.; Tiwari, G. On-road PM2.5 pollution exposure in multiple transport microenvironments in Delhi. Atmos. Environ. 2015, 123, 129–138. [Google Scholar] [CrossRef]
  42. Li, Z.; Che, W.; Frey, H.C.; Lau, A.K.; Lin, C. Characterization of PM2.5 exposure concentration in transport microenvironments using portable monitors. Environ. Pollut. 2017, 228, 433–442. [Google Scholar] [CrossRef]
  43. Adams, H.; Nieuwenhuijsen, M.; Colvile, R. Determinants of fine particle (PM2.5) personal exposure levels in transport microenvironments, London, UK. Atmos. Environ. 2001, 35, 4557–4566. [Google Scholar] [CrossRef]
  44. Kolluru, S.S.R.; Patra, A.K.; Kumar, P. Determinants of commuter exposure to PM2.5 and CO during long-haul journeys on national highways in India. Atmos. Pollut. Res. 2019, 10, 1031–1041. [Google Scholar] [CrossRef]
  45. Okokon, E.O.; Taimisto, P.; Turunen, A.W.; Amoda, O.A.; Fasasi, A.E.; Adeyemi, L.G.; Juutilainen, J.; Lanki, T. Particulate air pollution and noise: Assessing commuter exposure in Africa’s most populous city. J. Transp. Health 2018, 9, 150–160. [Google Scholar] [CrossRef]
  46. Brook, R.D.; Rajagopalan, S.; Pope, I.C.A.; Brook, J.R.; Bhatnagar, A.; Diez-Roux, A.V.; Holguin, F.; Hong, Y.; Luepker, R.V.; Mittleman, M.; et al. Particulate Matter Air Pollution and Cardiovascular Disease. Circulation 2010, 121, 2331–2378. [Google Scholar] [CrossRef] [PubMed] [Green Version]
  47. Yuan, Z.H.; Hou, Y.J.; Zhao, C.; Li, Y. Dynamicly Observing Influence of Ambient PM2.5 on Human Lymphocyte Subsets. Appl. Mech. Mater. 2014, 508, 286–289. [Google Scholar] [CrossRef]
  48. Yu, N.; Shu, S.; Lin, Y.; She, J.; Ip, H.S.S.; Qiu, X.; Zhu, Y. High efficiency cabin air filter in vehicles reduces drivers’ roadway particulate matter exposures and associated lipid peroxidation. PLoS ONE 2017, 12, e0188498. [Google Scholar] [CrossRef] [PubMed]
Figure 1. The selected route for different transport modes.
Processes 09 01133 g001
Figure 2. The box plot of PM mass concentrations during the SFTR: (a) PM1; (b) PM2.5; (c) PM10.
Processes 09 01133 g002aProcesses 09 01133 g002b
Figure 3. The PM2.5 mass concentration of different transportations in the literature: (a) Train; (b) Walk; (c) Subway; (d) Bus; (e) Car. Rh stands for rush hours. Non-Rh stands for non-rush hours. WC + VC stands for all windows and vents being closed. AC + WC stands for all windows closed, air condition on recirculation. WC + FA stands for all windows closed, AC system on fresh air mode.
Processes 09 01133 g003aProcesses 09 01133 g003bProcesses 09 01133 g003c
Figure 4. The PM mass concentrations in time series for different transport modes during the SFTR: (a) CRH train1; (b) Walk; (c) Subway; (d) CRH train2; (e) Bus; (f) Car.
Processes 09 01133 g004
Figure 5. The PM ratios with PM10.
Processes 09 01133 g005
Figure 6. PM mass concentration in different transport modes: (a) during the SFTR; (b) after the SFTR.
Processes 09 01133 g006
Table 1. The segments of travel routes during and after the SFTR.
Transportation ModesNO.1
(19 January 2020)
NO.2
(21 January 2020)
NO.3
(21 January 2020)
NO.4
(6 May 2020)
CRH train 1Nanjing-Xuzhou--Xuzhou East-Nanjing South
WalkXuzhou-Xuzhou Subway--Jiulonghu-Xincheng Hospital
SubwayXuzhou Subway-Xuzhou EastXuzhou East-Pengcheng SquarePengcheng Square-Xuzhou EastNanjing South-Jiulonghu
CRH train 2Xuzhou East-Guanyin AirportGuanyin Airport-Xuzhou EastXuzhou East-Guanyin AirportGuanyin Airport-Xuzhou East
BusGuanyin Airport-Terminal 2-Guanyin Airport-Terminal 2-
CarTerminal 2-HomeHome-Guanyin AirportGuanyin Airport-HomeHome-Guanyin Airport
Table 2. The information summary about travel routes.
Transportation ModesVentilation TypeRoutesDuration (min)Distance (km)Note
CRH train 1ACNO.1150283.5-
NO.4222283.5-
WalkOpen airNO.1240.48 lanes in both directions
NO.490.2Single direction
SubwayACNO.1279.0-
NO.2309.0-
NO.3339.0-
NO.4208.9-
CRH train 2ACNO.11635.3-
NO.21535.3-
NO.31635.3-
NO.41735.3-
BusACNO.192.02 lanes in both directions
NO.392.0
CarNon-AC+WONO.1159.26 lanes in both directions
Non-AC+WONO.2209.2
Non-AC+WONO.3239.2
ACNO.4349.2
Table 3. Instrument information.
InstrumentParameters CollectedIntervalRangeAccuracy
BoHu model BH1-B3PM1/PM2.5/PM101 min0–1999 μg·m−3±15%
RH0–100%±5%
T−20–99 °C±2 °C
Table 4. Average temperature (T) and relative humidity (RH).
RouteNO.1NO.2NO.3NO.4
T/°CRH/%T/°CRH/%T/°CRH/%T/°CRH/%
CRH train 123.041.0----25.747.9
Walk20.931.5----26.248.7
Subway20.138.613.552.115.353.725.950.5
CRH train 222.136.313.664.419.544.125.150.3
Bus21.235.8--17.354.1--
Car19.043.712.952.018.049.225.348.6
Table 5. The results of t-tests among different modes during and after the SFTR.
PM1PM2.5PM10
tdfSigtdfSigtdfSig
CRH train1−0.19194.250.850.15194.980.880.12204.450.91
CRH train20.3617.460.720.4517.330.660.2218.210.83
Subway13.46450.0012.81450.0010.78450.00
Car21.4640.240.0042.6845.470.0034.1345.940.00
Walking8.40420.0017.8729.390.0016.6130.640.00
Publisher’s Note: MDPI stays neutral with regard to jurisdictional claims in published maps and institutional affiliations.

