Article

Optimization Study of Guide Vanes for the Intake Fan-Duct Connection Using CFD

1
Departamento de Ingeniería en Minas, Facultad de Ingeniería, Universidad de Santiago, Santiago 9160000, Chile
2
Bharti School of Engineering, Laurentian University, Sudbury, ON P3E 2C6, Canada
*
Author to whom correspondence should be addressed.
Processes 2021, 9(9), 1555; https://doi.org/10.3390/pr9091555
Submission received: 30 June 2021 / Revised: 20 August 2021 / Accepted: 23 August 2021 / Published: 31 August 2021
(This article belongs to the Special Issue Applied Computational Fluid Dynamics (CFD))

Abstract

:
The connection between an intake fan and a ventilation shaft must be designed in such a way that it minimizes the energy waste due to singularity losses. As a result, the questions of which radius of curvature to use and if guide vanes have to be included need to be answered. In that case, the variables such as the number, upstream and downstream penetration length, radius of curvature, and width of the vanes, need to be defined. Although this work is oriented to mine ventilation, these questions are usually valid in other engineering applications as well. The objective of this study is to define the previously mentioned variables to determine the optimal design combination for the radius/diameter relationship (r/D). Computational fluid dynamics was used to determine the shock loss factor of seven elbow curvature ratios for a 3 m diameter duct and fan, with and without guide vanes to estimate the best performing configuration and, therefore, to maximize the fan airflow volume. The methodology used consisted of initially developing models in 2D geometries, to optimize the meshing and the CPU use, and studying separately the number of vanes, upstream and downstream penetration, radius of curvature, and width of the vanes for each curvature ratio (r/D). Then, the best-performing variable combinations for each curvature ratio were selected to be simulated and studied with the 3D geometries. The application of the guide vane designs for three-dimensional simulated geometries is presented, first without and then with guide vanes, including the shock loss factors obtained. The methodology and obtained results allowed quantifying the energy savings and to reduce the CFD simulations steps required to optimize the design of the elbow and guide vanes. The results obtained cannot be used with elbows in exhaust fans, because fluid dynamics phenomena are different.

1. Introduction

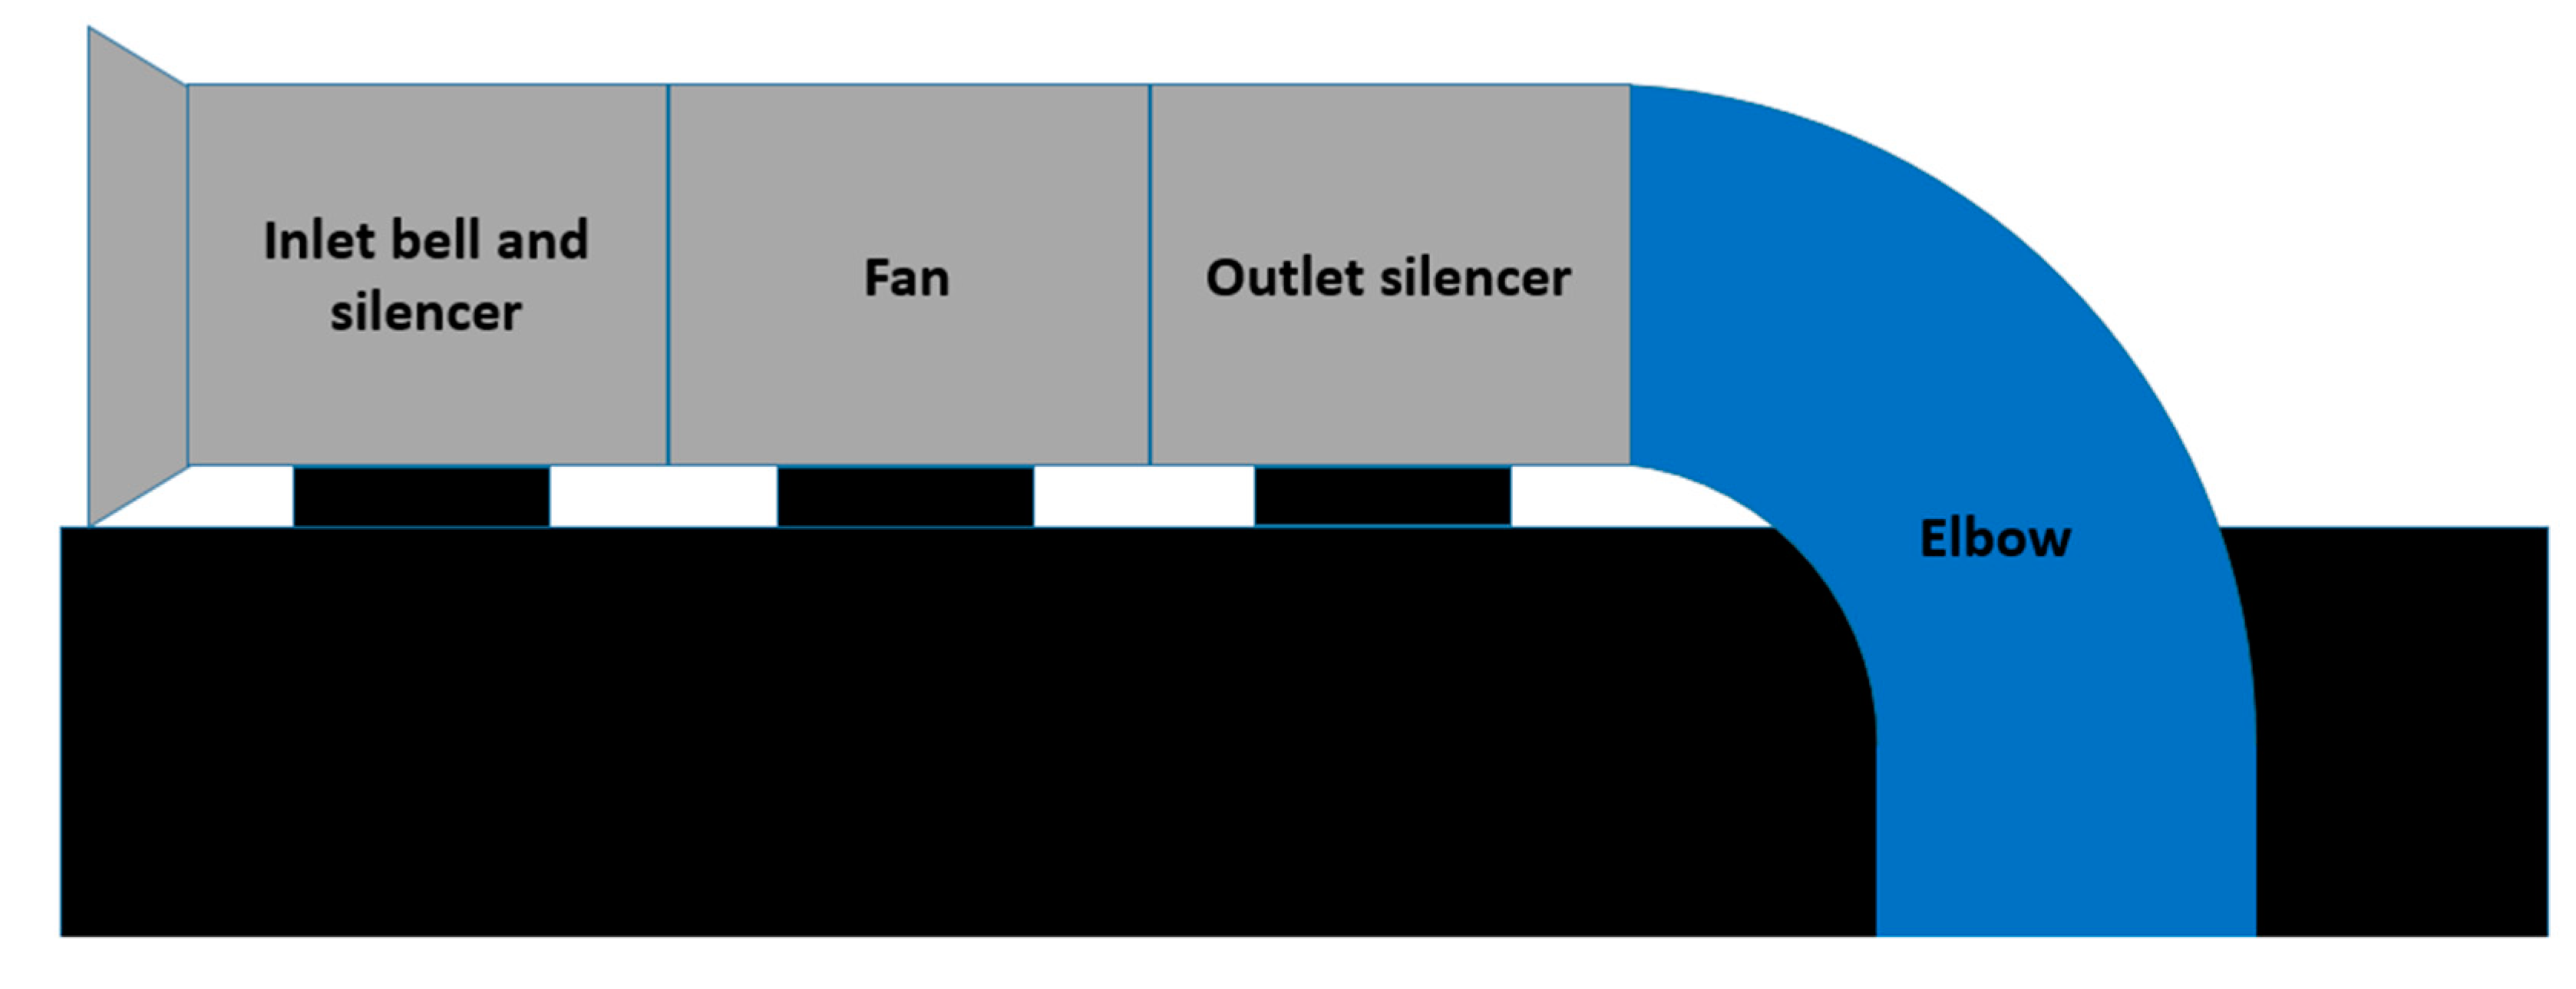
In underground excavations or tunnels for mining or other applications, fans are commonly installed horizontally on the surface. An elbow connection is necessary to supply the airflow volume underground through the intake raise or shaft. In addition, the layout is usually constrained to a short distance between the fan and the shaft, due to the available footprint or the need to minimize capital expenditure, which produces significant shock losses resulting in energy waste. The elbow generates high turbulence due to boundary layer detachment because of a high-pressure gradient. Therefore, the performance of main fans located on the surface is limited by the elbow pressure loss because there are no more openings to help distribute the airflow in parallel and reduce the pressure loss. This pressure loss directly increases the network resistance experienced by the intake fan. In addition, turbulent flows at a 90° elbow can cause strong flow separation near the inner wall, which affects the performance of the duct system and can also cause strong flow-induced vibrations and noise [1]. This effect is not observed in fans installed vertically in shafts or ventilation raises.
Several authors have studied the effects generated in the flow that passes through an elbow, either for different Reynolds numbers, with different types of fluid, dimensions, pipe roughness, velocity, radius-diameter ratio (r/D), or different angles of curvature, among others. Modi and Jayanti 2004 [2] indicates that steep angle elbows severely distort downstream flow up to 10 diameters or more and with significant pressure losses. Johnson 2009 [
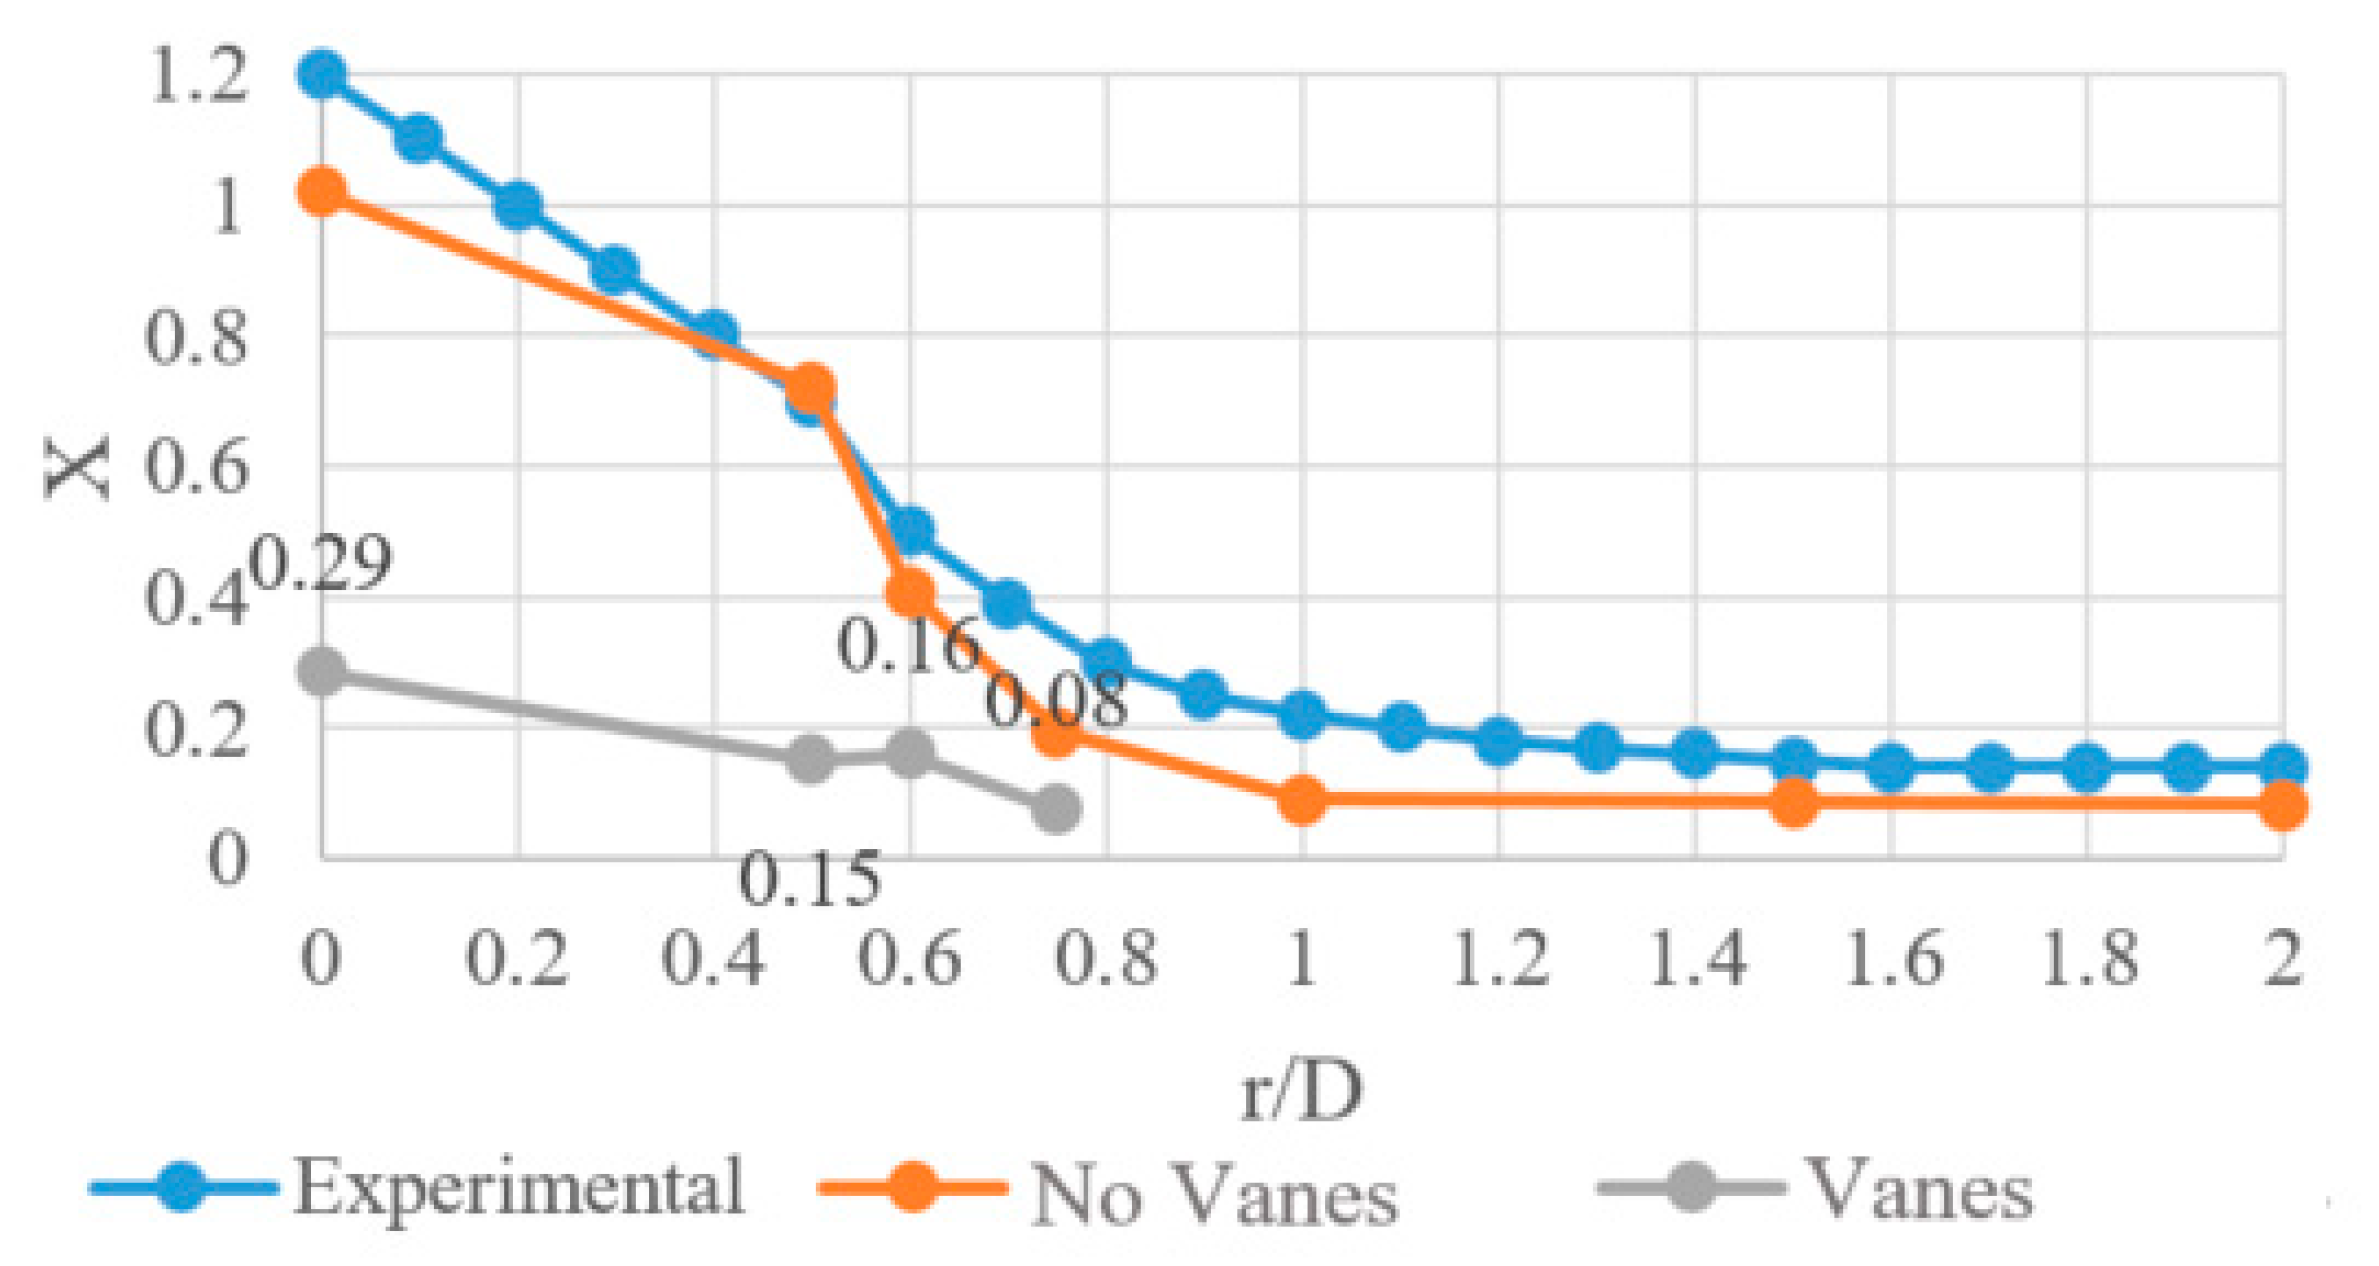
3] points out that when airflow changes direction in a duct that lacks guide vanes, the duct walls must absorb the sudden impact of the air to redirect the airflow in the desired direction. Several authors have developed specific studies that guide the design, which have been considered for the development of this research work. The state of the art presents various studies and applications, many of them concluding in the reduction of the shock factor or pressure loss coefficient through the incorporation of guide vanes [2,3,4,5,6,7,8,9]. Within these studies, and by Enayet et al. 1982 [10], some incorporate various designs of guide vanes and, therefore, have evaluated the benefits of both the reduction of the shock factor (X) and the distribution of the flow downstream of the elbow, oriented to obtain a less turbulent flow. Johnson 2009 [3] indicate that guide vanes help airflow make a smoother and more gradual change of direction, resulting in less impact and, therefore, less force transfer. In addition, he emphasizes that an elbow with guide vanes can be 800% more efficient than the same elbow without guide vanes. Kotb and Ward-Smith 1988 [6] point out that the main method to improve the performance of steep curves is to introduce one or more guide vanes, due to two main reasons: the first is to improve the shape of the velocity profile emerging from the elbow, reducing the peak velocities tending to an average; the second is to reduce the pressure gradient at the elbow between high and low pressures to tend to an average. Regarding the latter, its use is recommended only in elbows with high radio of curvature, as it implies the introduction of additional surfaces that can increase speed gradients and shear forces, and by default increases the friction factor.
On the other hand, Miller 1990 [8] points out that by using guide vanes the shock factor of acute bends can be reduced to that of circular bends with less losses. Ideally, the guide vanes should be closer to the inner elbow, but due to the thickness of the guide vanes, they could increase resistance considerably, causing a blockage on the inside of the elbow. Guide vanes within elbows are only justified if the radius ratio is less than unity and if the guide vanes are thin, which must be less than 5% of the cross-sectional area. For radius ratios greater than 0.7, a single deflector should be used, which could achieve a 50% loss reduction.
Regarding the aerodynamic design of guide vanes, Sahlin and Johansson 1991 [11] designed a battery of guide vanes with the aim of minimizing the pressure drop at a 90° elbow, within a wind tunnel (Re 40,000). The designed shape of the guide vane allowed the velocity distribution on the suction side to replicate that of the chosen airfoil, obtaining a crash coefficient with five guide vanes that was as low as 0.036 (Re 154,000), which is approximately one-fifth of what is generally reported with traditional guide vanes. Similarly, Lindgren et al. 1998 [7] experimentally and numerically studied the design of guide vanes for use in an area-expanding elbow. Experimental results demonstrated that properly designed guide vanes produce very low losses and retain flow quality, even at fairly large expansion rates.
Liou et al. 2001 [9] studied the effect of the number of guide vanes in a 60° three-dimensional elbow, with a rectangular cross-section that served as a combustion chamber, where he used Laser-Doppler to measure the components of longitudinal, radial, and angular velocity. The main conclusions of Liou et al. 2001 [9] were that the flow separation gradient decreases with increasing radius of curvature and that the separated flow region along the inner wall decreases with an increasing number of guide vanes. For the case studied, it also concluded that the use of three guide vanes results in a friction loss almost as large as the case without guide vanes, among others.
Modi and Jayanti 2004 [2] indicated that the use of guide vanes considerably alleviates the flow distortion since the velocity profile is uniformly improved, but it induces friction losses that, in gradual elbows, the reduction of the shock loss can generate even more friction loss. Furthermore, the use of multiple guide vanes follows the law of diminishing returns with an increasing number of guide vanes and with an increasing angle of curvature. Finally, he noticed that the loss coefficient is practically independent of the scale, but the roughness of the wall is not.
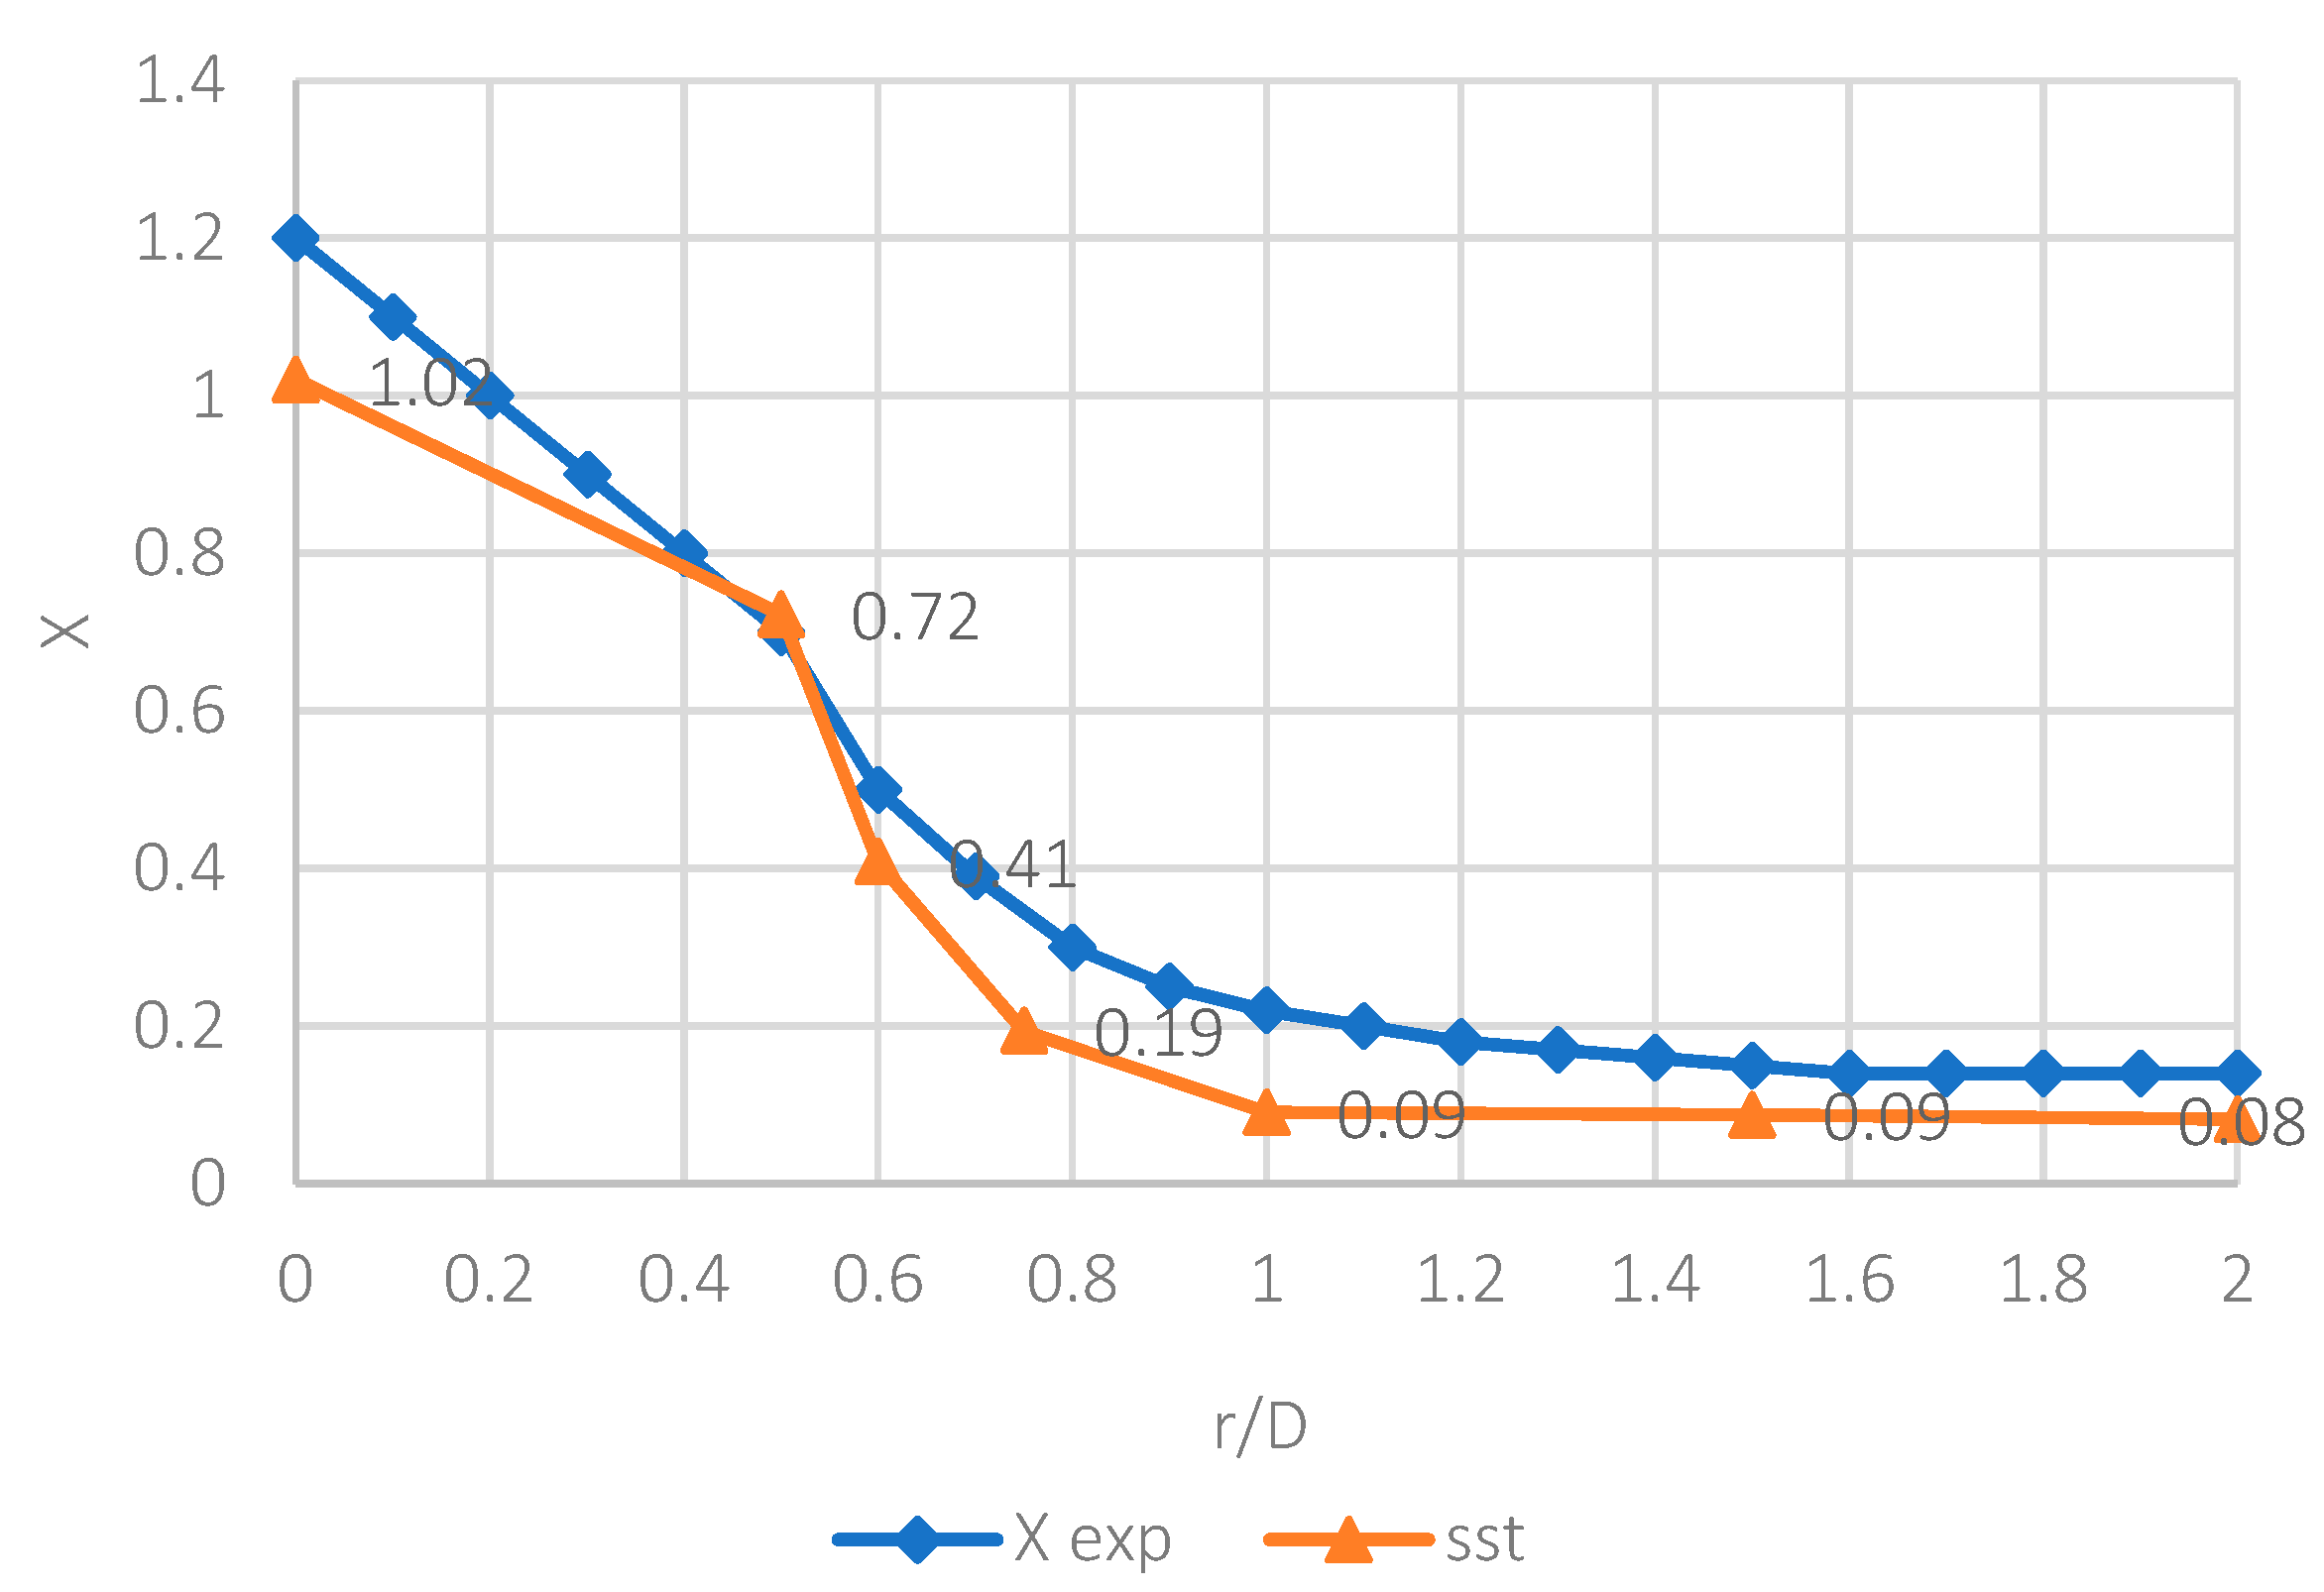
In general, existing turbulent models accurately predict friction effects in numerical simulations, but these models are not accurate enough to accurately predict turbulent phenomena due to separation [12]. In this regard, Crawford and Cunningham 2003 [12], using CFD modeling, carried out a series of simulations in pipe elbows with r/D of 0.65, 2.5, and 10, respectively, in order to determine the precision of the numerical models and they were compared with experimental results. In particular, four turbulence models were analyzed: the standard k-ε model, the achievable k-ε model, the k-ω model, and a Reynolds Stress model (RSM). The RSM was found to have the best fit, producing accurate pressure loss data for curves with r/D values of 2.5 and 10, however, for the tighter curve with r/D of 0.65, the predictions were significantly worse due to the presence of flow separation, stronger pressure gradients, and high flow line curvatures of 24% to 33%. Kumar and Nandi 2017 [13] studied, using the k-ε turbulence model, the flow separation and velocity distribution for incompressible turbulent flow through a 90° elbow of r/D = 1 due to the effect of the installed guide vane and determined that the velocity distribution profile was normalized, with very good results.
From the revised literature, it is determined that these works study separately the pressure losses (and turbulence generated) in relation to the radius of curvature and other design variables such as the number of guide vanes, the thickness of the guide vanes, and aerodynamics. From the previous studies, specific patterns are obtained, which establish the main parameters to be considered in the design of the connection elbow between the fan and the ventilation raise, to which the penetration of the guide vanes upstream and downstream of the elbow center must be added. Using the advantages of CFD modeling, the present work develops a combination of these variables to find the optimized design for the connection elbow for a mine ventilation application and different radius of curvature/diameter (r/D) ratios.
In other application areas, such as water supply networks, Vlase et al. 2019 [14] highlighted the use of finite element analysis to study the behavior of high-density polyethylene pipes by comparing the stress fields. This is an important consideration in terms of utilization and availability of the ventilation network, as the elbow in the mining case is expected to be in service for the life of the mine in most cases. As a result, any elbow failure could result in reduced development and production rates and associated financial losses.

2. Methodology

In order to evaluate the head loss generated by the raise or shaft connection, it is necessary to evaluate the loss due to shock resulting from turbulence. The shock factors are obtained using the ANSYS Fluent computational simulation software, which also allows the visualization of the flow behavior inside the geometries under study. First, the main variables influencing shock losses were identified and selected based on a literature review; then, two-dimensional cases are developed with these variables which are studied to find the best vane designs. Subsequently, these designs are applied altogether to the three-dimensional geometries, allowing an integral and closer representation of reality. Finally, the shock loss value of each case is obtained.

3. Mathematical Model and Geometries

3.1. Physical–Mathematical Model

Guide vanes in an elbow generate a variation of the velocity and pressure distributions in its interior, so this variation is characterized as it is carried out in an elbow without guide vanes but with a modified value, which is based on the internal singular loss in the elbow.
Singular losses are all those that occur when the airflow changes direction or the duct changes in cross-section. These losses are calculated as a ratio of the dynamic air pressure calculated at the singular point, according to Equation (1):
H s = k s · ρ · V 2 2 ,
where Hs is the shock loss pressure (Pa), ks is the shock loss coefficient, V is the average velocity (m/s), and ρ is the fluid density (kg/m3).
In mine ventilation, Equation (1) should be expressed in relation to Equation (2), according to [15]:
H x = X · ρ · V 2 2 ,
where X corresponds to the dimensionless shock factor (equivalent to shock coefficient). In the case of the main ventilation, the singular losses or shock losses are usually smaller than those caused by friction, although they can reach large values in those mines with a design that makes the passage of air difficult. Shock losses can usually range from 10% to 30% of the total energy loss [16].

3.2. Studied Geometries

A shaft connection usually consists of a large diameter steel pipe, formed mainly of a straight horizontal cylindrical section including two silencers with a fan in between them, followed by an elbow that connects the main fan to the shaft. This connection allows the change of direction towards the interior of the intake shaft. This geometry can also be used for exhaust fans, but its analysis is not part of this study. The 1.5 r/D ratio is recommended for this type of singularity [3], but it leads to a higher consumption of steel and surface infrastructure. Figure 1 shows the components of the fan and shaft connection.
Seven types of simplified shaft connections have been considered as presented in Figure 2. The diameter of the duct and shaft is 3 m. Each of them has a different r/D ratio, but they all share the same dimensions for the horizontal straight section and vertical section (which represents the intake shaft), corresponding to 4 and 25 diameters, respectively, to match the dimensions to ensure the development of the flow and the restoration of the pressure gradient [8].
Figure 3a shows the graphic representation of the r/D ratio, where “r” represents the radius of curvature of the elbow, measured from the center line, and “d” represents the diameter of the elbow. It should be noted that the angle θ for all cases studied is 90°. The detailed view of the elbows with their dimensions is shown in Figure 3b–h.

3.3. Mesh, Turbulence and Set Up

The meshing technique is mainly Multizone with dominant hexahedra in straight sections. For elbows, the applied meshing technique is Patch Conforming with dominant tetrahedra. For all geometry, a boundary layer mesh has been applied in 10% of the diameter (30 cm). With these characteristics, a greater quantity of elements is obtained. For the cases applied with three-dimensional guide vanes, a boundary layer mesh is added in the design, improving the simulation of roughness and geometry changes.
A brief study of meshing independence was conducted for two-dimension geometries in a short section. The meshing tested considers a 0.5 elbow ratio (r/D), with five mesh densities shown in Figure 4 for 2D geometry. This graph considers three turbulence models: k-ԑ Realizable, Shear Stress Transport (SST), and Reynolds Stress Model (RSM), which were considered from previous studies related to shock losses.
Figure 4 shows that the values are stabilized with mesh 3 (66,327 elements), since using mesh 5 reduces the value of X by 8%, 3%, and 3% for RSM, SST, and k-ԑ models, respectively, but increasing by 12.6 × the number of elements. Therefore, an increase in mesh density is not justified, obtaining an appropriate size of 0.072 m (mesh 3), but with a refined mesh for boundary layer zones.
Figure 5 shows the fit between the experimental and the simulated 3D SST turbulence model of a circular section elbow. Differences in the simulation for SST, k-ε Realizable, and RSM allow discarding the k-ε Realizable model. Then, knowing that the RSM model usually has convergence difficulties and demands that the simulation be unsteady, the Shear Stress Transport model is chosen, which can be used in a steady simulation with similar results. For 3D models, Table 1 shows the number of elements for each r/D ratio for no vane geometry, and Figure 6 shows the number of elements with and without guide vanes for 3D models.
In the beginning, the simulations were tested unsteady and compared with steady results, with no significant differences except for low Reynolds numbers (>10,000). As a result, steady conditions were used, because solver time was a critical variable for more than 220 different cases that needed to be simulated, which included 2D and 3D cases. The solver was based on isothermal and incompressible conditions. Boundary conditions included a velocity-inlet and pressure-outlet (atmospheric conditions at the outlet); 7 and 12 m/s inlet velocity were tested, which corresponds to the minimum and maximum values used in the mine ventilation shafts, with 2,230,088 and 3,823,008 Reynolds number, respectively. Computations were solved with the SIMPLE scheme for the pressure-velocity coupling and second-order upstream discretization for pressure, momentum, turbulence kinetic energy, specific dissipation rate, intermittency, and momentum thickness Re. Residuals were set to 10−5.

4. Results

The study of the guide vane is separated into three stages, where each one delivers a result that is used as an input in the next step. These are: number of vanes, upstream or downstream penetration, and aerodynamic design (thickness). Geometries in two dimensions are evaluated with different vane designs and the shock factors for each one are quantified, which are compared and used to select the design selected for the next step of the study.

4.1. Number of Guide Vanes

Six variations of the elbows were considered, with different r/D ratios of 0, 0.5, 0.6, 0.75, 1.0, 1.5, and 2.0, respectively. The results are shown in Figure 7, where it is determined that for the r/D geometry equal to 0 the optimum number of vanes is 6. However, according to Modi and Jayanti 2004 [2] and Miller 1990 [8], having more guide vanes could add losses and reduce X in the order of 0.06 per additional vane. In the case of a close to the horizontal slope as presented between 4, 5, and 6 vanes, the overall optimum number of the vane is 4. For r/D geometry equal to 0.5, the optimal number is 3; adding one more only reduces by 0.03. In the same way, for r/D equal to 0.6 the optimum is 2 and for r/D equal to 0.75 it is 1. For the r/D ratios of 1.0, 1.5, and 2.0 no improvement is observed by adding guide vanes.

4.2. Upstream and Downstream Penetration

The penetration considers the distance or projection beyond the vane elbow limit of 90°, as presented in Figure 8. Table 2 shows upstream (a) and downstream (b) penetration in the flow in meters, according to Figure 8. Nine cases to analyze optimal guide vane penetration are considered, for the four types of shaft connection r/D that are convenient to implement with ratios 0, 0.5, 0.6, and 0.75.
The results of this step are presented in Figure 9, where it is determined that, for the r/D geometries equal to 0 and 0.5, the optimal penetration is 0.5 m in “a” and in “b” (case 7 from Table 2), and for r/D equal to 0.6 and 0.75, the optimum penetration is 0 m in “a” and in “b” (case 0 from Table 2). Case 0 sets 0 upstream or downstream penetration. Three groups of cases are considered, with an incremental penetration rate of 0.5 m as compared to the previous case as follows:
  • The first group consists of generating penetration “a” (cases 1, 2, and 3)
  • The second group consists of generating penetration “b” (cases 4, 5, and 6)
  • The third group consists of generating penetration “a” and “b” (cases 7, 8, and 9).
Figure 9 summarizes the simulated results, showing the shock factors for each case in the geometries studied. This provides important information since it is observed that in the r/D geometry equal to 0, both for groups 1 and 2 there is an increase in losses as penetration “a” and “b” increase, respectively. This is due to the instabilities generated by the downstream flow, with guide vanes only upstream (a) or only downstream (b); however, when both guide vanes extended homogeneously to both sides, the flow stabilizes much more, as happens with group 3 (cases 7, 8, and 9). Something similar happens for the r/D ratios equal to 0.5, 0.6, or 0.75, although in the latter the non-extension of the guide blade is even lower. Almost all cases agree that the optimal penetration of the guide vane should be minimal (0.5 m). This is due to the fact that the friction surfaces increase generates an increase in total losses, although they reduce the turbulence, as discussed by [2,8].

4.3. Aerodynamic Design

Parameters Rc and W are presented in Figure 10, where Rc corresponds to the curvature radius of the vane leading edge (mm), in terms of aerodynamics. W corresponds to the width of the vane (mm). Fourteen variations of the case with optimal penetration have been considered, for the four types of shaft connection analyzed with r/D ratios 0, 0.5, 0.6, and 0.75. Parameters Rc and W are detailed in Table 3. Results are shown in Figure 11, where the minimum value is the best. It is determined that for r/D ratio to 0 and 0.5, the optimal aerodynamic design is 15 mm for Rc and W, for r/D ratio to 0.6 it is 7.5 mm and 15 mm for Rc and W, respectively, and for r/D ratio to 0.75 it is 5 mm for Rc and W. Figure 12 shows the velocity profile for the aerodynamic design to the selected 4 r/W ratio best prior cases (0, 0.5, 0.6, and 0.75).
A selection is obtained from the previous results. Table 4 shows a summary of the elbow with vane guide study that provides the dimensions of the best guide vane designs, which are applied to three-dimensional geometries. The baffle designs obtained are easily scalable to ducts of different sections and shapes that present a turbulent flow, see Table 5.

5. Applied Cases

The application of the guide vane designs for three-dimensional simulated geometries is presented, first without and then with guide vanes, analyzing the shock factors obtained.

5.1. Elbow without Guide Vanes

Results of the fan-shaft connection geometries (elbows) without guide vanes are presented as base cases, which indicate the behavior of the flow at different r/D ratios for the most common cases applied. Figure 13, Figure 14 and Figure 15 show that if the r/D ratio increases—the pressure and velocity gradients and turbulence kinetic energy downstream of the elbow decreases—the flow becomes more stable, velocities are more homogeneous, and the stalling zone is reduced to a minimum d/D ratio of 2.0. The pressure gradient shows a similar behavior.

5.2. Elbow with Guide Vanes

This section shows the results of the fan-shaft connection geometries (elbows) with guide vanes for elbows r/D = 0, 0.5, 0.6, and 0.75 and the optimized cases. From Figure 16, Figure 17 and Figure 18, it can be concluded that the inclusion of the best guide vane designs allows the flow velocity distribution to be comparable among the optimized geometries. All of them have a small trail of lower speed downstream of each vane and a small area of low speeds due to the separation of the flow from the inner wall. The highest static pressures at each elbow are generated at the concave surface of each vane and to a lesser extent downstream at the outer wall of each elbow.

5.3. Comparison and Discussion

When comparing Figure 13 and Figure 15, it can be inferred that the inclusion of guide vanes reduces the flow separation zone by approximately 50% for all the cases. In addition, it reduces the maximum speed at the same 0 r/D ratio by 18.7%. The low-speed zone on the outer wall of the elbow is reduced. In the same way, when comparing Figure 14 and Figure 16 it can be observed that the inclusion of guide vanes homogenize and reduce the static pressures downstream of the elbow, reducing the width range of the static pressure at the elbow by at least 5% as compared to an r/D equal to 0. Additionally, when comparing Figure 15 and Figure 18, it can be inferred that the inclusion of guide vanes reduces the area of turbulence by approximately 50%, except in the case of the elbow with an r/D ratio equal to 0.75, in which only a low reduction in magnitude is observed. Among the cases studied, there is a reduction in maximum turbulence of 61%.
Figure 19 shows the shock factors for the experimental (blue line) and CFD simulated (orange line) base cases and the optimized cases (grey line), where the head loss reductions in the application of the guide vanes for the r/D ratio to 0, 0.5, 0.6, and 0.75 are 79%, 72%, 60%, and 61%, respectively. One must also consider the difference or error between the experimental data and CFD results (blue and orange lines), due to the turbulence model being constrained to reach a more exact value. Therefore, it should be considered only as an approximation to the final solution.

6. Final Considerations

Figure 20 presents each elbow curvature radius and its extension, to show how the infrastructure and the civil work required, that enables each geometry, can change significantly according to the selected curvature radios. This parameter must be carefully selected based on the shaft location, the quality of the rock, the available space for building, the fan operational point, and the investment costs. The objective is to minimize the elbow pressure loss to maximize the airflow volume injected into the mine, taking care to avoid the stall point of the fan curve. Defining the most adequate configuration of the guide vanes will require all these parameters to be considered.
Once the most adequate curvature radius is selected, it is recommended to perform a CFD study specific for the defined case, as the methodology presented in the previous sections is an approximation of the optimum with a level of uncertainty in the results.

7. Conclusions

A study of guide vanes for the intake fan-duct connection has been presented. The literature review shows the main variables studied that influence the elbow losses at 90°, among which are the radius of curvature (r/D), the incorporation of guide vanes, the number of vanes, the reduction of turbulence, its influence on friction losses, and aerodynamics. Using the advantages of CFD modeling, the study collects all these variables, combines and integrates them into a single study that allows selecting the optimized characteristics according to the radius of curvature of choice. Close to 220 different cases were solved to involve all different variables.
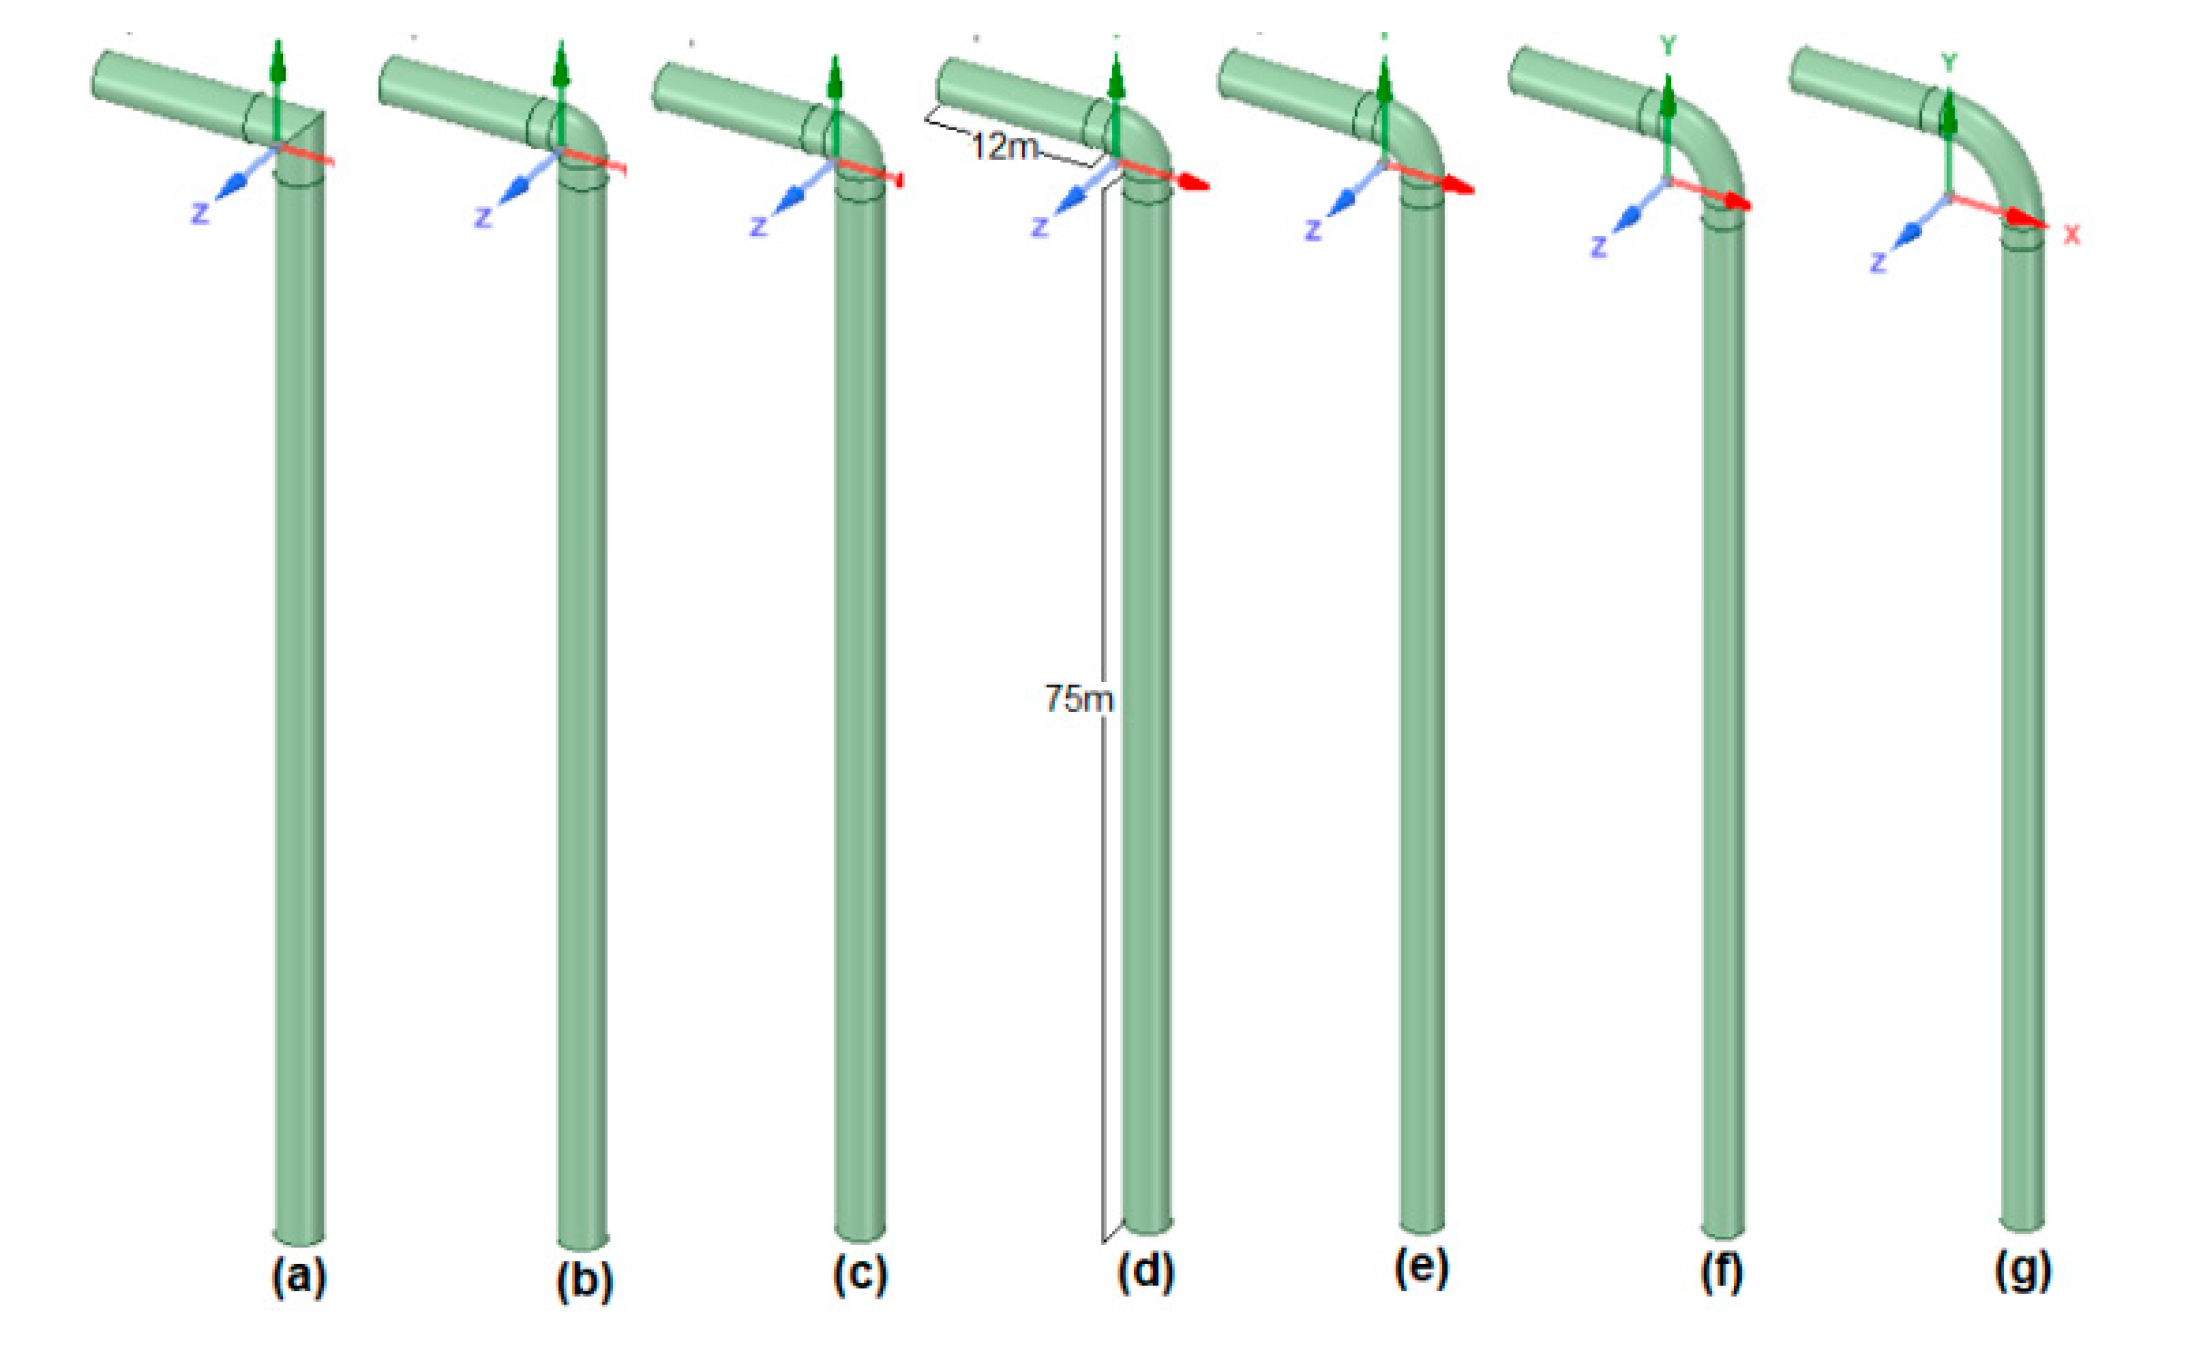
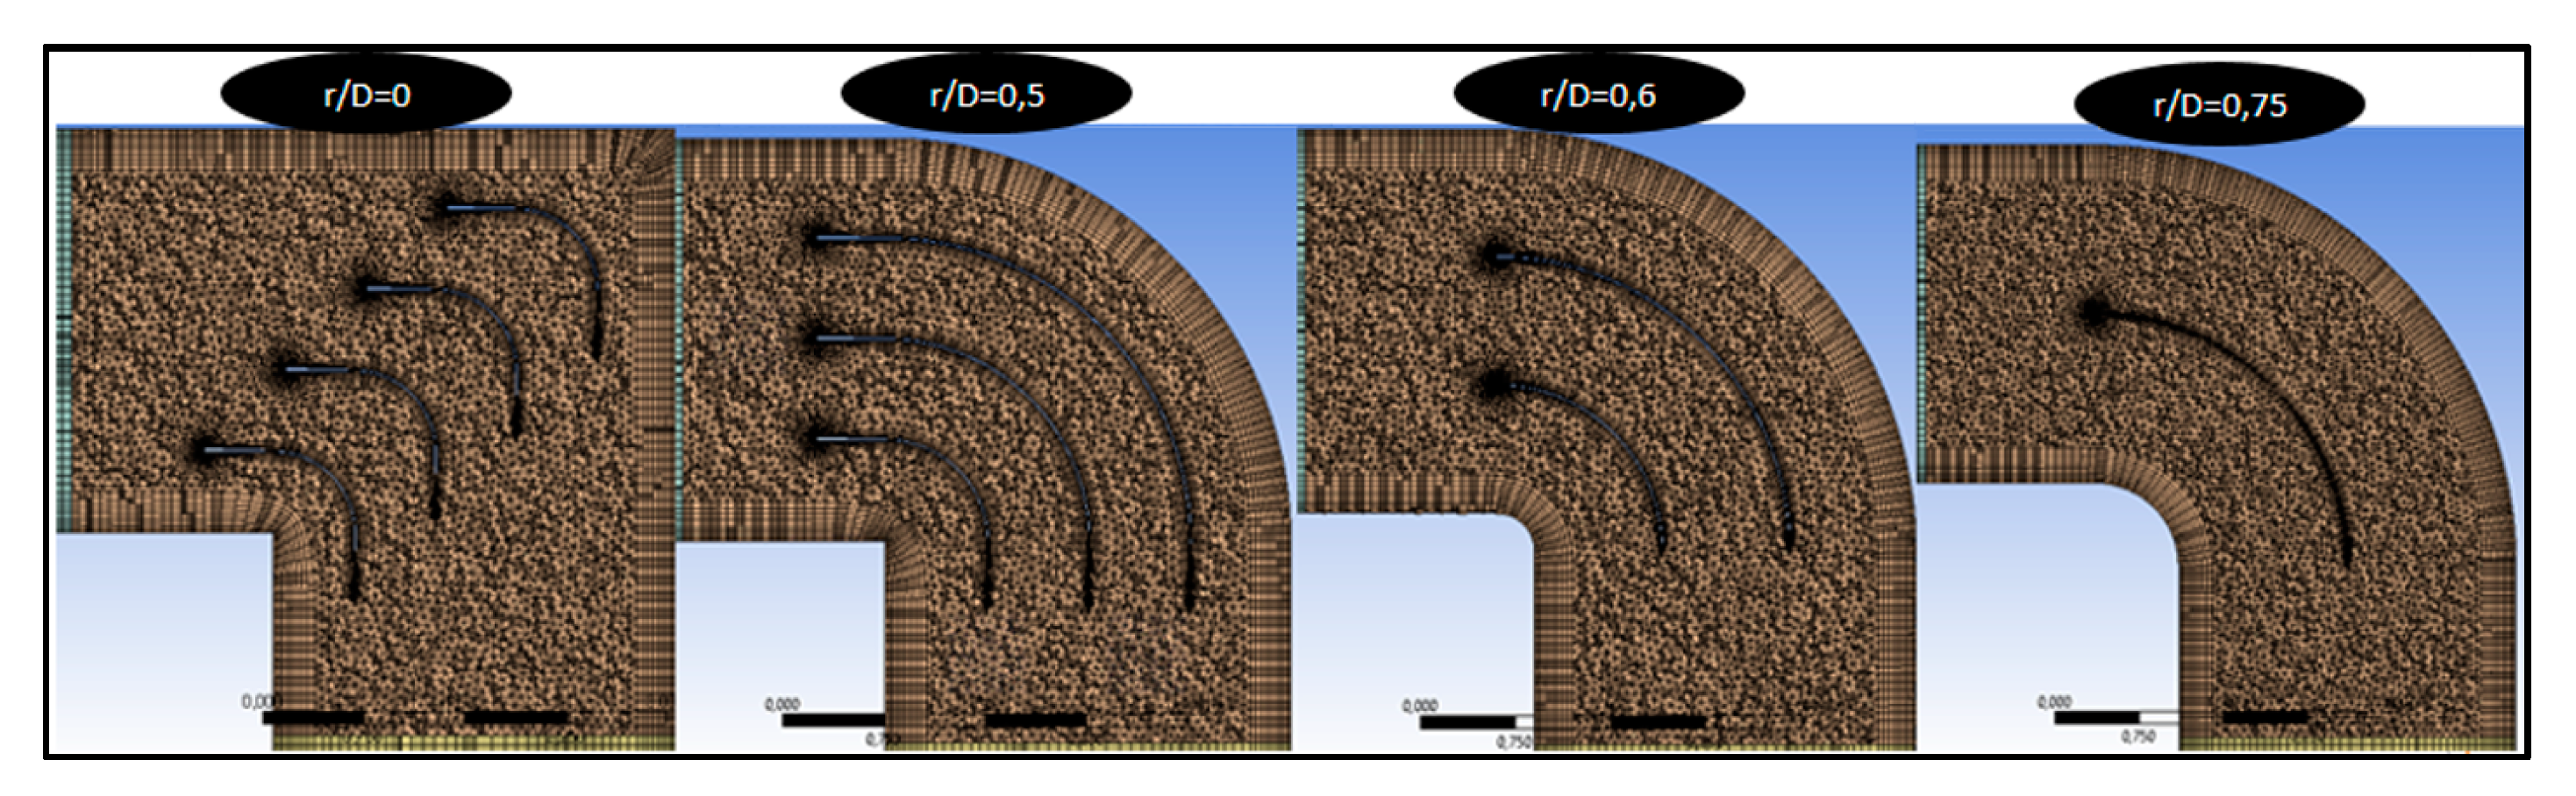
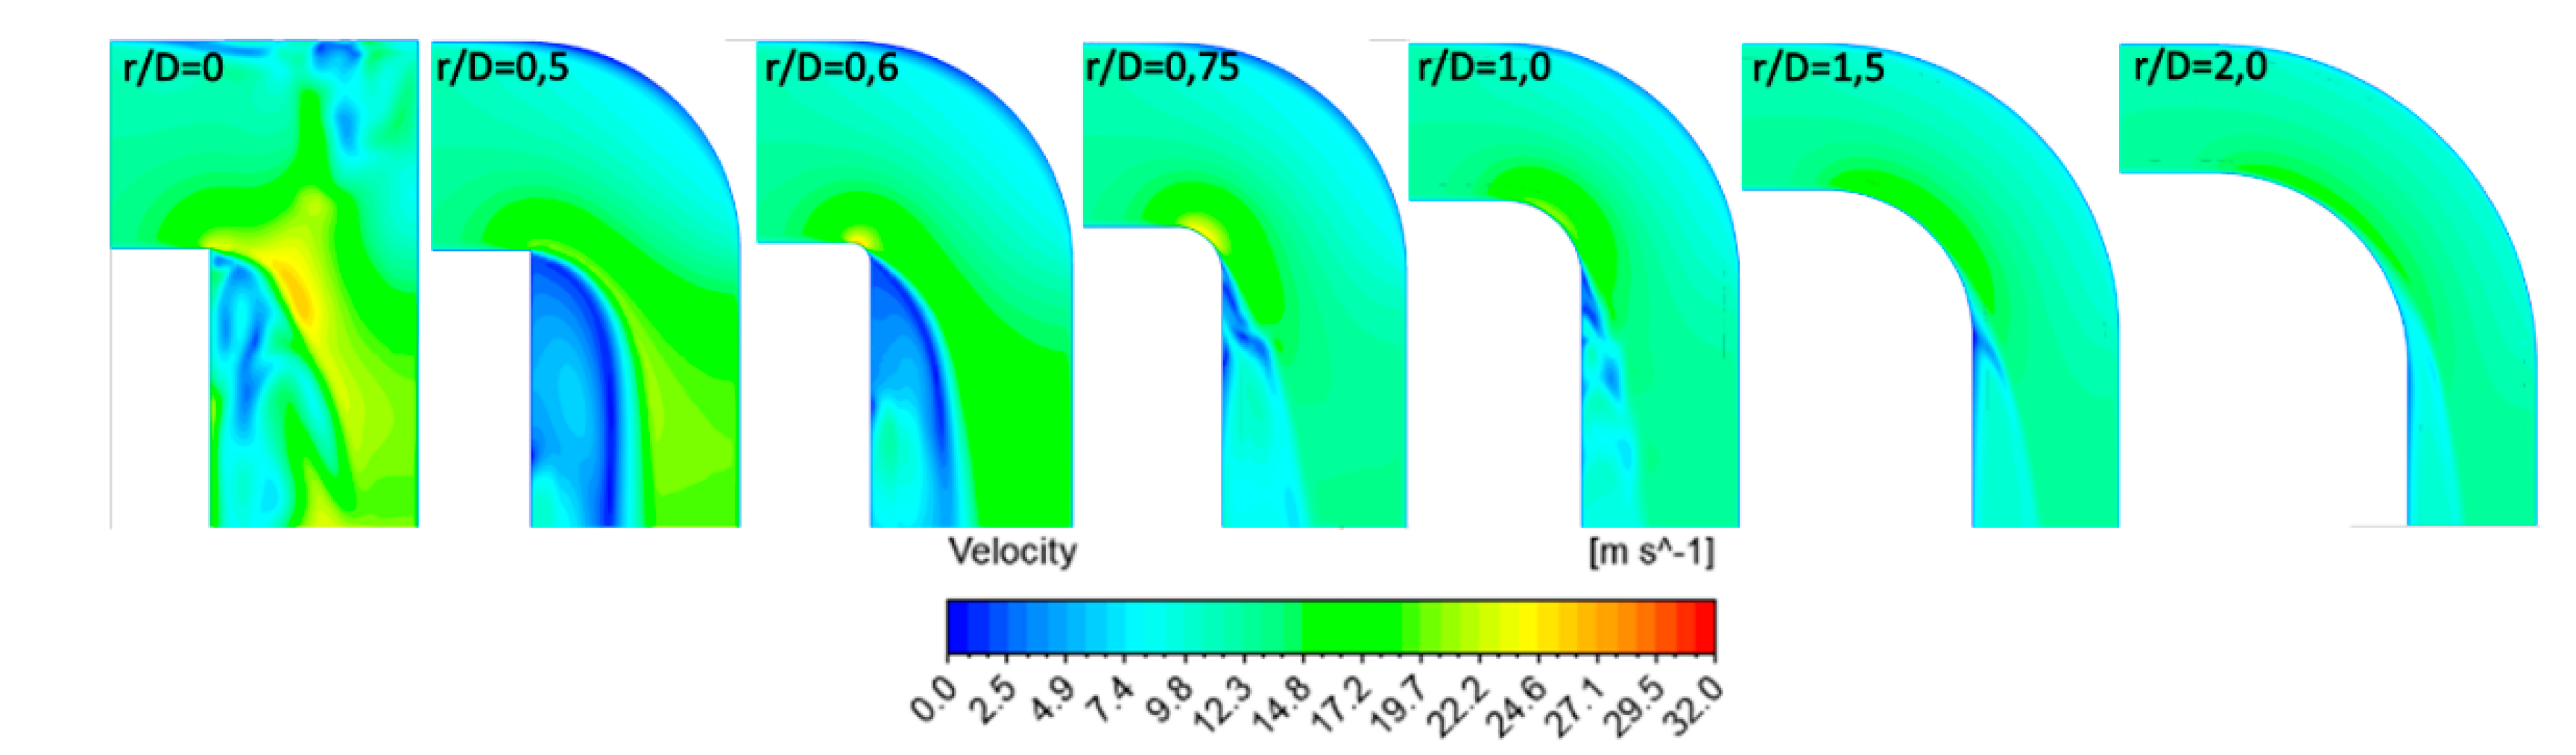
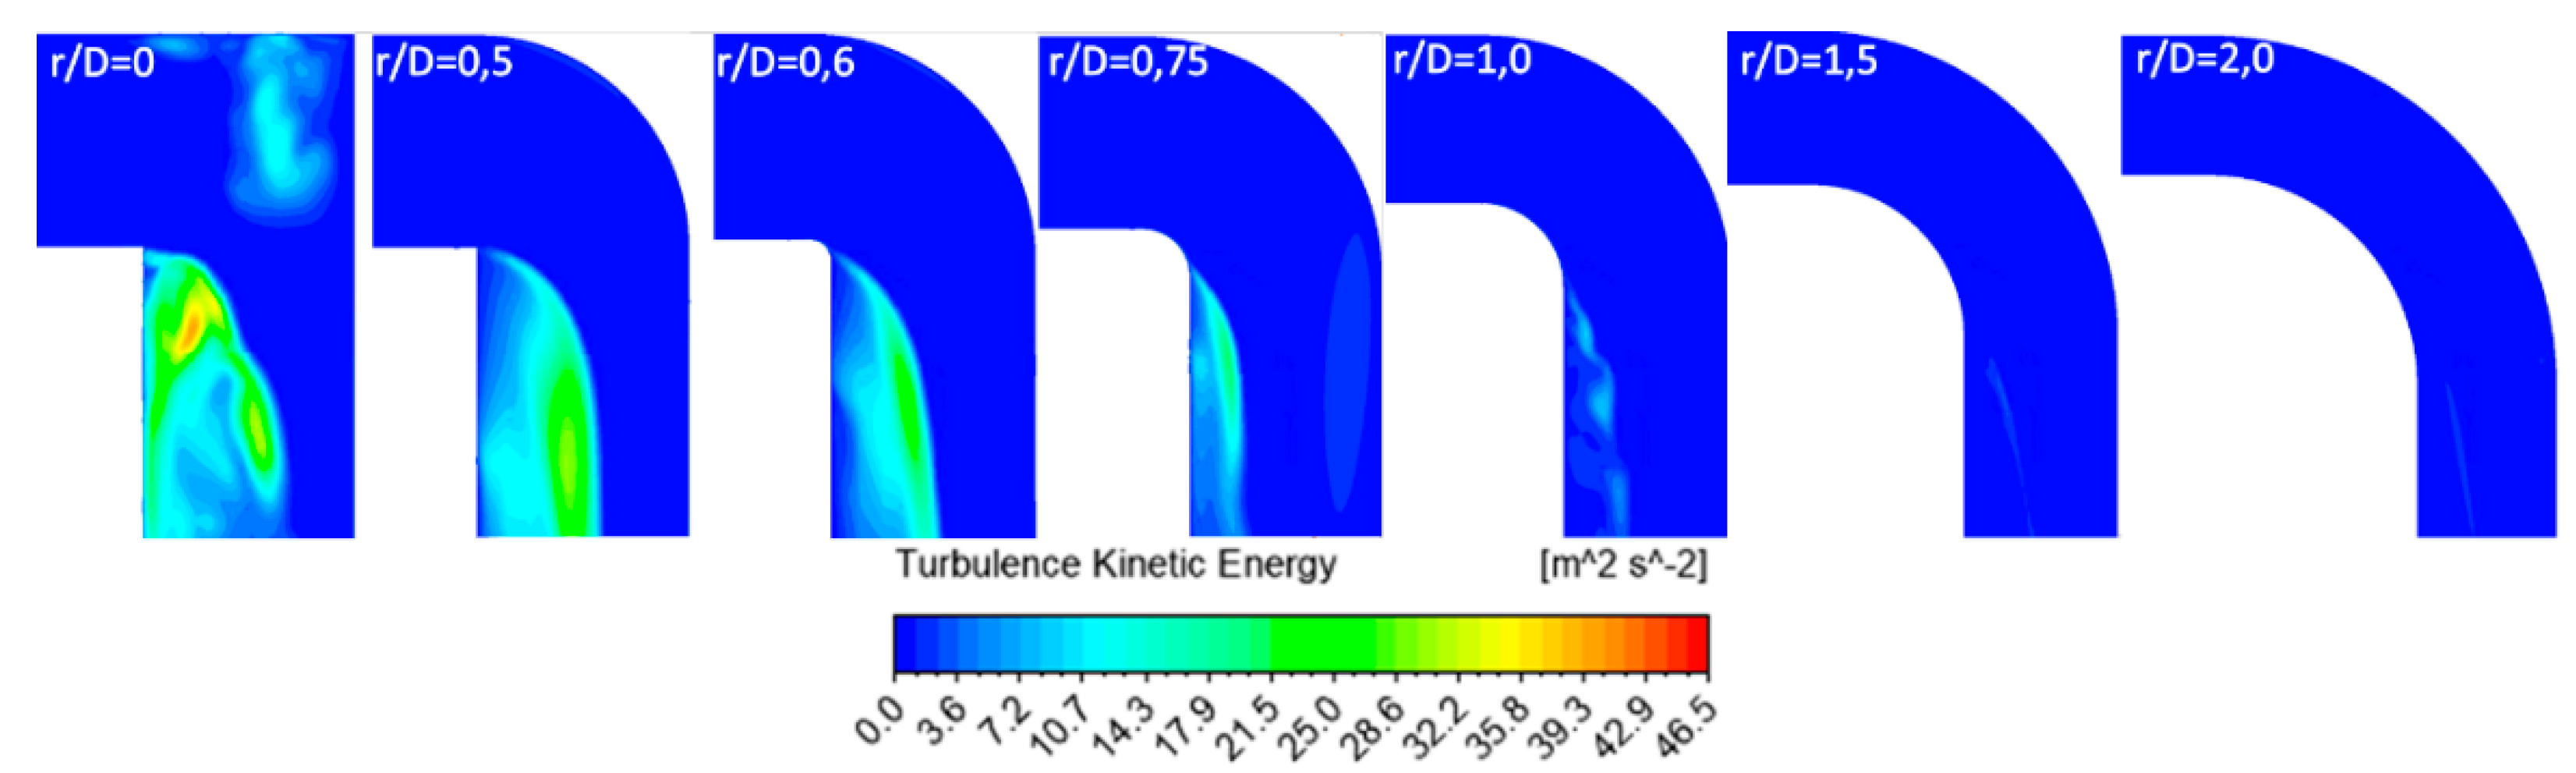
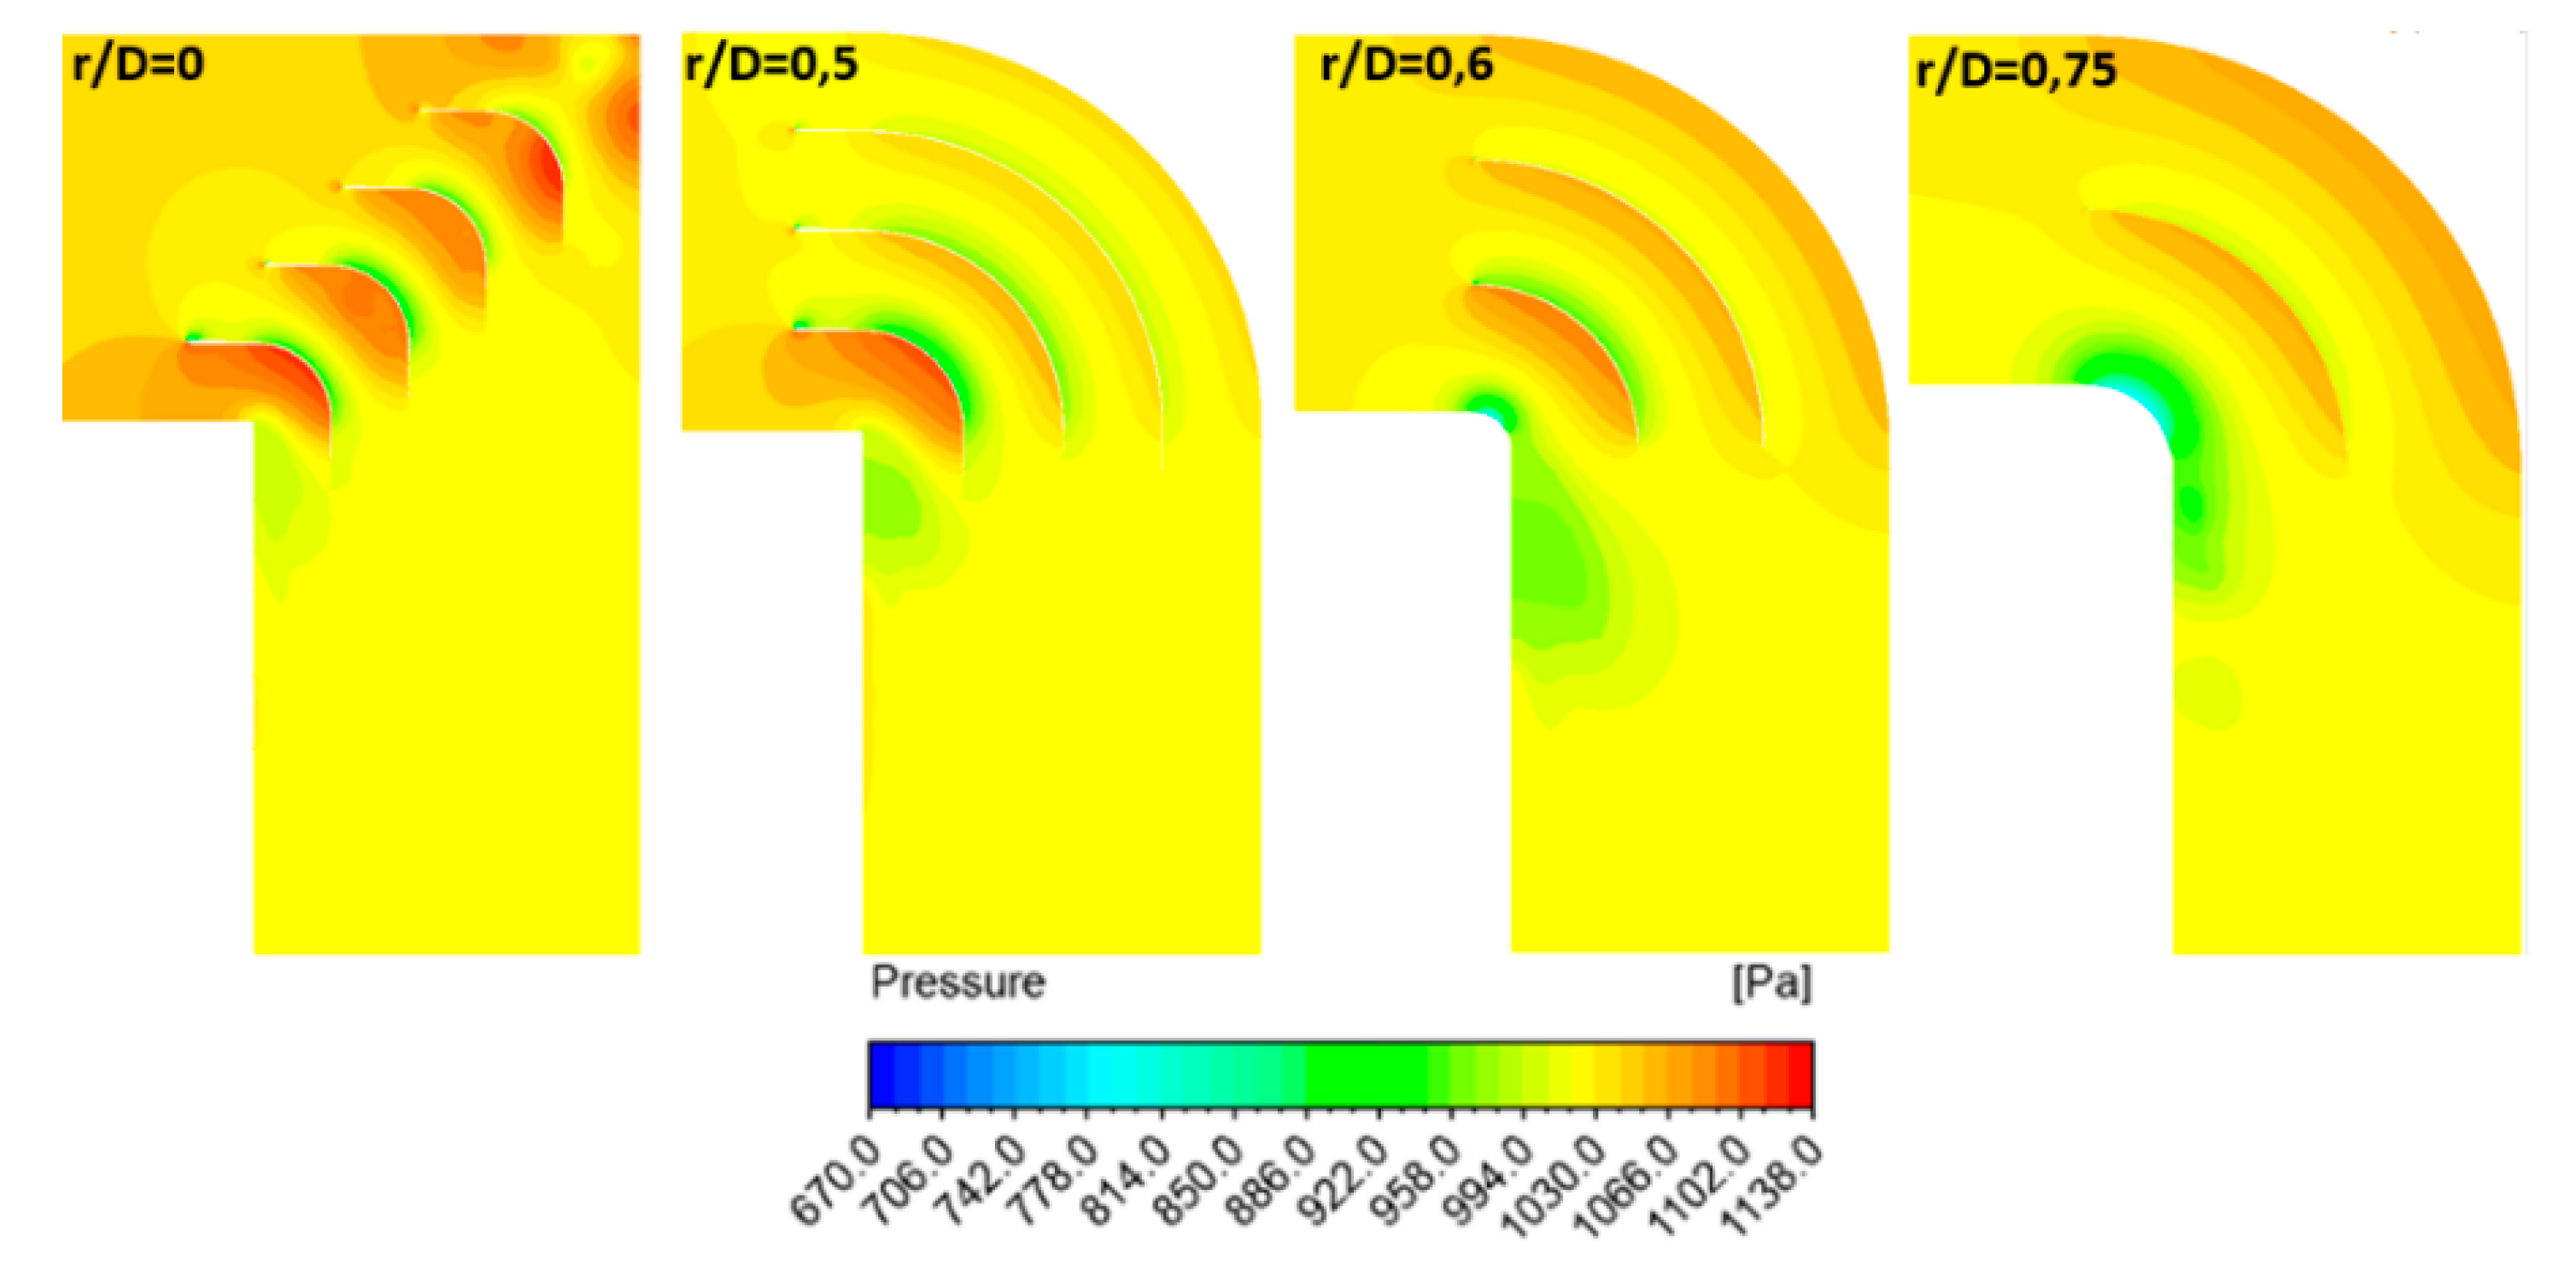
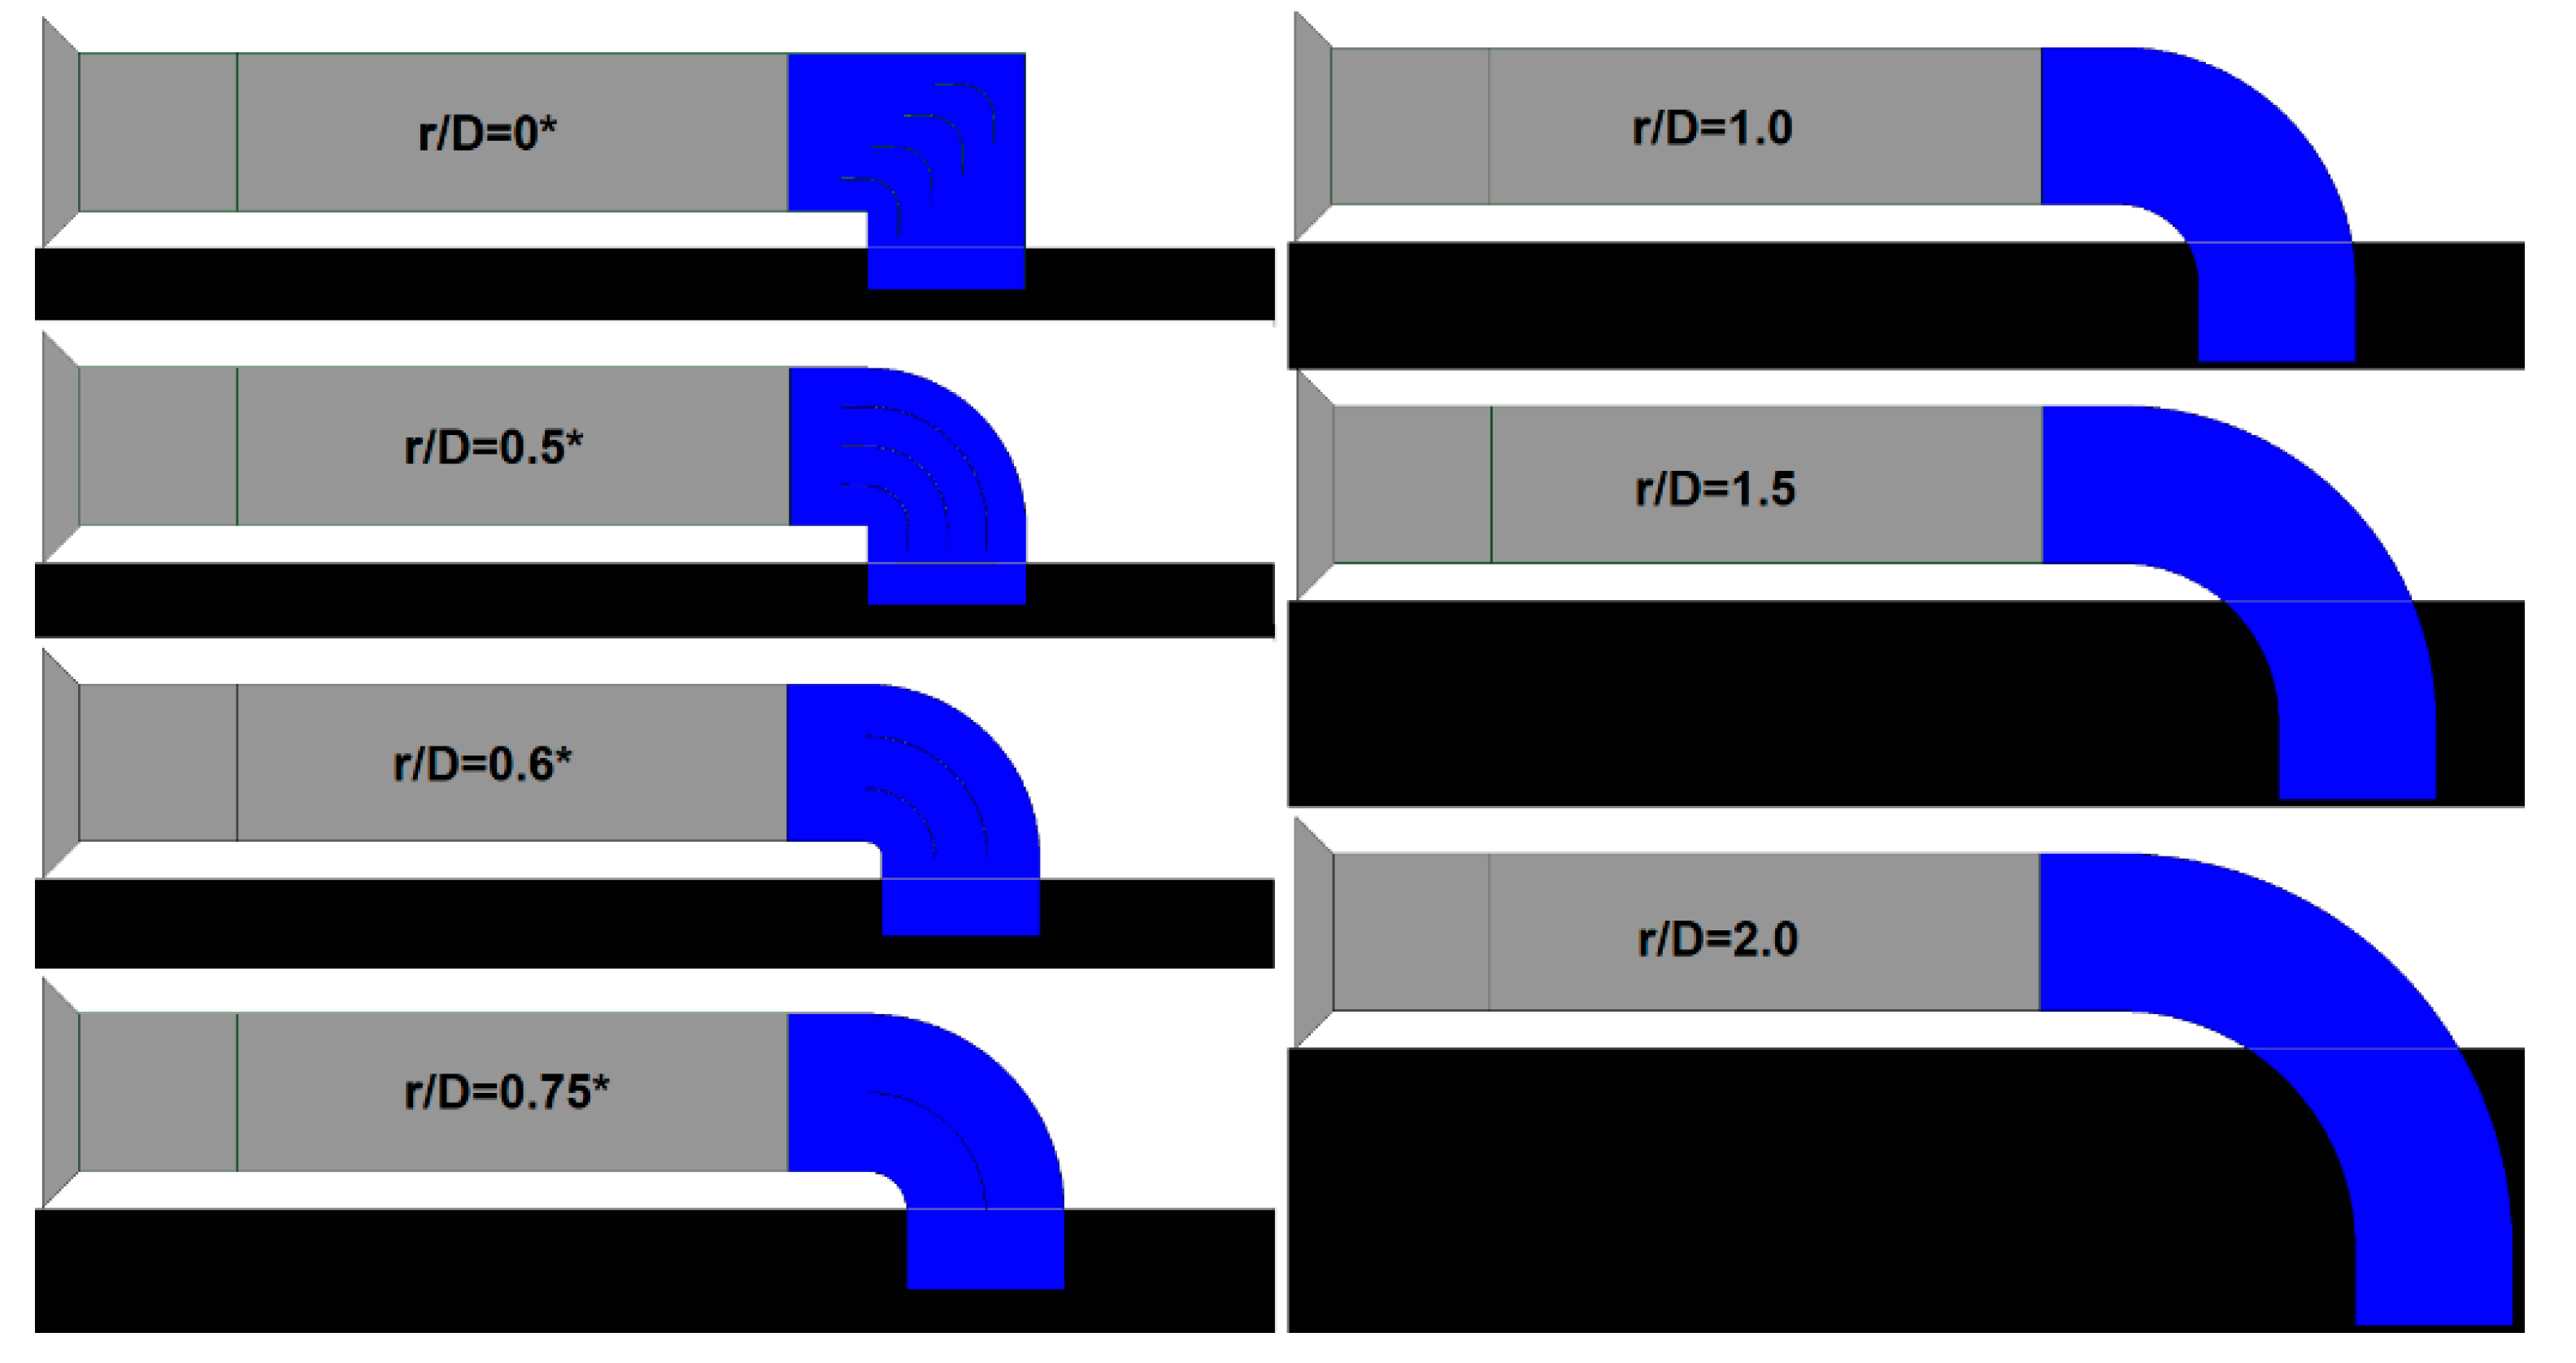
From the obtained results, it can be concluded that is only necessary to use guide vanes for an r/D less than 1.0. For the elbow r/D ratios 1.0, 1.5, and 2.0, it is not beneficial to incorporate guide vanes, since it becomes counterproductive and only generates additional shock losses. For the r/D ratio less than 1.0, the performing fan-shaft connection with r/D rates of 0, 0.5, 0.6, and 0.75 were analyzed and the best number of guide vanes inside are 4, 3, 2, and 1, respectively. If more guide vanes are incorporated, it only generates additional shock losses. The upstream and downstream penetration for guide vanes from the elbow is only applicable to r/D rates of 0 and 0.5 because additional friction losses from guide vanes extensions add more losses from turbulence. The aerodynamic design represented by Rc and W parameters were determined for each r/W case 0, 0.5, 0.6, and 0.75.
Including the optimal guide vanes defined geometries with r/D rates of 0, 0.5, 0.6, and 0.75 allows for selecting the best performing solution in each case. The 3D models show that guide vanes can reduce the area of turbulence and air vorticity in the internal wall downstream of the elbow by approximately 50% or more. The velocity distribution is homogenized after three diameters downstream of the elbows.
The parameters presented here can be scaled for other sizes, taking into account the original 3.0 m diameter and their parameters for the final diameter. It should be considered that the values obtained are only an approximation to the final solution. Future works should consider experimental scale models and CFD simulations to improve the obtained values by adjusting the turbulence models to reach more accurate results.

Author Contributions

Conceptualization, J.P.H. and E.A.; formal analysis, J.P.H., S.P. and E.A.; investigation, B.V.; project administration, S.P.; software, B.V. and S.P.; writing—original draft, B.V.; writing—review and editing, J.P.H. and E.A. All authors have read and agreed to the published version of the manuscript.

Funding

This research was funded by the Departamento de Investigaciones Científicas y Tecnológicas, Universidad de Santiago de Chile, Research Project number 051515HC executed at Universidad de Santiago de Chile and by the Fondo de Fomento al Desarrollo Científico y Tecnológico IT17M100009 project from Agencia Nacional de Investigación y Desarrollo, Chile. The APC was funded by the Departamento de Ingeniería en Minas de la Universidad de Santiago de Chile.

Conflicts of Interest

The authors declare no conflict of interest.

References

  1. Anwer, M.; So, R. Swirling turbulent flow through a curved pipe: Part I: Effect of swirl and bend curvature. Exp. Fluids 1993, 14, 85–96. [Google Scholar] [CrossRef]
  2. Modi, P.P.; Jayanti, S. Pressure losses and flow distribution in ducts with sharp bends. Chem. Eng. Res. Des. 2004, 82, 321–331. [Google Scholar] [CrossRef]
  3. Johnson, M. Turning Vanes: Necessary Component, or Efficiency Reduction Device? U.S. Green Building Council: Atlanta, GA, USA, 2009. [Google Scholar]
  4. Metzger, D.E.; Plevich, C.W.; Fan, C.S. Pressure Loss Through Sharp 180 Deg Turns in Smooth Rectangular Channels. J. Eng. Gas Turbines Power 1984, 106, 677–681. [Google Scholar] [CrossRef]
  5. Misra, G.B. Mine Environment and Ventilation; Oxford University Press: Oxford, UK, 1988; ISBN 0195622324. [Google Scholar]
  6. Kotb, N.A.E.; Dehghan, M.; Ward-Smith, A.J. A numerical study of laminar and turbulent flows in a two-dimensional bend with or without a guide vane. Int. J. Numer. Methods Eng. 1988, 26, 245–262. [Google Scholar] [CrossRef]
  7. Lindgren, B.; Österlund, J.; Johansson, A.V. Measurement and calculation of guide vane performance in expanding bends for wind-tunnels. Exp. Fluids 1998, 24, 265–272. [Google Scholar] [CrossRef]
  8. Miller, D. Internal Flow Systems, 2nd ed.; BHRA: Beldford, MA, USA, 1990. [Google Scholar]
  9. Liou, T.-M.; Lee, H.-L.; Liao, C.-C. Effects of Guide-Vane Number in a Three-Dimensional 60-Deg Curved Side-Dump Combustor Inlet. J. Fluids Eng. 2000, 123, 211–218. [Google Scholar] [CrossRef]
  10. Enayet, M.; Gibson, M.; Taylor, A.; Yianneskis, M. Laser-Doppler measurements of laminar and turbulent flow in a pipe bend. Int. J. Heat Fluid Flow 1982, 3, 213–219. [Google Scholar] [CrossRef] [Green Version]
  11. Sahlin, A.; Johansson, A.V. Design of guide vanes for minimizing the pressure loss in sharp bends. Phys. Fluids A Fluid Dyn. 1991, 3, 1934–1940. [Google Scholar] [CrossRef]
  12. Crawford, N.M.; Cunningham, G.Y. Prediction of Pressure Drop for Turbulent Fluid Flow in 90° Bends; Sage: London, UK, 2003; pp. 153–155. [Google Scholar]
  13. Kumar, S.; Nandi, N. Change in Flow Separation and Velocity Distribution Due to Effect of guide vane installed in a 90° pipe bend. Mech. Mech. Eng. 2017, 21, 353–361. [Google Scholar]
  14. Vlase, S.; Scarlatescu, D.; Marin, M.; Ochsner, A. Finite element analysis of an elbow tube in concrete anchor used in water supply networks. Proc. Inst. Mech. Eng. Part L-J. Mater.-Des. Appl. 2019, 234, 3–11. [Google Scholar] [CrossRef]
  15. McPherson, M.J. Subsurface Ventilation Engineering; Chapman & Hall: New York, NY, USA, 2009. [Google Scholar]
  16. Hartman, E. Mine Ventilation. In Mine Ventilation; Wileys & Sons: New York, NY, USA, 1997; p. 630. [Google Scholar]
Figure 1. Shaft connection.
Processes 09 01555 g001
Figure 2. Isometric view of geometries and curvature ratio, (a) r/D = 0, (b) r/D = 0.5, (c) r/D = 0.6, (d) r/D = 0.75, (e) r/D = 1.0, (f) r/D = 1.5, and (g) r/D = 2.0.
Processes 09 01555 g002
Figure 3. Elbow design (a). Curvature ratios: r/D (b) r/D = 0, (c) r/D = 0.5, (d) r/D = 0.6, (e) r/D = 0.75, (f) r/D = 1.0, (g) r/D = 1.5 y, and (h) r/D = 2.0.
Processes 09 01555 g003
Figure 4. Shock factor for elbows ratio at 0.5 for the different number of elements (cell).
Processes 09 01555 g004
Figure 5. Shock factor for the 3D circular section (experimental and simulation).
Processes 09 01555 g005
Figure 6. Number of elements with and without guide vanes.
Processes 09 01555 g006
Figure 7. Shock factor and number of vanes for the 2D simulation.
Processes 09 01555 g007
Figure 8. Scheme with upstream and downstream penetration of vane.
Processes 09 01555 g008
Figure 9. Shock loss coefficient for 2D upstream and downstream penetration of vane.
Processes 09 01555 g009
Figure 10. Profile of the vane design.
Processes 09 01555 g010
Figure 11. Shock factors in 2D cases for vane aerodynamic design.
Processes 09 01555 g011
Figure 12. Velocity profile for the optimal vane designs.
Processes 09 01555 g012
Figure 13. Velocity contours of 3D geometries without a guide vane on a profile view.
Processes 09 01555 g013
Figure 14. Pressure contours of 3D geometries without a guide vane on a profile view.
Processes 09 01555 g014
Figure 15. Turbulence kinetic energy contours of 3D geometries without a guide vane on a profile view.
Processes 09 01555 g015
Figure 16. Velocity contours of 3D geometries with guide vane on a profile view.
Processes 09 01555 g016
Figure 17. Pressure contours of 3D geometries with guide vane on a profile view.
Processes 09 01555 g017
Figure 18. Turbulence kinetic energy contours of 3D geometries with guide vane on a profile view.
Processes 09 01555 g018
Figure 19. Shock factors for the base and optimized cases.
Processes 09 01555 g019
Figure 20. Scheme of fan-shaft connections for different r/D ratios and field installation (elbows with asterix (*) are equipped with guide vanes).
Processes 09 01555 g020
Table 1. Number of elements for each r/D ratio.
r/DNumber of Elements without VanesNumber of Elements with Vanes
03,707,2934,923,100
0.53,598,3244,654,434
0.63,676,0534,991,669
0.753,782,9554,455,085
13,959,004-
1.54,311,246-
24,664,687-
Table 2. Cases of the study of optimal penetration.
CasePenetration
Upstream (m)Downstream (m)
00.00.0
10.50.0
21.00.0
31.50.0
40.00.5
50.01.0
60.01.5
70.50.5
81.01.0
91.51.5
Table 3. Aerodynamic design of the study cases.
Case1234567891011121314
Rc2.55.02.55.0102.57.5152.510202.51530
W55101010151515202020303030
Table 4. Dimensions of the best vane and associated shock factors X.
r/D RatioN° VanesPenetrationAerodynamicsX
a (m)b (m)Rc (mm)W (mm)
0.0040.50.515150.07
0.5030.50.515150.09
0.602007.5150.10
0.75100550.06
1.000----0.04
1.500----0.02
2.000----0.02
Table 5. Determination of vane guide dimensions and associated shock factors X.
r/D00.50.60.75
N° Vanes4321
a (m)0.166D0.166D--
b (m)0.166D0.166D--
W (mm)0.005D0.005D0.005D0.0016D
Rc (mm)0.005D0.005D0.0025D0.0016D
Publisher’s Note: MDPI stays neutral with regard to jurisdictional claims in published maps and institutional affiliations.

