Article

Performance Studies and Energy-Saving Analysis of a Solar Water-Heating System

1
School of Civil Engineering, Lanzhou University of Technology, Lanzhou 730050, China
2
College of Petrochemical Technology, Lanzhou University of Technology, Lanzhou 730050, China
3
School of Civil Engineering and Architecture, East China Jiaotong University, Nanchang 330013, China
*
Author to whom correspondence should be addressed.
Processes 2021, 9(9), 1536; https://doi.org/10.3390/pr9091536
Submission received: 5 July 2021 / Revised: 26 August 2021 / Accepted: 26 August 2021 / Published: 29 August 2021

Abstract

:
This paper proposed an experimental test: the solar water-heating system was been monitored for a whole year to analyze collector performance in an actual operation process. Heat-collecting efficiency, heating capacity, power consumption, and heat required were analyzed theoretically. Results showed that solar irradiance and ambient temperature were positively correlated with heat collection efficiency, and the daily average heat collection efficiency was up to 56.63%. In winter, the auxiliary heat source consumed the most power, almost all of which bears the heat of users. The heat collection in summer met the demand for hot water, and the guarantee rate of solar energy could reach 100%. The energy saving properties and CO2 emission reduction were analyzed. This system had a significant effect on the energy-saving effect and environmental protection. The analysis showed that the hot-water system can fully meet the design requirements under the condition of relatively sufficient solar energy, and can operate stably, which has a certain guiding significance for the design and application of large-scale solar hot-water systems.

1. Introduction

As the basic material for people living, energy is an important guarantee for the development of the national economy. The rapid development of the world economy has aggravated the spread of energy shortage and environmental pollution. Therefore, reducing the use of traditional fossil fuels and exploring renewable energy is a global problem that needs to be solved urgently [1]. Solar energy is a renewable energy source that has become the preferred energy source for energy shortage and conservation and emission reduction [2]. Solar hot-water technology is the most mature and effective technology of solar energy [3]. The Solar Water-Heating system was identified as a potential technology that effectively converts solar energy to thermal energy [4]. Moreover, the adoption of solar water-heating systems in future building designs can be beneficial for socio-economic development and GHG reductions [5]. The solar energy collector is the key component of solar hot-water technology and has become a key research object, and its performance has been optimized mainly through numerical simulation and structural innovation [6,7,8]. Scholars have carried out some research on solar collectors. Dasaien et al. discussed the performance of a thermo-syphon-based flat plate solar water heater with nanofluid of CuO and water. From the experimental and computational investigation it was found that the CuO nanoparticles enhanced the efficiency of the thermo-syphon-based solar collector [9]. Kalbande Vednath P found that flat-plate solar collectors are more effective than other traditional types of solar collectors that use hybrid nanofluids [10]. Rong Ji Xu carried out numerical and experimental research on the compound parabolic concentrator-capillary solar collector (CPC-CSC) and analyzed the influence of solar irradiation intensity, velocity of ambient air, glass thickness, insulation thickness, inclination angle, mass flow rate, and inlet temperature of water [11]. Ayompe L M conducted a long-term test of a solar hot-water system consisting of a single-block collector [12]. Due to disadvantages of solar power, such as discontinuity, a solar hot-water system can add an auxiliary heat source; the air-source heat pump has a good energy saving effect [13,14]. However, it is affected by objective factors, such as site conditions, and the auxiliary heat source can use electric heating [15].
Collector performance requires improvement due to the complexity of the processing technology [16]. The cost is higher if a collector does not consider marketization. Market orientation is applied to the practical engineering of a solar collector and a hot-water system performance study. This aspect remains relatively small. To fully understand the performance of the system in actual operation and related problems, this research conducted a one-year tracking and collector performance test on a solar hot-water project in Beijing to obtain the actual operating conditions used for a large solar hot-water engineering design and optimization. The research results provide certain theoretical support for the application of solar energy and air-source heat pumps in buildings, and it has great significance for the promotion of energy-saving and emission-reduction technologies, the development of clean energy, and the realization of scientific energy use.
The paper studied the comprehensive performance of the system under complex and variable working conditions, which is different from the conventional solar system without analyzing the influence factors on the system performance. Moreover, the influence mechanism of external parameters on the comprehensive performance of the system was also analyzed in the paper.

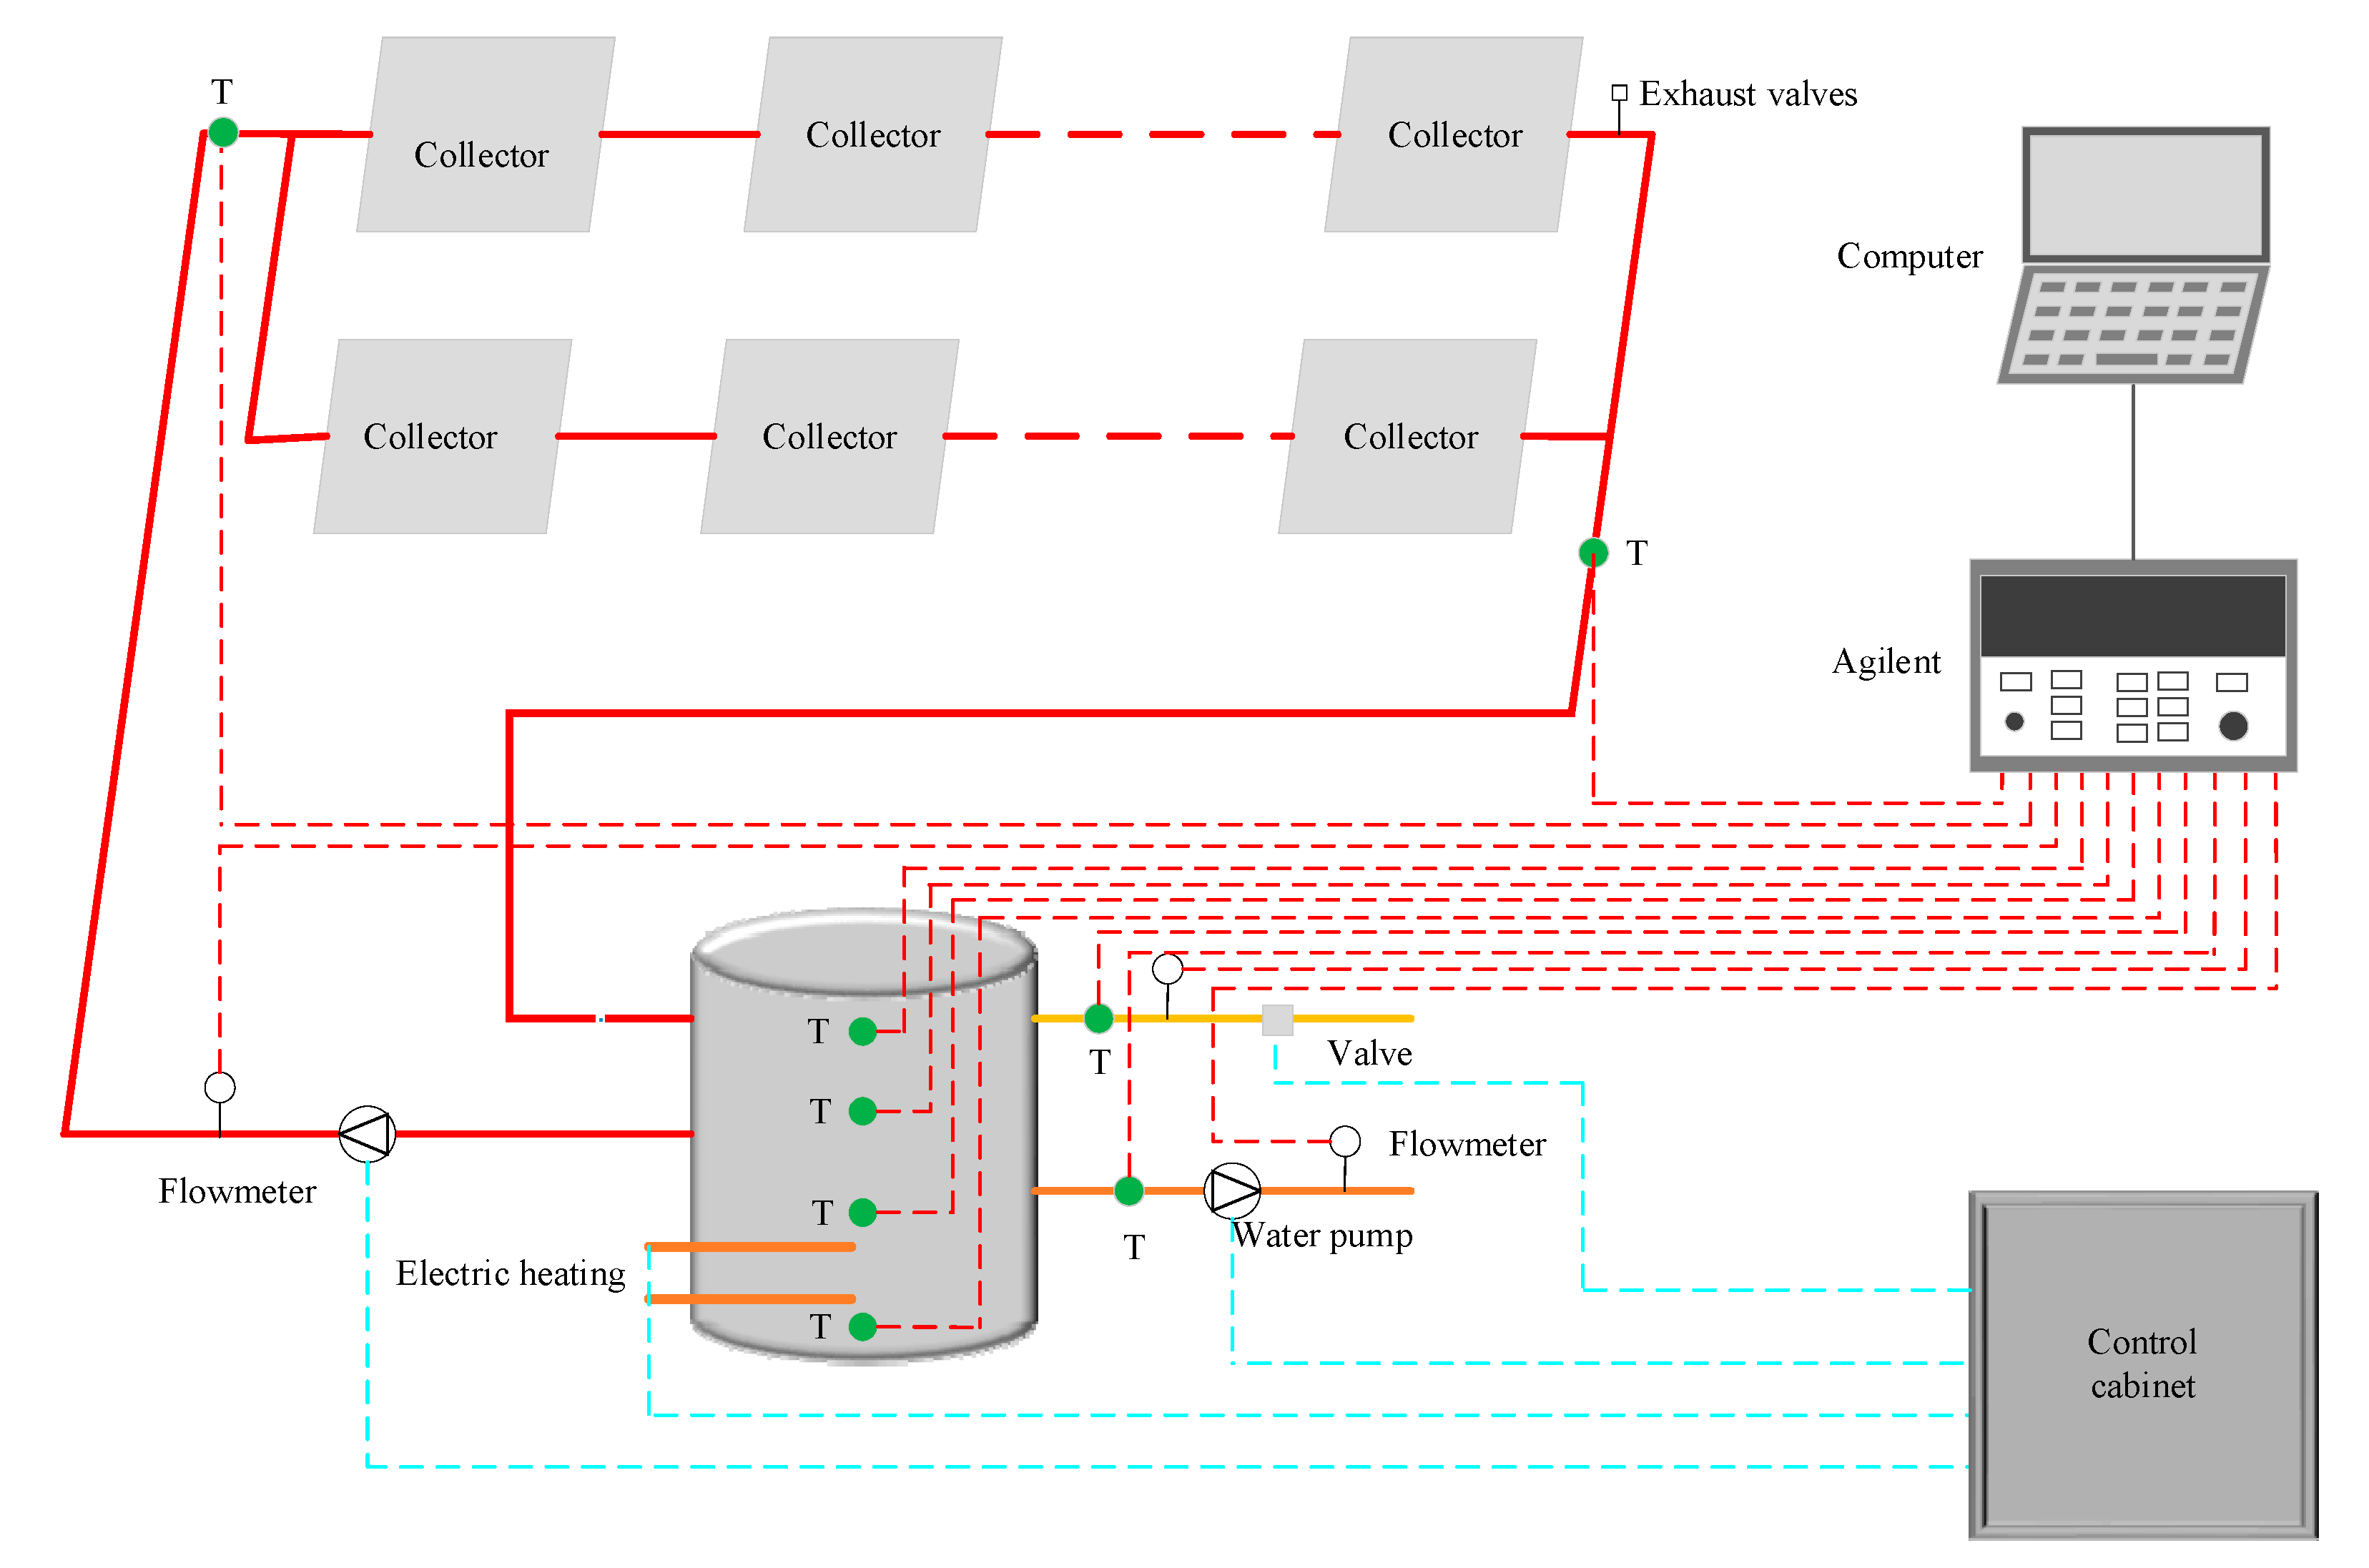
2. Solar Hot-Water System

The solar hot-water system is designed to provide hot water for staff to shower and clean. The schematic diagram of a system operation and layout of the measuring point are shown in Figure 1. The solar hot-water system can be divided into four parts: solar energy-collector system, user hot-water-supply system, water-tank-filling system, and automatic-control system. The solar heat-cycle system consists of a flat solar collector, circulating water pump, electric heating tube, and heat storage tank. The total area of a solar collector is approximately 60 m2, which is arranged in the south with a dip angle of 45°. The circulating pump uses a Germany weile water pump, and its maximum lift is 10 m. The total power of the electric heating tube is 28 kW, and the heat storage tank adopts a stainless steel insulated tank, and has a total volume of approximately 4.8 m3. The user hot-water-supply system is controlled by the circulating pump. Its maximum lift is 10 m. The water-tank-filling system is controlled automatically by an electric valve.
The solar hot-water-control system can realize automatic upper water, heat cycle, auxiliary heating, and system antifreeze. When the tank level is lower than 0.5 m, the rehydrating electric valve starts, and the system realizes automatic water loading. The refilled power valve is closed when the liquid level is higher than 0.8 m. As the solar collector exports water temperature above the water tank temperature 5 °C, the hot-water-circulating pump opens, and the pump shuts down when the temperature is lower than 2 °C. Auxiliary heat source heating starts if the solar energy is insufficient, has no solar energy, or the water tank temperature is less than 50 °C. If the system is not running continuously, the residual water of the circulating system must be drained to prevent the system’s pipeline from freezing and damaging the collector.

3. System Test and Evaluation Index

A flow meter was used to measure the water flow, and the measuring points were monitored by using thermal resistance and thermocouple. Through Agilent 34970A, the flow and temperature can be obtained. Irradiance and ambient temperature were collected by solar radiation meters and small weather stations. The power of the electric heating tube and the power of the pump power were collected by the control system.
The performance evaluation of solar hot-water engineering is determined mainly by the two indices, the solar-energy system and heat collection efficiency. The calculation formula of the system is as follows [15]:
Q = c m ( T out T in )
where Q is the total heat absorption of the system, c is the water-specific heat capacity, 4.2 KJ/(Kg·K), m is the water mass flow, Kg/s. Tout is export water temperature, °C, and Tin is the inlet water temperature, °C.
The calculation formula of heat collection efficiency is defined as follows [15]:
η = Q A H
where A is the heat-collecting area, m2, and H is irradiance, W/m2.

4. Results and Discussion

The operating performance of the solar hot-water project was carried out by experimental testing and theoretical analysis in 2015 and evaluated comprehensively. To clarify the relationship between each index, all experimental data (such as auxiliary heat source power consumption, water supply, and water consumption of 24 h per day) were tested from 8:00 to 16:00. The factors that affected the collector performance were solar irradiance and ambient temperature, which are discussed in the next section.

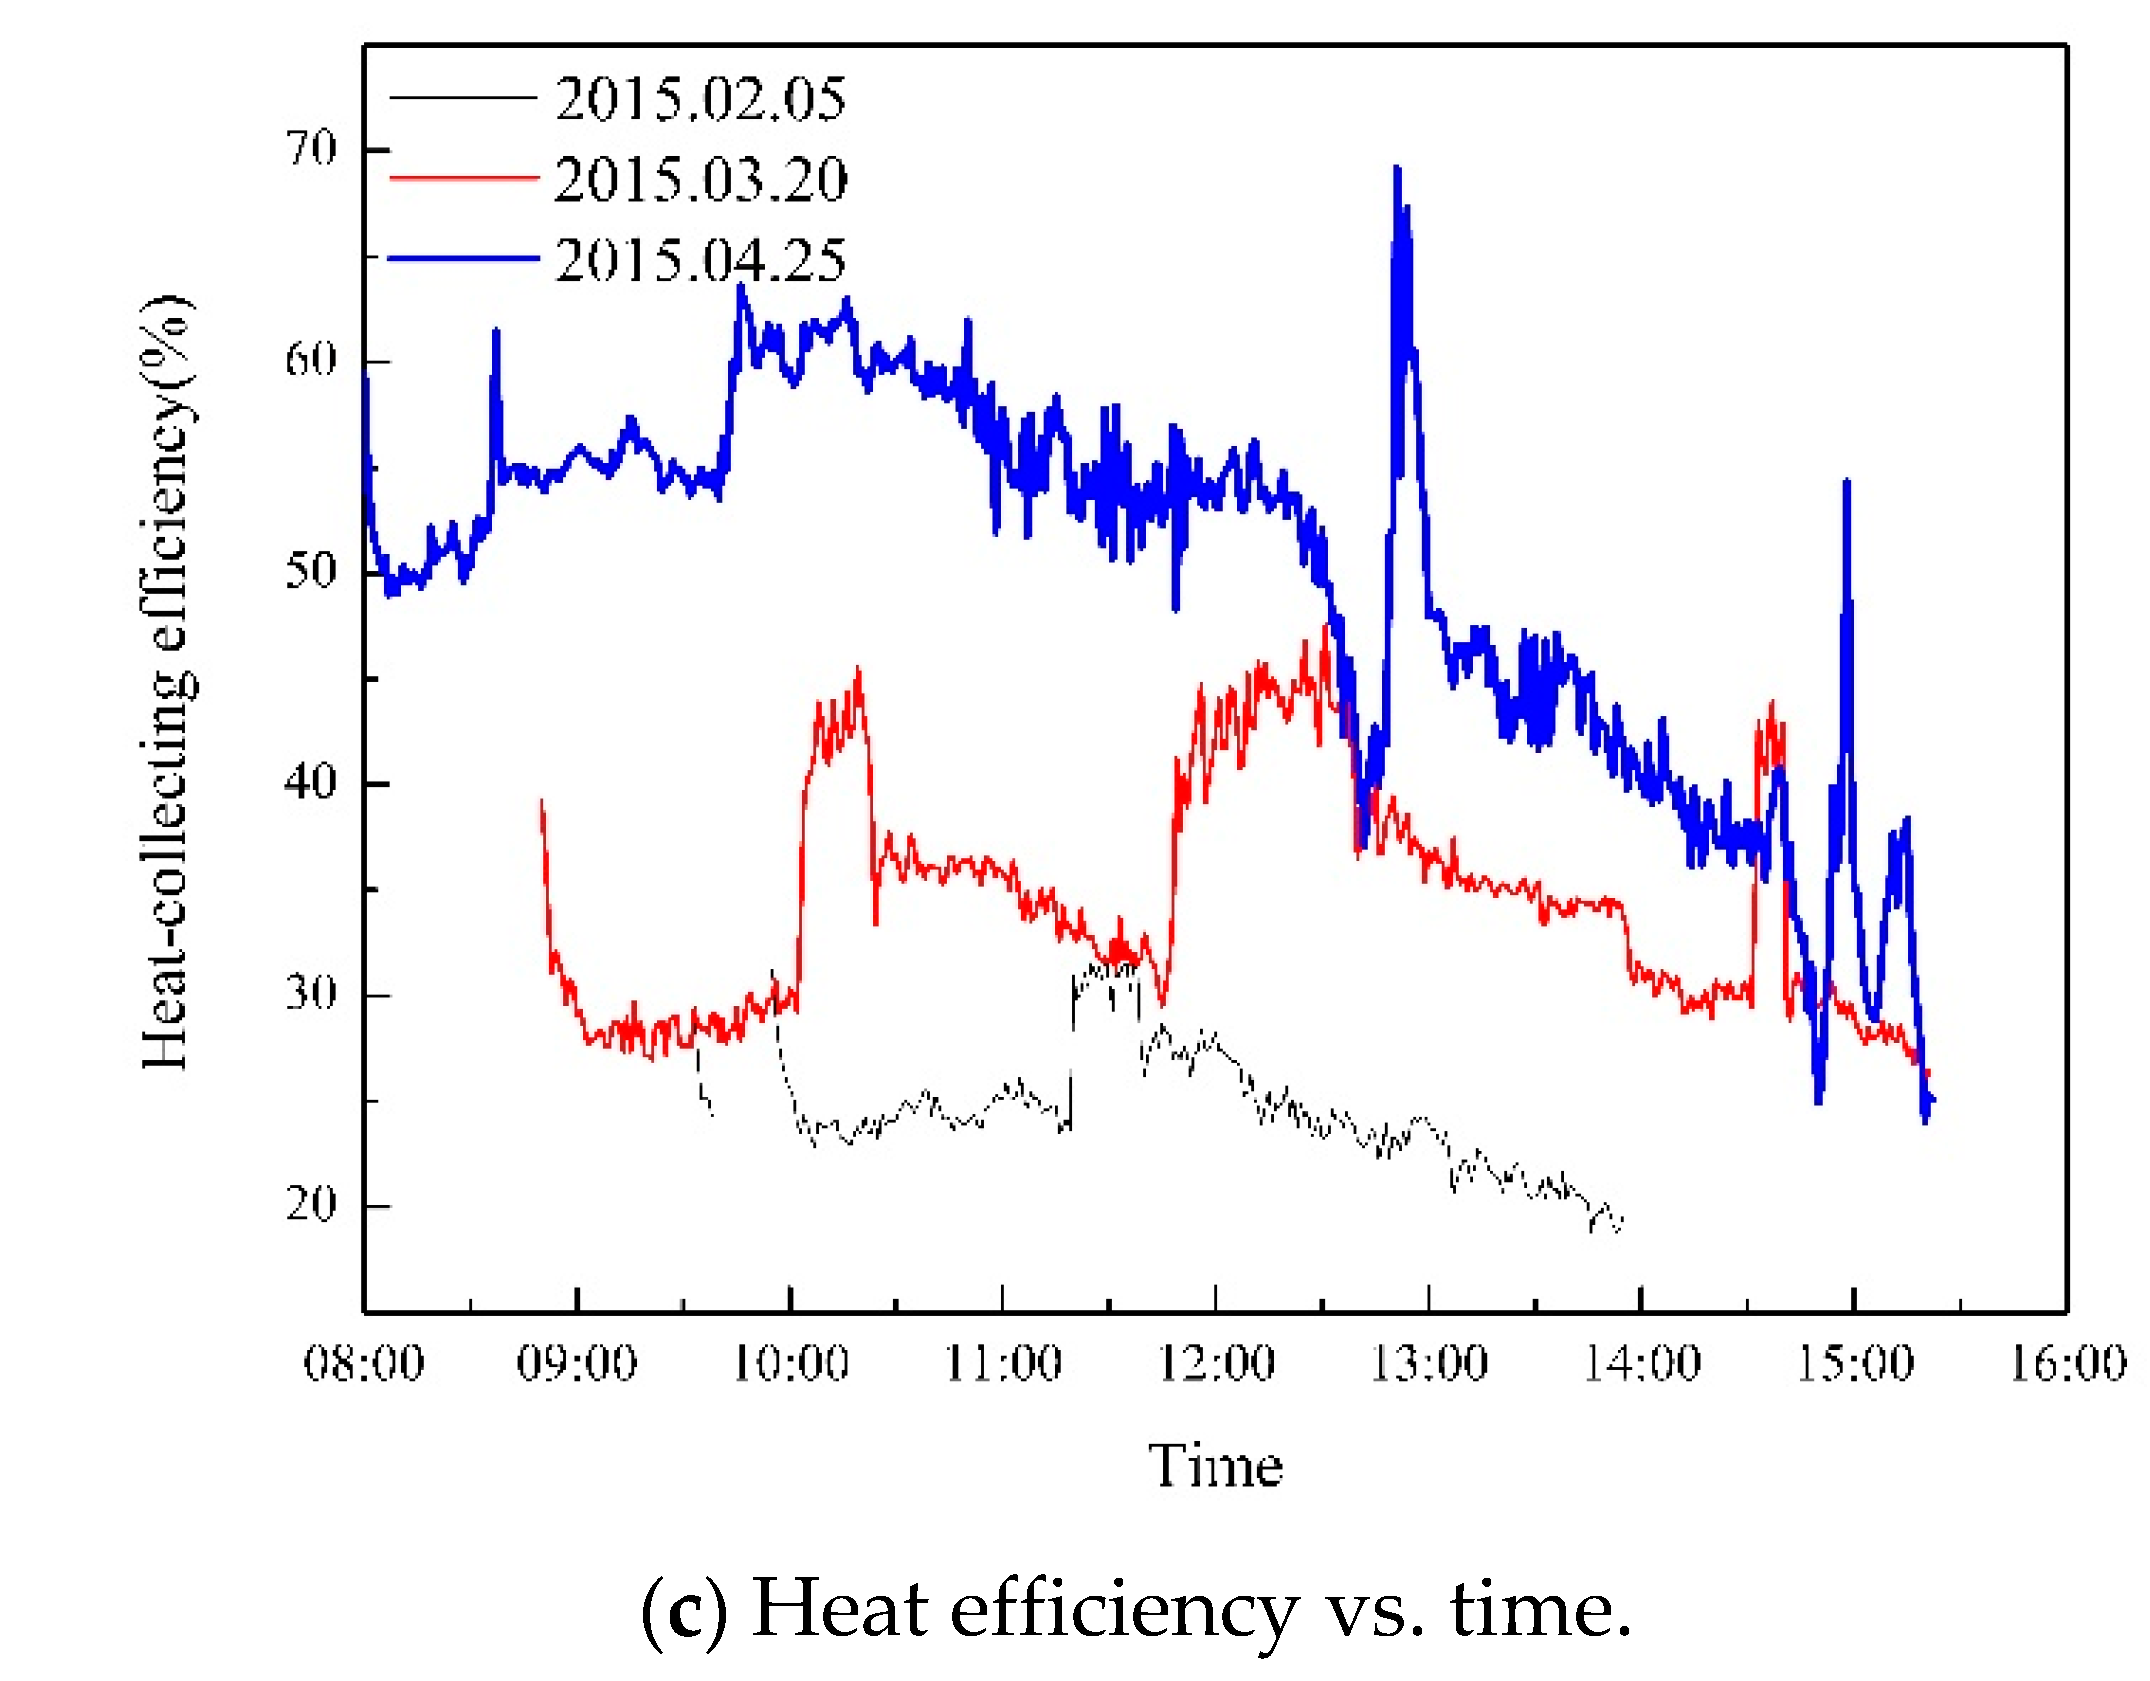
4.1. Influence of Ambient Temperature on the Performance of the Collector

The influence of ambient temperature on the performance of the solar hot-water system is shown in Figure 2. A comparative analysis for similar irradiance but different ambient temperatures was performed. Figure 2a illustrates irradiance change. The average irradiance values were 634.90, 625.90, and 636.30 W/m2, which are basically similar. Figure 2b represents the change in environmental temperature. The mean values of the temperature were 5.80, 18.80, and 28.80 °C, having a relatively large difference, making it easy to analyze the influence of temperature on the hot-water system performance. Figure 2c shows the change in solar thermal efficiency, and the environment temperature changing trend average values at 24.67%, 34.40%, and 49.95%. When the environment temperature was higher, collection efficiency was also higher. The difference value of solar thermal cycling water temperature and environment were small. When corresponding heat loss was reduced, the received solar energy was relatively high, and the heat set was high. The solar hot-water system has a different thermal cycling time, and low ambient temperature. The cycle system starts late and stops early. Therefore, the entire operation time is relatively small. The main reason is that when ambient temperature is low, the solar hot-water system has less heat, and the water temperature difference between the hot circulating water and the water tank is lower than the requirement of the water pump opening. During system operation, interruption may occur, which is also caused by this reason.

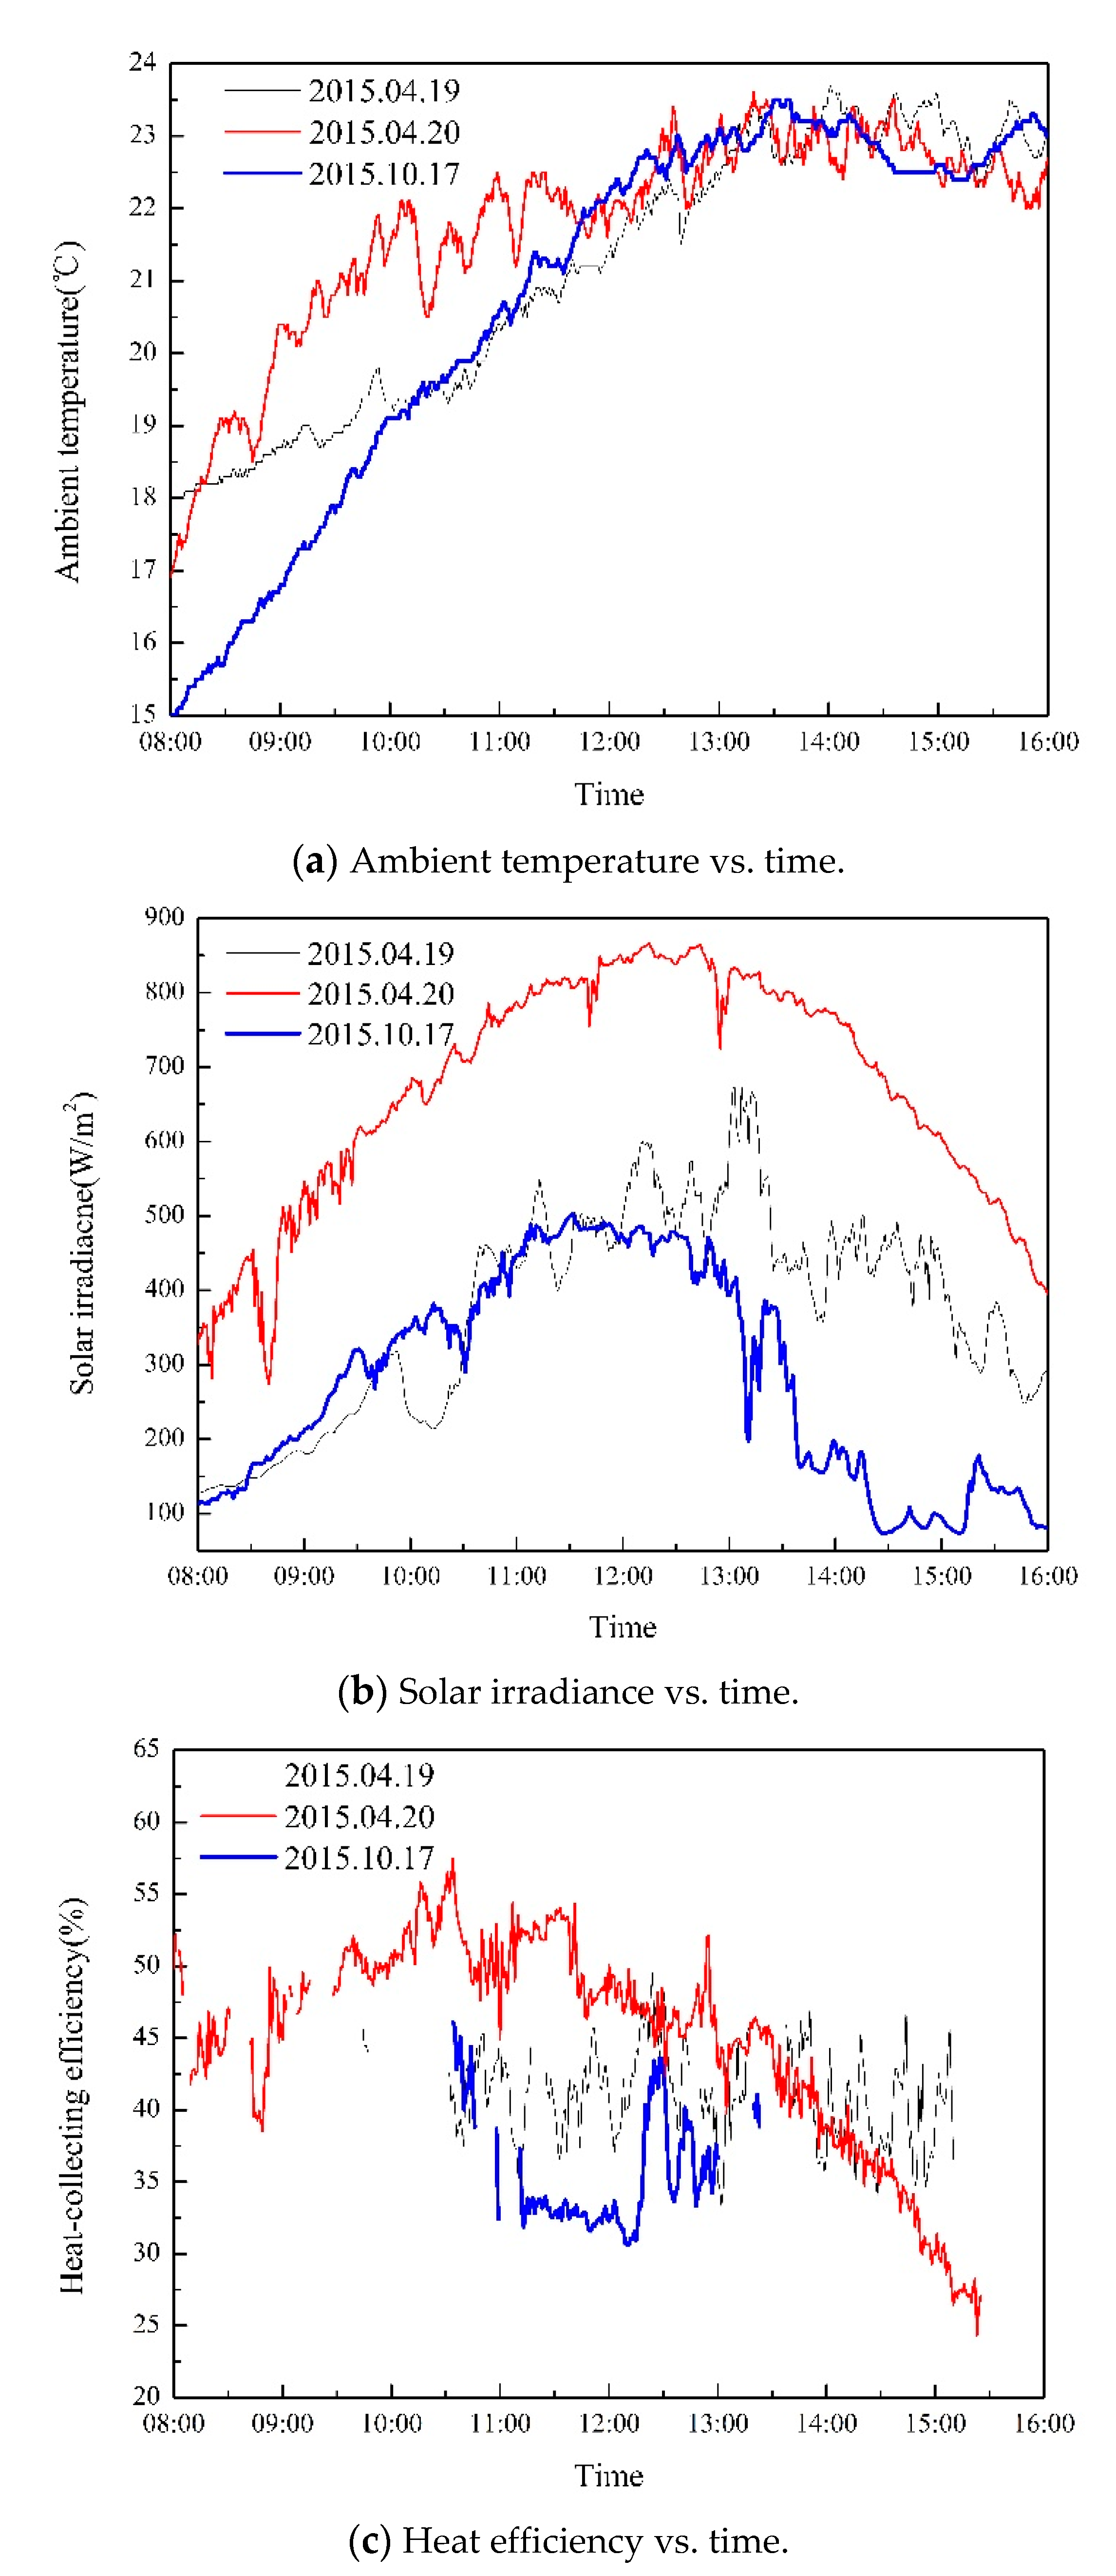
4.2. Influence of Irradiance on Collector Performance

The effect of irradiance on the hot-water system is shown in Figure 3. Performance analysis of the conditions with similar environmental temperature and different irradiance were selected. It can be seen that temperature change for the environment had averages of 21.10 °C, 21.70 °C, and 20.70 °C, and the difference was small. Figure 3b is the change of irradiance with the average values of 379.20, 677.60, and 287.80 W/m2. The differences are obvious. Figure 3c shows the changes in the thermal efficiency of the solar hot-water system with operating time. The mean values were 41.42%, 45.44%, and 34.91%, and the collection efficiency and irradiance were positively correlated. The higher the irradiance, the greater the collection efficiency. Given the increased irradiance, the relative increase of absorption of solar energy collector, or the set of heat increase, the increase in amplitude is greater than its irradiance range. The solar collectors’ collection efficiency calculation Equation (3) shows that when other parameters were constant, the collection efficiency agreed with the irradiance correlation. The higher the irradiance, the greater the collection efficiency. The diagram also implies that the higher the irradiance, the longer its collection of the thermal cycle. The sooner the cycle starts, the shorter the operation time will be. The hot-water system starts early but stops late, which is mainly related to the solar heat collection and the open cycle operation of the heat pump [17].
η = τ a U ( T p T a H )
where τ·a is the product of transmittance and absorptivity, U is the total heat loss coefficient, Tp is the cover plate temperature, and Ta is the ambient temperature.

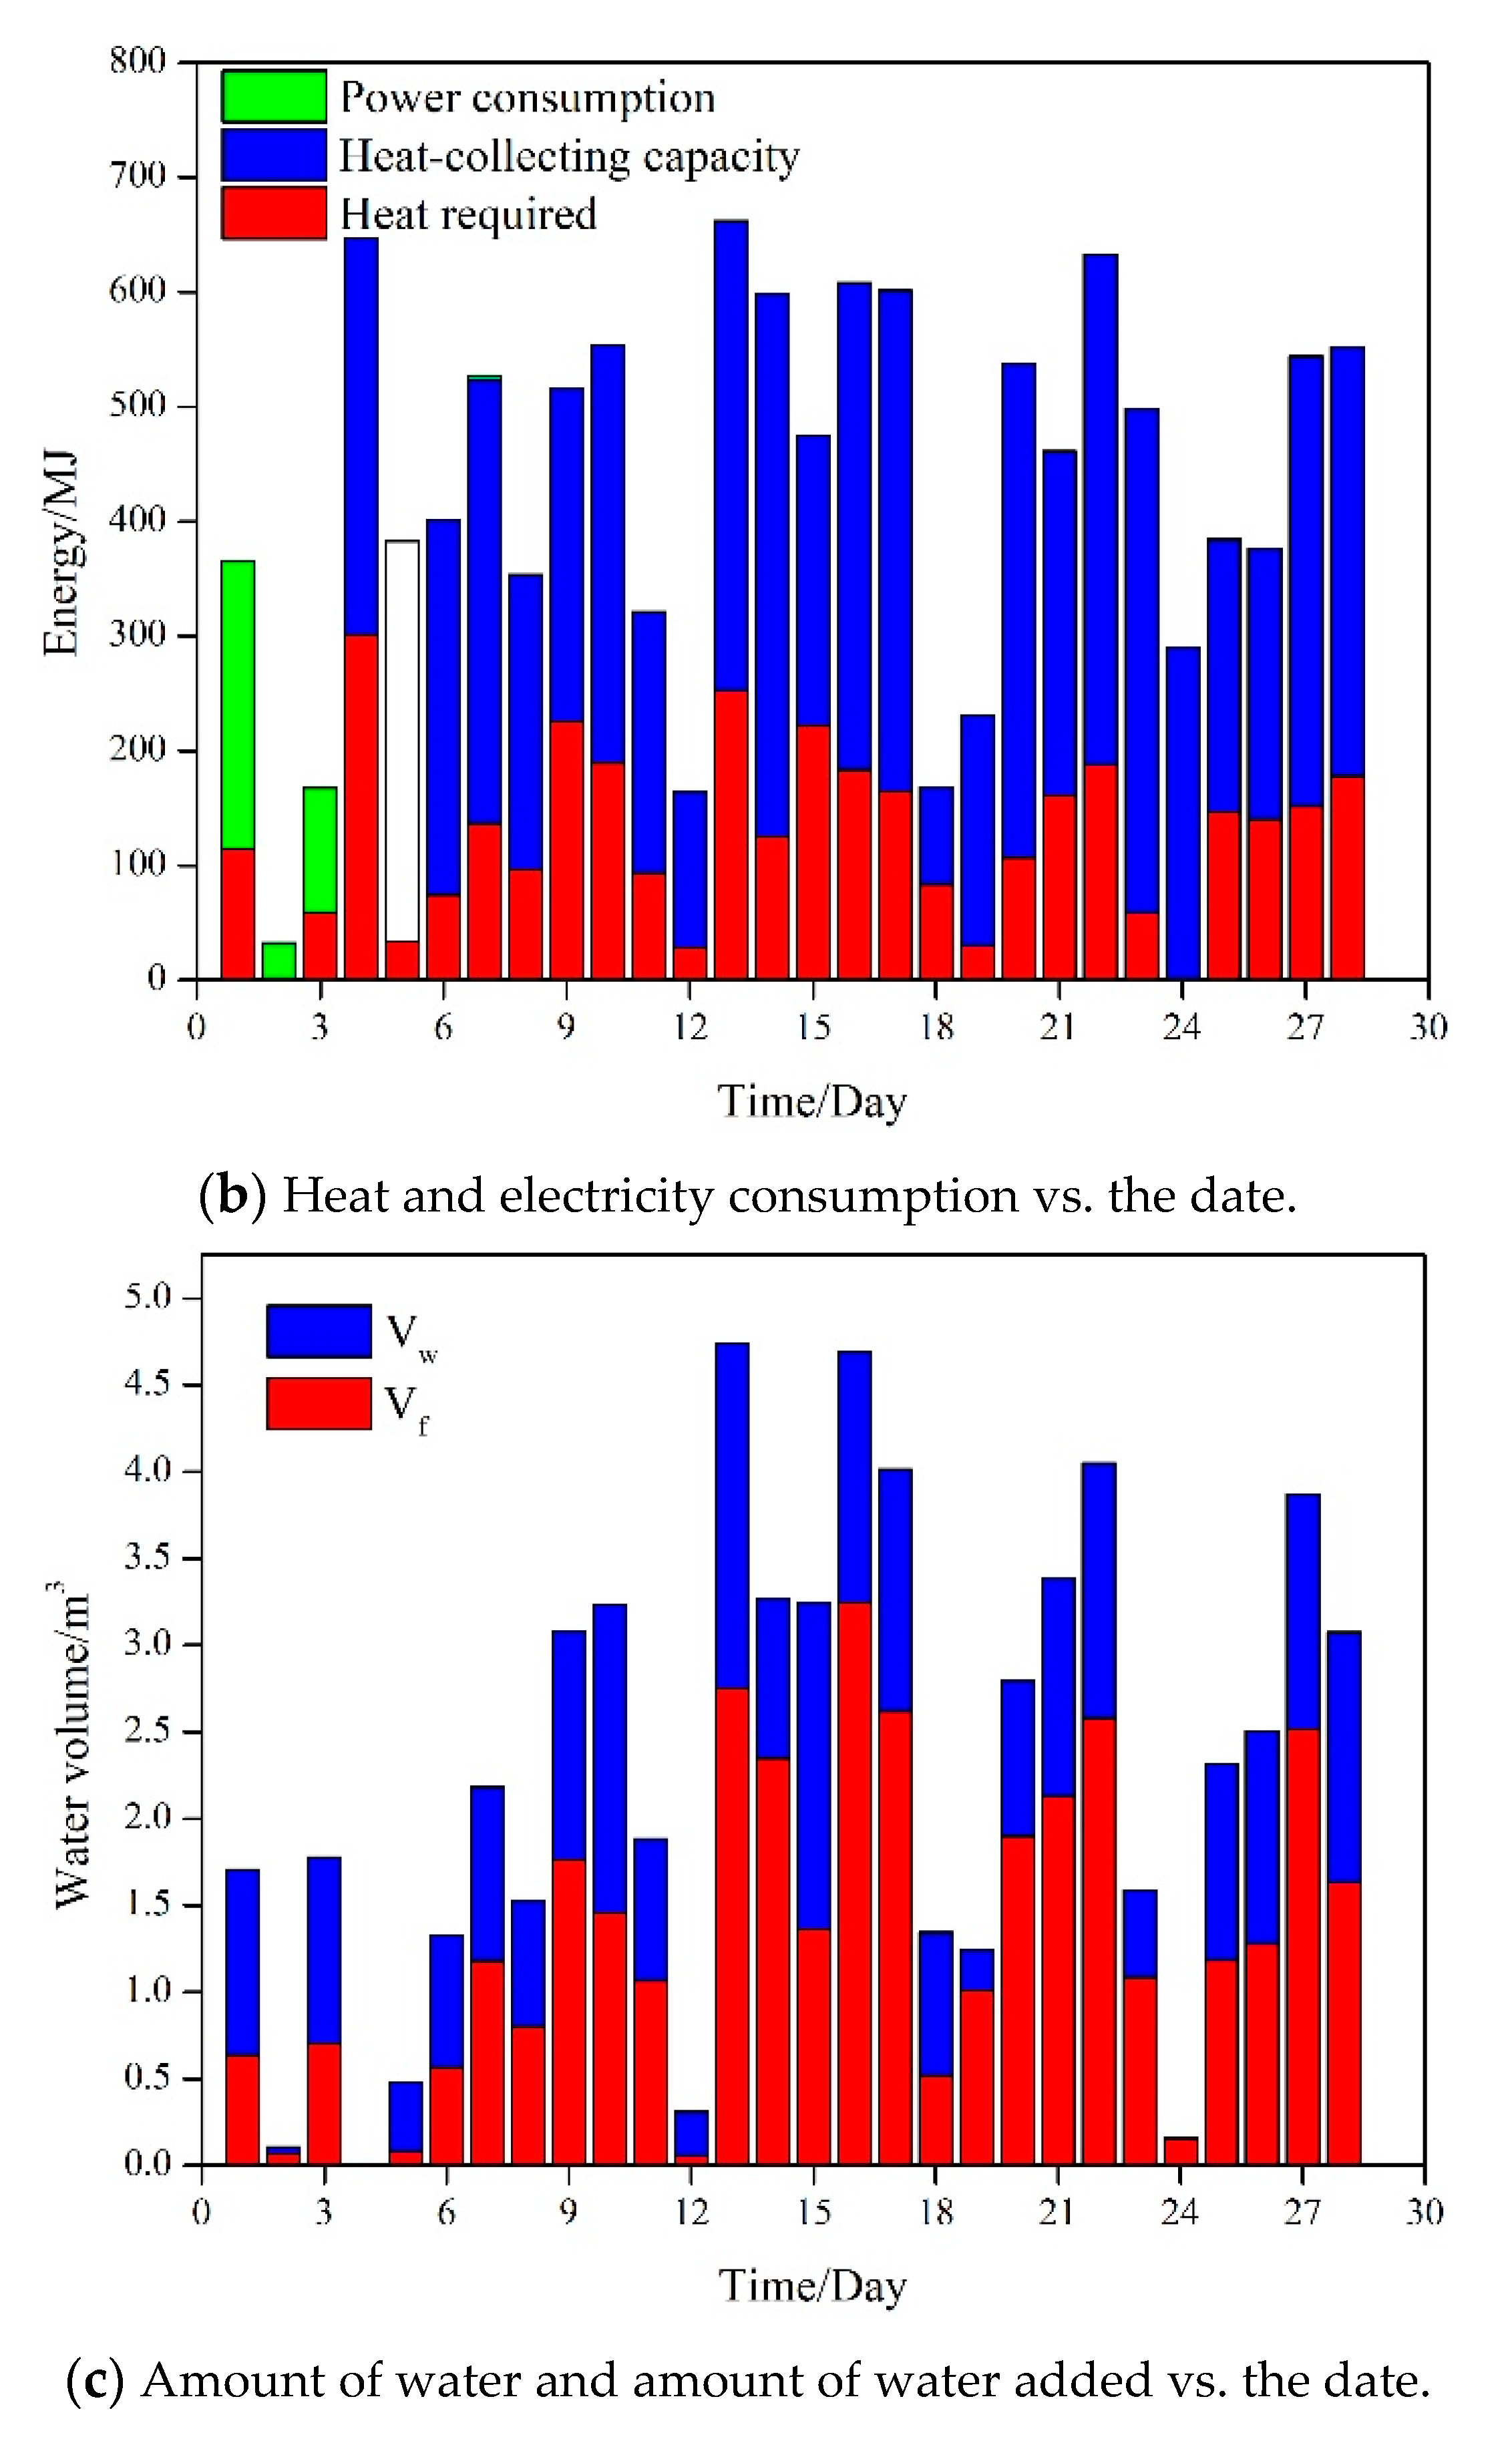
4.3. Analysis of Daily Operation Performance of the Hot-Water System

The experimental data were selected in April to analyze and evaluate the actual operation effect of the solar hot-water system. Figure 4a shows the trend chart of the daily irradiance and environmental temperature. Environmental temperature had a gradual upward trend, and there was no significant law existing in the daily variation of irradiance. Figure 4b shows the daily variation of power consumption, heat-collecting capacity and heat required. The solar heat cycle of the solstice was not running, and no solar heat collection existed at this time. To ensure the user’s heat demand, the maximum use’s thermal energy and the auxiliary heat source power were at 114.68 and 251.16 MJ. If the daily heat is zero, it must compensate the heat loss and maintain the temperature of the tank, and the electric heating power consumption is 30.96 MJ. The irradiance mean value was 635.40 W/m2 because of the maintenance of the solar collector. The set thermal cycle was not running. Thus, the daily heat and power consumption were 58.54 and 109.2 MJ. Thirty days before the solstice, the hot-water system was higher than the heat demand of the user. Thus, it did not need to open the auxiliary heat source. For example, the irradiance and ambient temperature were 710.7 W/m2 and 22.70 °C, respectively. The collection heat and user heat were 473.56 and 125.21 MJ. The collection of heat can meet the demand heat use completely. The solar assurance rate was 100%. The day-to-day performance analysis was conducted later in the month. The proportion of the auxiliary heat source open time was lower. Three days in April were characterized by open electric heating, and the rest of the time relied on solar hot-water heat-circulation system sets. Thus, the solar-energy hot-water system had an obvious energy-saving effect. Figure 4c changes the daily water consumption and the amount of water added to the user. The figure shows the two main reasons for greater water supply than the user’s water consumption. First, when the irradiance was relatively high, the water temperature of the collecting tank reached the set value. The water-replenishing circulation pump was opened at this time to reduce the temperature of the water tank in that the heat can be collected again, and the utilization rate of solar energy can be improved. The second considers that the whole circulation pipeline has leakage, and its replenishment should be slightly more than the water consumption. For example, on the 13th day, the mean of the irradiance was 675.50 W/m2, and the water supply and water consumption were 2.75 and 1.99 m3, respectively. In the figure, only the amount of water added is zero, which is due to the small number of people on duty on weekends and the lack of hot-water demand. On the same day, the average irradiance was 664 W/m2, and the solar-energy-collecting heat cycle reached the operating requirement.

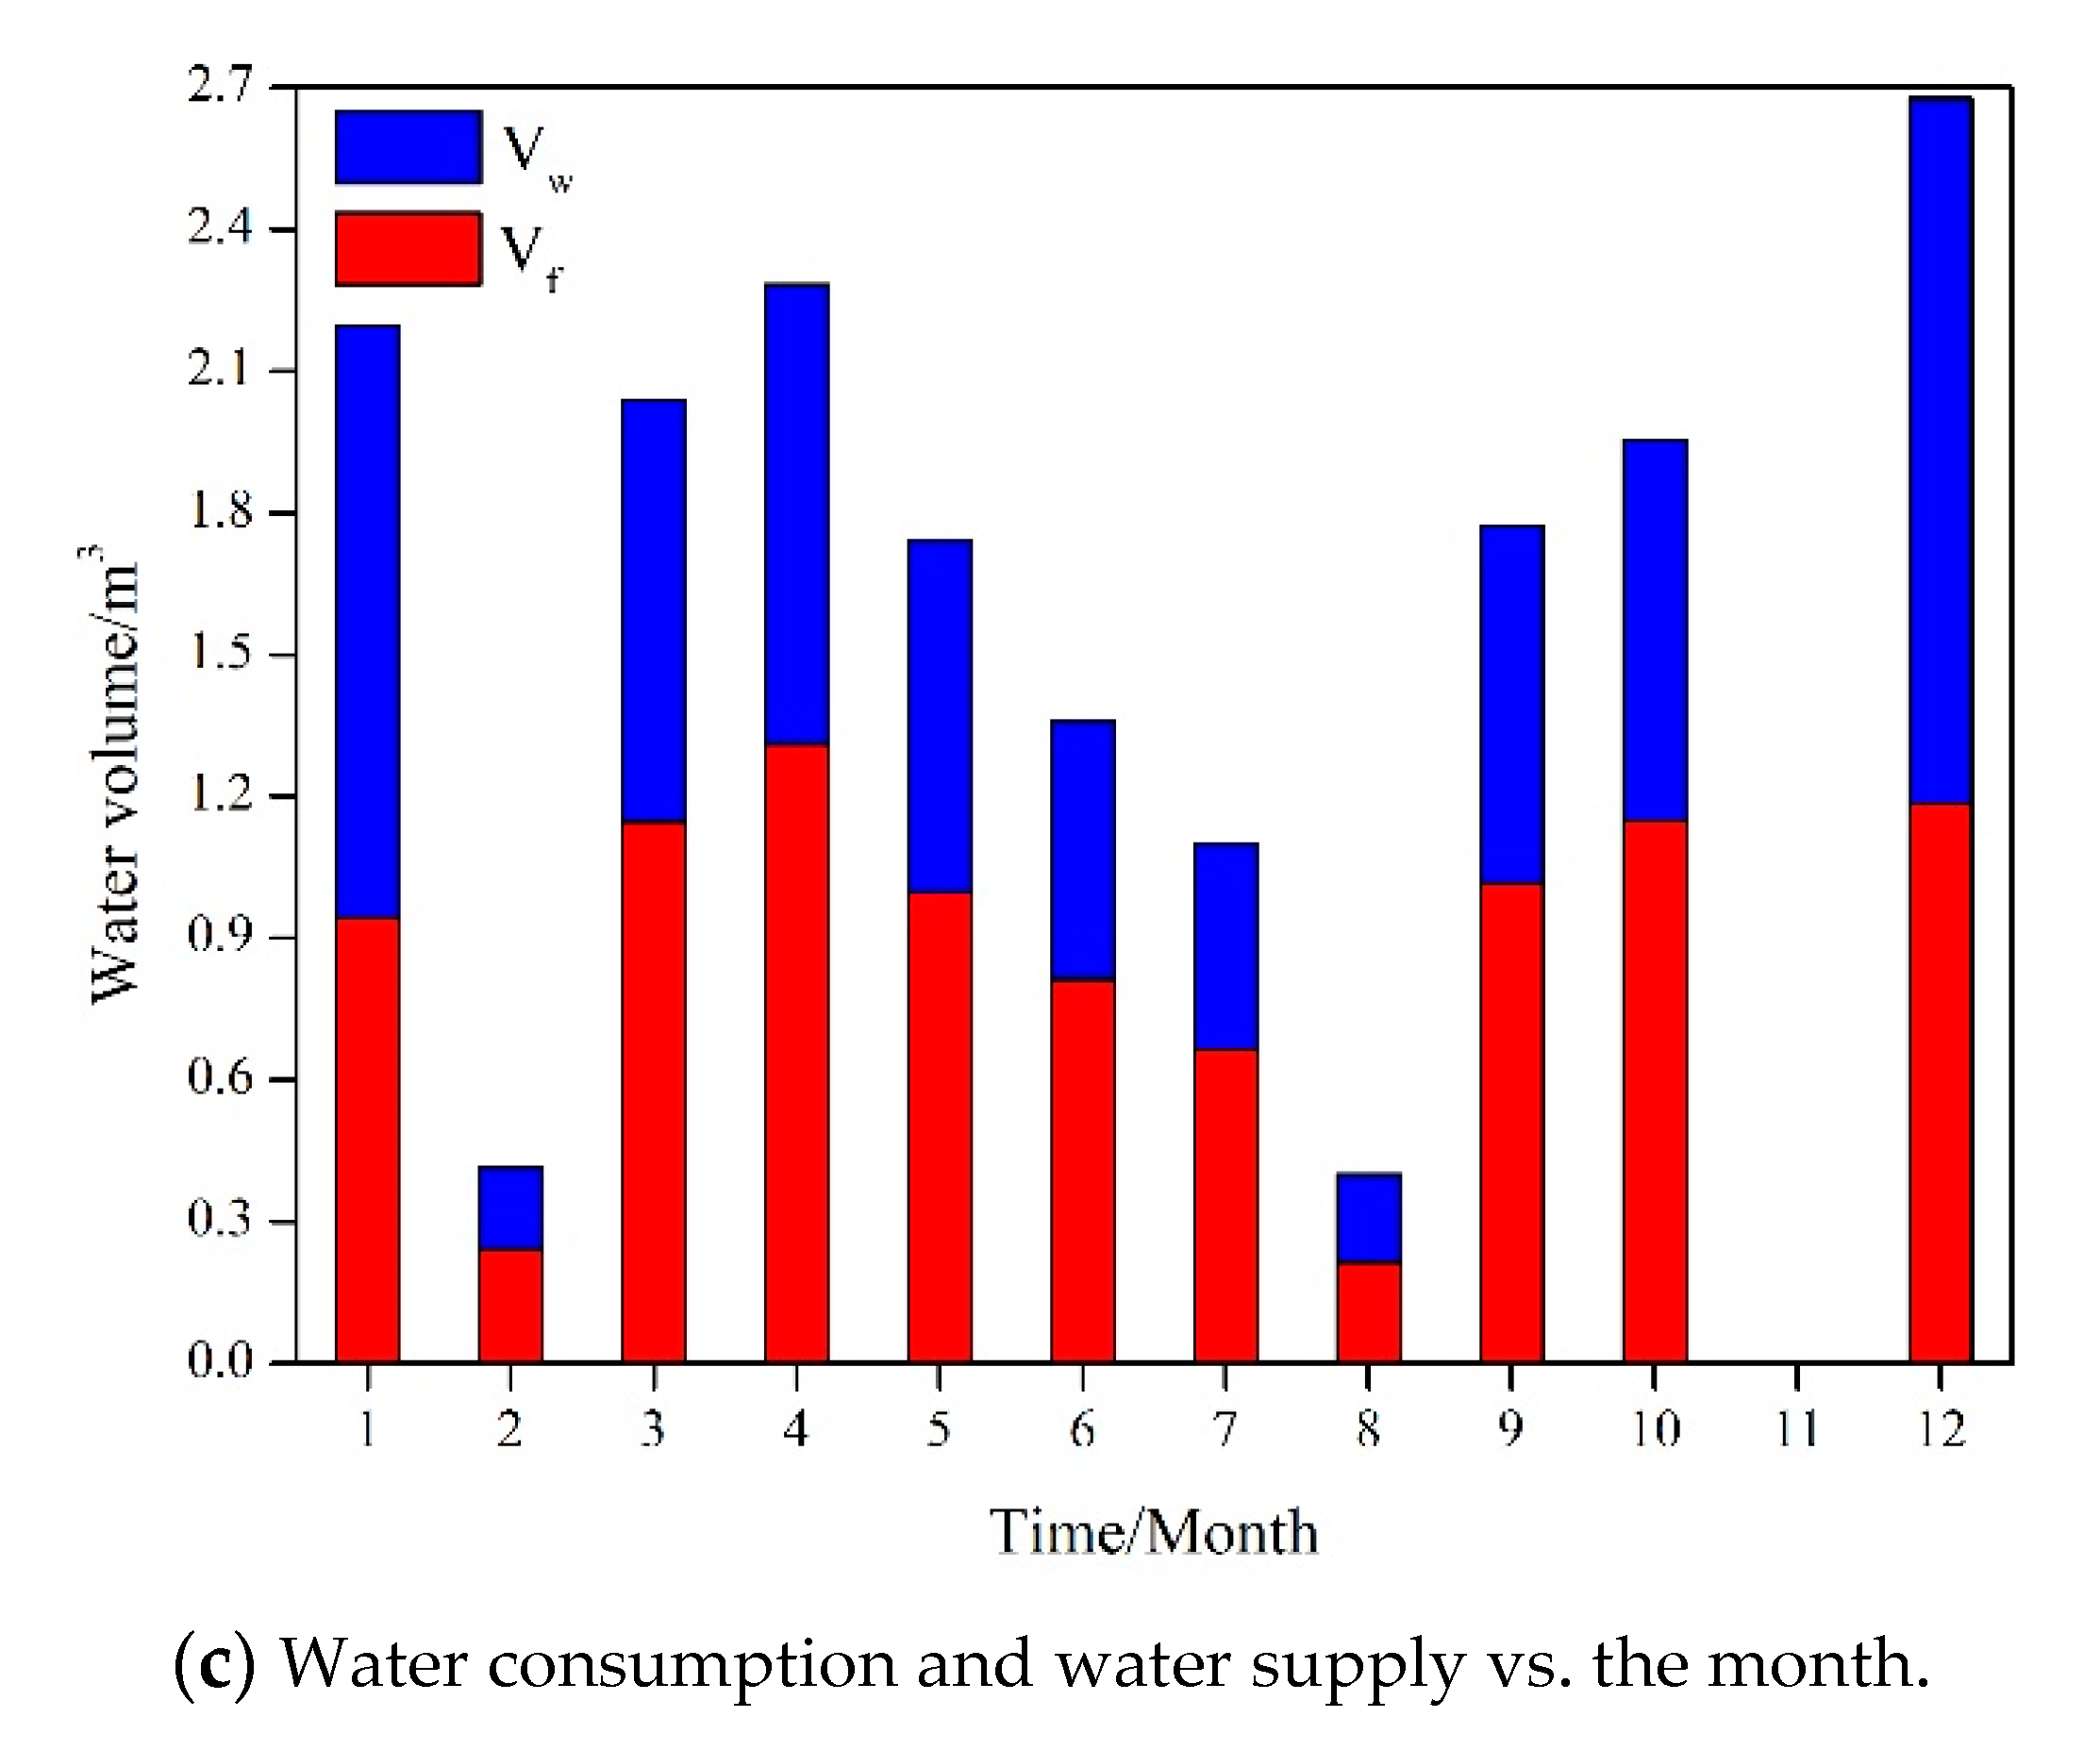
4.4. Annual Performance Analysis of the Hot-Water System

To study the operation performance of the hot-water system further, monthly mean data of each parameter were analyzed. Figure 5 shows the change in monthly parameters. Figure 5a shows the trend chart of the mean variation of the environmental temperature and set thermal efficiency of each month. Both had a tendency to rise first and then peak eventually, which is consistent with the climate of the year. The figure shows the average daily environment temperature reached the lowest values in January, February, and December at 3.07 °C, 3.84 °C, and 3.13 °C, respectively. The corresponding set thermal efficiency was also lower. In July, the environmental temperature and thermal efficiency reached a peak of 31.95% and 48.55%, respectively, because of the high ambient temperature, the low temperature difference between the two collectors, few thermal losses, and high irradiance. Figure 5b shows the energy consumption and heat consumption of the heat and auxiliary heat sources. The figure shows the energy consumption of January and December were the largest, whereas the set of heat was almost zero. The user utilizes the heat provided by the auxiliary heat source with the lowest solar guarantee rate. In February, because of the holiday, hot-water demand was low, and thus the auxiliary heat source was zero. From March to November, the collection of heat was higher than that of the auxiliary heat source and the user’s heat. The hot-water system could meet the thermal demand of the users and achieve its energy-saving purpose. The solar energy guarantee rate was high. In May, July, and August, the auxiliary heat source was zero, and the solar hot-water system could fully meet the demands for hot water. The solar guarantee rate was 100%. Figure 5c is the monthly change value of water supply and water consumption. The figure shows the values of February and August were the lowest because of the lack of hot-water use and the holiday time. Without regard to February and August, the amount of water replenishment and water consumption decreased first and then increased again. It reached the lowest point in July. The colder the weather is, the greater the demand for hot water. The replenishment of each month is slightly larger than water consumption. The specific reasons are explained in Section 4.3.
Table 1 shows the annual performance of the solar hot-water system. In a typical day, the weather with high irradiance was analyzed. The solar heat-cycle system ran from 8:00 to 16:00, but was not run continuously or full time. Table 1 shows the average daily set thermal efficiency could reach 56.63%.

4.5. Analysis of Energy and Emission Reduction of the Hot-Water System

Some subjective or objective factors, such as holidays and hot-water system maintenance, resulted in only 220 sets of experimental data being available throughout the year with a total solar energy of 40,943.47 MJ.
Compared with conventional energy coal, a coal-burning boiler is used as an example. Its coal volume and CO2 emissions are shown in Formulas (4) and (5) [17]:
M coal = Q total q coal ξ coal
M co 2 = 3.67 F Q total q coal ξ coal
where qcoal is the coal calorific value, MJ/Kg, coal is the coal thermal conversion rate, 65%, and F is carbon emission factor, 0.73.
Compared with natural gas, a gas boiler is used as an example, and its gas volume and CO2 emissions are shown in Formulas (6) and (7) [17]:
V gas = Q total q gas ξ gas
M co 2 = 3.67 F Q total q coal ξ gas
where qgas is the natural gas calorific value, MJ/Kg. The conversion rate of the natural gas calorific value is 98%. F represents the carbon emission factor, 0.40.
Compared with electricity, the electric boiler is used as an example. Its energy saving and CO2 emissions are as follows [17]:
Q ele = Q total q ele ξ ele
M co 2 = 3.67 F Q total q coal ξ ele
where qele is the electric heat value, MJ/Kg, the conversion rate of electro thermal value is 80%, and F is the carbon emission factor, 0.87.
The above formula shows that, compared with coal-fired boilers, coal can be saved at 2.15 t per year, which reduces CO2 emission by 5.73 t. Compared with a gas-fired boiler, it can save 1438.43 m3 per year and reduce CO2 emission by 2.59 t. Compared with an electric boiler, it can save 11,605 kWh per year and reduce CO2 emission by 4.53 t.

4.6. Performance Analysis of the Solar Hot-Water System

According to the above analysis, the solar hot-water system can meet the needs of users. However, the auxiliary heat source must be turned on during winter or when no solar energy can be obtained. The system has certain energy-saving and emission-reduction significance because of the direct utilization of solar energy. Based on the analysis of water consumption data, the actual water consumption of the user was found to be lower than the design value: the system calculated 100 L per person a day in the initial design, and the total water consumption calculated on the largest number of users. However, the actual runtime rarely reached full water, indirectly leading to the lack of solar-energy utilization and auxiliary heat-source energy-consumption increase. Therefore, in the initial design of similar or larger solar hot-water systems, the appropriate reduction of water consumption per capita may be considered to utilize solar energy and avoid energy waste. The air source heat pump can also be used as an auxiliary heat source for a large solar water-heating system to make the system highly economical and have a good energy-saving effect. The research results have guiding significance for the joint application of actual solar energy and air-source heat-pump technology.

5. Conclusions

The actual running effect was analyzed through a one-year experimental study of the solar water heating system of a solar hot-water system. A comprehensive evaluation was conducted by analyzing the instantaneous collection efficiency of the hot-water system, the average daily collection efficiency, average monthly collection of thermal efficiency, heat, electric heating, power consumption, and users of the solar hot-water system. The main conclusions are as follows. The ambient temperature or solar irradiance were correlated positively with the thermal efficiency when the solar irradiance or ambient temperature were constant, and the maximum thermal efficiency was 56.63%. The solar heating-collection was unable to meet the heat demand of the users completely, and the auxiliary thermal source was needed in winter. The solar energy could fully meet the heating needs of users, and the guaranteed rate of solar energy was 100% in May, July, and August. User demand for solar hot water was concentrated mainly in the colder months. The energy of the solar water-heating system of coal-fired, gas, and electric boilers was 2.15 t, 1438.43 m3, and 11,605 kWh, respectively; CO2 emission was 5.73, 2.59, and 4.53 t respectively.

Author Contributions

Conceptualization, X.H. and C.L.; Methodology, X.H. and C.L.; Writing original draft preparation, X.H.; Writing-review and editing, H.M. All authors have read and agreed to the published version of the manuscript.

Funding

This research was funded by National science foundation (51806093), Gansu natural science foundation (1508RJZA109) and (JK2017-9), and Lanzhou university of science and technology construction work 77th fund financing project (tj2016).

Institutional Review Board Statement

The paper is not involving the studies of humans or animals.

Informed Consent Statement

Not applicable.

Data Availability Statement

All data included in this study are available upon request by contact with the corresponding author.

Acknowledgments

The authors gratefully acknowledge the financial support provided by national science foundation (51806093), Gansu natural science foundation (1508RJZA109) and (JK2017-9), and Lanzhou university of science and technology construction work 77th fund financing project (tj2016).

Conflicts of Interest

The authors declare no conflict of interest.

References

  1. Dan, N.N.; Smyth, M. Performance analysis and comparison of concentrated evacuated tube heat pipe solar collectors. Appl. Energy 2012, 98, 22–32. [Google Scholar]
  2. Yunfei, Y.; Zhien, Z.; Li, Z.; Changlin, D. Application and utilization technology of solar energy. Acta Energ. Sol. Sin. 2012, 33, 47–56. [Google Scholar]
  3. Kim, Y.D.; Thu, K.; Bhatia, H.K.; Bhatia, C.S.; Ng, K.C. Thermal analysis and performance optimization of a solar hot water plant with economic evaluation. Sol. Energy 2012, 86, 1378–1395. [Google Scholar] [CrossRef]
  4. Manoram, R.B.; Sathiya, M.R. Experimental investigation on energy and exergy analysis of solar water heating system using cobalt oxide based nanofluid. Heat Mass Transf. 2021, 1–16. [Google Scholar] [CrossRef]
  5. Naidoo, A. The socio-economic impacts of solar water heaters compared across two communities: A case study of Cato Manor. Renew. Sustain. Energy Rev. 2020, 119, 109525. [Google Scholar] [CrossRef]
  6. Zambolin, E.; Col, D.D. Experimental analysis of thermal performance of flat plate and evacuated tube solar collectors in stationary standard and daily conditions. Sol. Energy 2010, 84, 1382–1396. [Google Scholar] [CrossRef]
  7. Xiong, D.; Yang, X.; Wang, P. Design and Experimental study of air-water hybrid solar collector. Acta Energ. Sol. Sin. 2017, 38, 1117–1122. [Google Scholar]
  8. Jie, J.; Zhi, Y.; Wei, S.; Haifei, C.; Jingyong, C. Study of multiple solar technologies integrated with building. Acta Energ. Sol. Sin. 2016, 37, 489–493. [Google Scholar]
  9. Dasaien, A.V.; Elumalai, N. Performance enhancement studies in a thermosyphon flat plate solar water heater with CuO nanofluid. Therm. Sci. 2017, 21, 2757–2768. [Google Scholar] [CrossRef]
  10. Kalbande, V.P.; Walke, P.V.; Rambhad, K.; Nandanwar, Y.; Mohan, M. Performance evaluation of energy storage system coupled with flat plate solar collector using hybrid nanofluid of CuO+AlO/water. J. Phys. Conf. Ser. 2021, 1913, 012067. [Google Scholar] [CrossRef]
  11. Xu, R.J.; Zhao, Y.Q.; Chen, H.; Wu, Q.P.; Yang, L.W.; Wang, H.S. Numerical and experimental investigation of a compound parabolic concentrator-capillary tube solar collector. Energy Convers. Manag. 2020, 204, 112218. [Google Scholar] [CrossRef]
  12. Ayompe, L.M.; Duffy, A. Analysis of the thermal performance of a solar water heating system with flat plate collectors in a temperate climate. Appl. Therm. Eng. 2013, 58, 447–454. [Google Scholar] [CrossRef] [Green Version]
  13. Zhang, L.; Pei, G.; Zhang, T.; Ji, J. A new photovoltaic solar-assisted loop heat pipe/heat-pump system. J. Chem. Ind. Eng. 2014, 65, 3228–3236. [Google Scholar]
  14. Zou, X.; Zhou, J.; Deng, X.; Zhang, G. Research on optimal matching of solar-assisted ground-coupled heat pump domestic hot water system. Acta Energ. Sol. Sin. 2017, 38, 1281–1290. [Google Scholar]
  15. Wang, G.; Zhao, Y.; Quan, Z.; Tong, J. Application of a multi-function solar-heat pump system in residential buildings. Appl. Therm. Eng. 2018, 130, 922–937. [Google Scholar] [CrossRef]
  16. Prodanuks, T.; Veidenbergs, I.; Kirsanovs, V.; Kamenders, A.; Blumberga, D. Analysis of Energy Supply Solutions of Dwelling Buildings. Environ. Clim. Technol. 2019, 23, 182–189. [Google Scholar] [CrossRef] [Green Version]
  17. Zheng, R. Technical Guidebook for Solar Water Heating System of Civil Buildings; Chemical Industrial Press: Beijing, China, 2011. [Google Scholar]
Figure 1. Diagram of the solar water-heating system.
Processes 09 01536 g001
Figure 2. The relationship among solar irradiance, ambient temperatures, and thermal efficiency.
Processes 09 01536 g002aProcesses 09 01536 g002b
Figure 3. The relationship among solar irradiance, ambient temperatures, and thermal efficiency.
Processes 09 01536 g003
Figure 4. Change of each index in April.
Processes 09 01536 g004aProcesses 09 01536 g004b
Figure 5. Average index in a day that varies every month.
Processes 09 01536 g005aProcesses 09 01536 g005b
Table 1. Annual operating parameters.
DateTa/°CH/W·m2Q/MJQp/MJQr/MJVf/m3VW/m3η/%
9 January 20156.30607.0022.88464.4222.621.561.9522.03
27 January 2015 0.10662.6039.91320.04129.601.151.1020.66
31 January 20152.50648.7078.3866.5234.750.290.4320.76
3 February 20155.70425.00106.10018.7300.3124.33
5 February 20155.80634.90160.0804.590.560.04424.69
21 March 201517.20756.90329.780219.932.172.8334.40
24 March 201513.60689.30257.5763.8465.590.620.5030.99
25 March 201514.90545.10205.370139.521.021.1133.16
7 April 201512.20776.80386.280136.411.181.1037.15
14 April 201522.70710.70473.560125.212.350.9346.01
25 April 201528.80636.30439.74058.961.090.5049.95
20 May 201529.00688.00425.590133.620.840.8744.95
25 May 201531.30577.30374.360183.661.351.2546.06
14 June 201532.50641.50190.49000056.63
15 June 201529.50384.20261.640158.941.311.1447.53
16 June 201531.50472.60349.43043.990.330.3948.33
6 July 201529.90534.00308.68097.030.860.6449.87
13 July 201538.50618.90271.03085.530.570.5150.83
5 August 201531.50457.20287.92023.160.340.2042.12
9 August 201533.10548.40258.01000.11042.20
2 September 201530.70682.20428.31054.043.170.6946.15
8 September 201526.90433.30227.46057.250.640.4942.56
20 September 201525.10439.10179.18000035.41
2 October 201525.00718.50325.1709.370.320.1035.27
18 October 201518.50413.60125.8779.7422.840.590.2630.81
4 December 20155.80584.9075.91375.48299.452.272.6723.19
11 December 20155.90515.4068.72255.36212.101.591.6926.33
28 December 20151.50473.6029.91434.19179.260.861.2723.12
Publisher’s Note: MDPI stays neutral with regard to jurisdictional claims in published maps and institutional affiliations.

