Article

Continuous Cooling Crystallization in a Coiled Flow Inverter Crystallizer Technology—Design, Characterization, and Hurdles

BCI Equipment Design, TU Dortmund University, Emil-Figge-Straße 68, 44227 Dortmund, Germany
*
Authors to whom correspondence should be addressed.
Processes 2021, 9(9), 1537; https://doi.org/10.3390/pr9091537
Submission received: 15 July 2021 / Revised: 10 August 2021 / Accepted: 26 August 2021 / Published: 29 August 2021
(This article belongs to the Special Issue Continuous Crystallization Processes and Product Design)

Abstract

:
Continuous small-scale production is currently of utmost interest for fine chemicals and pharmaceuticals. For this purpose, equipment and process concepts in consideration of the hurdles for solids handling are required to transfer conventional batch processing to continuous operation. Based on empirical equations, pressure loss constraints, and an expandable modular system, a coiled flow inverter (CFI) crystallizer with an inner diameter of 1.6 mm was designed. It was characterized concerning its residence time behavior, tested for operation with seed crystals or an ultrasonic seed crystal unit, and evaluated for different purging mechanisms for stable operation. The residence time behavior in the CFI corresponds to ideal plug flow behavior. Crystal growth using seed crystals was demonstrated in the CFI for two amino acids. For fewer seed crystals, higher crystal growth rates were determined, while at the same time, secondary nucleation was observed. Feasibility for the interconnection of a sonicated seeding crystal unit could be shown. However, the hurdles are also identified and discussed. Prophylactic flushing combined with a photosensor for distinguishing between solvent and suspension phase can lead to stable and resource-efficient operation. The small-scale CFI technology was investigated in detail, and the limits and opportunities of the technology are presented here.

1. Introduction

For bulk chemical crystallization, the continuous operation mode is most commonly used [1,2,3]. In contrast, the fine chemical and pharmaceutical industry often prefer the batch mode because of the smaller amount of production [1,2,3]. However, the continuous mode has some main advantages, such as consistent quality, because no batch-to-batch fluctuations are present [1,2,4]. Additionally, the energy efficiency is mostly higher than batch processes, because the energy demand is continuous, and no high energy peaks are necessary; hence, energy integration is more accessible [1]. In recent years, various equipment concepts were developed for continuous small-scale crystallization to overcome these weaknesses, especially to cope with hurdles regarding (online) analysis techniques and solid handling problems for small-scale crystallizers. One of the most common quality characteristics used in the crystallization process is the crystal size distribution (CSD). It can influence the kind and number of post-processing steps and the crystal quality [5].
Since the equipment becomes smaller, it is easier to intensify the processes by using ultrasonication [6,7,8]. The main advantage of ultrasound-assisted crystallization is the influence of CSD [9,10,11,12,13,14,15], narrowing metastable zone width (MZW) [16,17,18] and reducing clogging [19,20,21]. Furthermore, the mixing can be increased [22] without additional inserts, such as stirrers, which can present unwanted heat exchange surfaces (cooling bridge). Besides narrowing the MZW [17], ultrasound is used and investigated as a nucleation source to generate seed crystals [23,24,25]. Ultrasound has the benefit that no impurities can enter the system with introduced seed crystals [26,27].
A distinction is made between the stirred tank and the plug flow crystallizer for the continuous small-scale crystallizers. The Multistage Continuous Mixed-Suspension, Mixed-Product Removal (MSMPR) [4,28,29,30,31,32,33], Taylor–Couette [32,34,35], or Draft Tube Baffle (DTB) [36,37] crystallizers belong to the stirred tank crystallizers. The oscillatory baffled crystallizers [32,38,39] and coiled tube crystallizers belong [40,41,42,43,44,45] to the plug flow crystallizers. Nice overviews of different crystallizer technologies are given in References [3,32,40]. The crystallizer introduced in this work belongs to the coiled tube crystallizers. Therefore, the main equipment concepts regarding this type are introduced in the following.
Next to the apparatus concept, also the driving force for crystallization can be different. Only cooling crystallization in coiled tubes is described in the following, although some investigations about precipitation and anti-solvent crystallization in tubular crystallizers have been performed [14,46,47,48,49]. One of the first investigations for cooling crystallization in a mini-channel tubular crystallizer (batch mode, inner diameter d i 1.6 mm, length L 7.6 m and flow rates of 10.8 to 47.2 mL min−1, and tube-in-tube heat-exchange concept) were performed by Méndez del Río and Rousseau with paracetamol in ethanol or methanol to influence the crystal size distribution and morphology compared to stirred batch crystallization experiments [50]. Eder et al. [23,41,51] created a fundamental basis for continuous cooling crystallization in coiled tube crystallizers. As a model substance, acetylsalicylic acid in ethanol was used [23,41,51]. The crystallizer consists of a polysiloxane tube with a 2 mm inner diameter, and for the process, seed suspension was continuously mixed with a slightly undersaturated solution before the crystallization process itself [23,41,51]. Their first proof-of-concept investigated different mass flow rates (11.4–25.2 mL min−1) and the resulting change in residence time [41]. They already found out that flow rates that are too small lead to clogging [41]. Further, they investigated the effect of different seed loadings, and, as expected, higher seed mass led to less particle growth because more crystals to grow on were available [51]. Later, J.G. Khinast’s group realized a model-free control strategy for crystal size tuning in almost the same setup, but they used a round-bottom flask in an ultrasound bath to form seed crystals instead of prepared seed crystals in a suspension tank [24]. Additionally, they implemented a prophylactic rinsing concept by rinsing every 10 min for 2.5 min with pure solvent, so the process ran for five time slots (one hour) [24].
Our research group further specified the coiled configuration to a coiled flow inverter (CFI) design [52] to achieve better mixing than a helical structure [53]. Hohmann et al. started with a polyvinyl chloride tubing [52] and later changed to a fluorinated ethylene propylene (FEP) tube [42], which decreased the tendency to clog. A 6.5 m–long CFI with an inner diameter of 4 mm was investigated [42,52]. It was shown that the CFI design offers residence time behavior nearly to ideal plug flow [42,52,54]. Further, it was observed that different process conditions, such as mass flow rate, lead to different flow regimes [42,54]. The most effective and trouble-free operation is possible if homogenous suspension flow is applied instead of moving sediment [42,54]. Furthermore, a scale-up of the CFI was constructed and tested in a continuous downstream miniplant [55]. The inner pipe diameter was 10 mm, formed of stainless steel, and 23.5 m in length [55]. The same substance system l-alanine in water was used for both CFI crystallization investigations [42,55]. Next to the scale-up, a scale-down to an inner diameter of 1.6 mm was performed [56]. All three CFI crystallizers are constructed based on the CFI design in a horizontal direction of the coil axes but differ in temperature control, configuration structure, and other details. The scaled-down CFI is characterized in detail in this work.
Wiedmeyer et al. investigated a vertically helically coiled tube crystallizer for continuous cooling crystallization with the model substance potassium alum dodecahydrate in water [43,57,58]. A polysiloxane tube was coiled with an inner diameter of 6 mm and a tube length of 34 m. It was found that the potash alum crystals have a size-dependent residence time, which leads to classifying behavior in the tube crystallizer [43]. A time-dependent secondary flow was observed in a numerical simulation, possibly responsible for the classifying effect [43]. In their crystal growth experiments, the distribution width remained constant [43].
To ensure stable operation without clogging, slug flow is often used in coiled tubular crystallizers. Here, a second immiscible phase, mostly air, is inserted, alternating between both phases. With slug flow, the homogenous flow conditions do not have to be fulfilled for stable operation. Investigations with slug flow were made regarding protein crystallization [59,60], alternating temperature profiles [45,61], product quality [44,62], nucleation without ultrasound [63], and nucleation with ultrasound [23,64].
Sonocrystallization is another current topic for small-scale crystallization. The mechanisms of sonocrystallization in solution, influencing parameters, and overview of continuous sonocrystallization in capillaries are given in References [9,25,65]. The primary influence of ultrasound on crystallization processes and nucleation are reduction of MZW [17] and induction time [66], influence on the polymorphic form [16,67,68,69], and particle size [9,10,11,12,13,14,15]. In this work, nucleation was continuously performed in an ultrasonic bath, and nucleation supersaturation thresholds were already investigated in detail for the used model system [25]. The chosen setup is most similar to Eder et al. [23]; however, no slug-flow or mixing with the undersaturated solution is applied. However, both concepts create the nuclei continuously in a coiled tube inserted in an ultrasonic bath, followed by coiled tubes for crystal growth. Others use ultrasonic baths as an anti-plugging strategy to improve the crystal growth for lab and pilot-scale [19,20].
In this work, the performance of the scaled-down CFI crystallizer [56] was evaluated with two different amino acids (l-alanine and glycine in water). In this paper, first a short description of the construction approach is summarized, and then the setup and the process conditions, analytical methods, and experimental procedure are presented. Regarding the results, first the residence time behavior is described and evaluated. Afterward, the crystal growth investigations for both amino acids are analyzed. Two anti-plugging strategies are introduced, and tested. Regarding the analysis, a non-invasive sensor to detect whether suspension or solvent was flowing was implemented, and a low-cost concept with a digital camera on a microscope equipped with a glass measurement-cell enabled non-invasive inline observation of the crystals [25,70]. A feasibility study about the connection of nucleation in an ultrasonic bath connected with a crystal growth part in the CFIC is here described, and hurdles are presented in detail. Finally, the experiments from the known literature are compared to evaluate the performance of the introduced crystallizer. The main goal of this work is to close the knowledge gap concerning the CFI technology [71] regarding scale-down, so it can be used for lab-scale process screening or small-scale production. In the long-term, these investigations help to get a thorough knowledge about coiled flow inverter crystallizers with their application opportunities and hurdles to gain higher technology readiness levels and a broader application range.

2. Materials and Methods

2.1. Substance Systems

When water is referred to in this paper, it means deionized water (<10 µS cm−1), and physical properties for water are taken from Reference [72]. Two amino acids in water were chosen as the model substance system. For the residence time studies and nucleation studies with crystal growth (combination), l-alanine (purity ≥ 99.6%, Evonik Rexim (Nanning) Pharmaceutical Co., Ltd., Wuming District, Nanning, China)) was used. For the crystal growth experiments with seed crystals, l-alanine from Carbolution Chemicals GmbH, (St. Ingbert, Germany) (purity 98%) and glycine (purity ≥ 98%, VWR International, Radnor, PA, USA) were used for the preparation of the solution and the seed crystals. For l-alanine/water, the physical properties were determined as described in Reference [42] based on the experimental data of References [73,74,75]. The same calculation method was applied to determine the physical properties for glycine/water based on the experimental data by Reference [75] (see Appendix A, Figure A1). The solubility line of l-alanine/water [76] and glycine/water can be taken from Appendix A. The solid density of l-alanine 1.375 g cm−3 [77] is slightly lower than glycine 1.640 g cm−3 [78]. Both are assumed to be constant for the experiments and evaluation.

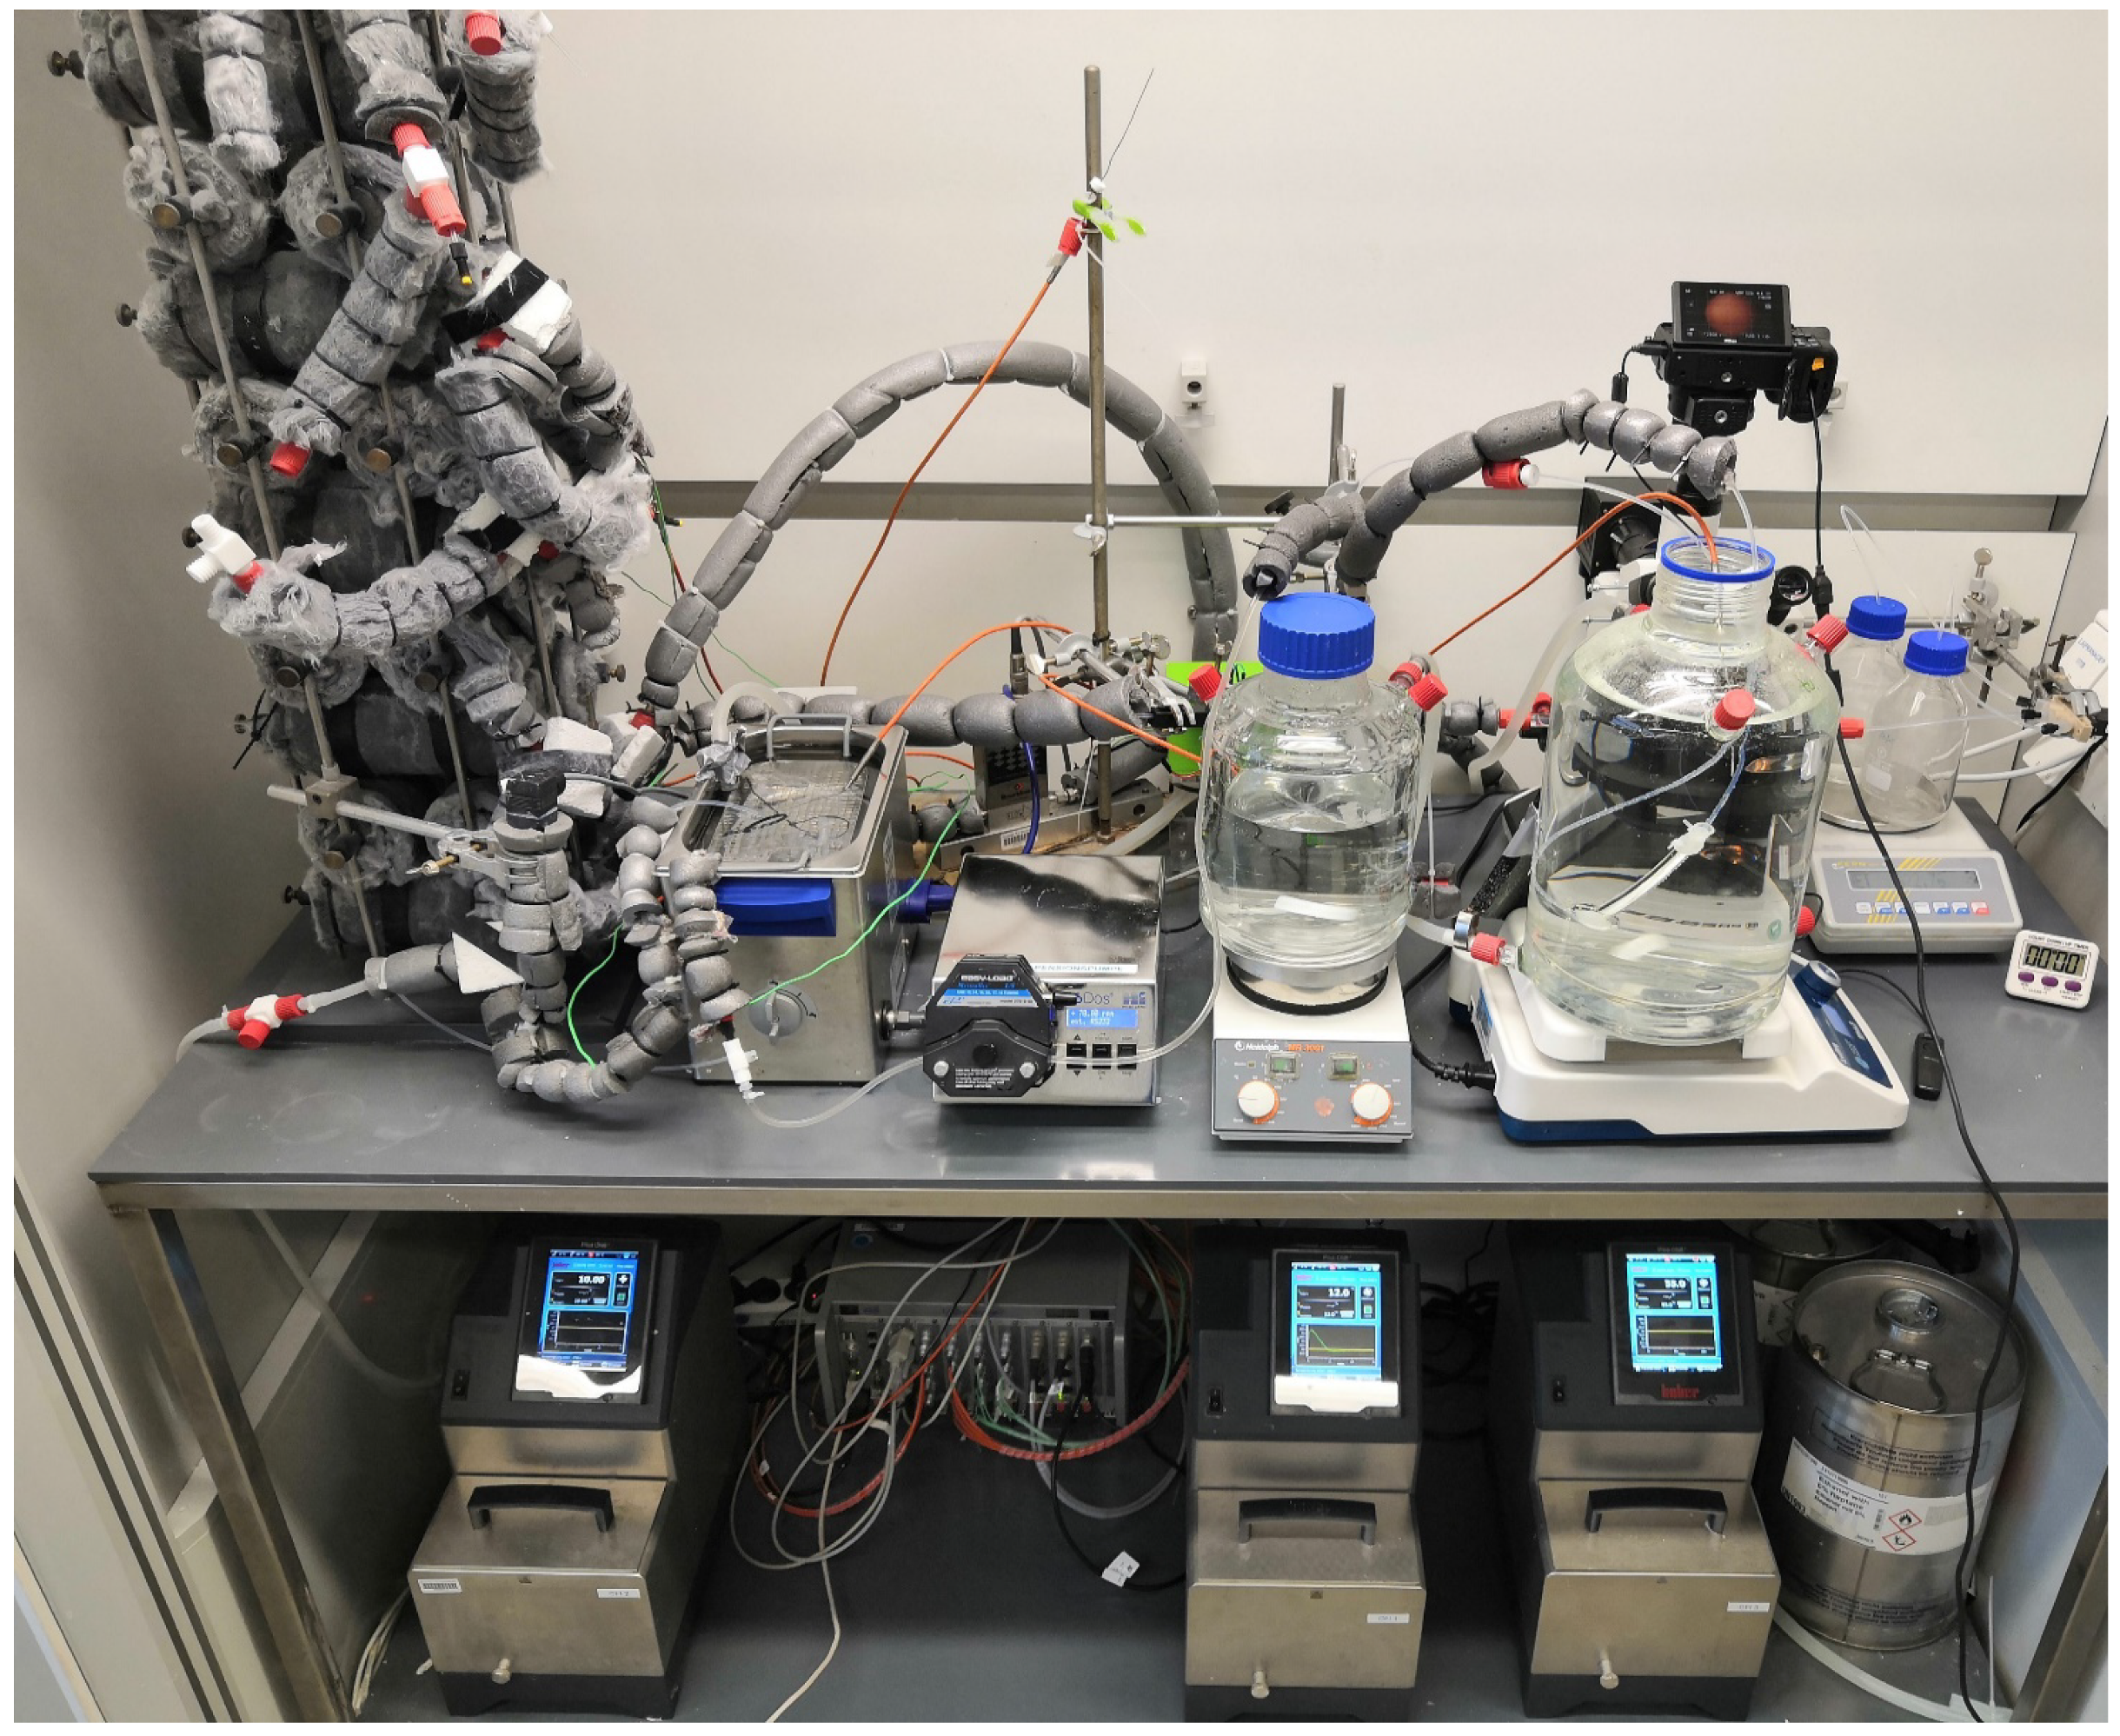
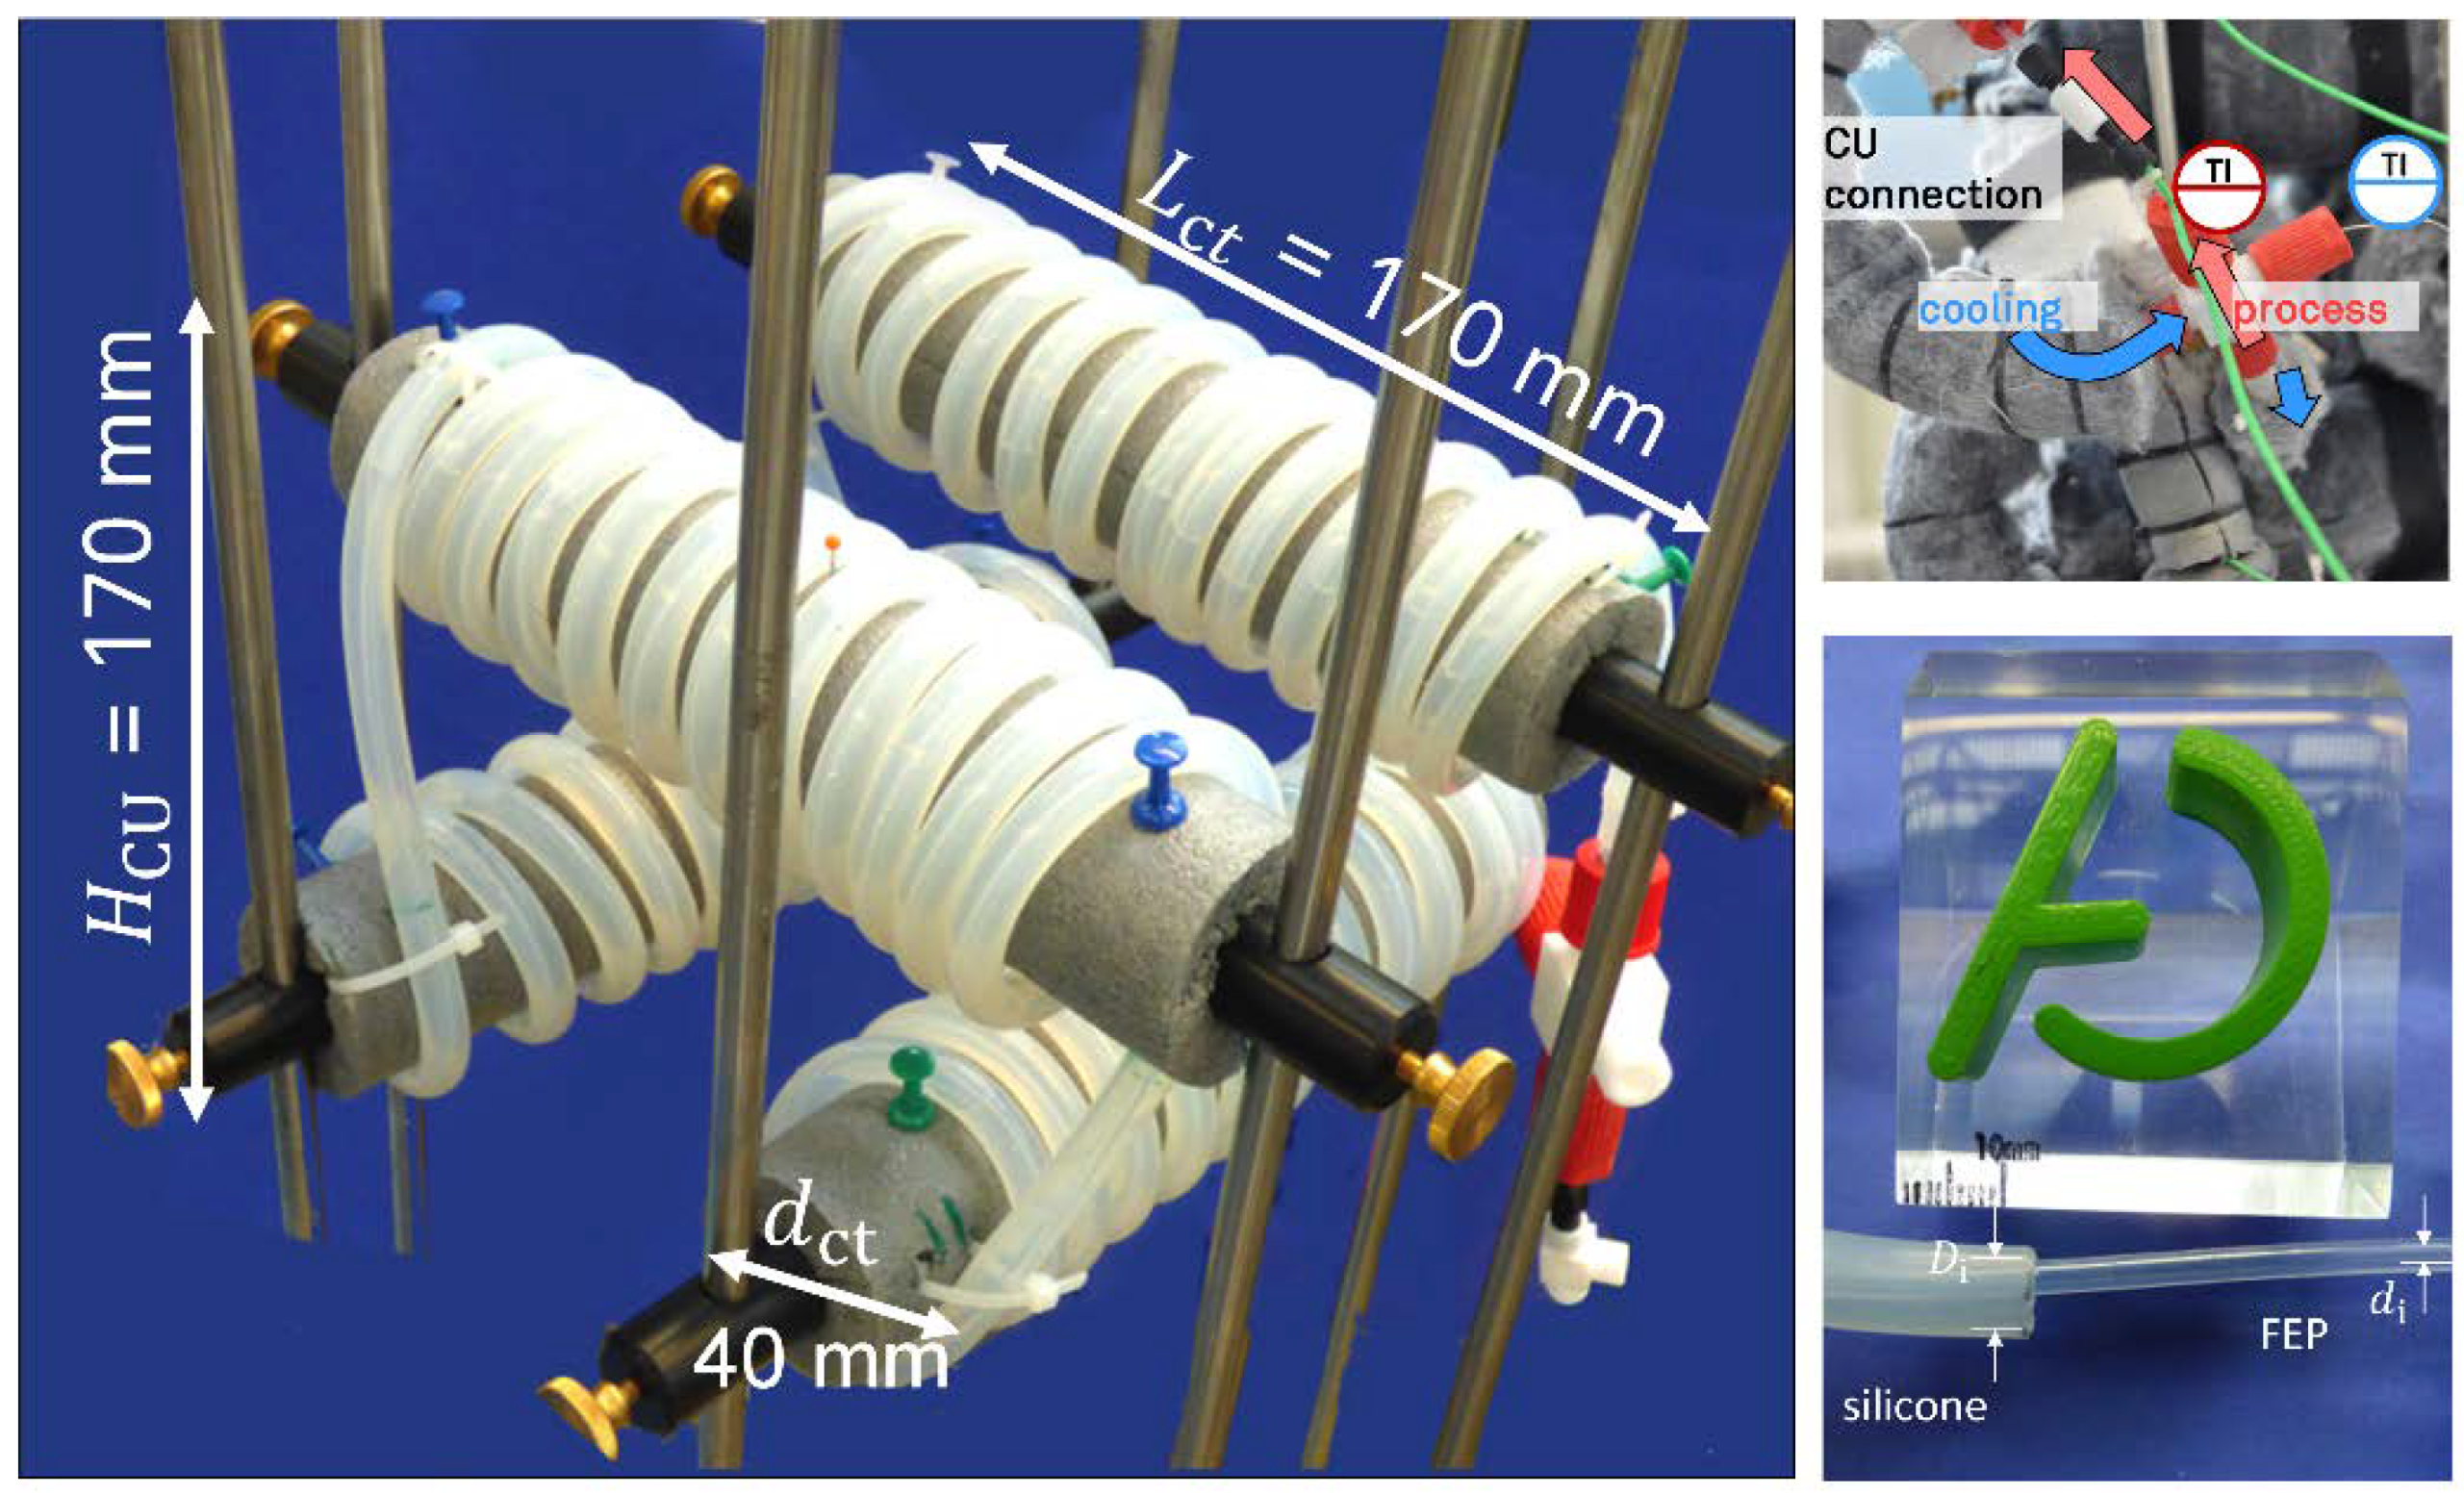
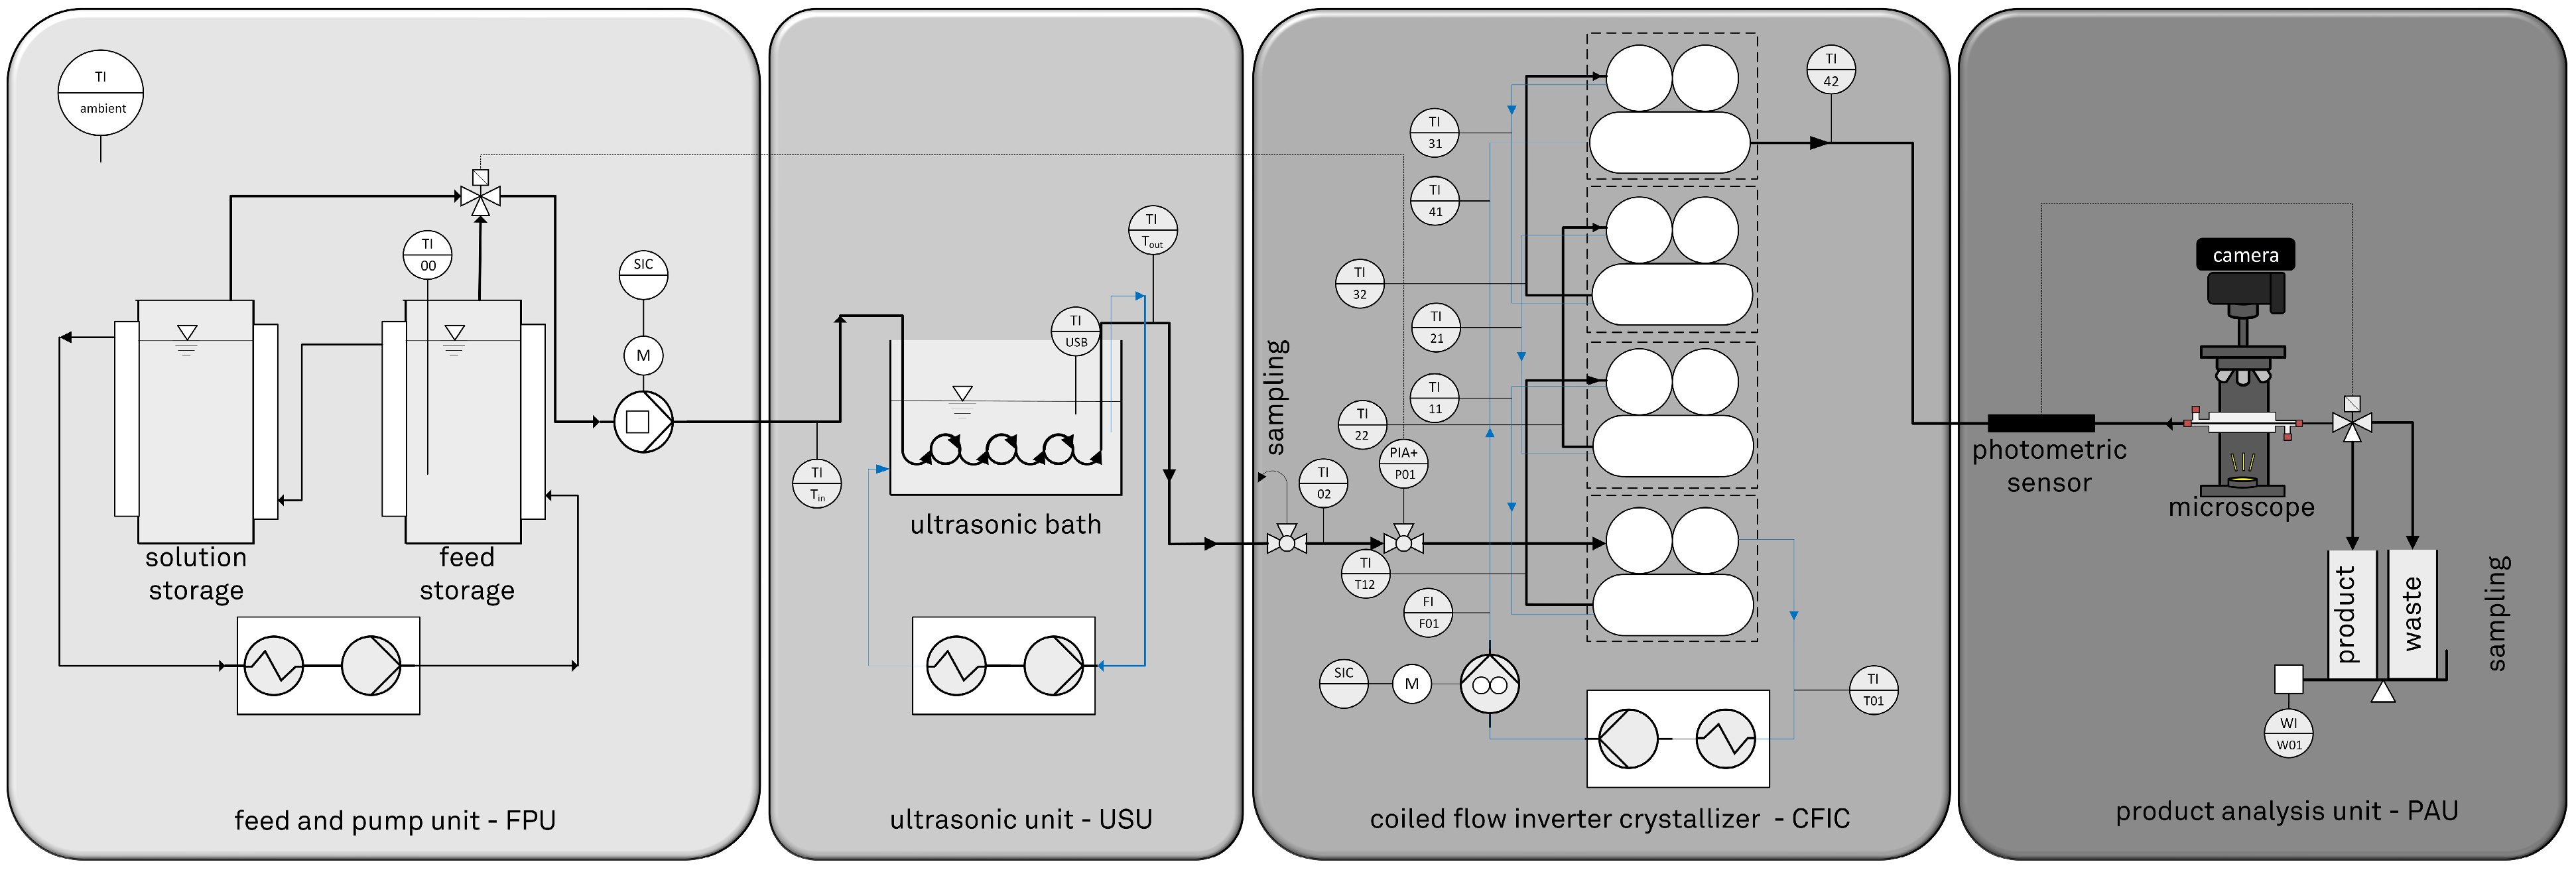
2.2. Design, Setup, and Process Parameters

For the design of a CFI reactor, many studies have already been performed [46,79,80]. The minimum number of coils and 90° bends [81], type of coil configuration [46], and scale-up methods have been studied [82], among others. However, when using solids, the essential design criterion is ensuring a homogeneous suspension flow, avoiding clogging, and maintaining consistent mixing of the crystals [54]. An empirically developed correlation can be used to estimate if the selected mass flow rate is sufficiently high to guarantee the required particle size and quantity to a homogeneous suspension flow [54]. For this purpose, the critical Froude number ( Fr d , crit ) is determined for the transition range from sedimenting flow to homogeneous suspension flow, according to Equation (1), for coiled capillaries [54]. In the previous study, the mentioned transition region was investigated with the main influencing variables of Reynolds number ( Re ) and particle mass fraction ( w s ), but the effect of pulsation characteristics of the pump can be neglected [54] in the investigated flow regimes. Nevertheless, pulsation can influence the flow behavior; for example, pulsed streaming improves the cleaning of whey protein deposits [83]. However, since the same pump is used here, as in References [42,54], the influence of pulsation is not further considered here, since the primary influence on the pulsation behavior is due to the pump head design.
Fr d , crit = 0.252 ·   Re 0.717 · ( 1 w s ) 4.564
With the addition of the classical definition of the densimetric Froude number ( Fr d ) (Equation (2)), the maximum possible particle size can be determined for ensuring homogeneous suspension flow [54].
Fr d = u ¯ 2 x 50 , 3   g · ρ L Δ ρ SL
Since the apparatus was designed for the process development, the suspension flows should be as small as possible, and this can only be achieved with relatively small internal tube diameters. For further design, different limiting cases were considered. For example, for the limiting cases, d i 1.6 mm, T ¯ = 20 °C for the substance system l-alanine/water (see Section 2.1), and solid weight fraction of 1 or 10 w.%, the maximum crystal size to be transported for homogeneous suspension flow at 16 g min−1 is 382 or 219 µm, respectively. The calculated cases are also in agreement with tests from Hohmann et al. [54]. After determining a suspension flow and the inner tube diameter, the pressure loss limits the length (Equation (3)), which can be overcome by using the used pump. The process pump chosen here is a LabDos® Easy-Load (HiTec Zang GmbH, Herzogenrath, Germany), which can overcome up to 2 bar pressure drop. Further investigations on the pressure loss in the CFI can be found in References [25,56].
Δ p = f   ρ L 2 d i u ¯ 2
The exact design setup of the CFIC can be taken from Reference [56]. For further understanding, it is crucial to know that a tube-in-tube design was chosen as the heat-transfer concept (process tube made of FEP, inner diameter 1.6 mm, outer silicone tube with an inner diameter of 6 mm). FEP was chosen because our group had a better experience [42] with this material instead of polyvinyl chloride tubing [52]. Investigations from the literature also suggest that the influence of a fluorinated polymer is lower regarding adhesion and clogging than silicones [84]. The crystallizer consists of up to seven identical crystallization units (CUs; see Figure 1) to be extended as required. Each of these CUs is wound in the cross-twin configuration and has a length of 7.8 m with four bends [56].
The whole plant consists of four units (see Figure 2), which would correspond to four Functional Equipment Assemblies (FEAs) according to the modular concept [85]. The first (PFU) includes the feed tanks and the process pump; the second (USU) is a seed crystal unit, where a CFI-designed coiled tube is immersed in an ultrasonic bath. The third FEA is the CFIC, whose design procedure has been described previously. It ends with an analysis unit (PAU) containing a photometric sensor, a flow cell and a microscope with a camera [25], a magnetic valve, and collecting vessels. A photo of the setup is shown in Figure A2.
The FPU and USU are almost identical in design, as described in Reference [25]. The main components of the FPU are two storage tanks, one containing solvent (water) and the other the feed, thus defined suspension or saturated solution (see Appendix A). For the FPU, only for some experiments, the manual three-way valve was replaced by a magnetic three-way valve (3/2-way 6626 TwinPower, Bürkert GmbH, Ingelfingen, Germany). The USU was unchanged from Reference [25], with the process tubing (FEP, d i 1.6 mm) coiled in CFI design in an ultrasonic bath (Elmasonic S30H, Elma Schmidbauer GmbH, Singen, Germany).
As already mentioned, the FEA CFIC consists of seven identical CUs. In the experiments described here, only four or two CUs were used (number.CU = 4 or 2). As in Reference [56], the individual CU was not insulated with Polyethylene (PE) foam, but with Spaceloft® (Aspen Aerogels, Inc., Northborough, MA, USA), since it provides better insulation and should reduce the influence of the environment on the process. For better process monitoring, a thermocouple (type-K, OMEGA Engineering, Norwalk, CT, USA) was also applied to the process tube after each CU at the connection between the CUs (see Figure 1). As already described in Reference [25], this temperature is corrected according to Equation (4). Moreover, an invasive temperature measurement in the process medium is not possible due to the small process tube and avoiding clogging. The temperature of the cooling mass flow, on the other hand, can be recorded in direct contact with the cooling agent with (Pt-B-100-2, RÖSSEL-Messtechnik GmbH, Werne, Germany) temperature sensors at the connection points from CU to CU.
T L [ ° C ] = 1.1774 · T surface [ ° C ] 3.9049
A photometric sensor and a magnetic valve have been added to the PAU in deviation from the setup in Reference [25]. The design of the photosensor for the detection between suspension and solution is described in Section 2.4.4 and in detail in Reference [86]. The magnetic valve in connection with the photosensor enables a separation between suspension and solution. Further, the PAU contains a microscope equipped with a camera and a self-designed glass flow cell [25,70]. The devices and sensors used are listed in more detail in Appendix A Table A2. The single FEAs can be interconnected individually. Thus, for the combination experiments (nucleation and crystal growth), all FEAs were used. FPU, CFIC, and PAU were used for the crystal growth experiments, and for the analysis of feed seed crystals, only FPU and PAU were used.

2.3. Analytics

For the thermogravimetric method, two different types of samples were taken to determine the solved and solid weight fraction concentration. Small samples (around 1.5 mL) were taken with suspension (SL) or only of the solution (L) (with syringe pre-filter). The samples were weighed in the liquid and dried state. The mass fraction w i is determined from the difference in the empty sample weight, which in turn is converted into a mass loading, X i . With the aid of this, the solids content or soluted concentration can be determined. The relative yield, which describes the attainment of the solubility line, can also be determined by using Equation (5). A detailed description of the method is given in Reference [37] and has already been used for crystallization investigations [25,42,54].
Y rel = X i , L , in X i , L , out X i , L , in X i , L , out *
Two different analytical methods were used to determine the crystal size and distribution: sedimentation and image analysis. The sedimentation method, in a time- and spatially resolving spectrometer (LUMiReader® PSA, LUM GmbH, Berlin, Germany), requires density and viscosity information to calculate the crystal size distribution via software (SepView® 6, LUM GmbH, Berlin, Germany) based on the Lambert–Beer law and Stoke’s law. The analyzed suspension samples were directly taken after the flow process into the polycarbonate cuvettes (PC, 3 mL, LUM GmbH, Berlin, Germany), lightly rocked back and forth in hand for homogenization, and directly measured at needed temperature (initial temperature or process end temperature). This method has already been successfully used for l-alanine in saturated water and is limited to crystals smaller than 300 µm in order to be able to exclude sedimentation that is too fast [42,54,70].
Image analysis is a further analytical method that was used. Therefore, a measurement flow-cell was constructed [70] to determine the projection area of the crystals non-invasively with a microscope (Bresser Science ADL 601P, Bresser GmbH, Rhede, Germany) and an attached camera (Z6, Nikon GmbH, Tokyo, Japan). A routine developed based on the algorithms by References [87,88] was used to determine the projection area and calculate the circular area equivalent diameter. The exact method and its evaluation are given in Reference [70]. This method was already used in References [25,37].
For the crystal growth experiments with l-alanine, the sedimentation method was used to compare the results with the investigations conducted by Hohmann et al. [42]. Additionally, this method ensures the evaluation of all particles, inclusive of aggregates and agglomerates. The non-invasive offline image analysis was used for the nucleation and crystal growth combination for l-alanine. This analytic was chosen to ensure that no further crystal growth takes place due to non-reduced supersaturation. After all crystal growth experiments, seed crystal suspension was led directly after the feed pump (FPU) into the PAU to take photos of the seed and determine the crystal size or evaluate the crystals qualitatively. Hence, it could be ensured that the same analytical methods were used to determine seed and product crystals.

2.4. Experimental Procedure

The respective solubility line (see Appendix A) was used to prepare a saturated solution. If seed or tracer crystals were needed, the crystals were dry-pestled and sieved manually before adding them to the saturated solution. Detailed experimental preparation regarding saturated solution or suspension for each kind of investigation can be found in Appendix A. To give a first overview about all experiments, the sample name, kind of investigation, and main set point information about the used seed/tracer particles are given in Table 1. “RTD” is used for residence time distribution investigations, crystal growth experiments are abbreviated with “CG”, and the combination of nucleation and crystal growth is named “combi”.

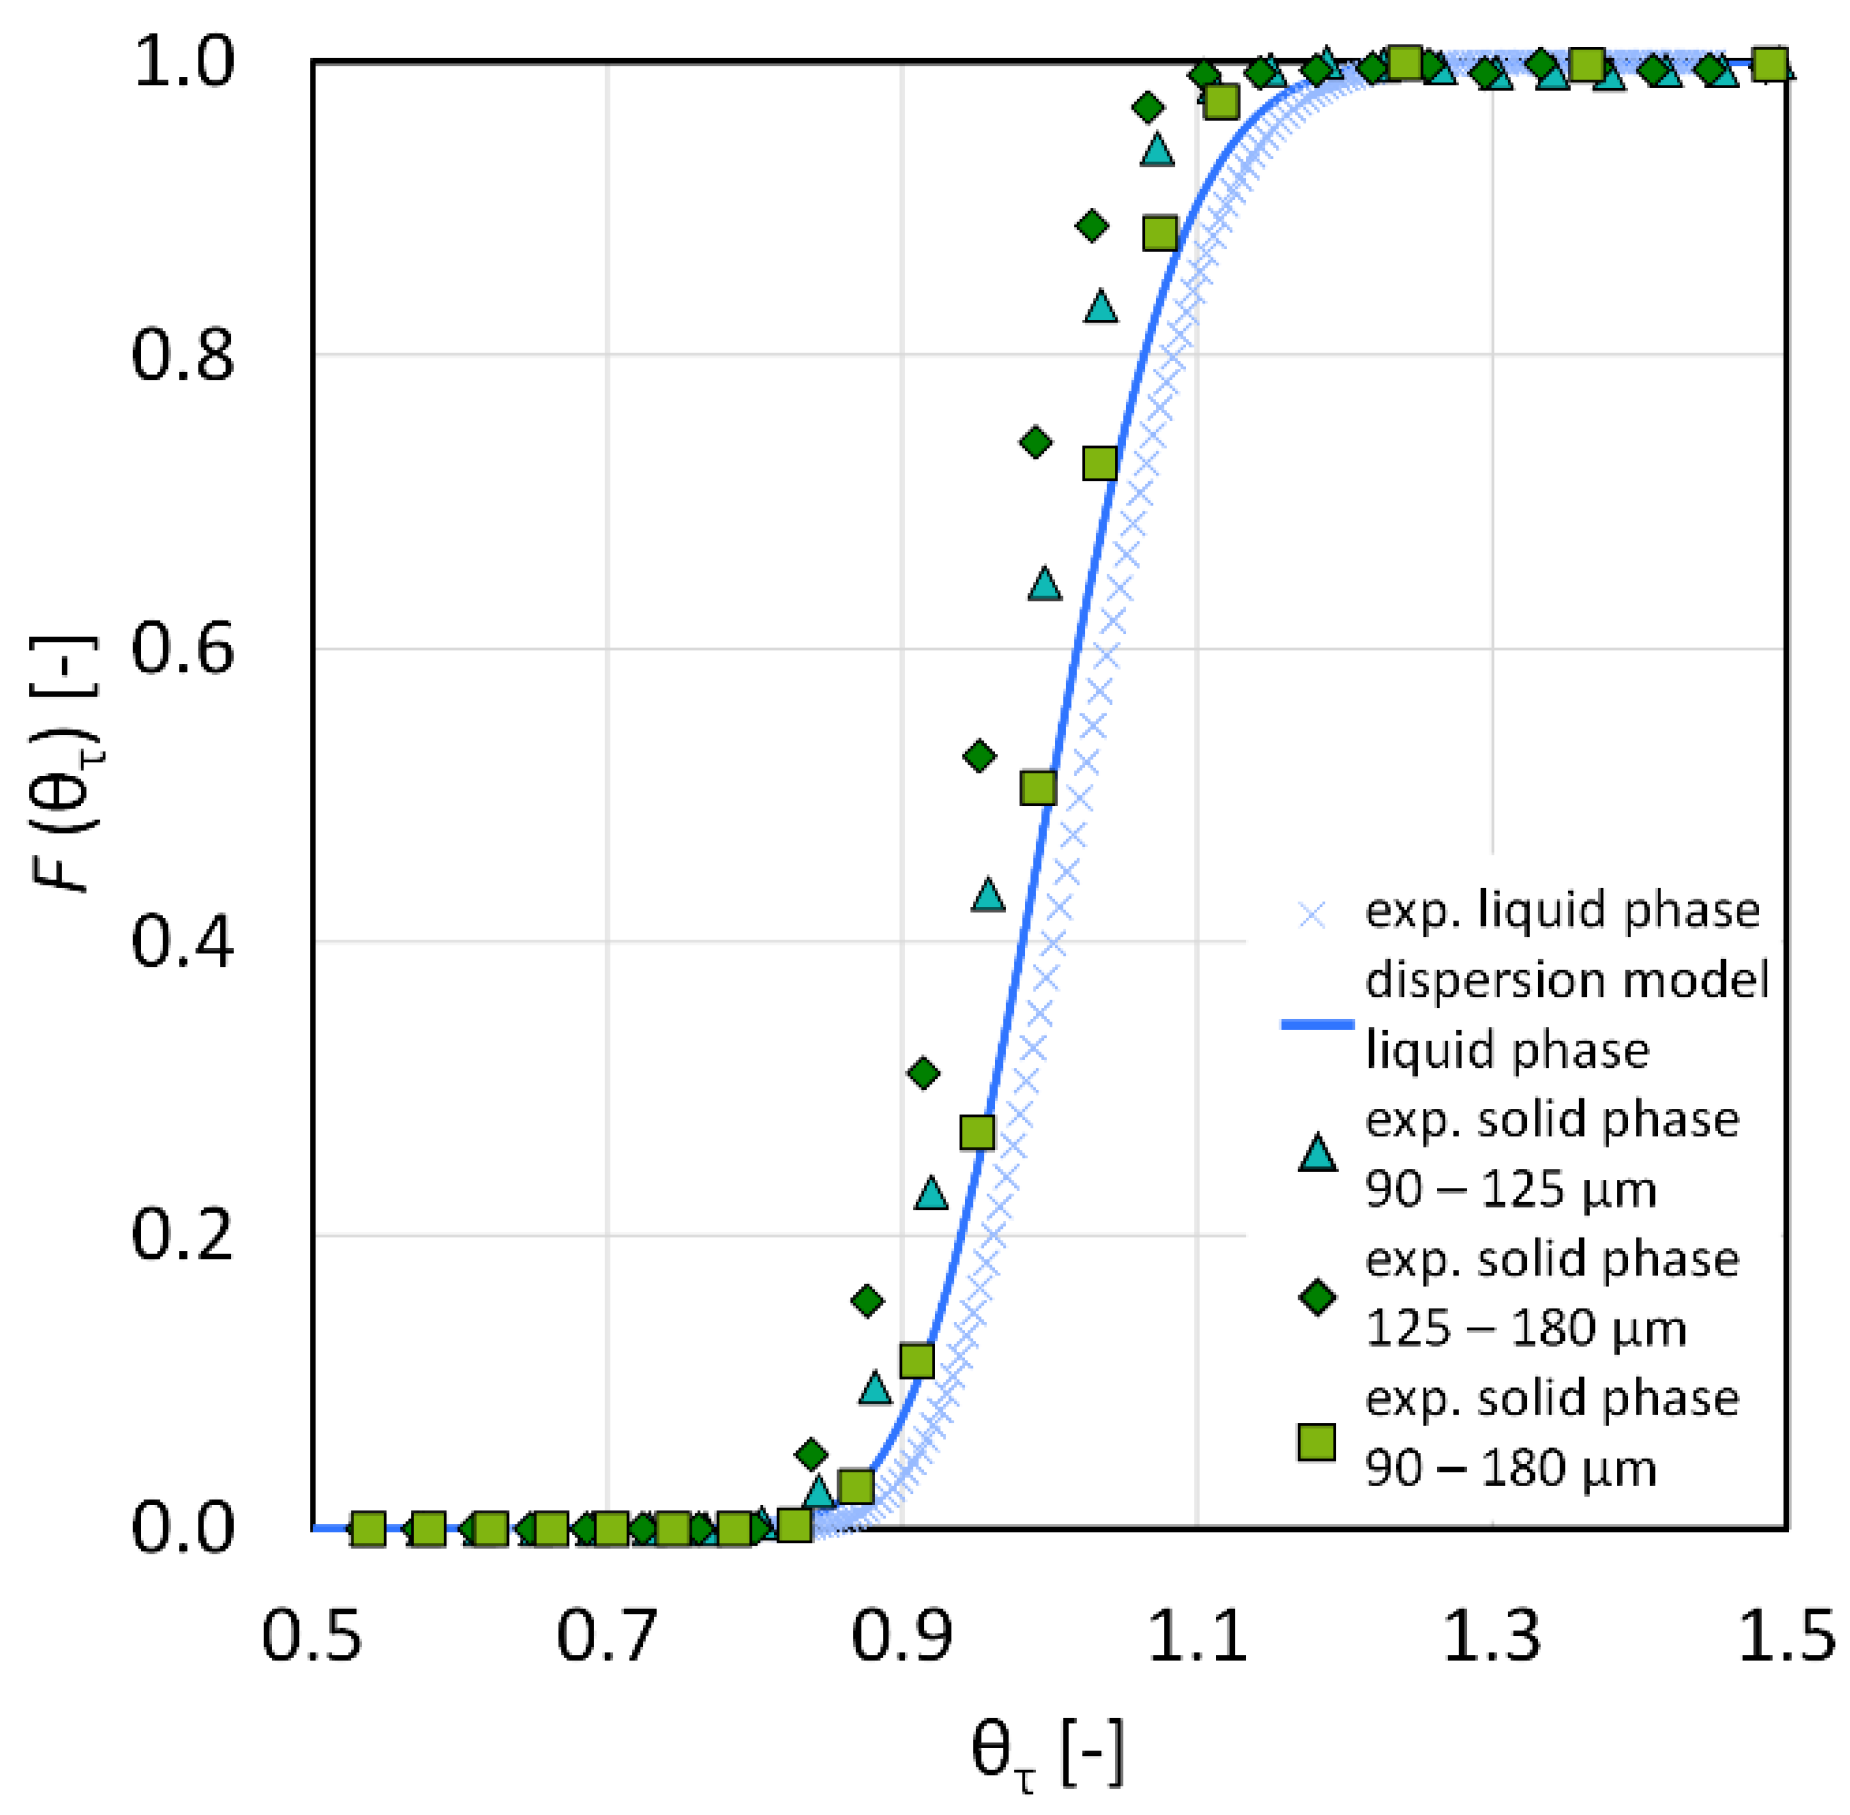
2.4.1. Residence Time Distribution for the CFIC

The FPU, CFIC, and PAU units were used for the residence time investigations. The residence time investigations for the liquid phase in the CFIC were already investigated for different crystallization units [56] for the chosen process conditions. The investigations on the residence time behavior of the solid phase in the CFIC were performed similarly to Reference [54]. A step signal with a defined suspension (1 w.%), which varies to its tracer crystal sizes (sieve fractions: 90–125 µm, 125–180 µm, and 90–180 µm), was used for the experiments. For this purpose, the solid fraction of the incoming and outgoing streams of the l-alanine/water system was determined by using the gravimetric methods (Section 2.3). The experiments were carried out isothermally, at ambient temperature, to minimize temperature-related effects, such as crystalline growth or dissolution of the solid particles. For this purpose, both the storage tank’s temperature and the coolant flow temperature were set to 25 °C. Before starting the experiment, the system was first rinsed with deionized water for at least 15 min to guarantee a cleaned tube and the same conditions for every run. Three series of measurements were carried out for each of the three crystal fractions. Four crystallization units were used for all measurements.
The theoretical hydraulic residence time ( τ ) is determined by the ratio of volume ( V ) and volume flow rate ( V ˙ ) (Equation (6)) [89].
τ = V V ˙
The distribution sum curve ( F ) can be determined by the ratio of the mass fraction in dependence of the time w i ( t ) to the original tracer mass fraction ( w 0 , tracer ) (Equation (7)). Furthermore, the actual residence time can be determined via the distribution sum curve (Equation (8)) [89].
F ( t ) = w i ( t ) w 0 , tracer
t ¯ = 0 1 t   d F ( t ) = 0 ( 1 F ( t ) ) d t
To de-dimension the time, t , it is related to the hydraulic residence time (Equation (9)) [89]. Furthermore, the residence time behavior can be well described for the CFI [54,80,90] by using the dispersion model and an adjustment of the Bodenstein number, Bo (Equation (10)) [89].
θ τ = t τ
F ( θ τ ) = 1 2 · [ 1 erf ( B o 2 θ τ · ( 1 θ τ ) ) ]  
For the comparison of the residence times of the different phases, a mean dimensionless residence time ( θ ¯ ) is introduced; this allows us to make a suitable comparison between the different phases considering different mass flows in the individual tests (Equation (11)).
θ ¯ = t ¯ τ

2.4.2. Crystal Growth Experiments in the CFIC

The FPU, CFIC, and PAU units were used for the crystal growth experiments. The influence of the seed crystal size and amount used for the substance system l-alanine/water in CFIC on the crystal growth behavior was investigated. In addition, the feasibility of another amino acid (glycine) was studied.
A defined suspension was first prepared for the investigations. Before the crystal growth tests begin, a temperature profile is first to run at the chosen process conditions to be investigated (Section 2.2). It is considered a steady-state when the temperatures have not changed by more than 0.2 °C over at least 20 min. After switching the magnetic valve from water to suspension, the experiment begins. (For the experiments seed90–125 1,3, and 4, no magnetic valve was installed yet, so that the pump had to stop for a short time, and the process tube from the water storage tank to the suspension tank was moved manually before the crystal growth experiment started.)
During the tests, sampling for gravimetric measurement and sedimentation analysis occurred approximately every 8 min at the end of the process tube. In addition, photos of the suspension in the measuring cell were repeatedly taken between these samplings. After termination of the experiment (either by an explicit stop or by clogging in the crystallizer), the apparatus was flushed with water. For further sampling the feed suspension and to exclude only detected influences by the pump on the crystals, the FPU was directly connected to the PAU after the crystal growth experiments; then sampling was performed at the end of the PAU for gravimetric analysis, sedimentation analysis, and for image analysis of the seed crystals.
In order to easily compare the individual growth experiments with each other, the mean growth rate, G ¯ , was determined according to Equation (12) [42] and thus also allows us to make a comparison with other crystal growth experiments of the same substance system in other apparatus. However, it needs to be considered that this is only a shortcut method to get a first impression of a crystallization system or crystallization behavior and does not consider the growth rate of each crystal side.
G ¯ = x 50 , 3 , prod x 50 , 3 , seed τ SL
The individual process parameters for each test can be found in Appendix A Table A3.

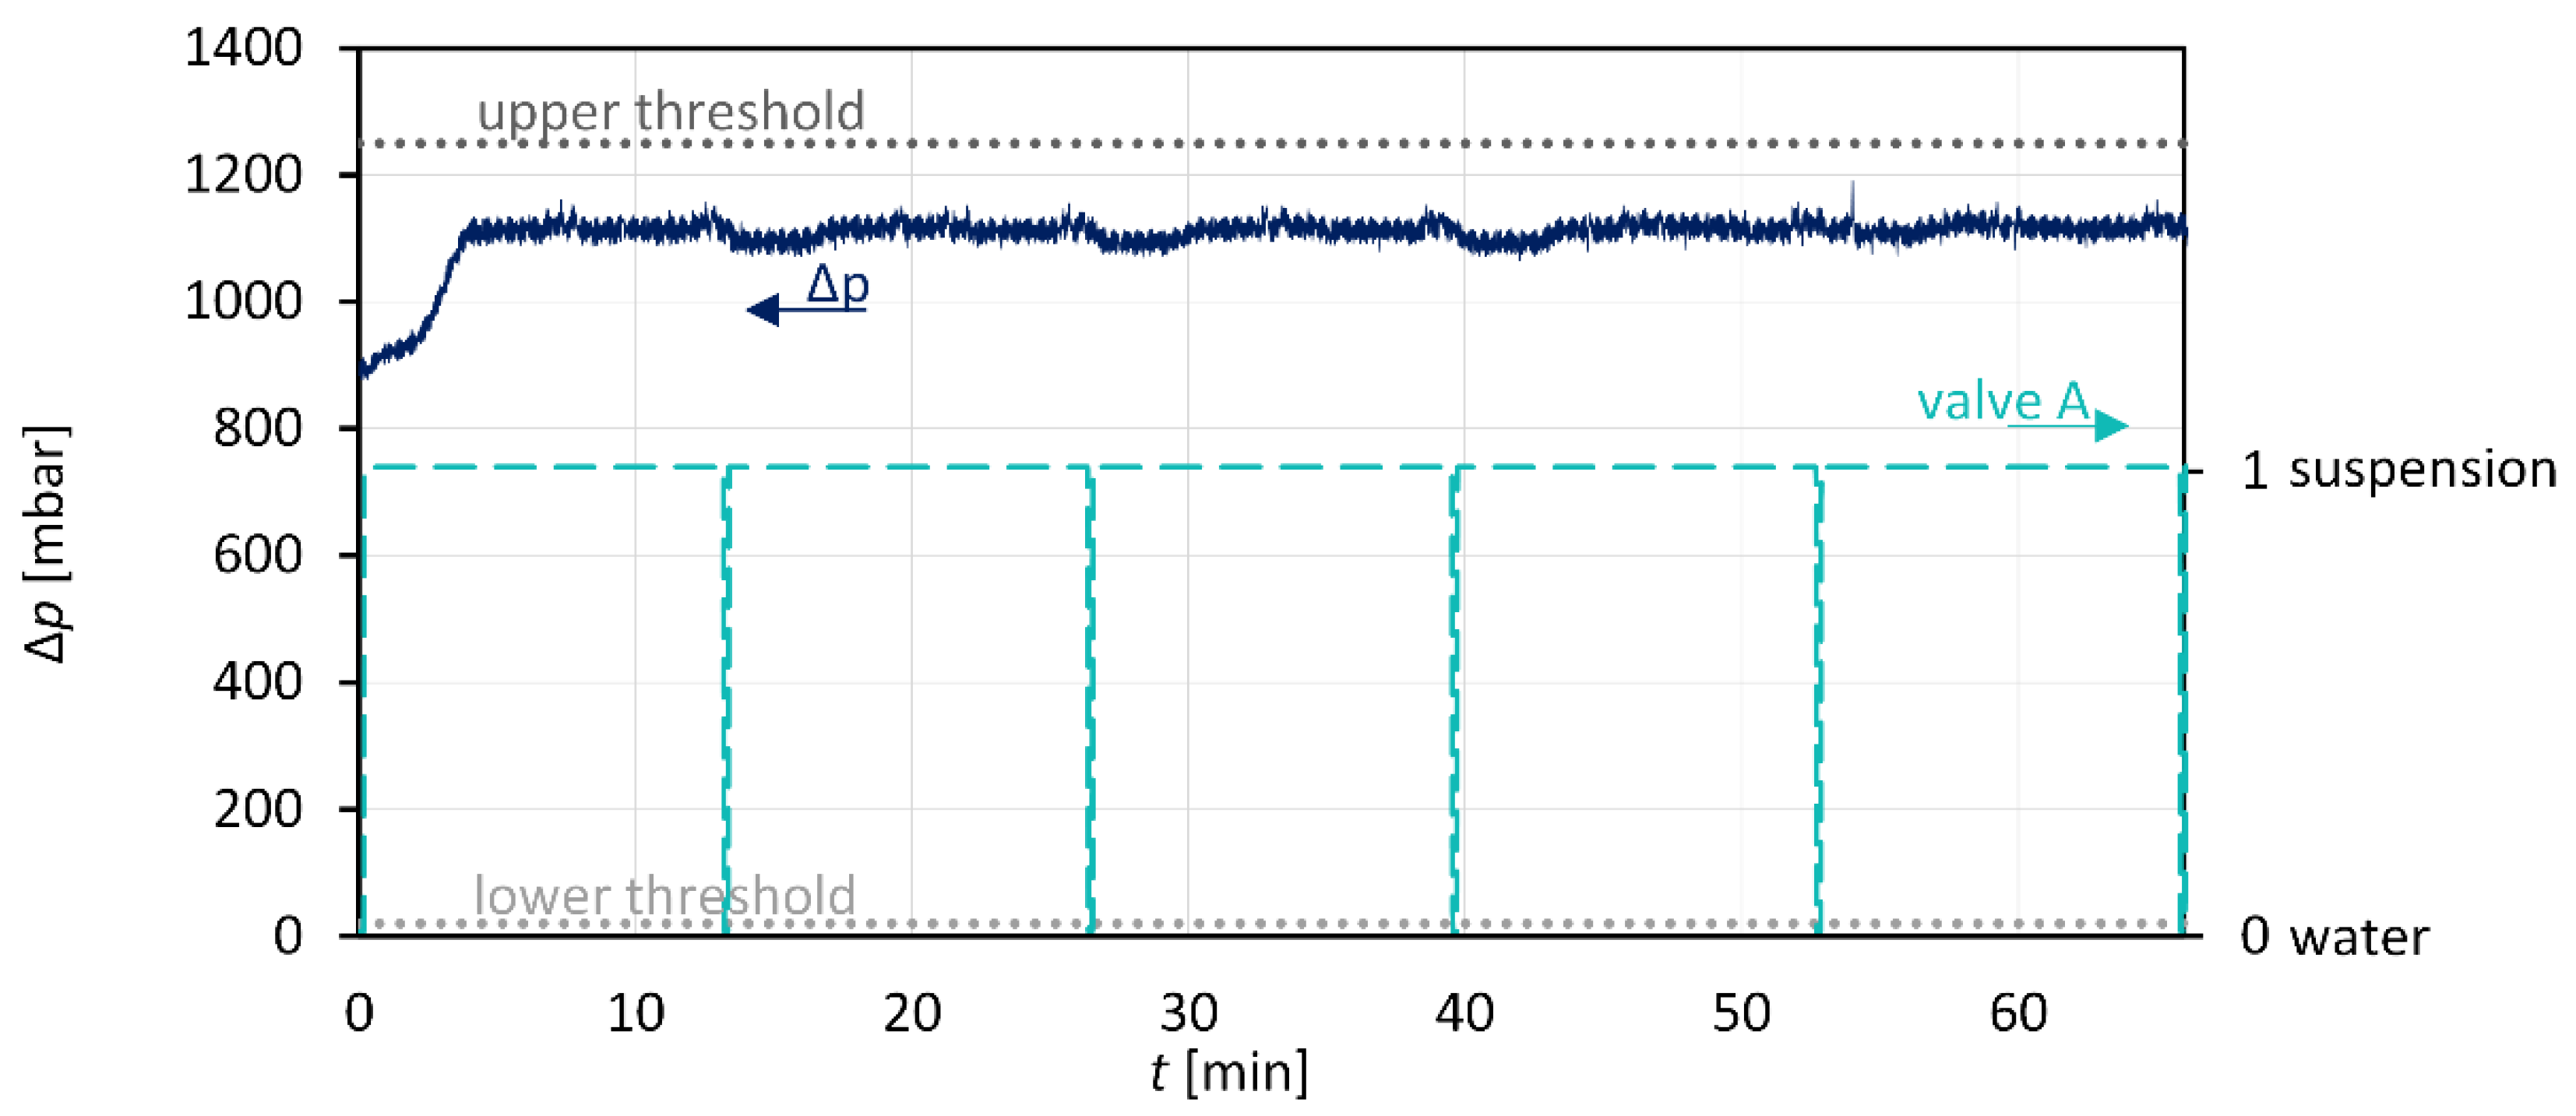
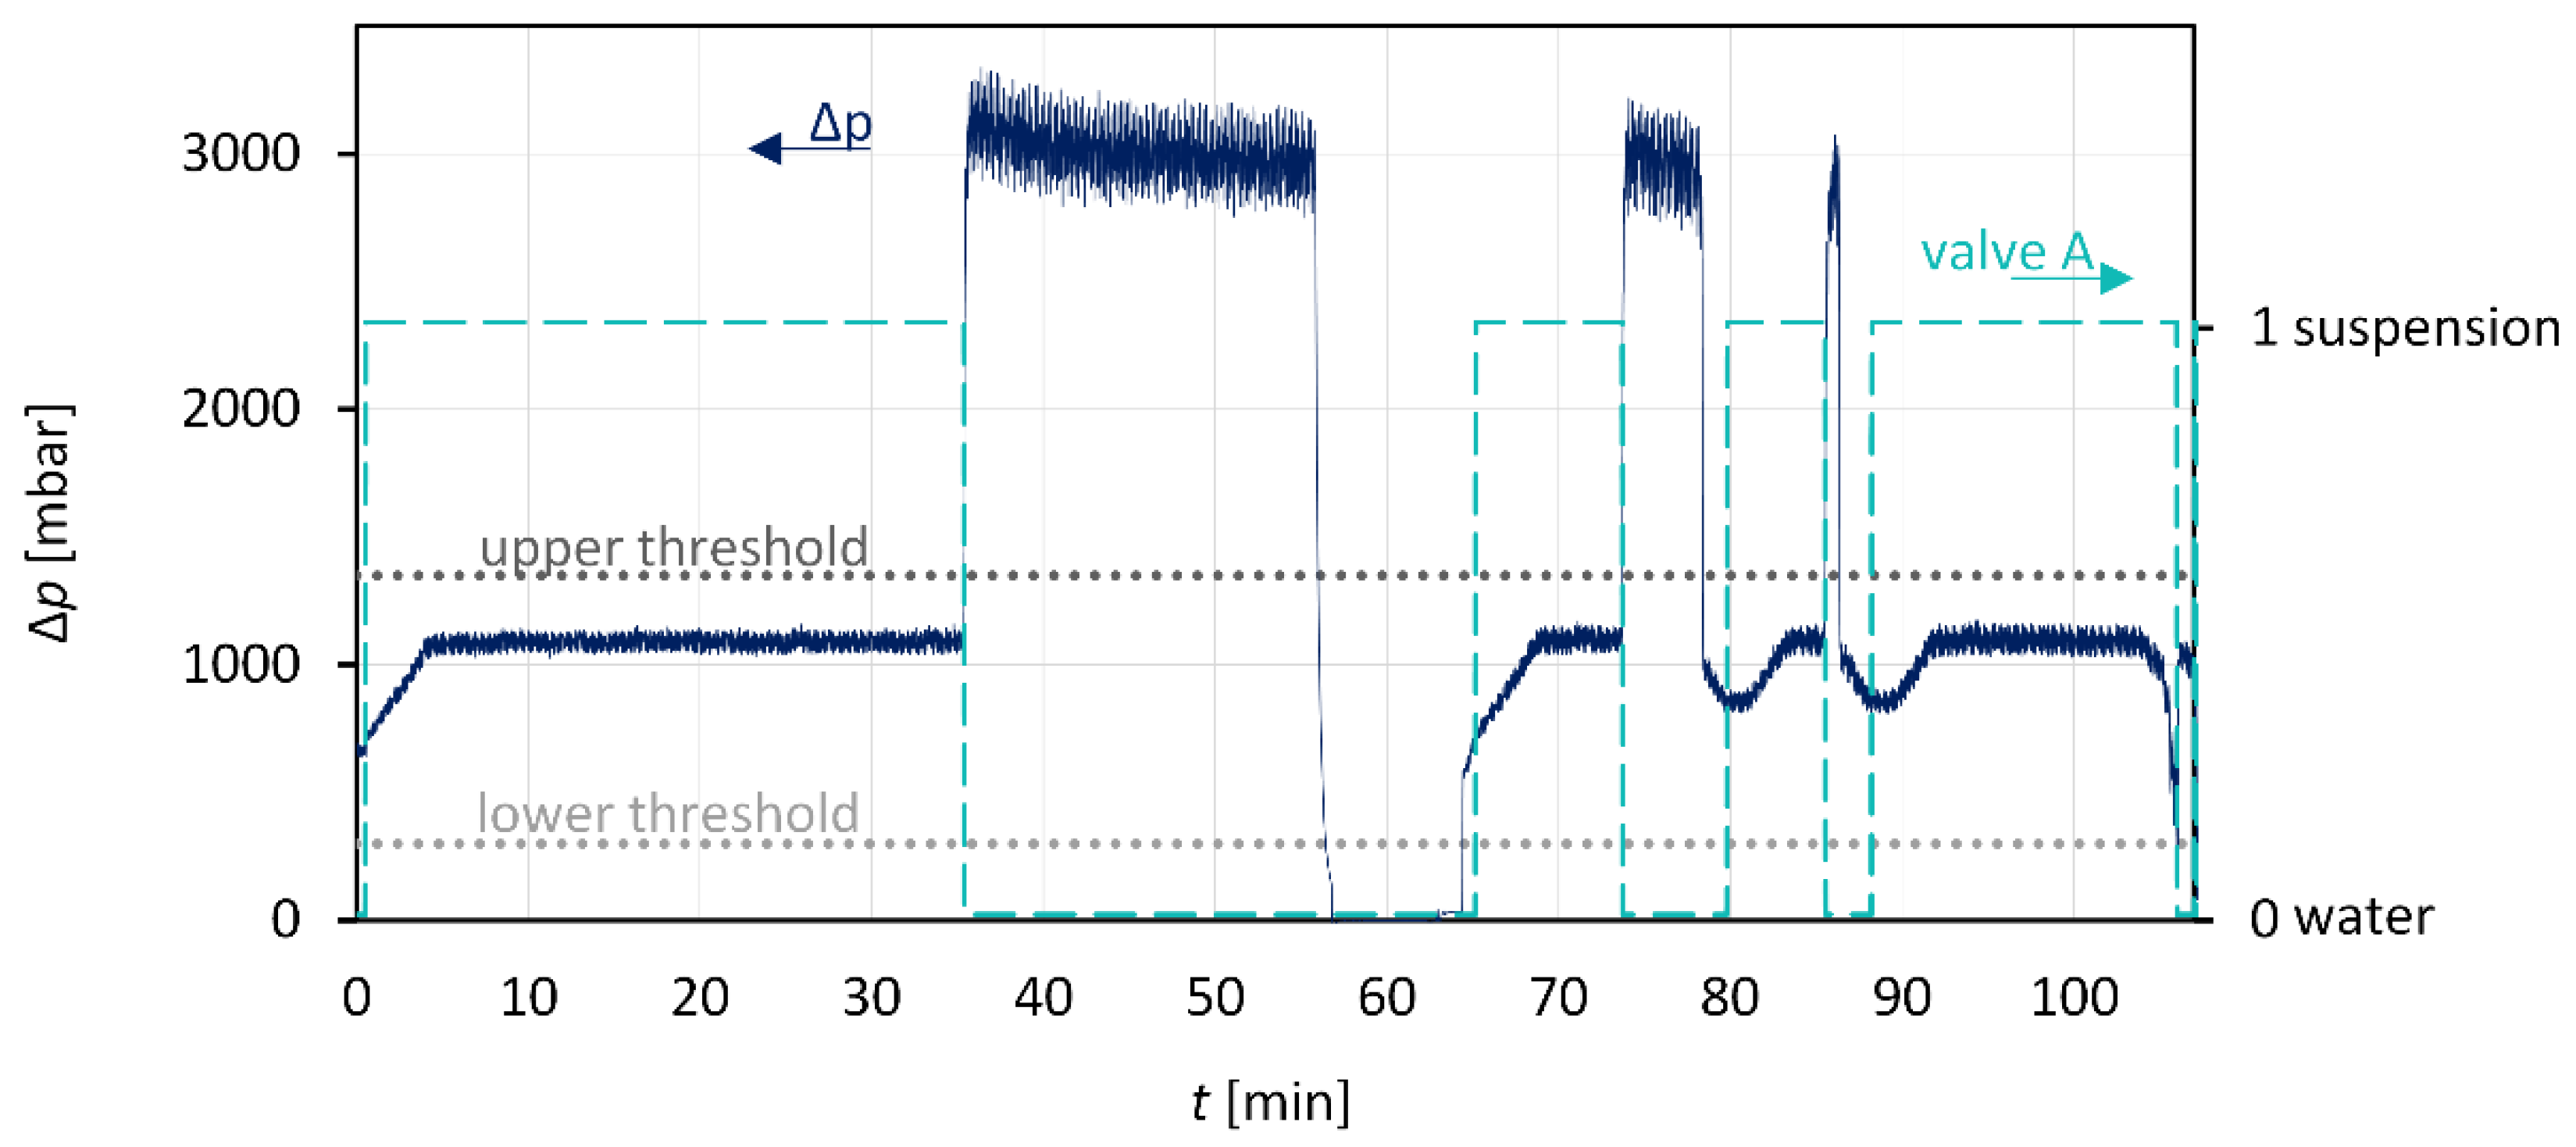
2.4.3. Anti-Plugging Strategies

A periodic prophylactic rinsing, as well as a pressure-loss rinsing, was investigated. For periodic prophylactic rinsing, water was flushed for 10 s every 13 min ( Δ t slot = 13 min, t rinse   = 10 s). The time interval of 13 min was chosen because, in nucleation experiments in the USU, the shortest operating time until clogging was determined to be 14 min [25]. Moreover, in other experiments in the CFIC not described here, the shortest operating time until clogging was detected after this time interval. A rinsing time of 10 s was selected to use a small amount of solvent and interrupt the crystallization operation only for a short period.
For pressure-loss rinsing, the operation is maintained until an initial clogging occurs, which is indicated by a pressure increase. Suppose the pressure loss increase has risen above a defined threshold. In that case, magnetic valve A is switched to solvent until the pressure loss has dropped below a critical pressure loss limit again—this time until the first clogging is recorded Δ t clog and selected as the time duration to switch to a prophylactic flush cycle ( Δ t slot = Δ t clog and t rinse = 60 s). If the pressure increases again due to clogging before this time interval is passed, the magnetic valve switches to flushing mode prematurely if the threshold is exceeded.
The test of the prophylactic purging cycle was used for crystal growth experiment seed90–125 2 and combi 5, and pressure-loss rinse was used for experiment seed90–180 2 and combi 4. The control software used is HiText™ connected with LabVision®. The codes for the corresponding purging mechanisms can be found in Appendix A (Table A4 and Table A5).

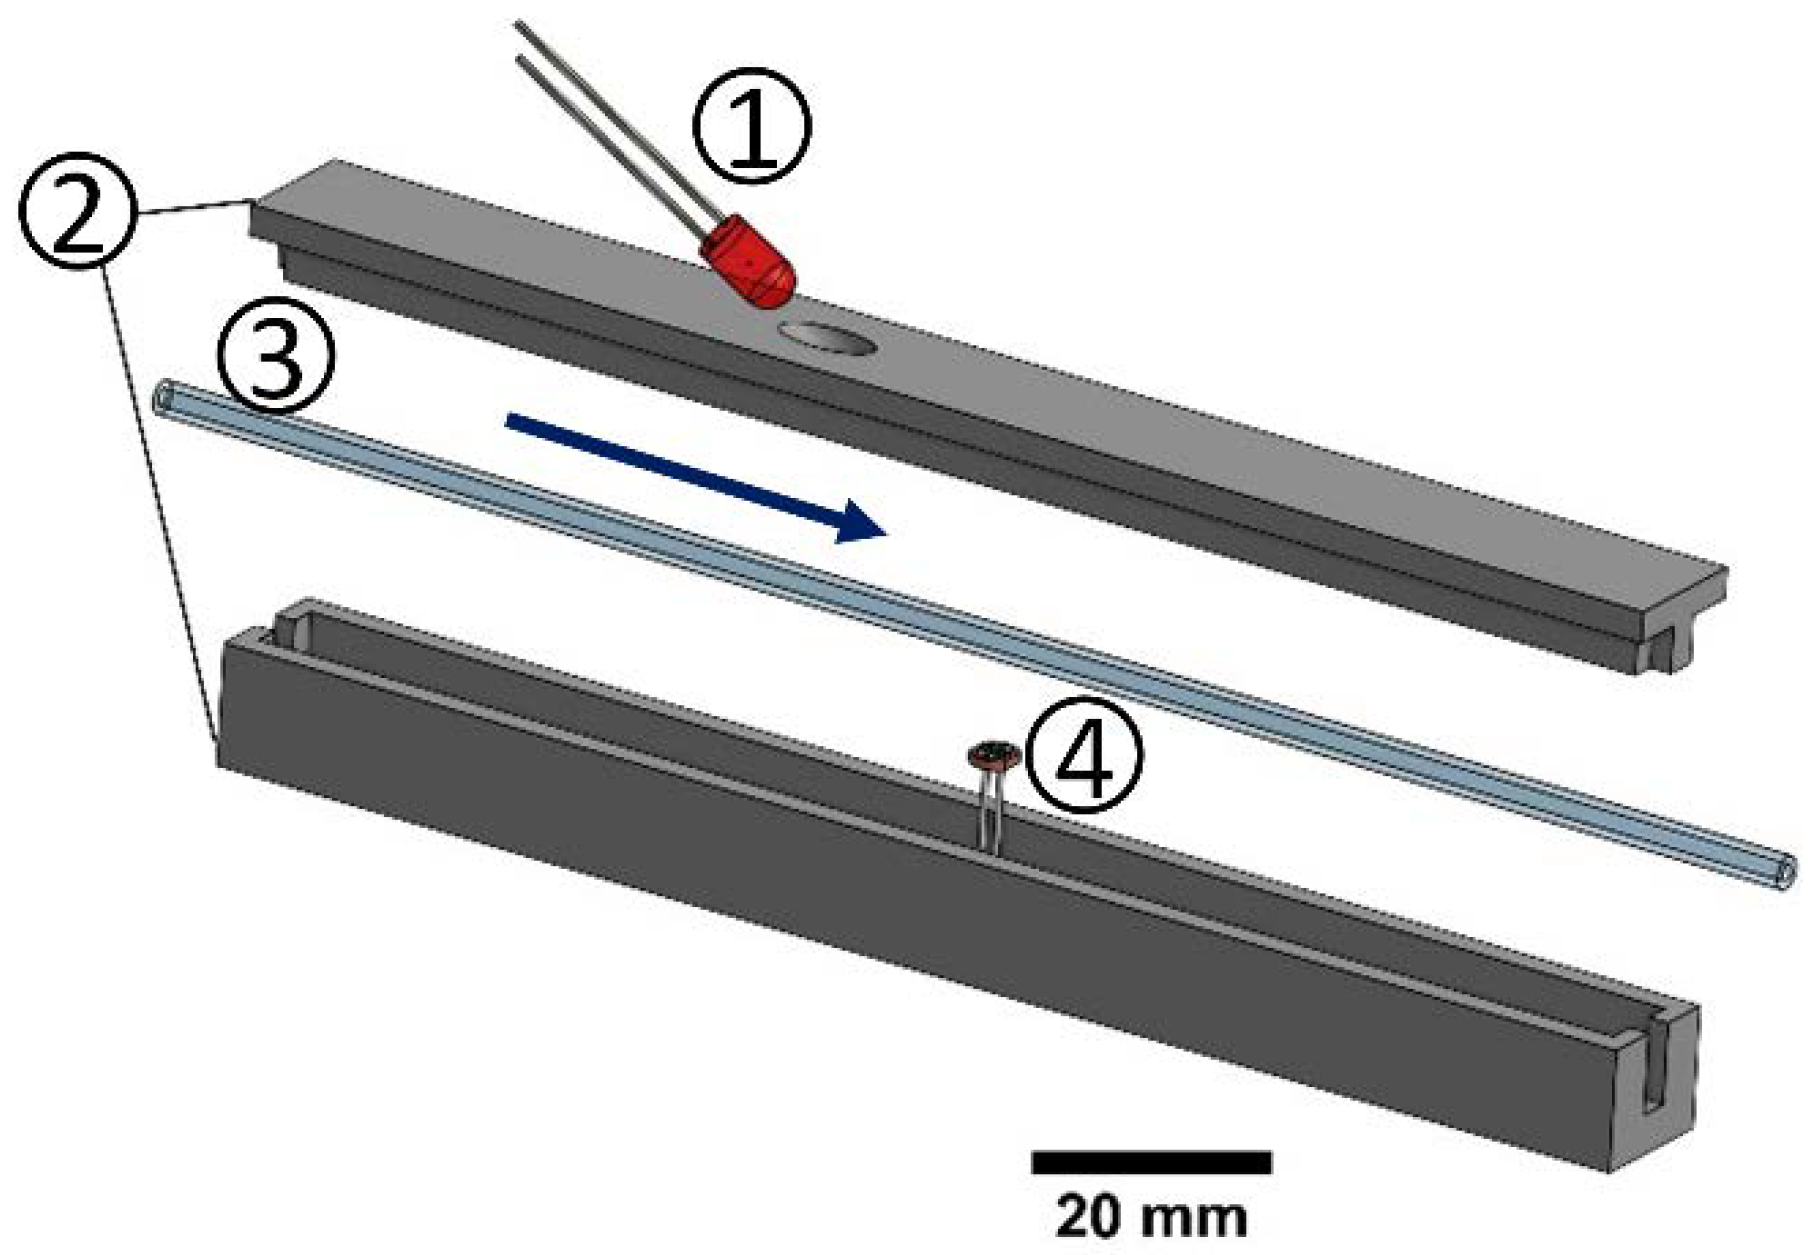
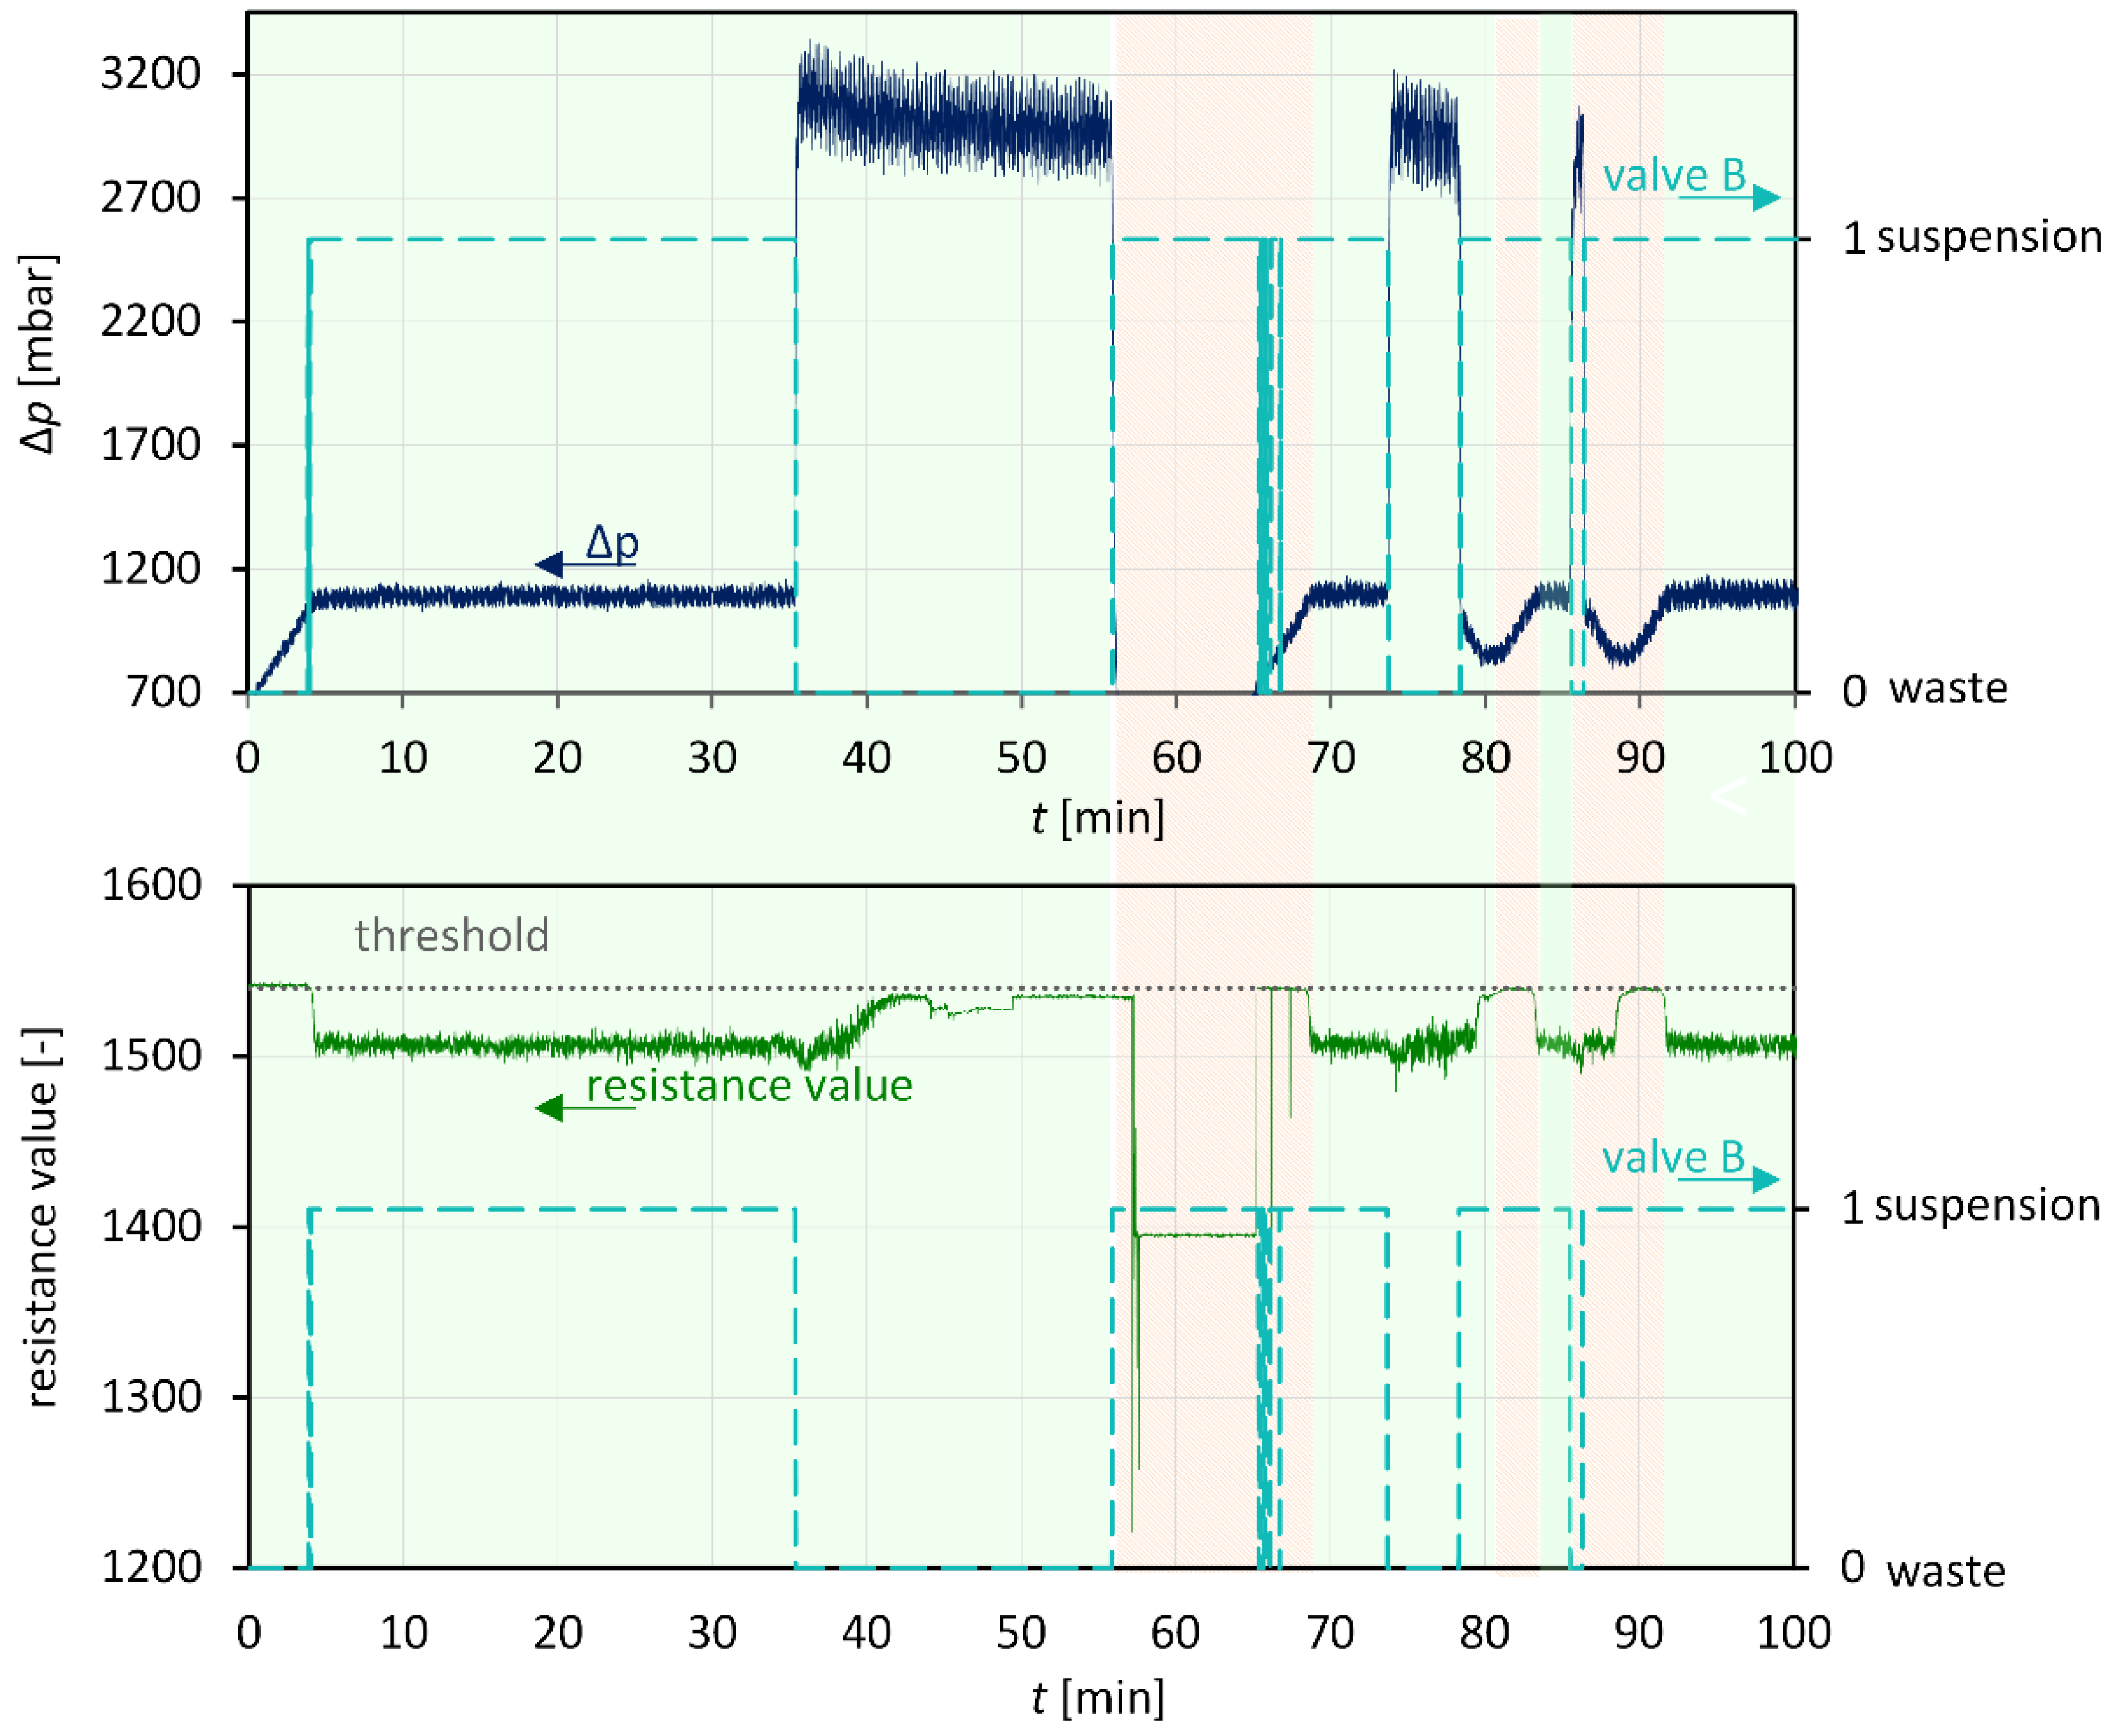
2.4.4. Suspension Detection with Inline Sensor

Rinsing cycles of any kind can influence the product suspension in the collecting tank or follow-up processes and, in the worst case, even dissolve crystals. In order to prevent this, a feasibility study is being carried out to determine whether the photometric sensor developed by Höving et al. [86] is suitable for distinguishing between suspension and solvent. In order to use a second magnetic valve to channel the solvent phase into a waste tank and the suspension into the product tank. The design of this sensor is shown schematically in Figure 3 and is described in more detail in Reference [86]. Due to the changing light resistance, it is possible to distinguish between suspension and solvent.
For the crystal growth experiment90–180 2, the sensor was used in combination with the magnetic valve B. The control code of the magnetic valve B, depending on the signal of the photoresistor, can be found in Appendix A (Table A6).

2.4.5. Combination: Nucleation and Crystal Growth

In order to check whether a continuous process from nucleation to crystal growth can be implemented in the apparatus with the l-alanine/water system, combined experiments (combi) of nucleation in the USU and crystal growth in the CFIC were carried out. All units (FPU, USU, CFIC, and PAU) were used for this purpose. However, only two crystallization units of CFIC were used instead of four, because crystallization unit three is often clogged in preliminary experiments not described here. To ensure a sufficiently high supersaturation in the USU to generate crystal nuclei [25], the solution was set to 5 K above the selected saturation temperature (50 °C). The selected temperature in the ultrasonic bath and other process variables can be found in Appendix A Table A7. Moreover, in the combi tests, water (55 °C) was first pumped through the entire setup (the ultrasonic bath was turned on) to achieve a stationary temperature profile. Once this was achieved, the experiments started by switching the magnetic valve from solvent (water) to solution (undersaturated l-alanine solution). However, for combi experiments one to three, the magnetic valve was not yet installed, so the pump had to be be stopped briefly to switch the process tube as quickly as possible into the solution tank. The process tube was fitted with a filter frit (pore size III, ROBU Glasfilter Geräte GmbH, Hattert, Germany) to exclude crystals and impurities.
For the tests, the used l-alanine concentration was checked for the feed tank via the gravimetric method. Image analysis was used to determine the crystal size and to observe the crystallization behavior. Concerning the l-alanine used, it should be noted that the l-alanine batch used for the nucleation studies in Reference [25] and here in the combi experiments 1–3 was different (1941180707) from that used for the combi experiments 4 and 5 (1941200315).

3. Results

As the basis for the characterization of the CFIC, the residence time behavior of the liquid and solid phases is described. Further, the crystal growth experiments for the two amino acids are evaluated. Afterward, the practicability of anti-plugging strategies is shown and evaluated. Finally, the viability of combining the nucleation in the ultrasonic bath and crystal growth unit in the CFIC is shown, and hurdles are named.

3.1. Residence Time Distribution

The investigations of the residence time distribution are to gain more understanding about the flow behavior in the crystallizer. The results for the residence time behavior of the liquid phase (RTDL) are taken from Reference [56], and for comparison with the solid phase (RTDS) shown in Figure 4. Furthermore, the averaged corresponding process conditions and its RTD characteristic parameters are listed in Table 2.
From Figure 4, it can be taken that all distribution sum curves are narrow, and it confirms that the RTD in a CFIC almost equals the behavior of ideal plug flow. Additionally, the dispersion model is proper equipment to display the RTD in a CFIC. In more detail, it can be seen that the liquid phase is the slowest. In the test shown here individually for the RTDS of the mixed fraction of 90–180 µm, the RTD of the liquid phase seems to correspond most closely. The RTD of the smallest sieve fraction (90–125 µm) is slightly faster, and that of the sieve fraction 125–180 µm is the quickest. However, in Figure 4, there are only results of single measurements shown due to the clarity.
In Table 2, the averaged results are represented. The mass flow rate is almost identical only for the investigations of the sieve fraction 90–180 µm the mass flow rate was a bit higher. Therefore, the hydraulic residence times are calculated between 226 and 266 s depending on the mass flow rate and the solid weight fraction. The actual residence time is calculated by using the trapezoidal rule and Equation (8). The actual residence time for the liquid flow is the shortest, followed by the mixed sieve fraction (90–180 µm), followed by the bigger sieve fraction (125–180 µm), and the slowest is the smallest sieve fraction (90–125 µm). However, the direct comparison of the actual residence time is flawed because of the varying mass flow rates. Due to it, the averaged dimensionless residence time is introduced. Here the ratio of the actual to the calculated hydraulic residence time is determined. If it equals one, the hydraulic and actual residence time is the same. If it is smaller than one, the investigated phase is faster than the calculated phase. From Table 2, it can be taken that the liquid residence time equals the hydraulic residence time. The averaged dimensionless residence time for the solid phases is smaller, so the particles are faster than the liquid phase. The difference is marginal between the solid phases, whereas the bigger sieve fraction (125–180 µm) is slightly quicker. The Bodenstein number determined by the adjustment to the dispersion model is highly above 100 for every case, confirming that the RTD behaves almost like an ideal plug flow.
Our group already found that the particles travel faster than the mean fluid element in a horizontal CFI [54], mainly if the homogenous suspension flow regime is used. Hence, it can be confirmed for the smaller inner tube diameter that the particles never rest in distinction to small fluid elements, which underlie the no-slip condition.
For the mixed sieve fraction here, the solid phase behaves more like the smaller crystals. A comparison with investigations already known from the literature is made in Section 4.

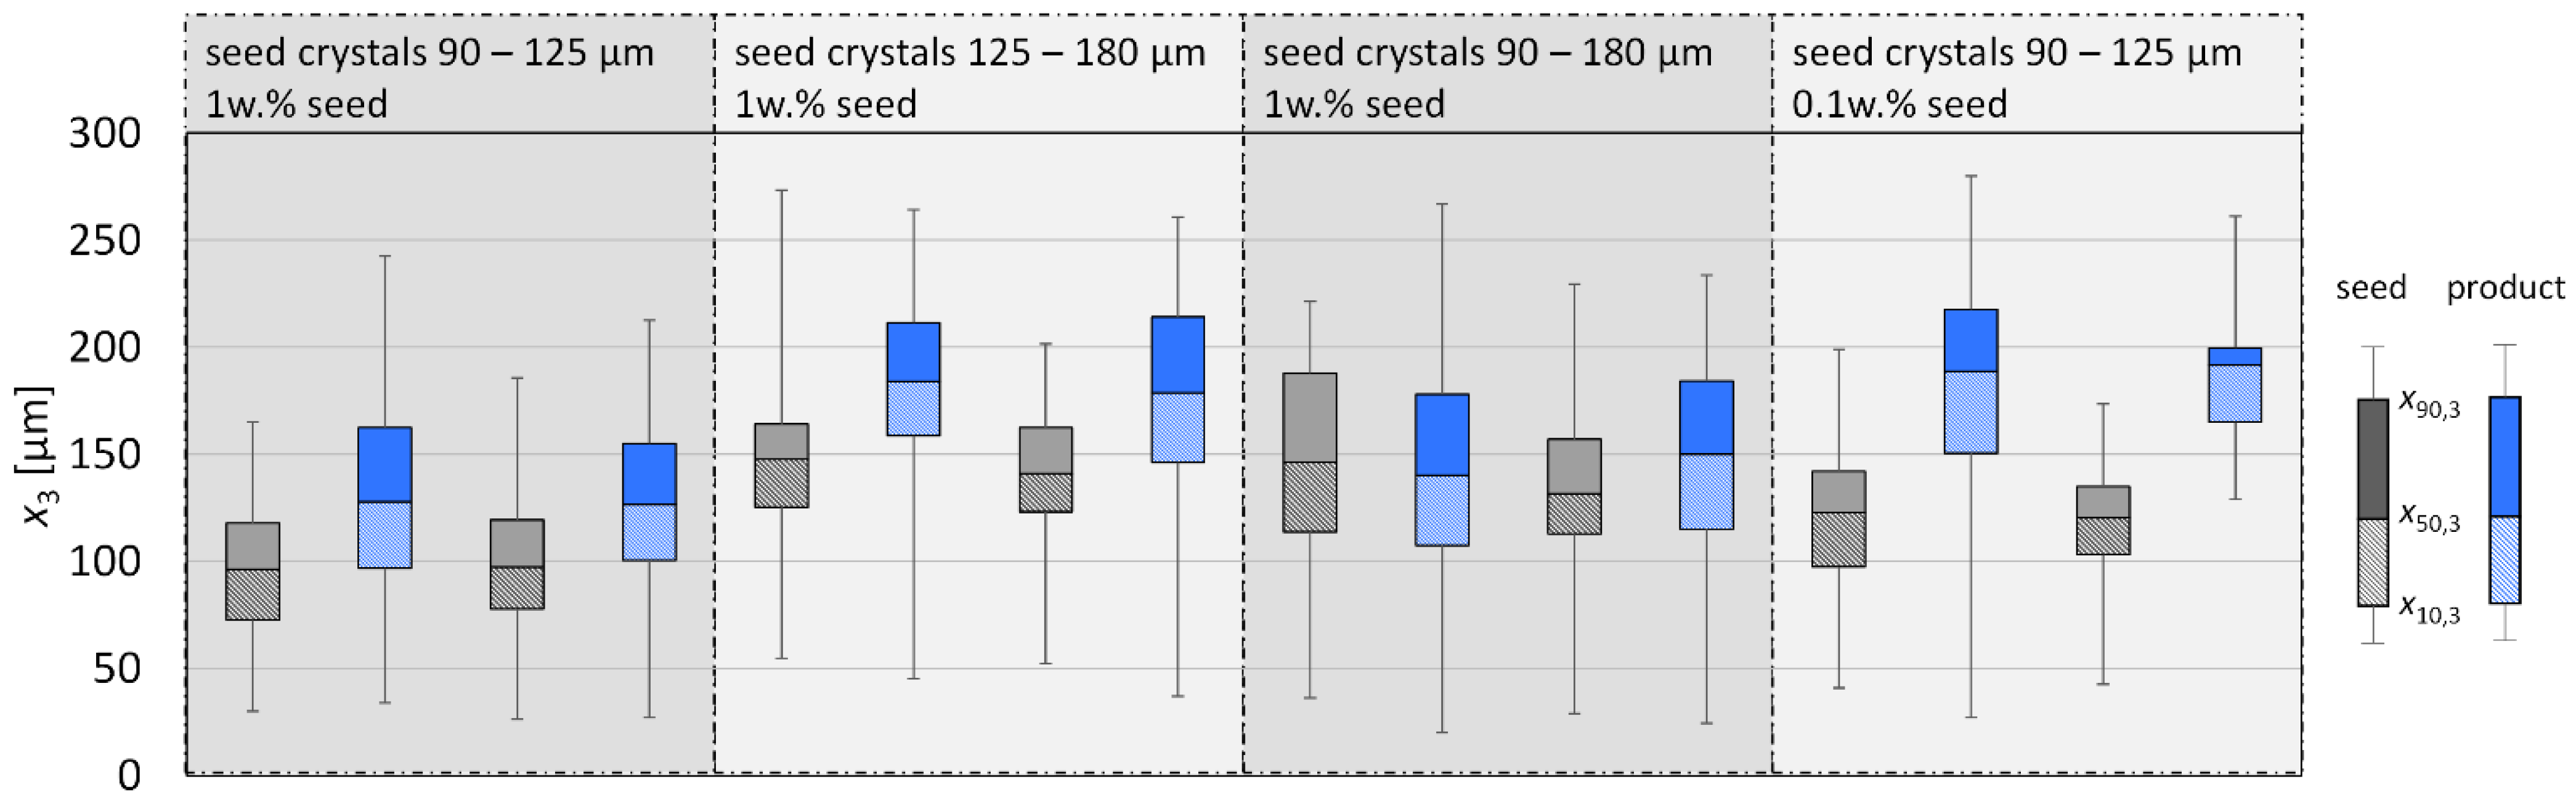
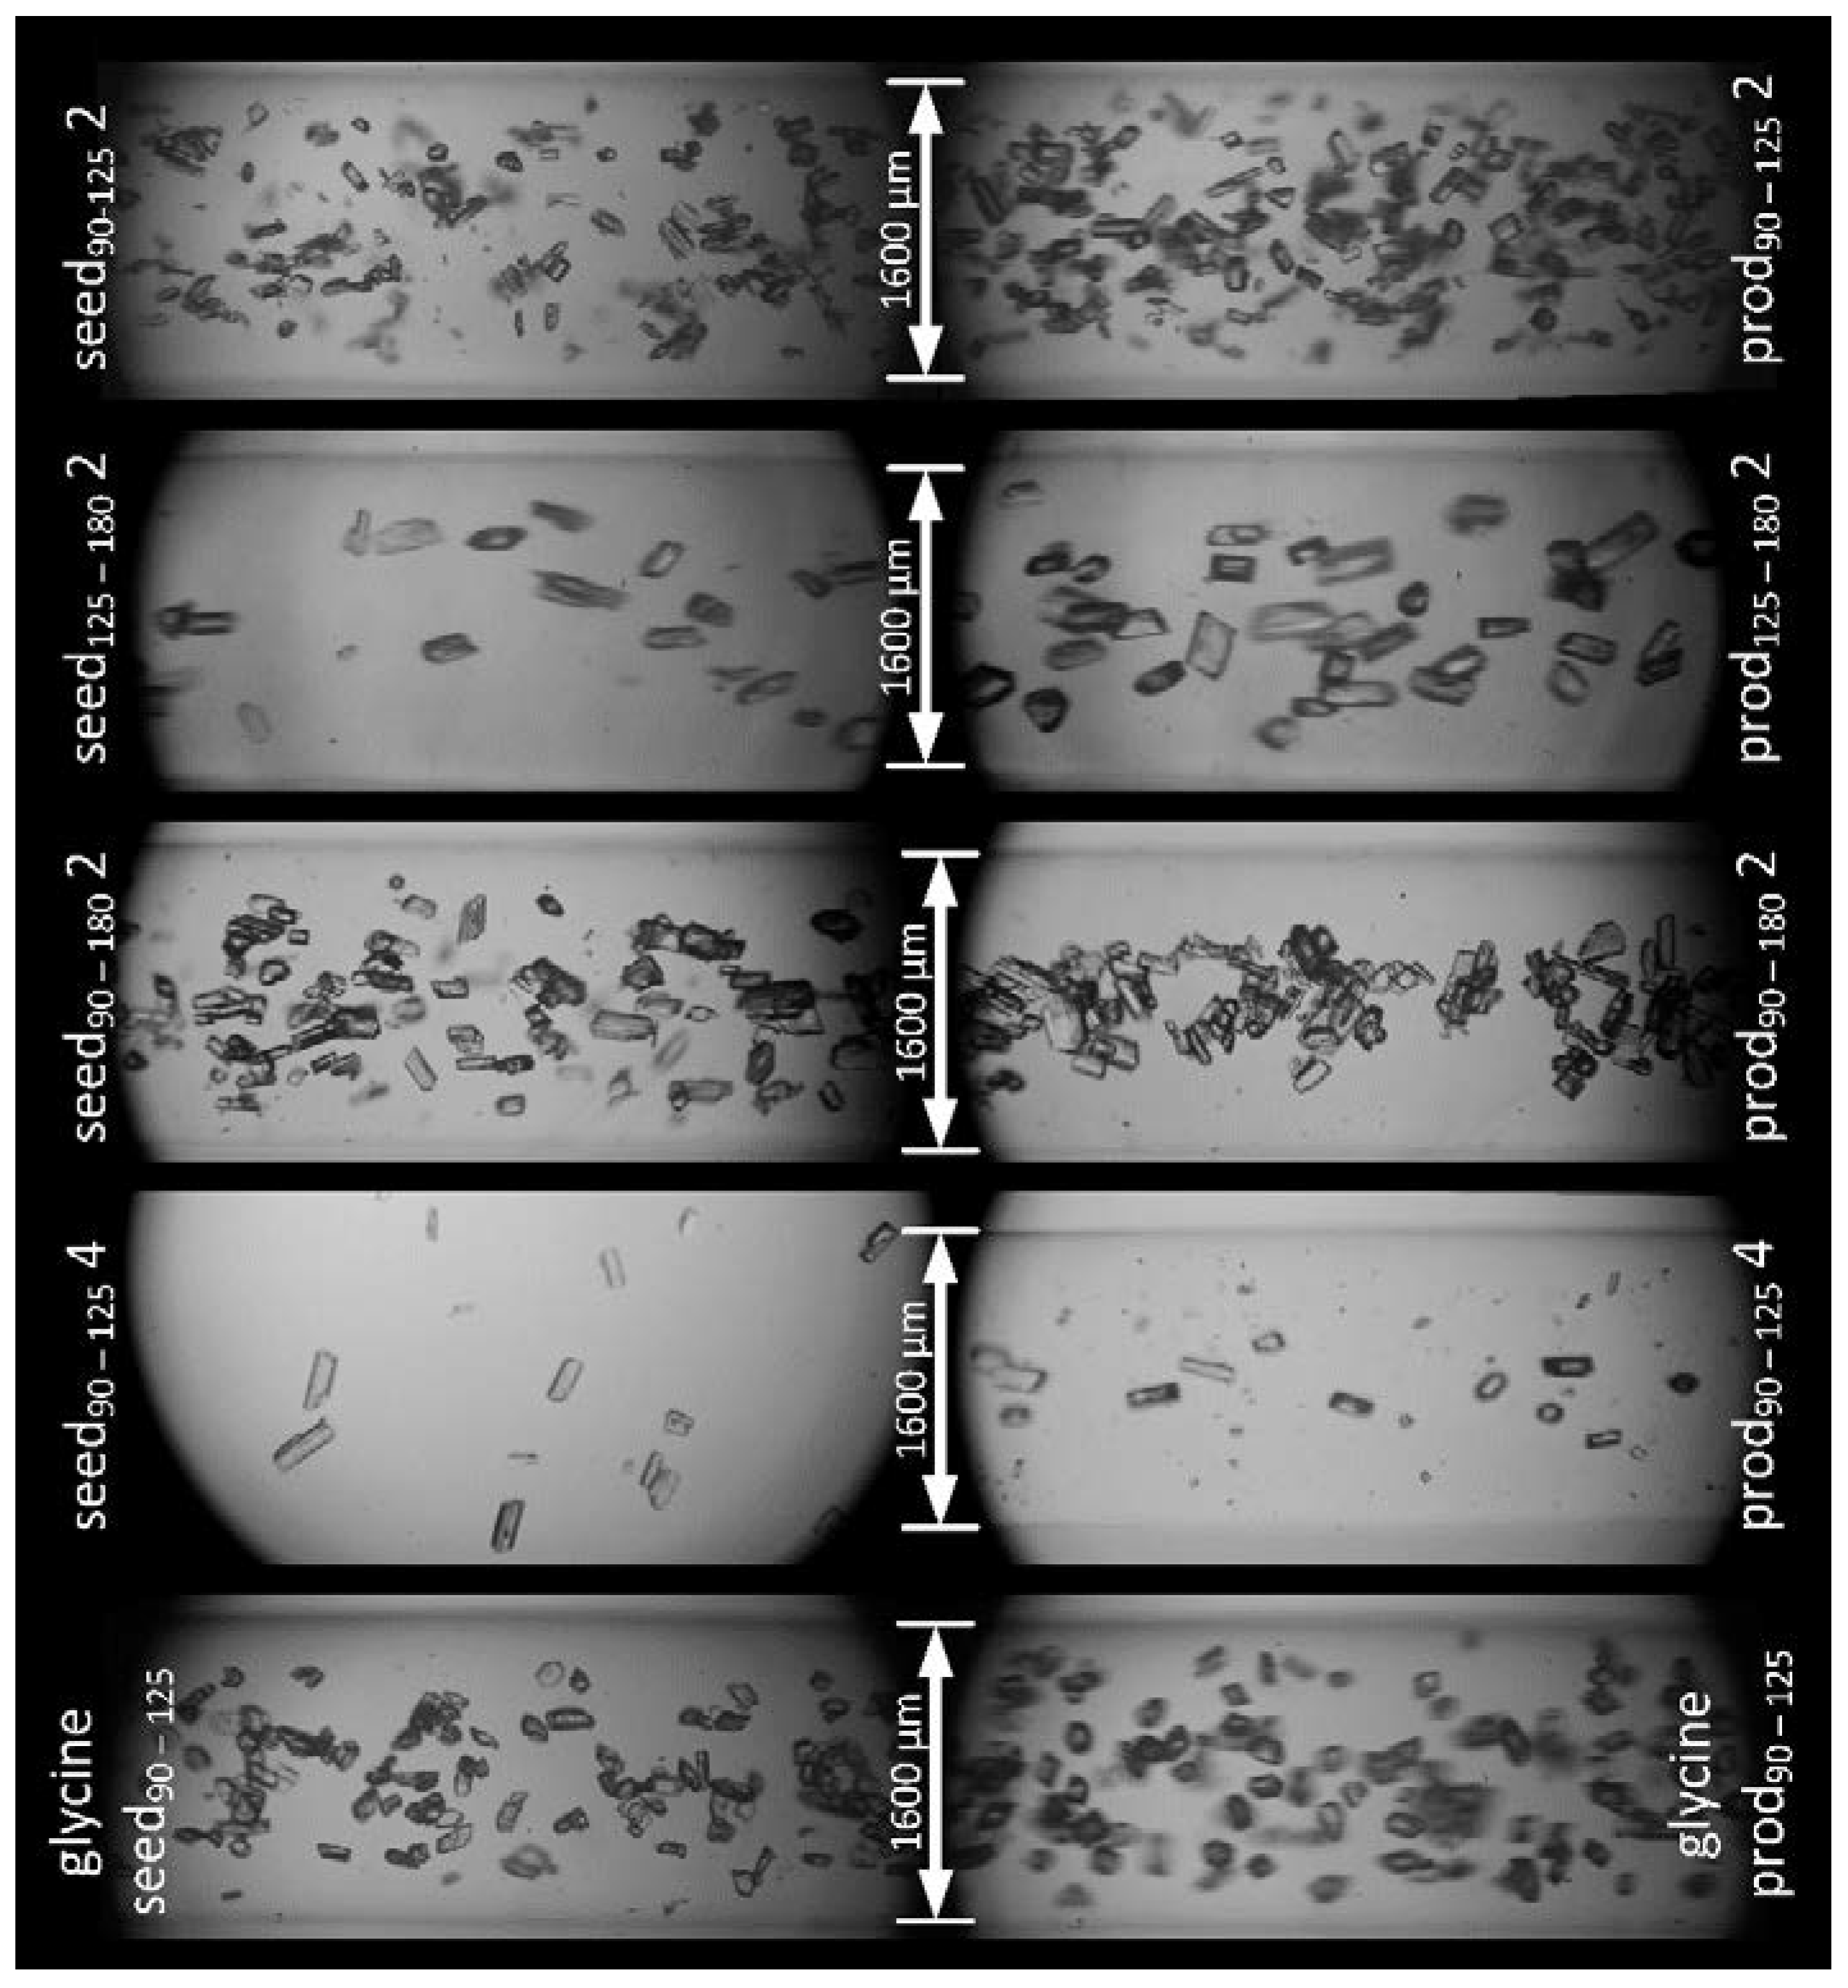
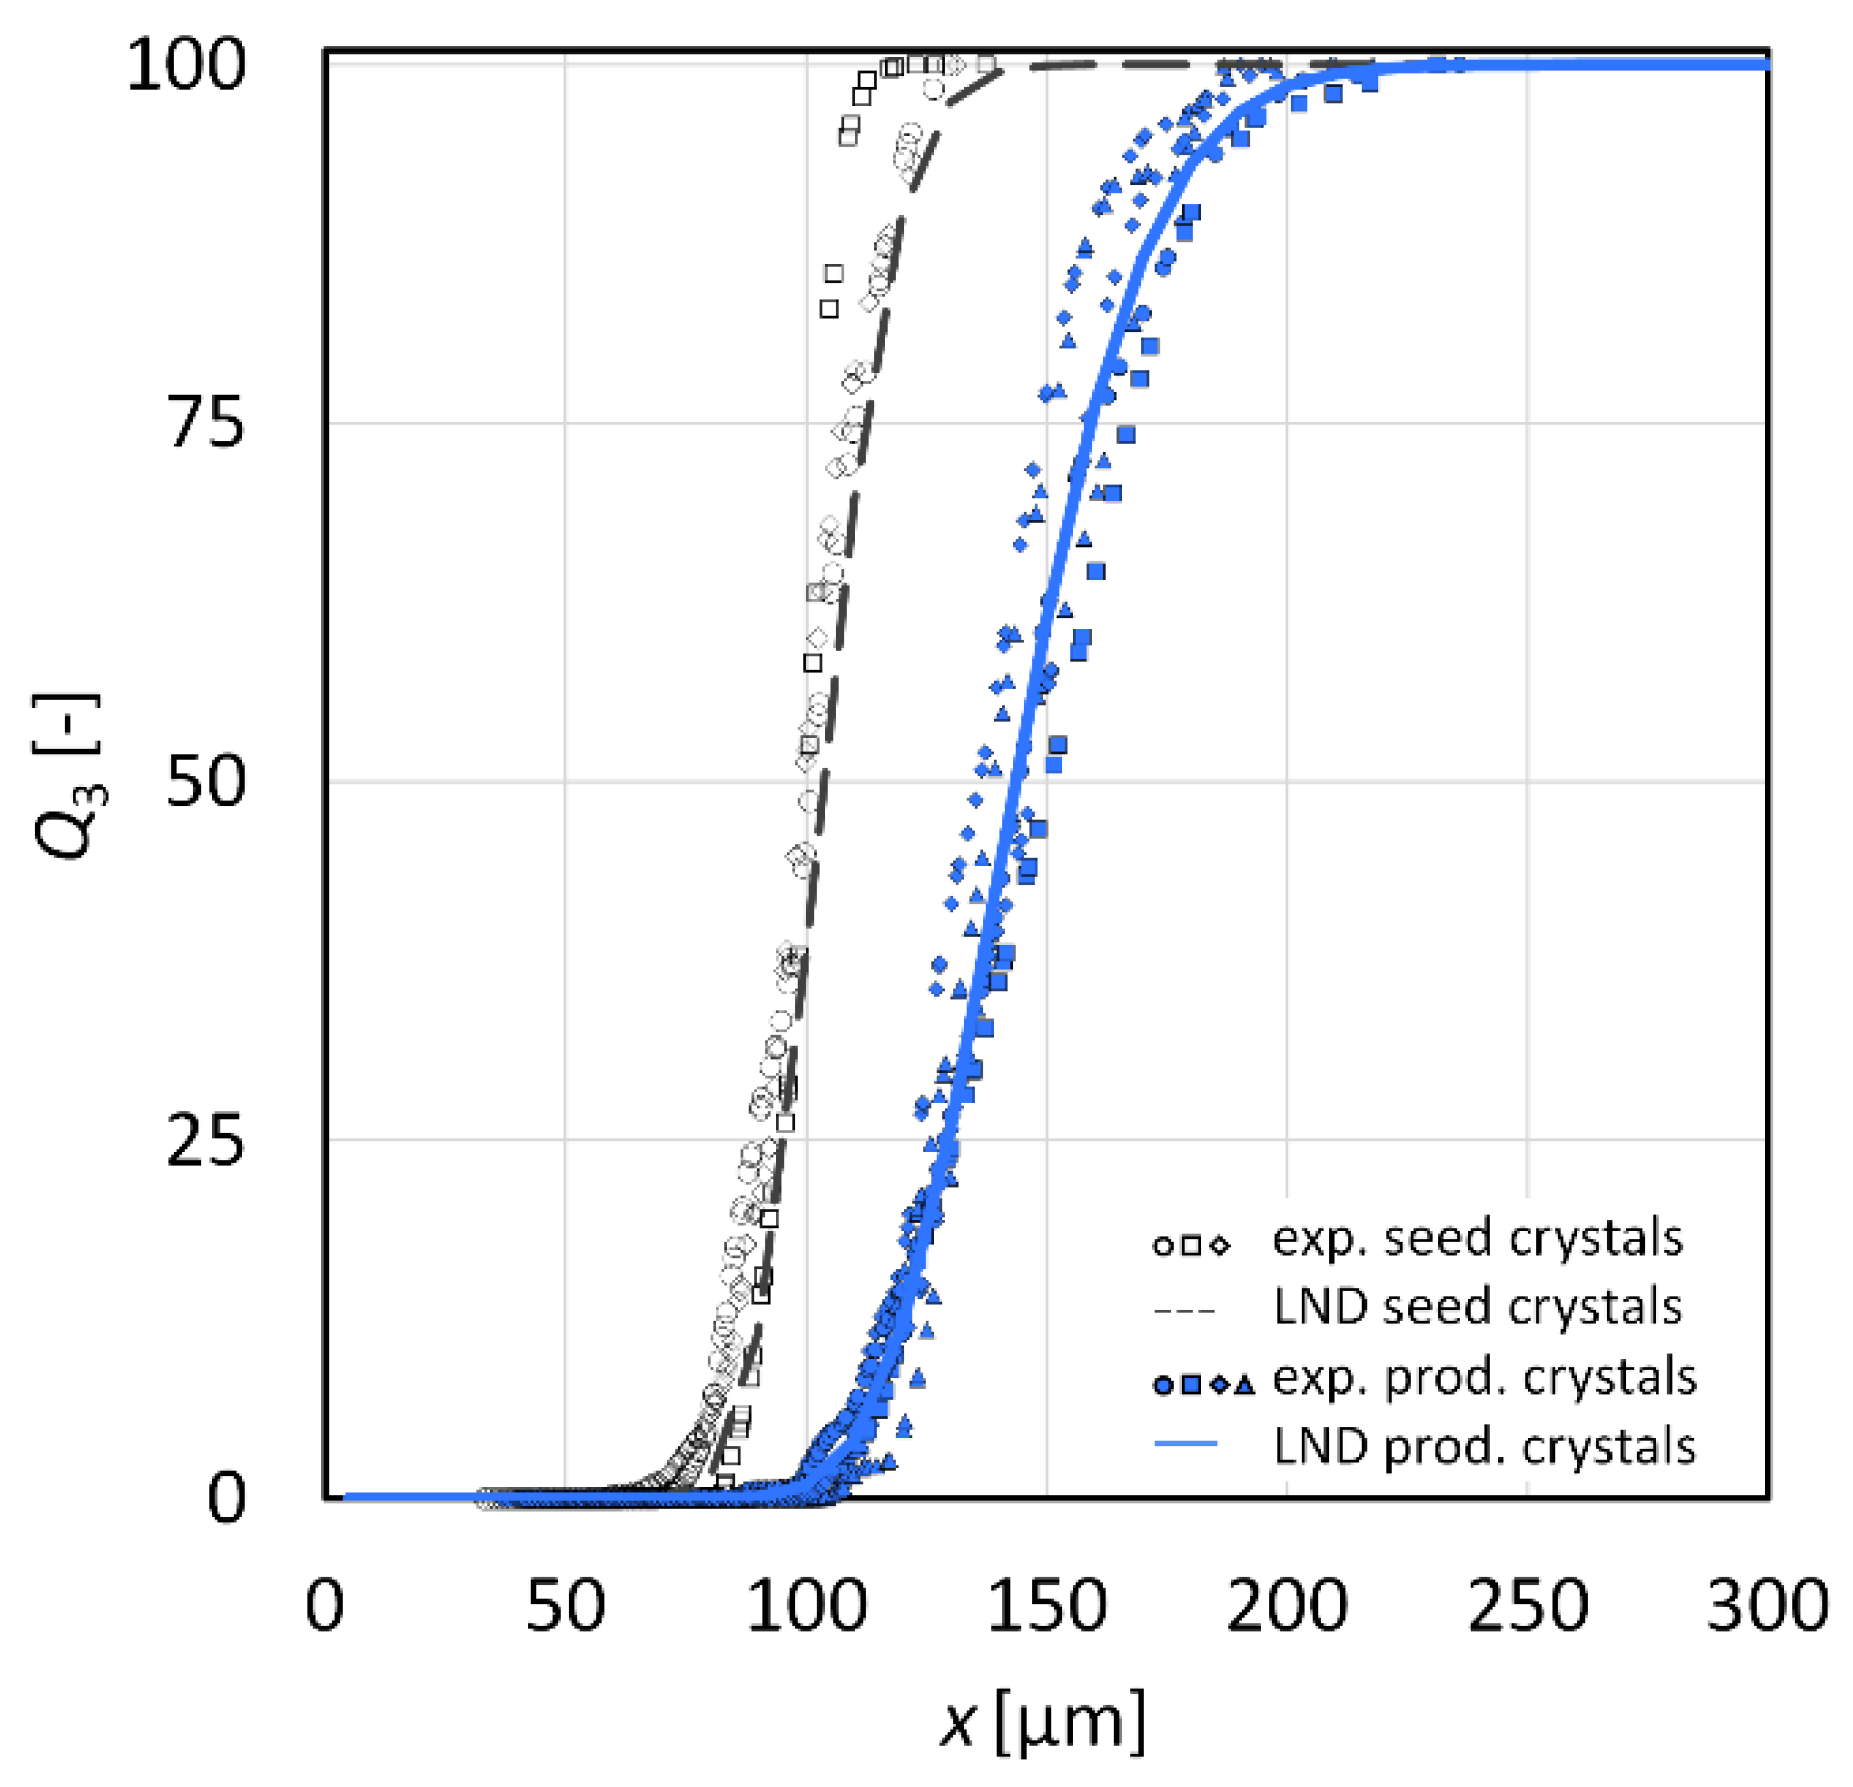
3.2. Crystal Growth Experiments

The crystal growth experiments were performed to determine the performance of the crystallizer. The aim was to evaluate an operation window and investigate the hurdles and behavior during crystal growth experiments in the crystallizer. Furthermore, the performance was compared with two other tube crystallizers [42,44]. For comparison, similar process conditions were chosen. Additionally, the same substance system, l-alanine in water, was chosen. Finally, the feasibility for another amino acid water-based system (glycine) was tested.

3.2.1. l-Alanine

For the crystal growth experiments with seed crystals for l-alanine, the saturated solution was cooled from 30 to 23.6 °C, so it is pretty similar to the investigations of Reference [42]. An exemplary temperature profile and the process parameters for the crystal growth experiments can be taken from support information in Appendix A Figure A3. The results of the crystal growth experiments are listed in Table 3.
For the gravimetrical evaluation, it was determined that the highest solids increase is for the minor seed fraction (90–125 µm) with around 1 w.% seed fraction ( w ¯ ala , S , seed ). Here the solids fraction doubled. It is also reflected in the relative yield, which indicates how well the system has approached the solubility line. With regards to the evaluation of the results, the relative yield is considered more apposite than the increase in solids content ( Δ w ¯ ala , S ). The sampling of the solid phase is subject to the pulsation of the peristaltic pump so that this can already influence the small sampling. Therefore, the information on the increase in solids is more helpful in determining whether an increase in solids and, thus, crystal growth could be detected. For every experiment, crystal growth was detected regardless of the seed crystal size or amount. Nevertheless, it is determined that supersaturation is less reduced for the small number of seed crystals (seed90–125 3 and 4). The few seed crystals offered not enough area to reduce the supersaturation in this crystallizer with the chosen residence time.
A few numbers of crystals should lead to a higher increase regarding the particle size ( Δ x 50 , 3 ). This hypothesis can be confirmed by facing the crystal size results (determined with the sedimentation method). In the experiments with the smallest number of seed crystals, the particle size increased most with 66–71.5 µm. The same seed fraction size but with a higher amount of seed crystals, crystal size increased only about half (around 30 µm). Due to the higher amount of available area to grow the next higher seed fraction size (125–180 µm), the crystal size increased a bit more. For the mixed seed crystal fraction (90–180 µm), only less to no increase in crystal growth could be detected. For the first experiment, the crystal size even decreased. For the experiment seed90–180 1, the crystal size might be decreased because the ambient temperature was a slightly higher than for the other experiments (see Appendix A Table A3); hence, the analyzed crystals could have been dissolved. Nevertheless, for the second run with the mixed seed fraction size, the crystal growth was marginal and not so uniformly as in the other experiments (see Figure 5).
In Figure 5, the crystal size distribution is shown in boxplots for every experiment. It is shown that it widens a bit for every product crystal size distribution, but except for the mixed seed crystal fraction, the crystal growth is almost uniform. To further determine why there was no detectable increase in crystal size for the mixed seed fraction but an increase in solid, further microscope images of the experiments are consulted.
In Figure 6, microscopic images of the seed and product crystals are shown. As the particle size distribution in Figure 5 already showed, for the narrow seed crystal fractions (seed90–125 2 and seed125–180 2) a uniform crystal growth can be detected. For the mixed seed fraction (seed90–180 2), the crystals tend to agglomerate and are more concentrated in the middle of the tube. Because agglomeration and aggregation occurred, the determined crystal size might increase so much that the crystals were not detectable anymore for the sedimentation method. The particles’ sedimentation velocity is used in the sedimentation method, and by analyzing too big crystals, the particle flow velocity might be too fast to detect these agglomerates. Similar observations were already made in the past [70]. The increase regarding the solid weight fraction shows that there was a crystallization process. The CSD has got wider, not narrowed (Figure 5). Accordingly, the observation already made in Section 3.1 that no classifying effect of a mixed particle size fraction in the CFIC can be confirmed. However, there is improved mixing in contrast to the vertically coiled tube crystallizer [43]. It confirms the assumption that there is also an enhanced particle–particle interaction, leading to more agglomeration. Due to the agglomeration formation, the crystals also seem to concentrate in the center of the flow. The large agglomerates align themselves so that they float forward with the shortest area (frontal area) if possible. This agglomeration formation cannot be seen in the other experiments because the individual crystals are distributed over the entire flow profile. In order to investigate the agglomeration degree, it should be evaluated, as presented in Reference [44]. However, here the analytic is limited to the microscopic images and sedimentation method, so we did not investigate it further at this point.
For the few seed crystals (seed90–125 3 and 4) on the microscopic images, in addition to the crystal growth, secondary nucleation can be detected. The same observations were made by Termühlen et al. [44] for seed weight fraction of 0.1 w.%. Hence, it confirms that the supersaturation is too high for too few crystals to be reduced without secondary nucleation.
The operational time for each experiment ( t exp ) is listed in Table 3. For seed90–125 1 and 2, no clogging was detected, and the experiments only had to be stopped because of the available feed amount. For the same size fraction but less seed amount (seed90–125 3,4, 0.01 w.%), the experiments stopped because of clogging, probably in module one. (The location of clogging can only be determined by rinsing the crystallizer afterward with water and evaluating where it took a long time to unclog). This clogging location is also an indication for secondary nucleation because the supersaturation in the first module is the highest, so secondary nucleation is most probable there.
For crystallization experiment seed125–180 1, first, the tube was clogged at the three-way valve of the pressure sensor. As a result of this, the pressure loss did not increase but decreased, which is why a lower threshold for the anti-plugging concept is necessary. After the renewed start of the experiment (rinsing and renew stable temperature profile), the crystallizer clogged after 20 min directly in front of the magnetic valve B. Here, as bottleneck was determined, the opening of the magnetic valve connector because that was first less than 1.6 mm in diameter. After this experiment, the opening was extended to 1.6 mm. The other experiment of the same seed crystals was clogged after 10 min for the first time, but it could not be determined where it was clogged. After a short time of rinsing (around 3 min), the experiment started again. This time, it clogged after 37 min. It clogged in the feed tube before entering the peristaltic pump cause of the settled seed crystals of the run before, here they grew in the tube until it clogged. In the future, the feed tube should be heated above the saturation temperature to dissolve seed crystals that settle undesirably.
The mixed seed fraction (seed90–180 1 and 2) showed the quickest and highest susceptibility for clogging. Just one time, the clogging location could be detected (seed90–180 2 after 35 min) between CU two and three because of a minimal inaccurate tightening between the connectors. In the remaining cases, the clogging location could not be localized, and this is primarily an indication for clogging inside the CUs. Probable that the higher degree of agglomeration led to bigger complexes that clogged the tube.

3.2.2. Glycine

Glycine in water was chosen as an additional substance to investigate for the following reasons:
  • Feasibility of another substance system shall be shown;
  • A higher solid amount should be reached due to the higher dependency of solubility of glycine in water than l-alanine in water;
  • Its structure is similar to l-alanine.
The last point allows excluding the influence on the interaction between the surfaces of the crystals and the tube. The solid density is a bit higher for glycine than l-alanine, so with this crystal growth experiment, further proof of the conditions for homogenous suspension flow was provided. In another study, glycine was already investigated concerning its nucleation in a slug flow crystallizer [63].
Almost the same cooling temperature was chosen for the process condition, so the saturated solution (30 °C) was cooled down to 25 °C. Due to the best experimental results for a seed crystal amount of 1 w.% and sieved crystal size of 90–125 µm with l-alanine, these conditions were also chosen for the crystal growth experiment with glycine. As already mentioned, the mass flow rate must be recalculated to ensure a homogenous suspension flow in the CFIC. Since the inner diameter is already given, the mass flow rate can be adjusted to approximately the same maximum particle size that can be transported. A mass flow rate of around 24 g min−1 is calculated for the higher solid density of glycine. The mass flow rate was chosen slightly higher to ensure homogenous suspension flow for the glycine system (26 g min−1). All process parameters and results can be taken from Appendix A Table A3 and Table A4, respectively.
Figure 7 shows the crystal size distribution of the seed (grey) and product crystals (blue) determined via the sedimentation method. A logarithmic normal size distribution (Equation (13)) is adjusted to the experimental values via minimizing the sum of the error squares by fitting the standard deviation ( σ LND ). Therefore, the error function (erf) is used.
Q 3 ( x ) = 0.5 · [ 1 + erf ( l n ( x / x 50 , 3 ) 2 σ LND ) ]  
It can be seen that the seed crystals (x10,3 87 µm; x50,3 104 µm and x90,3 123 µm) grew about 40 µm (x10,3 117 µm; x50,3 144 µm and x90,3 171 µm) uniformly, and the smaller crystals grew a bit less than the bigger ones. This observation could indicate a crystal-size-dependent growth, but it needs a lot more investigation. The crystal size distribution itself widens a slightly from σ LND , seed 0.12 to σ LND , prod 0.15, but it is still narrow. Furthermore, the solid weight fraction increases to 2 w.%, and the relative yield for this experiment is also higher than for the l-alanine crystal growth experiments with around 71%. This indicates that the residence time chosen for glycine is more effective in reducing the supersaturation than for l-alanine. Uniform crystal growth is also observed on the microscopic images (Figure 6).
During the experiment, the “pressure loss rinsing” program ran. Clogging was detected after 31 min, so the system switched to water. Unfortunately, it could not be detected where the clogging occurred. Probably it happened in the CFIC due to a too big grown crystal. The system needed 29 more minutes switching between water rinsing and feed suspension till a new stable run was started for 12 min. The evaluation of the anti-plugging strategies is further described in the next section.
All in all, this single experiment emphasizes that crystal growth with seed crystals is also possible with another substance system and not only for l-alanine. It might be even better to take substance systems with higher solubility in water to exploit the potential of the crystallizer if the optimized conditions were chosen.

3.3. Anti-Plugging Strategies and Suspension Detection

In the long term, a continuous operation mode can only be guaranteed if anti-plugging strategies are applied. Here two different anti-plugging strategies are introduced and ran during three experiments. From the literature, the prophylactic rinse cycles are already known. Besenhard et al. [24] rinsed their crystallizer with solvent every 10 min for approximately 2.5 min. It equals 20% of the processing time. For a continuous mode, this is too much solvent loss and a too short production period. In this work, the rinse cycles shall be decreased in number and duration to save solvent and maximize production time. The experimental procedure of the anti-plugging strategies is described in Section 2.4.3.
For the prophylactic rinse, every 13 min for 10 s, the crystallizer was rinsed, which equals 1.3% of the processing time, to avoid clogging even from occurring. Whereas for the pressure loss rinsing, the processing time is exhausted till a clogging occurs. Hence, the rinsing process only starts after the pressure loss increases above the set threshold and switches to suspension again if the pressure loss is decreased to the level before. In this case, it is not predictable which solvent amount can be used to unclog the crystallizer.
An exemplary diagram of the pressure over time for the prophylactic rinsing is given in Figure 8. Here is also shown the magnetic valve position on the second axis. The pressure loss thresholds can be firstly calculated according to Equation (3) and later adjusted with already reached experience. It can be seen that the pressure loss increases in the beginning due to the switch from water to suspension, then it even comes to a stable value. The rinse cycles have less impact on the pressure loss. However, during the rinse cycle, under the microscope, it was observed that the rinse solvent has an impact of approximately one minute of the suspension because of the gradient between the solvent and suspension. Additionally, the slight difference between the fluid and solid residence time has led to a mixing.
During the application of prophylactic rinsing, the crystallizer did not clog, was stopped due to ran out suspension, and operated for 66 min (five time slots), which equals around 17 residence times. Admittedly, by evaluating this experiment, the smallest seed fraction, 90–125 µm, was used, as it does not have any clogging problems in the other experiment without prophylactic rinse cycles.
For the pressure loss rinsing, an exemplary diagram is shown in Figure 9. As already described in Section 3.2.1, the first clogging appeared after 35 min, and it clogged between CU 2 and 3 due to a minimal inaccurate tightening between the connectors. It was necessary to resolve it manually, and water rinsing was not sufficient. Probably, with the use of a prophylactic rinsing, this could have been avoided. However, in the following process, the process was not so stable as in the beginning. It emphasizes that a once-disturbed process is harder to bring to a stable process than one that is continuously running. Additionally, it can take a long time until the clogging is resolved only by solvent, which has the saturation temperature. For example, for the experiment glycine90–125, it took 29 min until unplugging was reached. Therefore, a high amount of solvent can be necessary, and production time decreases.
In summary, prophylactic rinsing has the advantage of generating a more stable process, and it is better calculable which amount of solvent is necessary. A rinsing due to clogging can additionally be implemented. (In this case, it was implemented see Appendix A Table A4, but it does not come to this case in our investigations.) Disadvantageous is the impact of rinsing on the product quality. Even though there is a short rinsing time, the shift between the phases can impact the crystal size.
A sensor for suspension detection might help gain only the product suspension and not the rinse water or the influenced suspension. Therefore, a sensor equipped with a photoresistor was tested concerning its feasibility. It was applied for experiment seed90–180 with the pressure loss rinsing. Its pressure loss is shown in Figure 10. Additionally, the position of magnetic valve B is shown and the measured resistance value from the photo sensor.
At the beginning of the experiment, the threshold for the water and suspension distinction was well chosen. The magnetic valve control worked fine during the clogging process because it switched to the waste slot during pressure loss increase. Some crystals probably flow through the crystallizer during the resolving process, so the resistance value was smaller than for water and identified the phase wrongly as the product suspension. Thus, in the future, it will be necessary to implement a lower threshold as well. The following wrong magnetic valve positions were due to a not ideal chosen threshold. It was chosen a little too high, so it was still indicated as suspension instead of water. Thus, longstanding, the threshold evaluation has to be adjusted more precisely to reach a better distinguishing between solvent and suspension phase.

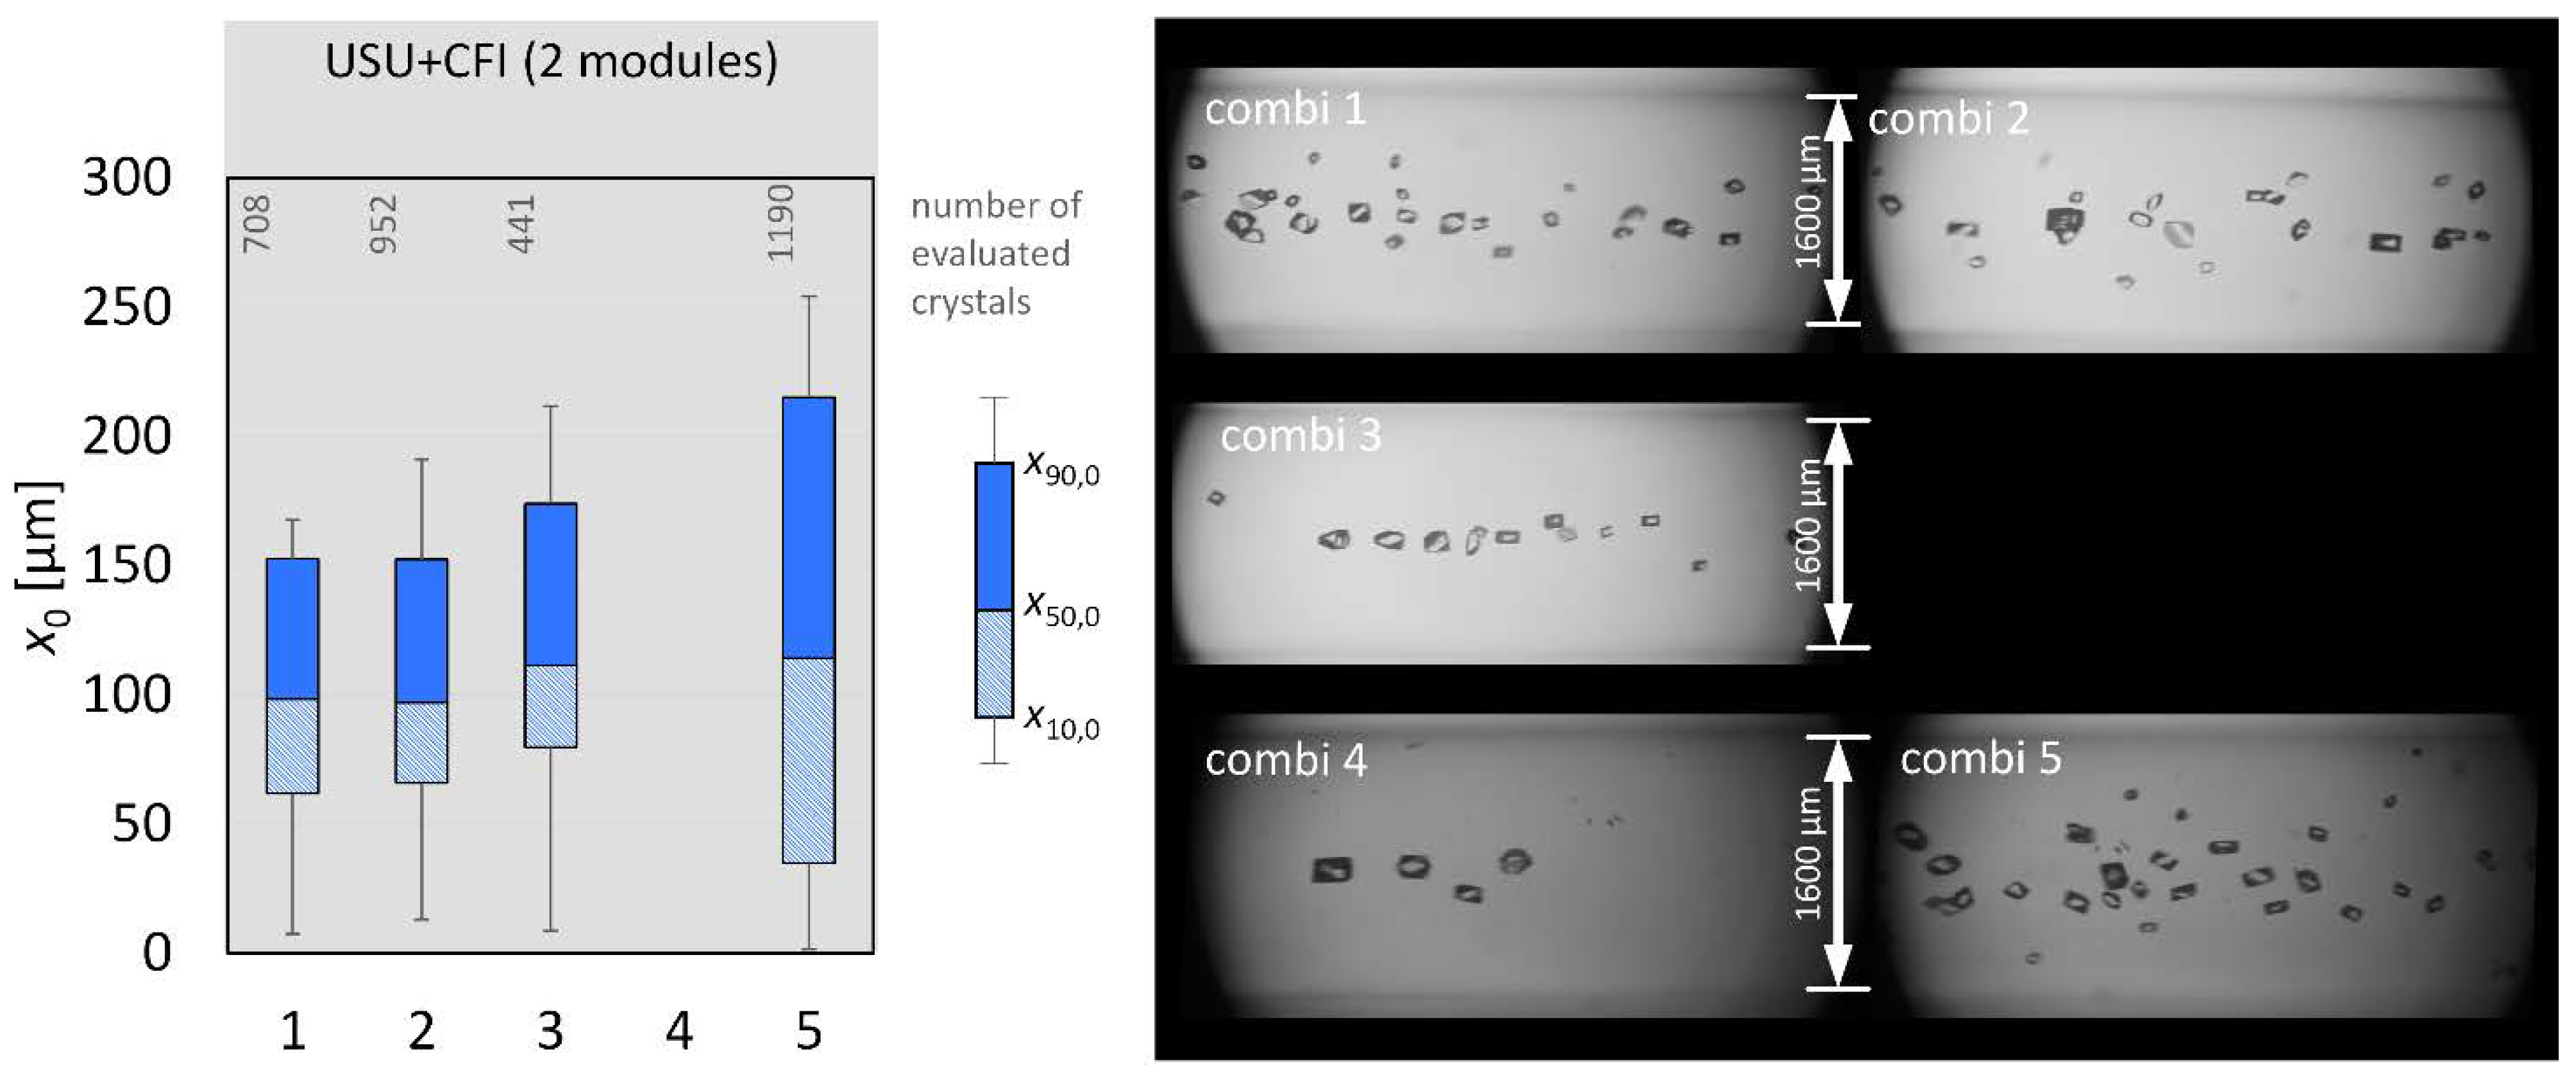
3.4. Combination: Nucleation and Crystal Growth

A continuous crystallization process is most effective if the whole process from nucleation to crystal growth until solid-liquid separation can be combined. For the last step, recently, a continuous vacuum screw filter for small-scale solid−liquid separation was developed [91]. The combining of nucleation and crystallization is tested in the following. Therefore, the USU for the nucleation process is combined with the CFIC for crystal growth. Only two CUs were used in these investigations because, in pre-tests, particular susceptibility to clogging occurred between CU two and three. Probably the saturation was not reduced enough, and secondary nucleation or agglomeration prevails too much for a stable process. The process conditions must be chosen to gain nucleation in the USU, so a saturation above 1.25 was chosen (around 1.3), as it was determined as a nucleation threshold in the USU for the l-alanine/water system (see Reference [25]). Appropriate to this, the undersaturated solution in the feed tank was set for the saturation concentration of 50 °C and overheated to 55 °C. As Section 2.4.5 already described, switching between solvent and solution is performed manually for experiments 1–3, and for experiments 4 and 5, the magnetic valves were implemented. For combi 4, the pressure loss rinsing ran, and for combi 5, the prophylactic rinsing ran ( Δ t slot = 8 min, t rinse = 10 s). Additionally, for experiments 1–3 another l-alanine batch was used as for experiments 4 and 5. The used l-alanine is from the same manufacturer for the combi experiments differing from the crystal growth experiments. For nucleation, every impurity can influence the nucleation process. To gain more comparability to the nucleation experiments in the USU [25], the conditions should be chosen as similar as possible. Only the image analysis was performed for the experiments because the experimental setup should be observed the whole time to evaluate if crystals are continuously produced. The thermogravimetric method was only used to sample the feed tank solution to calculate the gravimetrically determined saturation S G (see Equation (14)).
S G = w w ( T TI _ 22 )
In Table 4 and Appendix A Table A7, the process parameters are listed. The process conditions for the experiments are almost the same. More significant deviations are only present for the temperature in the ultrasonic bath and the ambient temperature. The temperatures are exemplarily shown in Appendix A (Figure A4) over the length of the equipment. The bath temperature must be chosen around 6 K less for experiments 4 and 5 than for experiments 1–3 to gain the same outlet temperature after the USU. It seems that the ambient temperature, around 2 K higher for combi 4 and 5, already has a high impact on the temperature in the bath, due to the open water surface. The first detection of the crystals t cryst was almost at the same time for every experiment, around one minute after one calculated residence time ( τ USU + 2 CUs = 45 s [25] + 117 s [56] = 2.7 min). However, for combi 4, significantly fewer crystals could be observed.
Combi 1–3 are more stable because the clogging appeared later than in experiments 4 and 5 (Table 4). For experiment 4, the pressure loss rinse was insufficient, so the clogging could not be dissolved during the operation. Afterward, the rinse cycle time for the prophylactic rinse for experiment 5 was set to 8 min, but the tube was already clogged after 7 min, and then rinsing again was not sufficient to unplug the clogging. According to Eder et al. [23], the combination experiments with slug flow lasted about 25 min. Unfortunately, there is no information on whether the experiments stopped due to the absence of feed solution or clogging. Nevertheless, the longer operating time indicates a more stable operation when slug flow is used.
The experiments were also investigated concerning the crystal size distribution via image analysis. The distributions are shown in Figure 11. For experiment 4, no CSD was determined, because too few crystals were observed during the crystallization process, even though the microscope image in Figure 11 for combi 4 suggests otherwise. For combi 1–3, the CSD (x10,0 69 µm x50,0 102 µm x90,0 160 µm [±12 µm]) is relatively small. For combi 5, the CSD is broader (x10,0 35 µm x50,0 114 µm x90,0 215 µm), which could indicate a higher secondary nucleation and a higher crystal growth rate.
In order to be able to interpret the combi experiments holistically, all tests with their observations must be evaluated together. First of all, combi 4 showed the most significant deviation of all experiments. Few nuclei were formed, even though the USB was cooled down considerably more. In other preliminary tests of the same educt l-alanine batches, no nuclei were detected at the corresponding ultrasonic bath temperature of tests 1–3. This observation indicates a deviating nucleation behavior compared to the results of Reference [25], where nuclei could be detected from the upper threshold of supersaturation of more than 1.25 for the l-alanine system. After extensive error analysis (operator, plant modification, and environmental influences), the reactant batch of l-alanine used was identified as the cause of the deviating results. According to the manufacturer’s certificate analysis, the batches deviated by 0.1 at the analysis item: pH (2.5% H2O, 25 °C), (combi 1–3 pH 6.2; combi 4 and 5 pH 6.1). Therefore, it can be assumed that there was another ionic concentration for tests 1–3, i.e., for the experiments in Reference [25] as well. The nucleation threshold was somewhat lowered compared to tests 4 and 5. Due to the shifted nucleation thresholds for combi 4 and 5, the system was probably in the nucleation transition range, so some crystals were visible for combi 4 and many crystals for combi 5.
Unfortunately, further experiments on these deviations could not be carried out, because the l-alanine used in the two batches was used up by that time. Moreover, the supply conditions for the l-alanine for the nucleation experiments had changed due to the corona virus pandemic.
Finally, it can be concluded from the combination experiments that a combination of continuous nucleation followed by crystal growth in a CFIC is possible in principle. A prophylactic rinse with very short crystallization slots should be used. Accordingly, it is more efficient to work directly with slug flow. Furthermore, the nucleation behavior of the substance used should be known precisely, so that the process conditions can be adjusted if there are quality deviations concerning the educts used (which is usually the case in industrial operation). It is also likely that a substance system whose nucleation threshold is already at a higher temperature and nucleation occurs with minor temperature difference is more promising in this crystallizer concept.

4. Discussion

Regarding the residence time distribution investigations, we can confirm that the residence time distribution for the liquid and solid flow is very narrow and is similar to an ideal plug flow [54]. Moreover, for scale-up CFI design ( d i 10 mm), the RTD of the liquid phase is also similar to an ideal plug flow [92]. Additionally, for homogeneous suspension flow in a horizontal CFI, the particles flow faster than the mean fluid element [54].
In other studies, vertical helical coiled tubes were investigated regarding the residence time behavior of the solid phase [43,58,93]. However, some of the investigations are performed in the moving sediment flow regime [54], and it was observed that the particles are slower than the liquid phase [93]. Additionally, Wiedmeyer et al. [43] investigated the influence of different particle sizes. They found out that the larger particles (around 160 µm) got a shorter residence time than the smaller particles (around 80 µm) [43]. Even for a mixed fraction, the bigger crystals travel faster than the smaller ones [43]. With the presented results, it can be added that the larger crystals travel faster than the smaller ones for helically coiled tubes if the sieve fractions were investigated independently from each other. Therefore, the velocity profile must affect transporting the small particles through the secondary flow to regions of lower axial velocities [43]. The particles do not approach so close to the wall to underlie the no-slip condition, if taking the previous observations into account.
For the mixed sieve fraction here, the solid phase behaves more like the smaller crystals. Hence, this comparison could indicate a more classifying behavior regarding the crystal size in a vertical coiled tube than in a helically coiled tube, presumably because of the stronger influence of gravity. This effect would lead to a better mixed suspension and a reinforced particle–particle interaction in the helically CFI tube than in a vertically coiled tube. It should be considered that they used a pulse-response, whereas a step-response was used here. In order to be able to make an accurate statement as to whether the classifying behavior of the particles is more pronounced in a vertically coiled tube than in a horizontally coiled one, further investigations are necessary, for example, the influence of the different tube materials was not considered (polysiloxane [43] vs. FEP here).
To evaluate the performance of the crystallizer, we compare it with a bigger CFIHohmann ( d i = 4 mm) [42] and a vertically coiled tube with slug flow ( d i = 3.2 mm) [44]. These are good examples to compare with because the same substance system was chosen (l-alanine/water), with almost the same seed ratio (1 w.%), and with the same tube material (FEP). We here give an overview of the three crystallizers (Table 5) and compare their performance.
The most significant difference is the smaller flow rate combined with the smaller inner diameter for the CFIC. This results in different mean velocities as well. Thus, the CFIC has a mean flow velocity of around 0.131 m s−1, the highest mean flow velocity for the CFIHohmann is 0.052 m s−1 [42], and the highest mean flow velocity for the slug flow crystallizer (SFC) is around 0.083 m s−1 [44]. Due to the change of the diameter and the flow rates, the flow velocity of the CFIC is the highest. Nevertheless, the CFIC consumes the least solvent amount. Regarding the residence time, all crystallizers show a very narrow distribution. Most flexible is the design of the CFIC because its residence time can be adjusted according to the length by varying the numbers of CUs [56].
The temperature control concepts are all different, and each has got its advantages. Hence, for every new crystallization process, it is necessary to evaluate this point before constructing a new crystallizer and chose the best option for the current separation task or the already existing equipment. It could also be possible that a step profile for another process might be the best, so several water baths could be the best option described by others [19,23,45].
To evaluate the performance of the crystallizers regarding the crystal growth rate, it is determined via the shortcut method (see Equation (12)). For the investigations made by Hohmann et al. [42], the crystal growth rate was determined via the x 50 , 0 instead of the x 50 , 3 but the seed and product crystal size difference is used, so the value is still comparable. For the crystal growth experiments by Hohmann et al., the growth rate is determined from 0.055 to 0.079 µm s−1 [42]. The crystal growth rates for the presented crystal growth experiments are about twice as fast for the narrow seed crystal fractions (90–125 µm and 125–180 µm). For the experiments with fewer seeds, it is even higher. The results show that the miniaturization of the crystallizer and, thus, the improvement of the surface to volume ratio improved the crystal growth performance. With the crystallizer presented here, up to 50 % solution can be saved compared to the crystallizer developed by Hohmann et al. [42] for process development. Since the use of half the suspension mass flow rate was sufficient. The presented crystallizer is sufficient to transfer from a small to a larger tubular crystallizer, as described in Reference [55]. The intermediate stage is not urgently needed for an approximate prediction of the crystallization behavior.
For the helically coiled tube crystallizer with slug-flow designed by Termühlen et al. [44], the calculated crystal growth rates are in the range of 0.127 to 0.411 µm s−1. For the comparison, it must be considered that the seed crystals were prepared differently from each other, which can influence the growth rate, as well as the different cooling range from about 50 to about 31 °C [44]. However, based on this first comparison, it can already be estimated that operation with slug flow does not require a homogeneous suspension flow. For this reason, it can achieve higher residence times and, thus, higher growth rates. Nevertheless, Termühlen et al. have also observed a higher agglomeration formation at low flow rates [44], i.e., stagnant or moving sediment.
In our investigations, the operation time until clogging depends on the chosen seed fraction and other circumstances. It must be concluded that this small-scale crystallizer is susceptible to clogging, although anti-plugging strategies were tested and homogeneous suspension flow implemented. Thereby too big crystals should not be used in this crystallizer. Nothing about clogging issues was found in References [23,44] for the SFCs known from the literature. This indicates that the clogging issue is there less distinct. However, using an SFC is necessary to add equipment for the second (air) phase (pump, mixing connector, gaseous phase needs to be saturated, and others). Additionally, there are different mechanisms for the slug implementation [94] and other parameters, which impact the slug size [45,95]. Furthermore, it has to be taken into account by using slug flow that the wall film can influence crystals movement [45], so the wall film has to be avoided strictly [96]. Therefore, the choice of the used tube material with the interacting substance system is essential [96]. Advantageous of the CFI concept is the space-saving structure due to different possible designs [46,56]. Furthermore, the mixing in the CFI design can be increased compared to a helix [53,97].
For all crystallizers, it is necessary to suppress secondary nucleation by sufficient seed mass. Further interesting questions concerning the coiled crystallizer are the limitation by higher viscosity substance systems and which crystallizer leads to a higher agglomeration degree.
Next to the residence time distribution and crystal growth experiments, the combination of nucleation and crystal growth was investigated. These results are compared with the most similar cooling crystallization investigations known from the literature (Table 6). However, they are not really comparable with each other due to the different substance systems investigated, where each has a different nucleation and crystal growth kinetics.
For the comparison, it must also be considered that Han et al. [19] used seed crystals, so they only investigated crystal growth and not the whole process with nucleation and crystal growth. Nevertheless, they gave information about their running times, and they also used coiled tubes in ultrasonic baths during their crystallization processes. The group of J.G. Khinast already separated the nucleation and crystal growth process from each other [23,24]. Eder et al. used a coiled tube in an ultrasonic bath and continuously mixed the stream with the seed nuclei and solution [23]. Further, they supported the system with (air) slugs to avoid clogging [23]. Besenhard et al. also used an ultrasonic bath but with a round-bottom flask to induce nucleation in this flask, so the nuclei were formed in a batch mode [24]. Accordingly, the new concept about the USU+CFIC is the continuous nucleation formation connected with the continuous crystal growth units without using an additional phase to implement slugs.
The crystallizer used here has the smallest tube inner diameter, the one used by the research group of J.G. Khinast [23,24] was in a similar range of 2 mm. Han et al. [19] used an even bigger tube with 4 mm inner diameter. Known investigations from the pilot scale were not compared here [20].
Regarding the cooling strategy for the nucleation and crystal growth experiments, the USU+CFIC is built with the fewest number of cryostats. Every experimental setup needed an external cryostat for the nucleation formation if the ultrasonic bath has no internal cooling cycle. The tube-in-tube counter-current cooling concept for the CFIC only requires one cryostat. The crystallizers, by the others, are equipped for each of their temperature step with one cryostat [19,23,24]. For other separation tasks, as already described, it always has to be considered which cooling strategy might be the best concerning temperature controllability and flexibility and investigation cost or rather already existing equipment.
One significant difference between the crystallizers is the tube material because, from the literature, it is known that the material influences the tendency to adhesion and clogging [84]. Wang et al. found out that the general tendency regarding clogging is “steel > silicone rubber > polyvinylidene chloride > polytetrafluoroethylene > glass” [84]. The already investigated materials suggest that the used crystallizer should be less susceptible to clogging than the others. This hypothesis cannot be confirmed, because, on the one hand, the shortest running time was detected for the combination experiment with 2.5 residence times. On the other hand, the longest-running time of 7.2 residence times (without rinsing) was detected for the combination experiments. Furthermore, the exact information about the length of the experiments and the reason for each stop is not precisely specified in the two sources [19,23], which makes a more detailed comparison impossible.
However, the investigations show that the highest ratio from biggest particle size to inner diameter was reached for the crystallizer introduced here. This ratio could be why the crystallizer introduced here has a variable tendency to clog because the crystals were already too big for a stable operation. Thus, the ratio from the biggest particle to inner diameter may not be chosen to be above 0.1, as Han et al. [19] did to enable a stable crystallization process.

5. Conclusions

Continuous cooling crystallization for small-scale devices is an active field of research, especially for fine chemical and pharmaceutical production, due to the paradigm shift from batch to continuous production. To overcome the solid handling challenges, various equipment and process concepts are under investigation. The here presented crystallizer with separated nucleation and crystal growth units designed in coiled flow inverter (CFI) design was investigated regarding the following:
  • Residence time distribution (RTD) for different phases and particle sizes;
  • Crystal growth for different sieved seed particle sizes, seed amount, and two different amino acids;
  • For combined nucleation in an ultrasonic bath and crystal growth units in continuous flow.
Furthermore, anti-plugging strategies with two different rinsing concepts were tested in combination with a photometric sensor for suspension detection.
The investigated crystallizer shows RTD behavior similar to an ideal plug flow for the solid and liquid phases. The solid phase travels faster than the liquid phase for the horizontal coiled crystallizer and homogenous suspension flow because the particles do not underlie the no-slip condition.
The crystal growth experiments show comparable results for the substance system l-alanine in water, as already investigated in the literature. The comparison evaluates that the smaller CFIC presented here consumes half of the solution for almost the same or even better results. Hence, the presented crystallizer is appropriate for process development. Furthermore, best handling could be achieved by using the small sieved crystal size fraction (90–125 µm) and a sufficient amount of seed crystals (1 w.%), with the latter preventing secondary nucleation. The longest operation duration was 32 residence times with 18.6 g min−1 suspension mass flow rate. Further, the comparison between the CFIC and SFC shows the advantages of both concepts.
Feasibility for combined nucleation and crystal growth in continuous flow could be achieved. Additionally, the combination of nucleation and crystal growth was compared with similar concepts from the literature and evaluated concerning the operation. However, the system was not stable enough to run for more than 7.2 residence times, although a rinsing concept against clogging was implemented. In the future, the anti-plugging concepts should be further developed.
Two different anti-plugging concepts were also run during the crystal growth experiments. A prophylactic rinsing showed a more stable process than a rinsing that only reacts to increasing pressure loss due to clogging. A sensor concept for suspension detection was also implemented to avoid waste due to the rinsing. Feasibility could be shown for distinguishing between solution and suspension and connection to a magnetic valve to separate the waste phase from production suspension.
The introduced crystallizer concept can be used, on the one hand, for lab-scale process screening to quickly gain information about the rough crystal growth behavior in continuous flow and less use of material and devices, such as the number of cryostats or additional equipment to introduce slug flow. On the other hand, the opportunities and hurdles are shown regarding the use for small-scale production.
Precipitation and anti-solvent crystallization often need intense mixing and create smaller crystals. Hence, the CFI crystallization concept might be more effective for anti-solvent crystallization than for cooling crystallization. Additionally, the technology could be used for fine-grain removal, which is used for draft tube baffles to grow crystals instead of dissolving crystals.

Author Contributions

Conceptualization, M.S. and N.K.; methodology, M.S.; software, S.K. and F.S.; validation, M.S., S.K., L.K.W., and C.H.; formal analysis, M.S., S.K., L.K.W., C.H., and F.S.; investigation, M.S., S.K., L.K.W., and C.H.; resources, given in the text; data curation, M.S., S.K., L.K.W., C.H., and F.S.; writing—original draft preparation, M.S.; writing—review and editing, N.K.; visualization, M.S.; supervision, N.K.; project administration, M.S. and N.K.; funding acquisition, N.K. All authors have read and agreed to the published version of the manuscript.

Funding

This research was funded by the German Federal Ministry of Economic Affairs and Energy (BMWi) and the Project Management Jülich (PtJ) as part of the ENPRO2.0 initiative (Ref. no. 03ET1528A).

Acknowledgments

The authors would like to thank Gerhard Schembecker and Kerstin Wohlgemuth (TU Dortmund University, BCI Laboratory of Plant and Process Design), for their inspiring discussions on the investigations. Additionally, we like to thank Stefan Höving for the provision of the photosensor and our technician Carsten Schrömges for the technical support.

Conflicts of Interest

The authors declare no conflict of interest. The funders had no role in the design of the study; in the collection, analyses, or interpretation of data; in the writing of the manuscript; or in the decision to publish the results.

Abbreviations

SymbolsDimensionless Numbers
b coefficients Bo Bodenstein number
c p heat capacityFrd,critcritical densimetric Froude number according to a empirical correlation
d i inner tube diameter Fr d densimetric Froude number
f friction factor Re Reynolds number
F distribution sum curveIndices
g gravitational constant*saturated (equilibrated)
G ¯ mean growth rate ambient
k heat transfer coefficient0,tracertracer concentration
L length ala l-alanine
m ˙ mass flow rate c cooling agent
p pressure loss cryst (time) until crystals are visible
Q 3 crystal size distribution sum curve exp experimental (time)
S G gravimetrically determined saturation gly glycine
t time L liquid phase
t ¯ actual residence time LND logartithmic normal size distribution
T temperature p process
T ¯ mean temperature prod product crystal
u ¯ mean flow velocity rel relative
V volume SL suspension
V ˙ volume flow rate sol solution
w i mass fraction solv solvent
w ¯ i mean mass fractionAbbreviations
w s particle mass fractionCFIcoiled flow inverter
x particle sizeCFICcoiled flow inverter crystallizer
X mass loadingCGcrystal growth
Y yieldcombicombined experiments with nucleation and crystal growth
Y ¯ mean yieldCSDcrystal size distribution
Greek SymbolsCUcrystallization unit
Δ differenceDTBDraft Tube Baffle
η dynamic viscosityerferror function
θ dimensionless timeFEAFunctional Equipment Assemblies
θ ¯ mean dimensionless timeFEPfluorinated ethylene propylene
ρ densityMSMPRMultistage Continuous Mixed-Suspension, Mixed-Product Removal
ρ L density liquidMZWmeta stable zone width
Δ ρ SL density difference between solid and liquid phaseRTDresidence time distribution
σ standard deviationSFCslug flow crystallizer
τ hydraulic residence time

Appendix A

Empirical correlations of the dynamic viscosity and density in aqueous solution [42]
η sol ( T [ ° C ] , X [ g s   g s o l 1 ) = η solv ( T ) · ( 1 + ( b η , 1 ( T ) + b η , 2 ) · X )
ρ sol ( T [ ° C ] , X [ g s   g s o l 1 ) = ρ solv ( T ) · ( 1 + ( b ρ , 1 ( T ) + b ρ , 2 ) · X )
Table A1. Empirical viscosity and density coefficients for aqueous l-alanine or glycine solution.
b η , 1 ( g solv   g s 1   ° C 1 ) b η , 2 ( g solv   g s 1   ° C 1 ) b ρ , 1 ( g solv   g s 1   ° C 1 ) b ρ , 2 ( g solv   g s 1   ° C 1 )
l-alanine [42]−1.4024∙10−23.2451∙100−6.0342∙10−43.2874∙10−1
glycine7.8260∙10−31.6994∙100−8.6319∙10−44.3729∙10−1
Solubility Lines
The solubility line of l-alanine/water was used according to Reference [76], with the weight fraction w * (Equation (A3)), and has been used often [25,28,37,42,44].
w a l a * [ g   g s o l 1 ] = 0.112381 · e ( 9.08492 · 10 3 · T * [ ° C ] )  
The solubility line for glycine in water was determined experimentally by using gravimetric measurement (see Section 2.3). In a temperature range of 10–40 °C, the solubility is described via Equation (A4).
w g l y * [ g   g s o l 1 ] = 0.0029 · T * [ ° C ] + 0.1274
The solubility of glycine was determined for four saturation temperatures, namely 10, 20, 30, and 40 °C. This was carried out in a glass apparatus with four separate chambers; this enabled an independent fourfold determination. The samples can be heated to the respective temperature via the cryostat. For the samples, the solubilities determined by Reference [98] were used as a basis. A slight supersaturation of the solution was set by increasing the solid mass by 0.5 g to the calculated solubility. The subsequent evaluation of the sample was carried out by using the gravimetric method (with syringe filters).
Figure A1. Solubility curve for glycine.
Processes 09 01537 g0a1
Figure A2. Photo of the experimental setup of FPU, USU, CFIC, and PAU.
Processes 09 01537 g0a2
Table A2. Equipment list for the experimental setup.
EquipmentModelManufacturerCountryName
(in the Flowchart)
peristaltic pumpLabDos®
Easy-Load
HiTec Zang GmbHGermany-
peristaltic pump headMasterflex L7s Easy-Load®Cole-Parmer GmbHUS-
gear pumpISMATEX REGLO-Z DigitalCole-Parmer GmbHUS-
gear pump headISMATEC GA-X21.CFS.CCole-Parmer GmbHUS-
flow controlmini CORI-FLOW™Bronkhorst High-Tech B.V. NetherlandsFI_F01
scaleKern 572KERN & SOHN GmbHGermanyWI_W01
process control systemLabManager®HiTec Zang GmbHGermany-
resistance thermometersRM-Typ WL-1,5-1Pt-B-100-2RÖSSEL-Messtechnik GmbHGermanyTI_ambient, TI_00, TI_USB, TI_01-41
thermocoupletype-KOMEGA EngineeringUSTI_TIin, TI_TIout, TI_02-42
cryostat (1–3)Pilot ONE ministat 125Peter Huber Kältemaschinenbau AGGermany-
magnetic valveTyp 6626–TwinPowerBürkert GmbH & Co. KGGermanymagnetic valve A and B
pressure sensorA-10WIKA Alexander Wiegand SE & Co. KGGermanyPIA+_P01
stirrer plateMR 3001Heidolph Instruments GmbH & Co. KGGermany-
microscopeBresser Science ADL 601PBresser GmbHGermany-
cameraZ6Nikon GmbHJapan-
separation analyzerLUMiReader® PSA 453LUM GmbHGermany-
scaleMS1003S/01Mettler-Toledo GmbHUS-
Preparation of Saturated Solution, and Suspension
The respective solubility line (see Equations (A3) and (A4)) was used to prepare a saturated solution, and this was performed on the day before the start of the experiment. For dissolution, the temperature was chosen to be 5 K higher than the selected saturation temperature (residence time experiments T* = 25 °C, crystal growth experiments T* = 30 °C, and nucleation with crystal growth experiments (“combi”) T* = 50 °C). Depending on the experiment, the solution was stirred for at least two hours for complete dissolution (residence time and crystal growth experiments) or stirred overnight (for the “combi” experiments). For the residence time and crystal growth experiments, the solution was pumped via a peristaltic pump through a filter frit (pore size III, ROBU Glasfilter Geräte GmbH, Hattert, Germany) into a second storage tank which was set to the saturation temperature. The following day (the experiment day), the defined quantity of seed crystals was added from above into the storage tank about 20 min before the experiments start. The seed crystals were dry-pestled and sieved manually (Test Sieve Retsch, RETSCH GmbH, Haan, Germany).
For the combination tests, the storage tank remained heated by 5 K above the saturation temperature the entire time to exclude nucleation in the tank. In addition, the product tube was equipped with a filter frit (pore size III, ROBU Glasfilter Geräte GmbH, Hattert, Germany) for transporting the solution into the apparatus without crystals or impurities.
Modeling of the Temperature Profile
As described in Section 2.2, the cooling agent temperature ( T c ) was measured directly, and the process temperature ( T p ) was measured non-invasive. All temperature sensors were calibrated at least at two temperatures (20 and 40 °C) in the used cryostats. In Figure A3, the measured temperatures (exp.) are presented as symbols for the crystal growth experiments seed125–180 1 and 2 and exemplarily for the other crystal growth experiments.
The red and blue lines are constituted based on a differential steady-state energy balance model (see Equations (A5) and (A6)) for the crystallizer according to Reference [97]. It is presumed that both agents are similar to ideal plug flow. The length is specified in the z coordinate direction. The heat-transfer coefficients from the inner process to the outer cooling medium k 12 , as well as from the cooling agent to the ambient temperature k 2 , are adjusted (via “fminsearch”) in the model. The input and output temperatures are selected as boundary conditions. As already described in Reference [97], a MATLAB®2018 internal solver (“bvp4c”) based on a finite difference method and the three-stage Lobatto Illa formula was used [97].
Figure A3. Temperature profile for four CUs in counter-current flow for the experiments seed125–180 1 and 2.
Processes 09 01537 g0a3
T p z = k 12 π d i , p m ˙ SL c p , p ( T p ( z ) T c ( z ) )
T c z = k 12 π d i , p m ˙ c c p , c ( T c ( z ) T p ( z ) ) + k 2 π d i , c m ˙ c c p , c ( T c ( z ) T )
Table A3. Crystal growth experiments’ process parameters.
Sample
(-)
m ˙ S L
(g·min−1)
m ˙ c
(g·min−1)
T T I _ 02   ±   0.2
(°C)
T T I _ 42   ±   0.2
(°C)
T   ±   0.2
(°C)
seed90–125 118.6 ± 0.419.5 ± 0.230.923.3 24.0
seed90–125 219.8 ± 0.720.2 ± 0.230.423.9 22.9
seed125–180 117.6 ± 0.620.4 ± 0.130.423.8 23.8
seed125–180 217.9 ± 0.521.5 ± 0.130.323.7 23.7
seed90–180 115.6 ± 0.519.9 ± 0.130.023.2 25.9
seed90–180 218.8 ± 0.621.3 ± 0.130.523.9 23.6
seed90–125 315.4 ± 0.316.3 ± 0.130.123.423.3
seed90–125 416.3 ± 0.417.7 ± 0.130.023.423.3
glycine90–12526.0 ± 0.920.1 ± 0.230.425.023.1
Table A4. HiText™ rinsing code for “prophylactic rinse” translated from German to English.
01 wait until !PERISTALTICPUMP.ON = 1 {pump needs to be turned on}
02 repeat
03T1 !MAGNETIC_VALVE_A=0 {rinse with solvent(water)}
04 wait 10 seconds
05  s=current_time
06 repeat
07   if (!PI_00<1250) and (!PI_00>20) and (!PERISTALTICPUMP.ON=1) then
08    !MAGNETIC_VALVE_A=1 {pump suspension}
09    wait 1 second
10    suspension=current_time - s
11    end if
12 until (suspension>00:13:00) or (!PI_00>1250) or (!PI_00<20)
13  !MAGNETIC_VALVE_A=0
14 if (!PI_00>1250) or (!PI_00<20) then
15   wait until (!PI_00<900) and (!PI_00>500)
16 else
17   continue with T1
18 end if
19 until !PERISTALTICPUMP.ON=0
20 !MAGNETIC_VALVE_A=0
Table A5. HiText™ rinsing code for “pressure loss rinse” translated from German to English.
01wait until !PERISTALTICPUMP.ON=1
02!MAGNETIC_VALVE_A=0 {rinse with solvent(water)}
03wait 30seconds
04if (!PI_00<1250) and (!PI_00>20) and (!PERISTALTICPUMP.ON=1) then
05 !MAGNETIC_VALVE_A=1 {pump suspension}
06 t_start = current_time
07wait until (!PI_00>1250) or (!PI_00<20)
08 !MAGNETIC_VALVE_A=0
09 rinse_time = current_time – t_start {time till clogging}
10wait until !PI_00<800 {stabillization of the pressure}
11else
12 rinse_time=00:13:00 {error condtion}
13end if
14repeat
15 ! MAGNETIC_VALVE_A=0 {rinse with solvent (water)}
16wait 60 seconds
17 t=current_time
18repeat
19  if (!PI_00<1250) and (!PI_00>20) and (!PERISTALTICPUMP.ON=1) then
20   ! MAGNETIC_VALVE_A=1 {pump suspension}
21   wait 1 second
22   duration=current_time-t
23   end if
24until (duration=rinse_time) or (!PI_00>1250) or (!MASSFLOWRATE.A<0) then
25  ! MAGNETIC_VALVE_A=0
26if (!MASSFLOWRATE.A>1.5) or (!MASSFLOWRATE.A<0) then
27  wait until (!PI_00<900) and (!PI_00>500)
28end if
29until (!PERISTALTICPUMP.ON=0)
30! MAGNETIC_VALVE_A=0
Table A6. HiText™ Rinsing code for “suspension detection” translated from German to English.
01wait until (!MAGNETIC_VALVE_A=1) and (!PERISTALTICPUMP.ON=1)
02repeat
03  if (!ARDUINO.RESISTOR<1567) and (!PI_00<1250) then
04   !MAGNETIC_VALVE_B=1 {product tank}
05   wait until (!ARDUINO.RESISTOR>1567) or (!PERISTALTICPUMP.ON=0) or (!PI_00>1250)
06   !MAGNETIC_VALVE_B=0 {waste tank}
07   wait until (!ARDUINO.RESISTOR<1567) or (!PERISTALTICPUMP.ON=0)
08   end if
09until !PERISTALTICPUMP.ON=0
10!MAGNETIC_VALVE_B=0
Table A7. Process parameters for combined nucleation and crystal growth experiments.
Sample m ˙ S L
(g·min−1)
m ˙ c
(g·min−1)
T i n   ±   0.1
(°C)
T U S U   ±   0.1
(°C)
T U S U , o u t   ±   0.2
(°C)
T C F I , o u t   ±   0.2
(°C)
T
(°C)
combi 117.9 ± 0.519.5 ± 0.154.318.320.018.924.2 ± 0.2
combi 217.4 ± 0.519.9 ± 0.154.618.320.120.124.3 ± 0.2
combi 316.4 ± 0.519.7 ± 0.154.619.921.219.923.8 ± 0.2
combi 417.3 ± 1.118.1 ± 0.153.912.619.921.826.1 ± 0.4
combi 517.2 ± 0.818.4 ± 0.153.612.519.723.026.3 ± 0.4
Figure A4. Temperature profile for combined nucleation and crystal growth experiments 1–3; the dashed lines only serve better visualization.
Processes 09 01537 g0a4

References

  1. Myerson, A.S. Handbook of Industrial Crystallization, 2nd ed.; Butterworth-Heinemann: Boston, MA, USA, 2002; ISBN 9780080533513. [Google Scholar]
  2. Hofmann, G. (Ed.) Kristallisation in der Industriellen Praxis; Wiley-VCH: Weinheim, Germany, 2004. [Google Scholar]
  3. Domokos, A.; Nagy, B.; Szilágyi, B.; Marosi, G.; Nagy, Z.K. Integrated Continuous Pharmaceutical Technologies—A Review. Org. Process. Res. Dev. 2021, 25, 721–739. [Google Scholar] [CrossRef]
  4. Hou, G.; Power, G.; Barrett, M.; Glennon, B.; Morris, G.; Zhao, Y. Development and Characterization of a Single Stage Mixed-Suspension, Mixed-Product-Removal Crystallization Process with a Novel Transfer Unit. Cryst. Growth Des. 2014, 14, 1782–1793. [Google Scholar] [CrossRef]
  5. Chianese, A.; Kramer, H.J.M. (Eds.) Industrial Crystallization Process Monitoring and Control; Wiley-VCH: Weinheim, Germany, 2012; ISBN 9783527331734. [Google Scholar]
  6. Fernandez Rivas, D.; Kuhn, S. Synergy of Microfluidics and Ultrasound: Process Intensification Challenges and Opportunities. Top. Curr. Chem. 2016, 374, 70. [Google Scholar] [CrossRef] [PubMed] [Green Version]
  7. Deora, N.S.; Misra, N.N.; Deswal, A.; Mishra, H.N.; Cullen, P.J.; Tiwari, B.K. Ultrasound for Improved Crystallisation in Food Processing. Food Eng. Rev. 2013, 5, 36–44. [Google Scholar] [CrossRef] [Green Version]
  8. Castillo-Peinado, L.d.l.S.; Luque de Castro, M.D. The role of ultrasound in pharmaceutical production: Sonocrystallization. J. Pharm. Pharmacol. 2016, 68, 1249–1267. [Google Scholar] [CrossRef]
  9. Kim, H.; Suslick, K. The Effects of Ultrasound on Crystals: Sonocrystallization and Sonofragmentation. Crystals 2018, 8, 280. [Google Scholar] [CrossRef] [Green Version]
  10. Jordens, J.; Canini, E.; Gielen, B.; van Gerven, T.; Braeken, L. Ultrasound Assisted Particle Size Control by Continuous Seed Generation and Batch Growth. Crystals 2017, 7, 195. [Google Scholar] [CrossRef]
  11. Narducci, O.; Jones, A.G.; Kougoulos, E. Continuous crystallization of adipic acid with ultrasound. Chem. Eng. Sci. 2011, 66, 1069–1076. [Google Scholar] [CrossRef]
  12. Nalajala, V.S.; Moholkar, V.S. Investigations in the physical mechanism of sonocrystallization. Ultrason. Sonochem. 2011, 18, 345–355. [Google Scholar] [CrossRef]
  13. Nguyen, T.; Khan, A.; Bruce, L.; Forbes, C.; O’Leary, R.; Price, C. The Effect of Ultrasound on the Crystallisation of Paracetamol in the Presence of Structurally Similar Impurities. Crystals 2017, 7, 294. [Google Scholar] [CrossRef] [Green Version]
  14. Kudo, S.; Takiyama, H. Production of Fine Organic Crystalline Particles by Using Milli Segmented Flow Crystallizer. J. Chem. Eng. Jpn. JCEJ 2012, 45, 305–309. [Google Scholar] [CrossRef]
  15. Sharma, D.; Murthy, Z.V.P.; Patel, S.R. Recovery of lactose from aqueous solution by application of ultrasound through millichannel. Int. J. Food Eng. 2021, 17, 571–581. [Google Scholar] [CrossRef]
  16. Gracin, S.; Uusi-Penttilä, M.; Rasmuson, Å.C. Influence of Ultrasound on the Nucleation of Polymorphs of p -Aminobenzoic Acid. Cryst. Growth Des. 2005, 5, 1787–1794. [Google Scholar] [CrossRef]
  17. Jordens, J.; Gielen, B.; Braeken, L.; van Gerven, T. Determination of the effect of the ultrasonic frequency on the cooling crystallization of paracetamol. Chem. Eng. Process. Process. Intensif. 2014, 84, 38–44. [Google Scholar] [CrossRef] [Green Version]
  18. Kordylla, A.; Koch, S.; Tumakaka, F.; Schembecker, G. Towards an optimized crystallization with ultrasound: Effect of solvent properties and ultrasonic process parameters. J. Cryst. Growth 2008, 310, 4177–4184. [Google Scholar] [CrossRef]
  19. Han, B.; Ezeanowi, N.C.; Koiranen, T.O.; Häkkinen, A.T.; Louhi-Kultanen, M. Insights into Design Criteria for a Continuous, Sonicated Modular Tubular Cooling Crystallizer. Cryst. Growth Des. 2018, 18, 7286–7295. [Google Scholar] [CrossRef]
  20. Ezeanowi, N.; Pajari, H.; Laitinen, A.; Koiranen, T. Monitoring the Dynamics of a Continuous Sonicated Tubular Cooling Crystallizer. Cryst. Growth Des. 2020, 20, 1458–1466. [Google Scholar] [CrossRef]
  21. Furuta, M.; Mukai, K.; Cork, D.; Mae, K. Continuous crystallization using a sonicated tubular system for controlling particle size in an API manufacturing process. Chem. Eng. Process. Process. Intensif. 2016, 102, 210–218. [Google Scholar] [CrossRef]
  22. Pohl, B. Charakterisierung der Mischung und Fällung bei Kontinuierlichen Sonochemischen Reaktoren unter Besonderer Berücksichtigung der Reaktorform. Doctoral Dissertation, Technischen Universität Bergakademie, Freiberg, Germany, 20 December 2012. [Google Scholar]
  23. Eder, R.J.P.; Schrank, S.; Besenhard, M.O.; Roblegg, E.; Gruber-Woelfler, H.; Khinast, J.G. Continuous Sonocrystallization of Acetylsalicylic Acid (ASA): Control of Crystal Size. Cryst. Growth Des. 2012, 12, 4733–4738. [Google Scholar] [CrossRef]
  24. Besenhard, M.O.; Neugebauer, P.; Ho, C.-D.; Khinast, J.G. Crystal Size Control in a Continuous Tubular Crystallizer. Cryst. Growth Des. 2015, 15, 1683–1691. [Google Scholar] [CrossRef]
  25. Schmalenberg, M.; Weick, L.K.; Kockmann, N. Nucleation in continuous flow cooling sonocrystallization for coiled capillary crystallizers. J. Flow Chem. 2021. [Google Scholar] [CrossRef]
  26. Ruecroft, G.; Hipkiss, D.; Ly, T.; Maxted, N.; Cains, P.W. Sonocrystallization: The Use of Ultrasound for Improved Industrial Crystallization. Org. Process. Res. Dev. 2005, 9, 923–932. [Google Scholar] [CrossRef]
  27. Sander, J.R.G.; Zeiger, B.W.; Suslick, K.S. Sonocrystallization and sonofragmentation. Ultrason. Sonochem. 2014, 21, 1908–1915. [Google Scholar] [CrossRef]
  28. Lührmann, M.-C.; Timmermann, J.; Schembecker, G.; Wohlgemuth, K. Enhanced Product Quality Control through Separation of Crystallization Phenomena in a Four-Stage MSMPR Cascade. Cryst. Growth Des. 2018, 18, 7323–7334. [Google Scholar] [CrossRef]
  29. Capellades, G.; Joshi, P.U.; Dam-Johansen, K.; Mealy, M.J.; Christensen, T.V.; Kiil, S. Characterization of a Multistage Continuous MSMPR Crystallization Process Assisted by Image Analysis of Elongated Crystals. Cryst. Growth Des. 2018, 18, 6455–6469. [Google Scholar] [CrossRef]
  30. Takiyama, H.; Matsuoka, M. Design of seed crystal specifications for start-up operation of a continuous MSMPR crystallizer. Powder Technol. 2001, 121, 99–105. [Google Scholar] [CrossRef]
  31. Zhang, D.; Xu, S.; Du, S.; Wang, J.; Gong, J. Progress of Pharmaceutical Continuous Crystallization. Engineering 2017, 3, 354–364. [Google Scholar] [CrossRef]
  32. Wang, T.; Lu, H.; Wang, J.; Xiao, Y.; Zhou, Y.; Bao, Y.; Hao, H. Recent progress of continuous crystallization. J. Ind. Eng. Chem. 2017, 54, 14–29. [Google Scholar] [CrossRef]
  33. Onyemelukwe, I.I.; Parsons, A.R.; Wheatcroft, H.P.; Robertson, A.; Nagy, Z.K.; Rielly, C.D. The Role of Residence Time Distribution in the Continuous Steady-State Mixed Suspension Mixed Product Removal Crystallization of Glycine. Cryst. Growth Des. 2019, 19, 66–80. [Google Scholar] [CrossRef]
  34. Nguyen, A.-T.; Kim, J.-M.; Chang, S.-M.; Kim, W.-S. Taylor Vortex Effect on Phase Transformation of Guanosine 5-Monophosphate in Drowning-Out Crystallization. Ind. Eng. Chem. Res. 2010, 49, 4865–4872. [Google Scholar] [CrossRef]
  35. Kim, J.-E.; Kim, W.-S. Synthesis of Core–Shell Particles of Nickel–Manganese–Cobalt Hydroxides in a Continuous Couette-Taylor Crystallizer. Cryst. Growth Des. 2017, 17, 3677–3686. [Google Scholar] [CrossRef]
  36. Xu, K.; Wang, C.; Wang, X.; Qian, Y. Laboratory experiments on simultaneous removal of K and P from synthetic and real urine for nutrient recycle by crystallization of magnesium-potassium-phosphate-hexahydrate in a draft tube and baffle reactor. Chemosphere 2012, 88, 219–223. [Google Scholar] [CrossRef] [PubMed]
  37. Schmalenberg, M.; Mensing, L.; Lindemann, S.; Krell, T.; Kockmann, N. Miniaturized Draft Tube Baffle Crystallizer for Continuous Cooling Crystallization. Chem. Eng. Res. Des. under review.
  38. Briggs, N.E.B.; Schacht, U.; Raval, V.; McGlone, T.; Sefcik, J.; Florence, A.J. Seeded Crystallization of β- l -Glutamic Acid in a Continuous Oscillatory Baffled Crystallizer. Org. Process. Res. Dev. 2015, 19, 1903–1911. [Google Scholar] [CrossRef] [Green Version]
  39. Jiang, M.; Ni, X.-W. Reactive Crystallization of Paracetamol in a Continuous Oscillatory Baffled Reactor. Org. Process. Res. Dev. 2019, 23, 882–890. [Google Scholar] [CrossRef]
  40. Orehek, J.; Teslić, D.; Likozar, B. Continuous Crystallization Processes in Pharmaceutical Manufacturing: A Review. Org. Process. Res. Dev. 2021, 25, 16–42. [Google Scholar] [CrossRef]
  41. Eder, R.J.P.; Radl, S.; Schmitt, E.; Innerhofer, S.; Maier, M.; Gruber-Woelfler, H.; Khinast, J.G. Continuously Seeded, Continuously Operated Tubular Crystallizer for the Production of Active Pharmaceutical Ingredients. Cryst. Growth Des. 2010, 10, 2247–2257. [Google Scholar] [CrossRef]
  42. Hohmann, L.; Greinert, T.; Mierka, O.; Turek, S.; Schembecker, G.; Bayraktar, E.; Wohlgemuth, K.; Kockmann, N. Analysis of Crystal Size Dispersion Effects in a Continuous Coiled Tubular Crystallizer: Experiments and Modeling. Cryst. Growth Des. 2018, 18, 1459–1473. [Google Scholar] [CrossRef]
  43. Wiedmeyer, V.; Anker, F.; Bartsch, C.; Voigt, A.; John, V.; Sundmacher, K. Continuous Crystallization in a Helically Coiled Flow Tube: Analysis of Flow Field, Residence Time Behavior, and Crystal Growth. Ind. Eng. Chem. Res. 2017, 56, 3699–3712. [Google Scholar] [CrossRef] [Green Version]
  44. Termühlen, M.; Etmanski, M.M.; Kryschewski, I.; Kufner, A.C.; Schembecker, G.; Wohlgemuth, K. Continuous slug flow crystallization: Impact of design and operating parameters on product quality. Chem. Eng. Res. Des. 2021, 170, 290–303. [Google Scholar] [CrossRef]
  45. Besenhard, M.O.; Neugebauer, P.; Scheibelhofer, O.; Khinast, J.G. Crystal Engineering in Continuous Plug-Flow Crystallizers. Cryst. Growth Des. 2017, 17, 6432–6444. [Google Scholar] [CrossRef] [PubMed]
  46. Kurt, S.K.; Akhtar, M.; Nigam, K.D.P.; Kockmann, N. Continuous Reactive Precipitation in a Coiled Flow Inverter: Inert Particle Tracking, Modular Design, and Production of Uniform CaCO 3 Particles. Ind. Eng. Chem. Res. 2017, 56, 11320–11335. [Google Scholar] [CrossRef]
  47. Hussain, M.N.; Jordens, J.; John, J.J.; Braeken, L.; van Gerven, T. Enhancing pharmaceutical crystallization in a flow crystallizer with ultrasound: Anti-solvent crystallization. Ultrason. Sonochem. 2019, 59, 104743. [Google Scholar] [CrossRef]
  48. Degli Esposti, L.; Dotti, A.; Adamiano, A.; Fabbi, C.; Quarta, E.; Colombo, P.; Catalucci, D.; Luca, C.D.; Iafisco, M. Calcium Phosphate Nanoparticle Precipitation by a Continuous Flow Process: A Design of Experiment Approach. Crystals 2020, 10, 953. [Google Scholar] [CrossRef]
  49. Benitez-Chapa, A.G.; Nigam, K.D.P.; Alvarez, A.J. Process Intensification of Continuous Antisolvent Crystallization Using a Coiled Flow Inverter. Ind. Eng. Chem. Res. 2020, 59, 3934–3942. [Google Scholar] [CrossRef]
  50. Del Méndez Río, J.R.; Rousseau, R.W. Batch and Tubular-Batch Crystallization of Paracetamol: Crystal Size Distribution and Polymorph Formation. Cryst. Growth Des. 2006, 6, 1407–1414. [Google Scholar] [CrossRef]
  51. Eder, R.J.P.; Schmitt, E.K.; Grill, J.; Radl, S.; Gruber-Woelfler, H.; Khinast, J.G. Seed loading effects on the mean crystal size of acetylsalicylic acid in a continuous-flow crystallization device. Cryst. Res. Technol. 2011, 46, 227–237. [Google Scholar] [CrossRef]
  52. Hohmann, L.; Gorny, R.; Klaas, O.; Ahlert, J.; Wohlgemuth, K.; Kockmann, N. Design of a Continuous Tubular Cooling Crystallizer for Process Development on Lab-Scale. Chem. Eng. Technol. 2016, 39, 1268–1280. [Google Scholar] [CrossRef]
  53. Kurt, S.K.; Warnebold, F.; Nigam, K.D.; Kockmann, N. Gas-liquid reaction and mass transfer in microstructured coiled flow inverter. Chem. Eng. Sci. 2017, 169, 164–178. [Google Scholar] [CrossRef]
  54. Hohmann, L.; Schmalenberg, M.; Prasanna, M.; Matuschek, M.; Kockmann, N. Suspension flow behavior and particle residence time distribution in helical tube devices. Chem. Eng. J. 2019, 360, 1371–1389. [Google Scholar] [CrossRef]
  55. Hohmann, L.; Löbnitz, L.; Menke, C.; Santhirakumaran, B.; Stier, P.; Stenger, F.; Dufour, F.; Wiese, G.; zur Horst-Meyer, S.; Kusserow, B.; et al. Continuous Downstream Processing of Amino Acids in a Modular Miniplant. Chem. Eng. Technol. 2018, 41, 1152–1164. [Google Scholar] [CrossRef]
  56. Schmalenberg, M.; Hohmann, L.; Kockmann, N. Miniaturized Tubular Cooling Crystallizer with Solid-Liquid Flow for Process Development. Proc. ASME ICNMM 2018, 51197, V001T02A006. [Google Scholar] [CrossRef]
  57. Wiedmeyer, V.; Voigt, A.; Sundmacher, K. Crystal Population Growth in a Continuous Helically Coiled Flow Tube Crystallizer. Chem. Eng. Technol. 2017, 40, 1584–1590. [Google Scholar] [CrossRef] [Green Version]
  58. Wiedmeyer, V. Continuous Crystallization in a Helically Coiled Flow Tube Crystallizer. Doctoral Dissertation, Otto-von-Guericke-Universität Magdeburg, Magdeburg, Germany, 30 June 2020. [Google Scholar]
  59. Neugebauer, P.; Khinast, J.G. Continuous Crystallization of Proteins in a Tubular Plug-Flow Crystallizer. Cryst. Growth Des. 2015, 15, 1089–1095. [Google Scholar] [CrossRef]
  60. Ferreira, J.; Castro, F.; Rocha, F.; Kuhn, S. Protein crystallization in a droplet-based microfluidic device: Hydrodynamic analysis and study of the phase behaviour. Chem. Eng. Sci. 2018, 191, 232–244. [Google Scholar] [CrossRef]
  61. Neugebauer, P.; Cardona, J.; Besenhard, M.O.; Peter, A.; Gruber-Woelfler, H.; Tachtatzis, C.; Cleary, A.; Andonovic, I.; Sefcik, J.; Khinast, J.G. Crystal Shape Modification via Cycles of Growth and Dissolution in a Tubular Crystallizer. Cryst. Growth Des. 2018, 18, 4403–4415. [Google Scholar] [CrossRef]
  62. Su, M.; Gao, Y. Air–Liquid Segmented Continuous Crystallization Process Optimization of the Flow Field, Growth Rate, and Size Distribution of Crystals. Ind. Eng. Chem. Res. 2018, 57, 3781–3791. [Google Scholar] [CrossRef]
  63. Mou, M.; Jiang, M. Fast Continuous Non-Seeded Cooling Crystallization of Glycine in Slug Flow: Pure α-Form Crystals with Narrow Size Distribution. J. Pharm. Innov. 2020, 15, 281–294. [Google Scholar] [CrossRef]
  64. Mozdzierz, N.J.; Lee, Y.; Hong, M.S.; Benisch, M.H.; Rasche, M.L.; Tropp, U.E.; Jiang, M.; Myerson, A.S.; Braatz, R.D. Mathematical modeling and experimental validation of continuous slug-flow tubular crystallization with ultrasonication-induced nucleation and spatially varying temperature. Chem. Eng. Res. Des. 2021, 169, 275–287. [Google Scholar] [CrossRef]
  65. Nalesso, S.; Bussemaker, M.J.; Sear, R.P.; Hodnett, M.; Lee, J. A review on possible mechanisms of sonocrystallisation in solution. Ultrason. Sonochem. 2019, 57, 125–138. [Google Scholar] [CrossRef] [PubMed]
  66. Miyasaka, E.; Ebihara, S.; Hirasawa, I. Investigation of primary nucleation phenomena of acetylsalicylic acid crystals induced by ultrasonic irradiation—Ultrasonic energy needed to activate primary nucleation. J. Cryst. Growth 2006, 295, 97–101. [Google Scholar] [CrossRef]
  67. Louhi-Kultanen, M.; Karjalainen, M.; Rantanen, J.; Huhtanen, M.; Kallas, J. Crystallization of glycine with ultrasound. Int. J. Pharm. 2006, 320, 23–29. [Google Scholar] [CrossRef]
  68. Kurotani, M.; Hirasawa, I. Polymorph control of sulfamerazine by ultrasonic irradiation. J. Cryst. Growth 2008, 310, 4576–4580. [Google Scholar] [CrossRef]
  69. Hatakka, H.; Alatalo, H.; Louhi-Kultanen, M.; Lassila, I.; Haeggström, E. Closed-Loop Control of Reactive Crystallization PART II: Polymorphism Control of L-Glutamic Acid by Sonocrystallization and Seeding. Chem. Eng. Technol. 2010, 33, 751–756. [Google Scholar] [CrossRef]
  70. Schmalenberg, M.; Sallamon, F.; Haas, C.; Kockmann, N. Temperature-Controlled Minichannel Flow-Cell for Non-Invasive Particle Measurements in Solid-Liquid Flow. Proc. ASME ICNMM 2020, 83693, V001T16A005. [Google Scholar] [CrossRef]
  71. Schindel, A.-L.; Schmalenberg, M.; Polyakova, M.; Grünewald, M.; Kockmann, N. Matching Matrix for the Selection of Continuous Crystallization Technologies Exemplified by the CFI-Crystallizer. Available online: https://fluidvt.ruhr-uni-bochum.de/mitarbeiter/frau-anna-lena-schindel-m-sc/ (accessed on 9 November 2020).
  72. Verein Deutscher Ingenieure; VDI-Gesellschaft Verfahrenstechnik und Chemieingenieurwesen. VDI-Wärmeatlas: Mit 320 Tabellen, 11., Bearb. und erw. Aufl.; Springer: Berlin/Heidelberg, Germany, 2013; ISBN 9783642199813. [Google Scholar]
  73. Ogawa, T.; Mizutani, K.; Yasuda, M. The Volume, Adiabatic Compressibility, and Viscosity of Amino Acids in Aqueous Alkali-chloride Solutions. BCSJ 1984, 57, 2064–2068. [Google Scholar] [CrossRef]
  74. Ogawa, T.; Yasuda, M.; Mizutani, K. Volume and Adiabatic Compressibility of Amino Acids in Urea–Water Mixtures. BCSJ 1984, 57, 662–666. [Google Scholar] [CrossRef] [Green Version]
  75. Yan, Z.; Wang, J.; Liu, W.; Lu, J. Apparent molar volumes and viscosity B-coefficients of some α-amino acids in aqueous solutions from 278.15 to 308.15 K. Thermochim. Acta 1999, 334, 17–27. [Google Scholar] [CrossRef]
  76. Wohlgemuth, K.; Schembecker, G. Modeling induced nucleation processes during batch cooling crystallization: A sequential parameter determination procedure. Comput. Chem. Eng. 2013, 52, 216–229. [Google Scholar] [CrossRef]
  77. Sullivan, R.; Pyda, M.; Pak, J.; Wunderlich, B.; Thompson, J.R.; Pagni, R.; Pan, H.; Barnes, C.; Schwerdtfeger, P.; Compton, R. Search for Electroweak Interactions in Amino Acid Crystals. II. The Salam Hypothesis. J. Phys. Chem. A 2003, 107, 6674–6680. [Google Scholar] [CrossRef]
  78. VWR. Glycin (H-Gly-OH) ≥98%, GPR RECTAPUR®|VWR. Available online: https://de.vwr.com/store/product/2355458/glycin-h-gly-oh-98-gpr-rectapur (accessed on 26 May 2021).
  79. Saxena, A.K.; Nigam, K.D.P. Coiled configuration for flow inversion and its effect on residence time distribution. AIChE J. 1984, 30, 363–368. [Google Scholar] [CrossRef]
  80. Gelhausen, M.G.; Kurt, S.K.; Kockmann, N. Mixing and Heat Transfer in Helical Capillary Flow Reactors with Alternating Bends. Proc. ASME ICNMM 2014, 46278, V001T13A001. [Google Scholar] [CrossRef]
  81. Klutz, S.; Kurt, S.K.; Lobedann, M.; Kockmann, N. Narrow residence time distribution in tubular reactor concept for Reynolds number range of 10–100. Chem. Eng. Res. Des. 2015, 95, 22–33. [Google Scholar] [CrossRef]
  82. Schmalenberg, M.; Krieger, W.; Kockmann, N. Modular Coiled Flow Inverter with Narrow Residence Time Distribution for Process Development and Production. Chem. Ing. Tech. 2019, 91, 567–575. [Google Scholar] [CrossRef]
  83. Bode, K.; Hooper, R.J.; Paterson, W.R.; Wilson, D.I.; Augustin, W.; Scholl, S. Reinigung von Molkeproteinablagerungen mit pulsierender Strömung. Chem. Ing. Tech. 2006, 78, 613–620. [Google Scholar] [CrossRef]
  84. Wang, Y.; Su, M.; Bai, Y. Mechanism of Glycine Crystal Adhesion and Clogging in a Continuous Tubular Crystallizer. Ind. Eng. Chem. Res. 2020, 59, 25–33. [Google Scholar] [CrossRef]
  85. Klose, A.; Merkelbach, S.; Menschner, A.; Hensel, S.; Heinze, S.; Bittorf, L.; Kockmann, N.; Schäfer, C.; Szmais, S.; Eckert, M.; et al. Orchestration Requirements for Modular Process Plants in Chemical and Pharmaceutical Industries. Chem. Eng. Technol. 2019, 42, 2282–2291. [Google Scholar] [CrossRef] [Green Version]
  86. Höving, S.; Bobers, J.; Kockmann, N. Low-cost multi-purpose sensor for measurements in continuous two-phase capillary flow. To be submitted.
  87. Borchert, C.; Sundmacher, K. Crystal Aggregation in a Flow Tube: Image-Based Observation. Chem. Eng. Technol. 2011, 34, 545–556. [Google Scholar] [CrossRef]
  88. Huo, Y.; Liu, T.; Liu, H.; Ma, C.Y.; Wang, X.Z. In-situ crystal morphology identification using imaging analysis with application to the L-glutamic acid crystallization. Chem. Eng. Sci. 2016, 148, 126–139. [Google Scholar] [CrossRef]
  89. Emig, G.; Klemm, E. Chemische Reaktionstechnik; Springer: Berlin/Heidelberg, Germany, 2017. [Google Scholar]
  90. Kurt, S.K.; Gelhausen, M.G.; Kockmann, N. Axial Dispersion and Heat Transfer in a Milli/Microstructured Coiled Flow Inverter for Narrow Residence Time Distribution at Laminar Flow. Chem. Eng. Technol. 2015, 38, 1122–1130. [Google Scholar] [CrossRef]
  91. Steenweg, C.; Seifert, A.I.; Schembecker, G.; Wohlgemuth, K. Characterization of a Modular Continuous Vacuum Screw Filter for Small-Scale Solid–Liquid Separation of Suspensions. Org. Process. Res. Dev. 2021, 25, 926–940. [Google Scholar] [CrossRef]
  92. Hohmann, L. Equipment and Process Design for Small-Scale Continuous Crystallization. Doctoral Dissertation, TU Dortmund University, Dortmund, Germany, 9 April 2019. [Google Scholar]
  93. Palazoglu, T.; Sandeep, K.P. Effect of tube curvature ratio on the residence time distribution of multiple particles in helical tubes. LWT Food Sci. Technol. 2004, 37, 387–393. [Google Scholar] [CrossRef]
  94. Fu, T.; Ma, Y.; Funfschilling, D.; Zhu, C.; Li, H.Z. Squeezing-to-dripping transition for bubble formation in a microfluidic T-junction. Chem. Eng. Sci. 2010, 65, 3739–3748. [Google Scholar] [CrossRef]
  95. Termühlen, M.; Strakeljahn, B.; Schembecker, G.; Wohlgemuth, K. Characterization of slug formation towards the performance of air-liquid segmented flow. Chem. Eng. Sci. 2019, 207, 1288–1298. [Google Scholar] [CrossRef]
  96. Termühlen, M.; Strakeljahn, B.; Schembecker, G.; Wohlgemuth, K. Quantification and evaluation of operating parameters’ effect on suspension behavior for slug flow crystallization. Chem. Eng. Sci. 2021, 243, 116771. [Google Scholar] [CrossRef]
  97. Hohmann, L.; Kurt, S.K.; Pouya Far, N.; Vieth, D.; Kockmann, N. Micro-/Milli-Fluidic Heat-Exchanger Characterization by Non-Invasive Temperature Sensors. Proc. ASME ICNMM 2016, 50343, V001T12A002. [Google Scholar] [CrossRef]
  98. Yang, X.; Wang, X.; Ching, C.B. Solubility of Form α and Form γ of Glycine in Aqueous Solutions. J. Chem. Eng. Data 2008, 53, 1133–1137. [Google Scholar] [CrossRef]
Figure 1. Left, separate CU without insulation; upper right, CU connection with temperature sensors; and bottom right, FEP-in-silicone tube construction.
Processes 09 01537 g001
Figure 2. Flowchart of the crystallization process setup.
Processes 09 01537 g002
Figure 3. Exploded view of particle sensor: 1 = LED, 2 = 3D-printed housing, 3 = FEP tube, and 4 = photoresistor.
Processes 09 01537 g003
Figure 4. Residence time distribution for four CUs of the CFIC for different phases (single experiments).
Processes 09 01537 g004
Figure 5. Crystal size distribution (via sedimentation method) shown as boxplots for crystal growth experiments with different seed crystal sizes and amounts; whiskers show minimum and maximum measured crystal.
Processes 09 01537 g005
Figure 6. Microscopic pictures in the non-invasive measurement flow-cell for crystal growth experiments. Exception: seed90–125 4, here the seed crystals photo is taken in a Petri dish.
Processes 09 01537 g006
Figure 7. Crystal size distribution (sedimentation method) with logarithmic normal size distribution (LND) for seed and product crystals for crystal growth experiments with glycine/water.
Processes 09 01537 g007
Figure 8. Pressure loss and magnetic valve position for “prophylactic rinse” (for experiment seed90–125 2).
Processes 09 01537 g008
Figure 9. Pressure loss and magnetic valve position for “pressure loss rinsing” (for experiment seed90–180 2).
Processes 09 01537 g009
Figure 10. Pressure loss and magnetic valve position for “pressure loss rinsing” (for experiment seed90–180 2): green background = right magnetic valve position, and red shaded background = magnetic valve got the wrong position.
Processes 09 01537 g010
Figure 11. Combined nucleation and crystal growth experiments: left, crystal size distribution (via image analysis) shown as boxplots; right, microscopic pictures in the non-invasive measurement flow-cell.
Processes 09 01537 g011
Table 1. Overview of experiments.
Sample NameInvestigationSeed/Tracer Particles
Sieve Size (µm)Solid Weight Fraction
(Set Point) (w.%)
RTDS,90–125 RTD90–1251
RTDS,125–180RTD125–1801
RTDS,90–180RTD90–1801
RTDLRTD-0
seed90–125 1CG90–1251
seed90–125 2CG90–1251
seed125–180 1CG125–1801
seed125–180 2CG125–1801
seed90–180 1CG90–1801
seed90–180 2CG90–1801
seed90–125 3CG90–1250.1
seed90–125 4CG90–1250.1
glycine90–125CG90–1251
combi 1nucleation + CG-0
combi 2nucleation + CG-0
combi 3nucleation + CG-0
combi 4nucleation + CG-0
combi 5nucleation + CG-0
Table 2. Averaged (over 3 experiments) residence time and characteristic process parameters.
Sample Name m ˙
(g∙min−1)
t ¯
(s)
τ
(s)
θ ¯
(-)
B o
(-)
RTDS, 90–12516.2 ± 0.3256 ± 1266 ± 50.960308 ± 73
RTDS, 125–18016.5 ± 0.1248 ± 2260 ± 20.951286 ± 20
RTDS, 90–18017.3 ± 0.5240 ± 1249 ± 60.962353 ± 65
RTDL16.6 ± 0.5227 ± 8226 ± 71.006383 ± 5
Table 3. Crystal growth results in 4 CUs.
Sample w ¯ a l a , S , s e e d ( g ala , S · g susp 1 ) Δ w ¯ a l a , S   ( g ala , S · g susp 1 ) Y ¯ r e l   ( % ) Δ x 50 , 3   ( μ m ) G ¯
(μm∙s−1)
τ S L   ( min ) t e x p ( min ) Clogging
seed90125 10.008020.0087266 ± 331.50.1483.55115no
seed90125 2 *0.006280.0086860 ± 829.40.1473.3466no
seed125180 10.009840.0072565 ± 436.40.1613.7657 + 20yes
seed125180 20.007590.0057055 ± 937.80.1703.6910 + 37yes
seed90180 10.008280.0065951 ± 6-6-0.0244.2423yes
seed90180 2 **0.011580.0039458 ± 1118.50.0883.5235 + 8 + 6 + 16 yes
seed90125 30.001440.0012718 ± 566.00.2564.2939yes
seed90125 40.001120.000427 ± 271.50.2944.0545yes
glycine90125 **0.006150.0145771 ± 439.90.2482.6932yes
* With prophylactic rinse; ** with pressure loss rinse.
Table 4. Combined nucleation and crystal growth: supersaturation, time until visible crystals appear, and time until clogging.
Samplel-Alanine
Batch Number
S G , U S U   ( - ) t c r y s t   ( min ) t c l o g   ( min )
119411807071.3713.618
219411807071.3563.412
319411807071.3143.520
419412003151.3523.49
519412003151.3283.37
Table 5. Comparison between three coiled crystallizers for crystal growth experiments; all used l-alanine/water as substance system, 1 w.% seed ratio, and FEP as tube material.
CriterionCFIC
(This Work and Reference [56])
CFI
Hohmann et al. [42]
SFC
Termühlen et al. [44]
Inner Diameter (mm)1.643.18
Tube Length (m)7.8 ∙ number.CU6.547, 13.25 and 26.5
Flow Rate ≈16 g min−130, 40 g min−120, 40 mL min−1
Residence Time (min)≈1 ∙ number.CU2.75, 2.1510.5, 5.25
Cooling Strategytube-in-tube
counter-current
(with water)
housed tube
counter-current
(with gas)
tube-in-tube
co-current
(water as active insulation)
Crystal Growth Rate
(µm s−1)
0.088–0.170
(seed90–180 1 excluded)
0.055 to 0.0790.127 to 0.411
Operation Time2.6τ to 30τ
10–115 min
≥3τ3.8τ to 7.6τ
40 min
Tendency to Cloggingrelatively highstableseems stable
Other Factors
  • space saving structure
  • better mixing than helix [53]
  • homogenous suspension flow
  • not too big crystals transportable
  • additional equipment due to the second phase
  • wall film
  • stable slugs necessary
  • sufficient seed mass to suppress secondary nucleation
Table 6. Comparison between continuous nucleation and crystal growth experiments for different coiled tubes.
CriterionUSU+CFIC
(This Work)
Eder et al., 2012 [23]Besenhard et al., 2015 [24]Han et al., 2018 [19]
Ultrasonicated Conditions Only
Substance
System
l-alanine in wateracetylsalicylic acid in ethanolphthalic acid in water
Inner Diameter (mm)1.624
Tube Length (m)6 + 15.63 + 271512/18
Tube MaterialFEPpolysiloxanestainless steel
Flow Rate ≈16 g min−115 mL min−122 (feed) + 4–11 (seed) mL min−150–150 mL min−1
Residence Time (s)≈45 + 120≈215, 265≈10060–271
Cooling Strategycooled USU and tube-in-tube
counter-current in the CFIC
(with water)
step-wise (7 levels)
(with cryostats)
step-wise (6 levels)
(with cryostats)
step-wise (2 levels)
(with cryostats)
Operation Mode
  • separated sonicated nucleation (CFI) and crystal growth units (CFI)
  • separated sonicated nucleation (coiled side stream tube) and crystal growth units (coiled tube)
  • slug flow
  • fines dissolution (optional)
  • separated sonicated nucleation (in a vessel) and crystal growth units
  • prophylactic rinsing
  • seed crystals (0.3%)
  • continuously applied ultrasound
Ultrasound
Device
ultrasonic bath, 37 kHz,ultrasonic bath, 35 kHzultrasonic baths, 35 kHz
Operation Time 7–20 min≈25 min5 ∙ (10 min + 2.5 min rinsing) = 60 min three to four residence times
Location of
Crystal Samples
non-invasive inlinecrystallizers outlet
(filtrated, washed, dried)
online in an external chamberafter filtering and drying
Particle Size (µm)69–21550–190 90–130 seed ≈ 11
product ≈ 10–400
Tendency to Cloggingrelatively high and
variable
n/ano clogging occurredoperation time for three or four residence times was defined as feasible
Publisher’s Note: MDPI stays neutral with regard to jurisdictional claims in published maps and institutional affiliations.

