1. Introduction
For the purpose of environmental protection and energy saving, a broad consensus has been reached in industry to find new renewable energy alternatives to replace traditional fossil energy [
1]. Among many new energy sources, hydrogen energy is considered to be the most promising clean energy source in the 21st century. Since the 1970s, many countries and regions in the world have conducted research about hydrogen energy. The application of a proton exchange membrane fuel cell (PEMFC) provides a feasible solution to how to utilize hydrogen energy in actual production and life. PEMFC uses hydrogen as anode fuel to generate electricity by a chemical reaction with oxygen from the cathode. It has the advantages of a low operating temperature, less pollution, low noise and high energy conversion efficiency [
2]. As an important component of PEMFC, the bipolar plate is not only the electrical junction between adjacent cells, but also the structural support for the stack. The design of the flow field on it also directly affects the distribution and transmission of reactant gases and the discharge of products [
3,
4,
5]. At present, the research of the bipolar plate can be divided into two aspects: material optimization and structure optimization. Considering such factors as cost and time consumption, the optimization of the flow field structure is more popular.
In addition to the improvement of traditional structures such as the straight flow field [
6,
7] and the serpentine flow field [
8,
9], there have been many bionic flow field structures inspired by natural or biological factors in recent years. Chen pointed out that some structures in nature are the result of a spontaneous optimization that evolved after the long-term survival of the fittest. This kind of structure must have its advantages in mass transfer and heat transfer, and the flow field based on this heuristic design has a better fluid distribution, mass transfer and heat transfer performance than the traditional structures [
10].
The research for the bionic flow field mainly focuses on the design of the overall structure or the improvement of geometric parameters. Most of the literature chooses the vein distribution of leaves as the reference object in the design of the overall structure. Tuber proposed a multi-channel fractal structure based on a fractal algorithm for the first time in 2004 and tested its performance [
11]. Inspired by Tuber, Su put forward symmetrical and asymmetric interdigital flow fields based on tree fractals. These two kinds of flow fields had shown good effects in reducing irreversible loss in the fuel cell and improving the distribution uniformity of reactant gas in the catalyst layer [
12]. Li designed a tree-shaped fractal flow field structure according to Murray’s law and its extension formula. The subsequent simulation and comparative results showed that the maximum output power density of the new structure was 23.9% higher than that of the straight flow field [
13]. Kloess took a different approach. He designed a mammalian-lung-type flow field. After a numerical simulation, it was confirmed that this kind of flow field structure was equipped with the advantage of realizing a more uniform gas distribution [
14]. In terms of the optimization of geometric parameters, Qiao proposed that the width of the flow channel, the angle between the main channel and the tributaries and other geometric parameters would have an important effect on the performance of PEMFC using the bionic leaf-vein flow field [
15]. Lorenzini-Gutierrez and others compared the flow channels with different gradation numbers and proposed that increasing the gradation number of the flow channels was beneficial to improve the uniformity of fluid distribution and reduce the pressure drop in the flow field [
16]. Badduri and others examined the effect of the bionic leaf-vein flow field on the PEMFC performance experimentally under various operating conditions. It was found that at the operating temperature of 75 degrees, a back pressure of 3 bar and 100% relative humidity, the PEMFC performance was the best [
17].
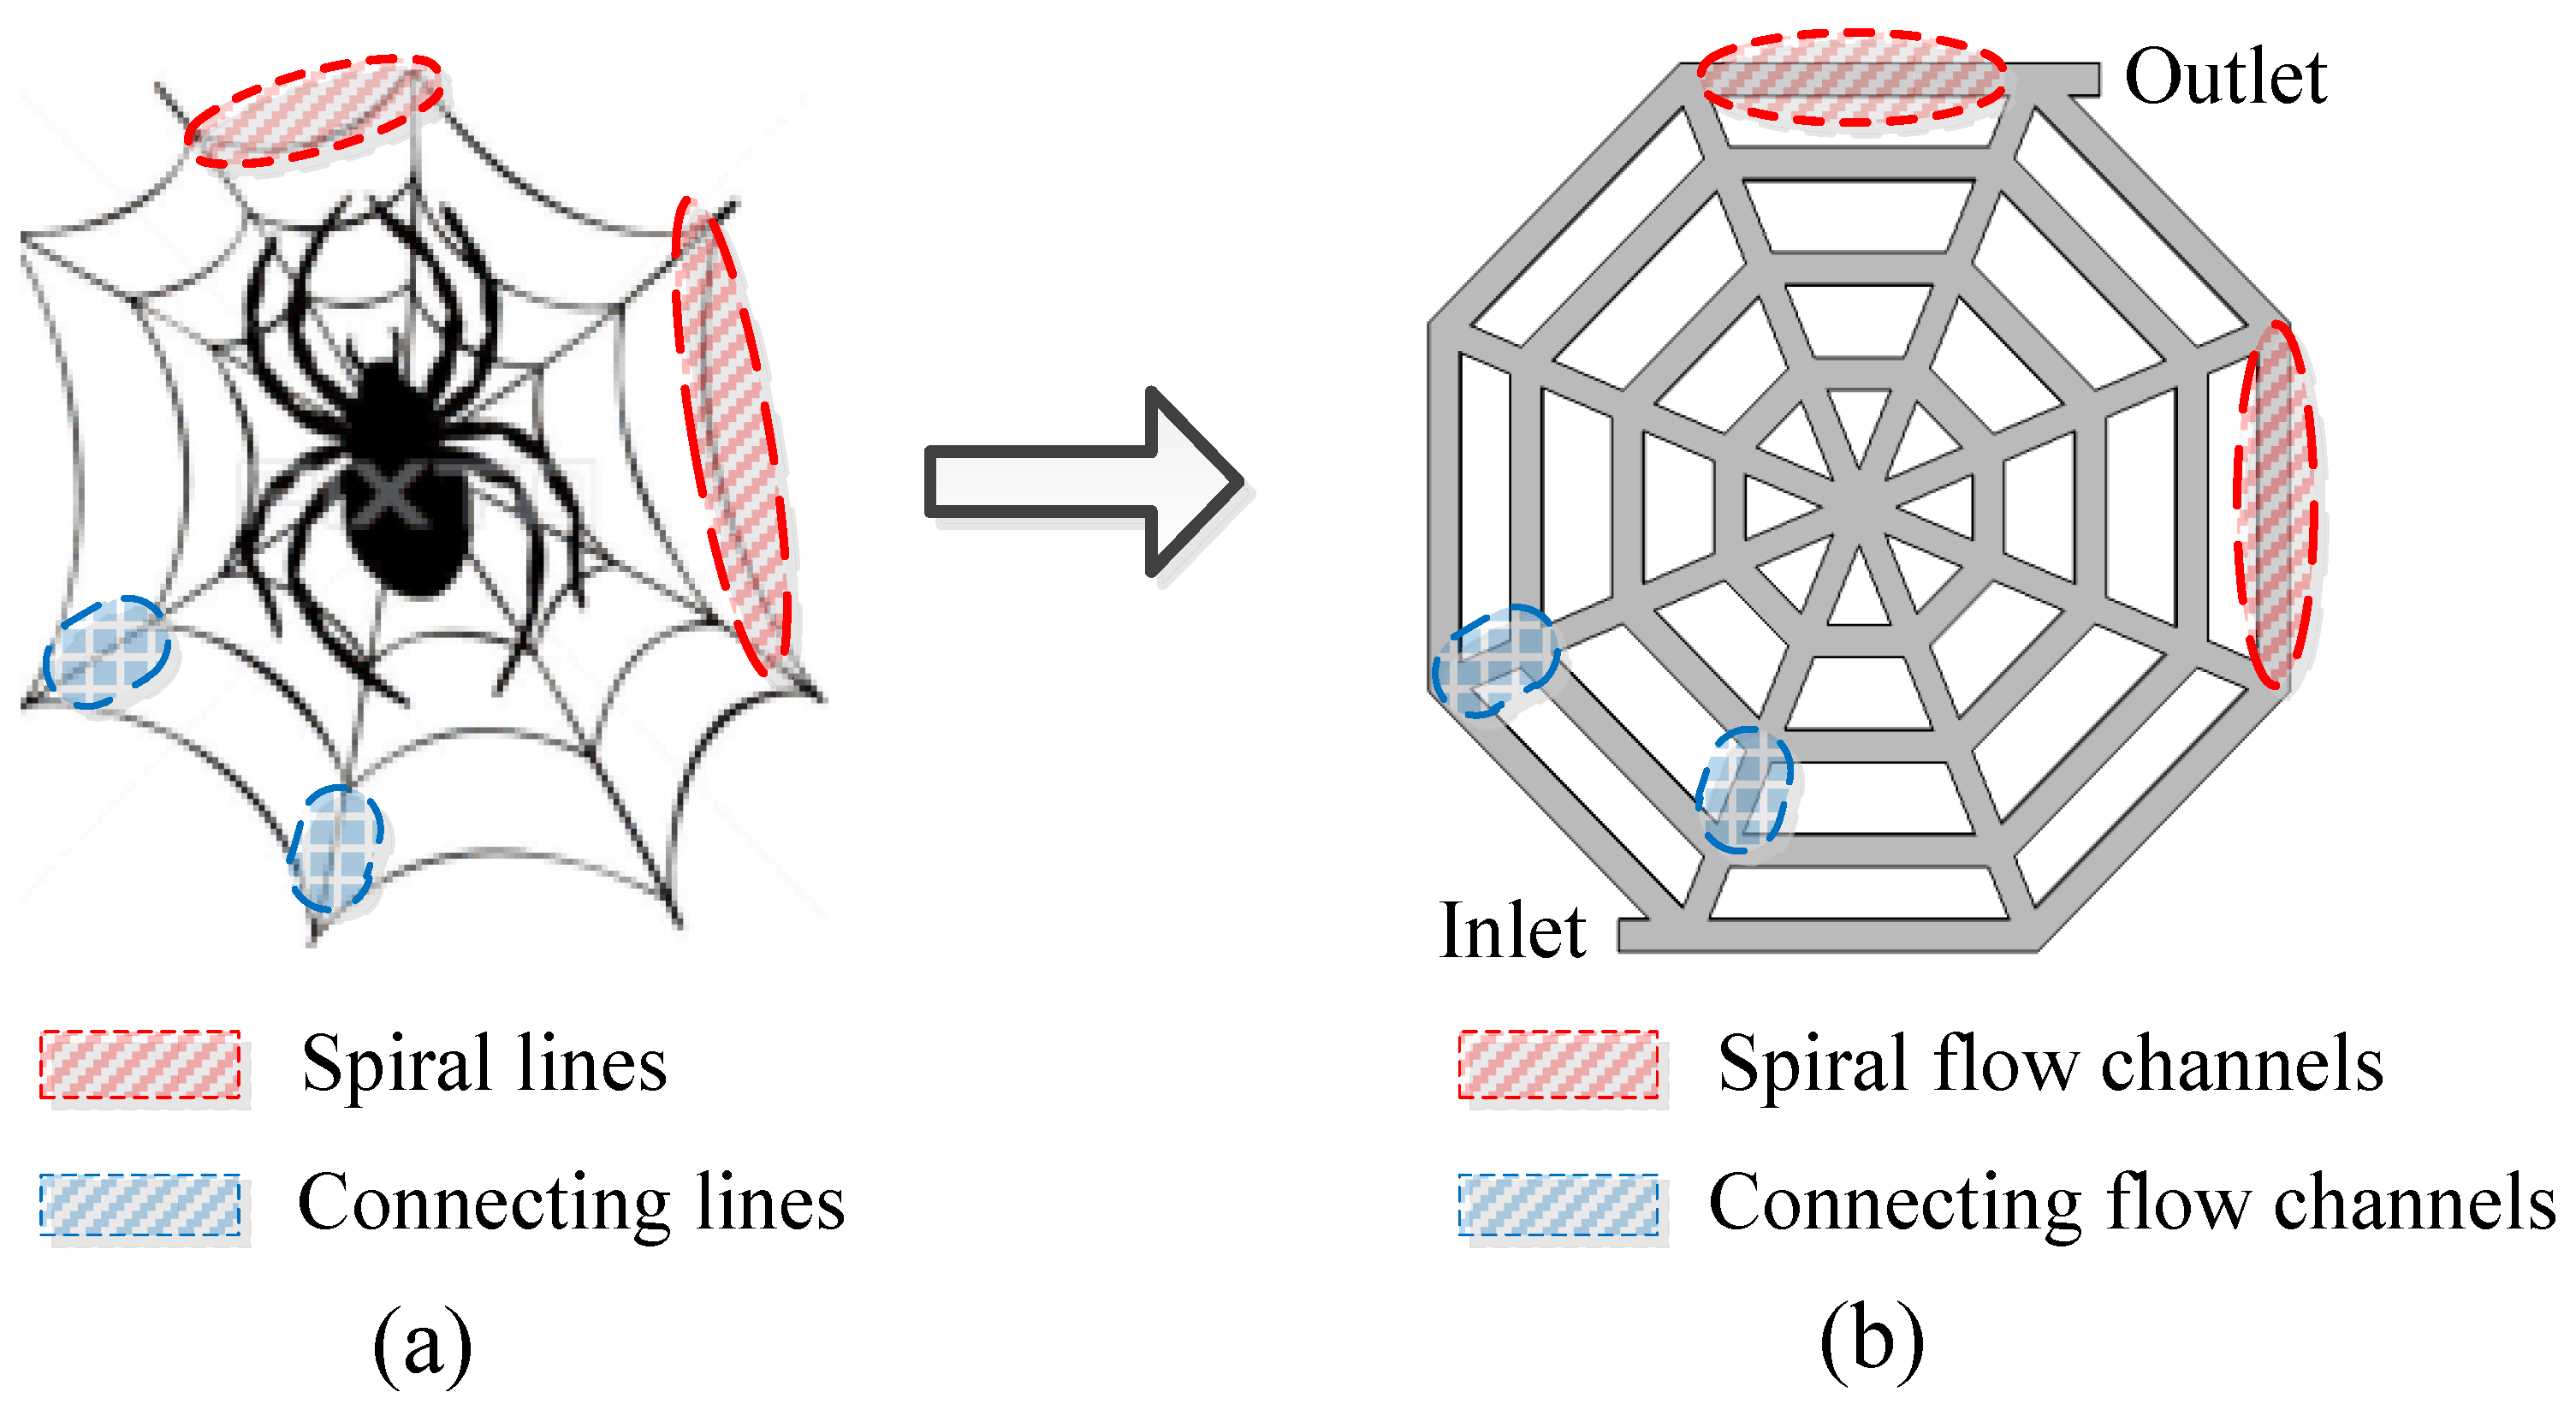
Whether it is imitating fish bone, mammalian lung or leaf vein, they can all be regarded as the result of the combination of several flow channels with a similar shape and arrangement. Additionally, there are many other substances with this rule in nature, such as snowflakes and spider webs. The flow field structure designed on this basis should also have a positive influence on the performance of PEMFC. Li designed the flow field of imitating a snowflake structure and carried out a series of follow-up studies on it. The improvement effect of this structure confirmed the above inference [
18]. Compared with the snowflake structure, there is still a lack of literature related to the design of flow fields inspired by spider web structures. For this reason, in this study, three-dimensional computational models of PEMFC with a bionic spider-web-type flow field were designed and established. The shape of the polygonal structure and the number of layers of spiral flow channels are the key variables of this flow field structure. In order to explore the influence of these two variables on the cathode flow field, the computational fluid dynamics (CFD) method was used to simulate the models with different polygonal structures and flow channel layers, and the differences in oxygen diffusion performance, water removal performance and fuel cell output characteristics were compared, subsequently. The ultimate purpose of this study is to determine the optimal scheme for the shape of the polygonal structure and the number of layers of spiral flow channels, and compare it with the traditional flow field, in order to verify the significance of this kind of structure in improving the performance of the cathode flow field in PEMFC.
3. Results and Discussion
In PEMFC, the hydrogen from the anode reacted with the oxygen from the cathode generating water and releasing a current. The water mainly collected in flow channels on the cathode side and was finally discharges from the PEMFC together with the oxygen which did not participate in the electrochemistry reaction. In order to achieve this purpose, it was necessary for the oxygen on the cathode to have good diffusion properties. However, unlike the strong diffusion ability of hydrogen itself, the transfer efficiency and distribution uniformity of oxygen are usually optimized by improving the structure of the cathode flow field. Therefore, whether the distribution of oxygen is uniform or not and whether the water can be effectively removed are two important bases for judging whether the flow field structures proposed in this study were reasonable. In addition, the comparison between the currents generated by different schemes were analyzed through polarization curves and power density curves.
3.1. Oxygen Distribution Performance
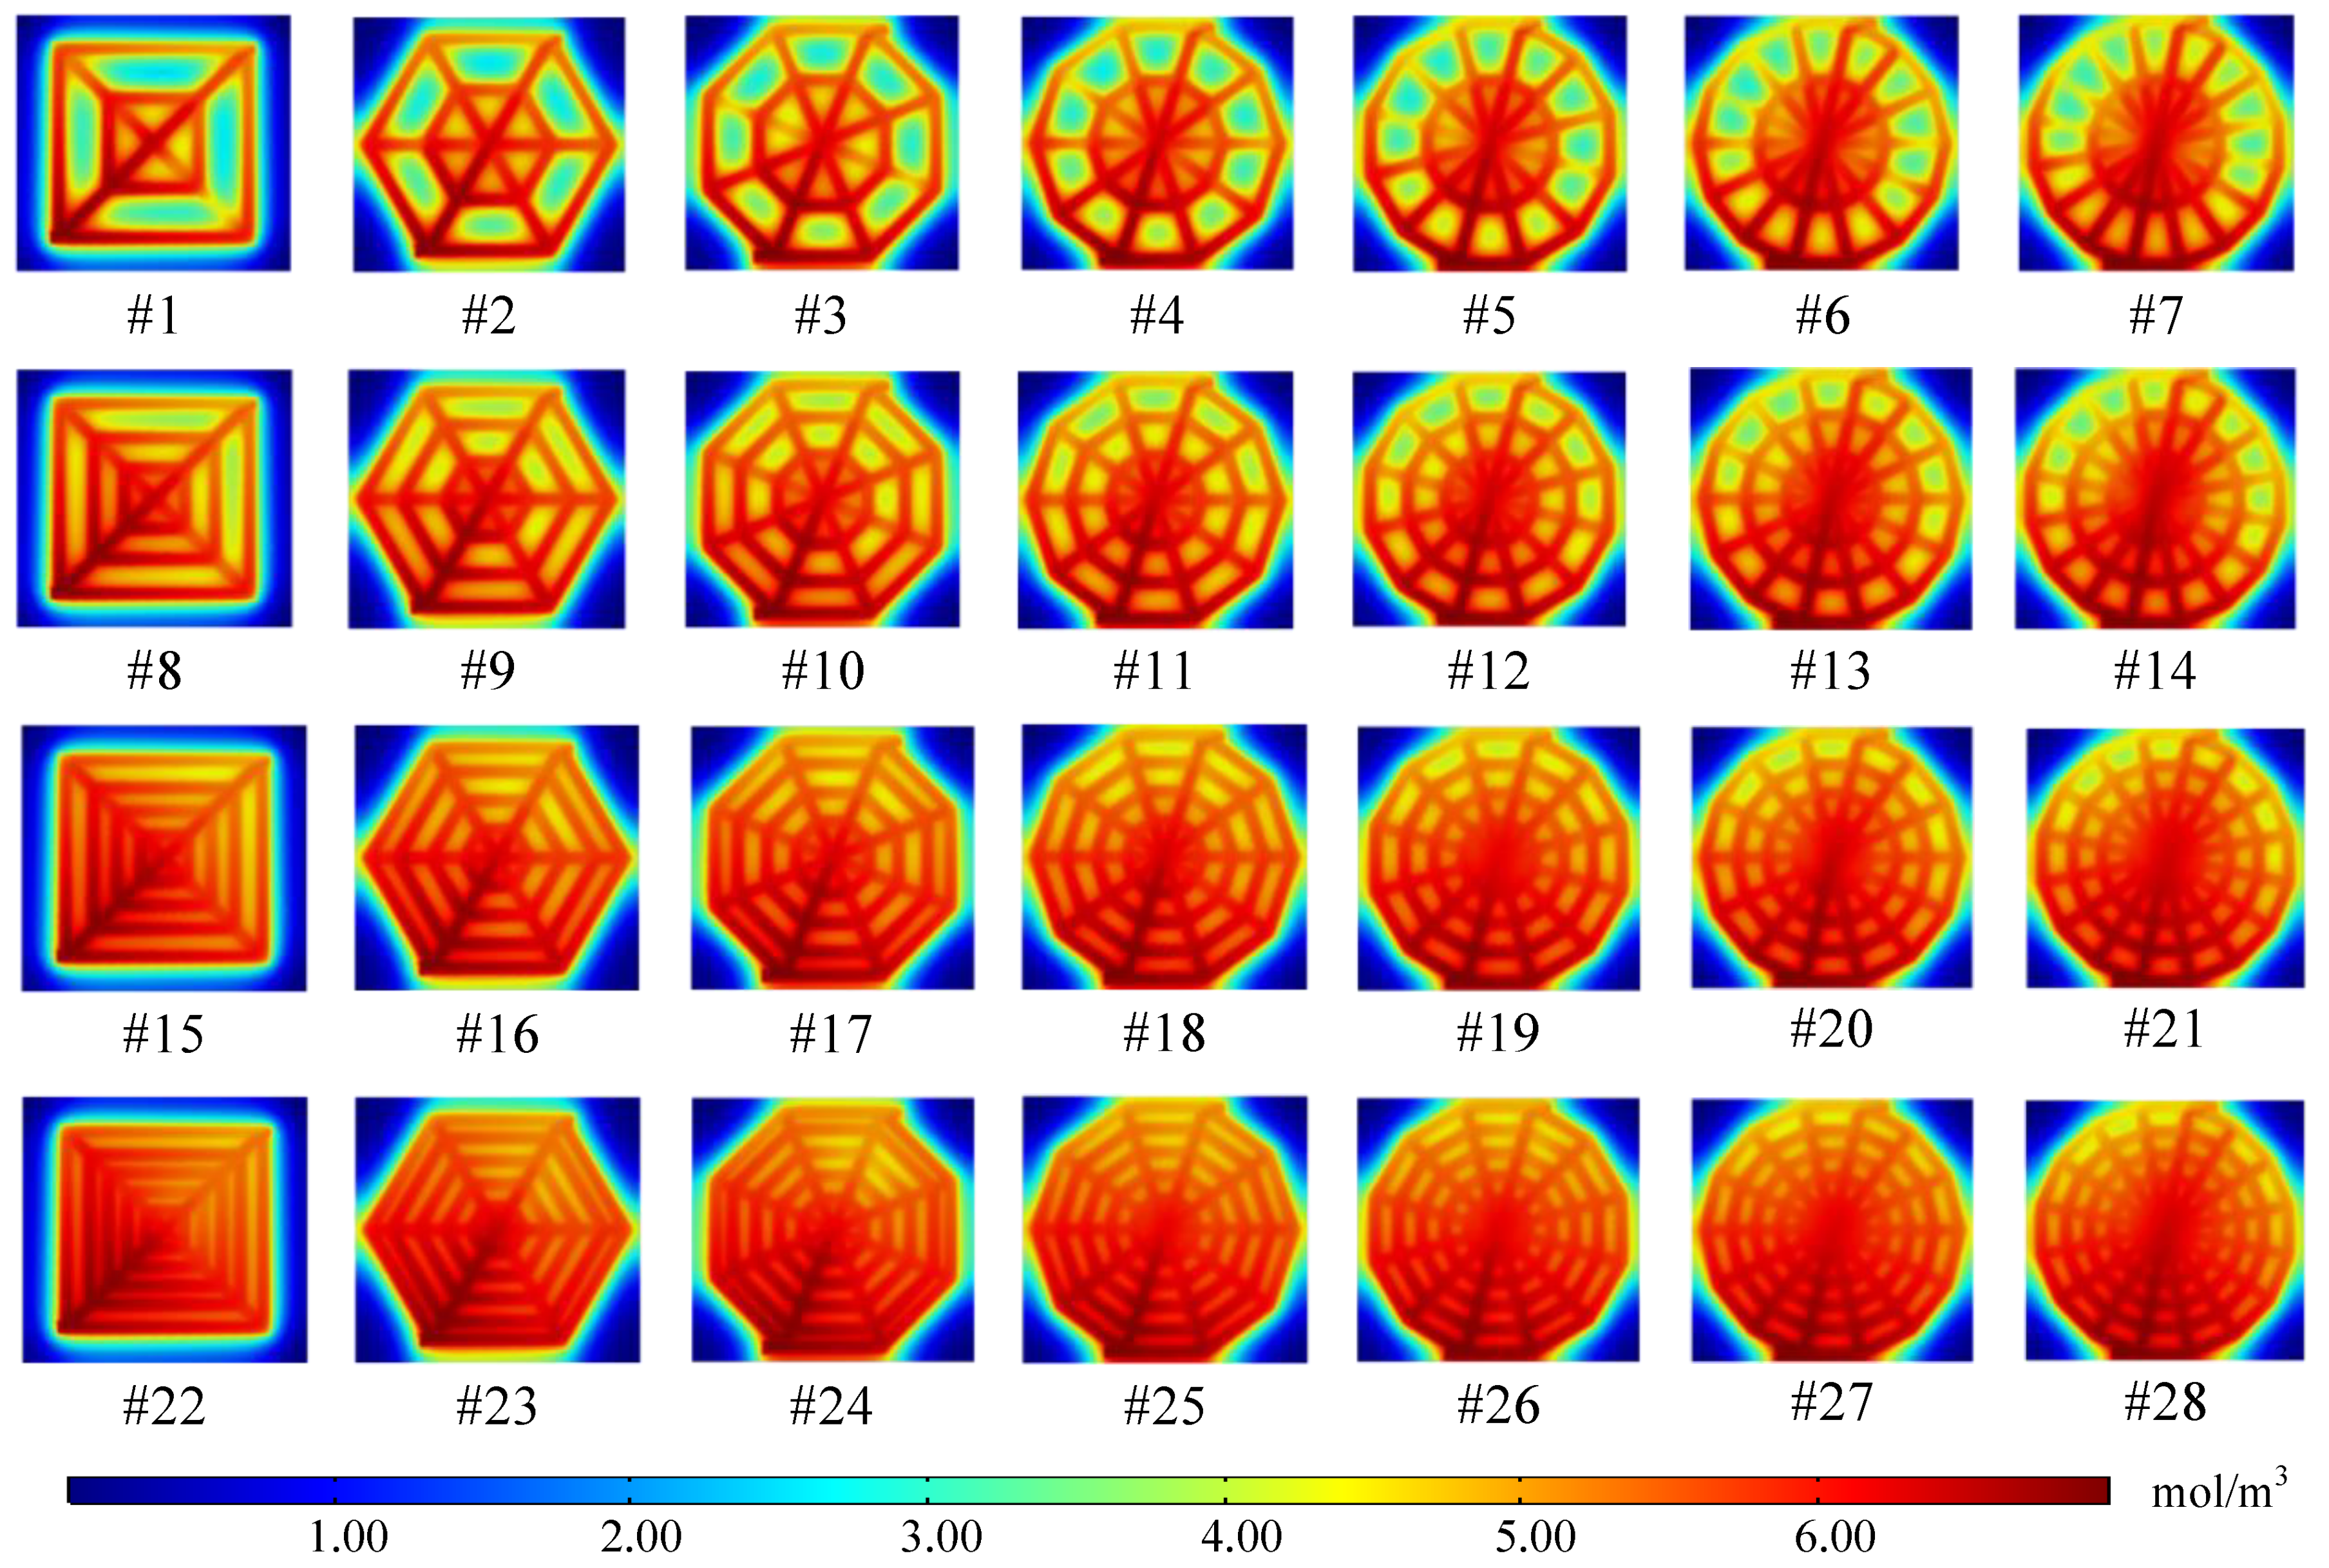
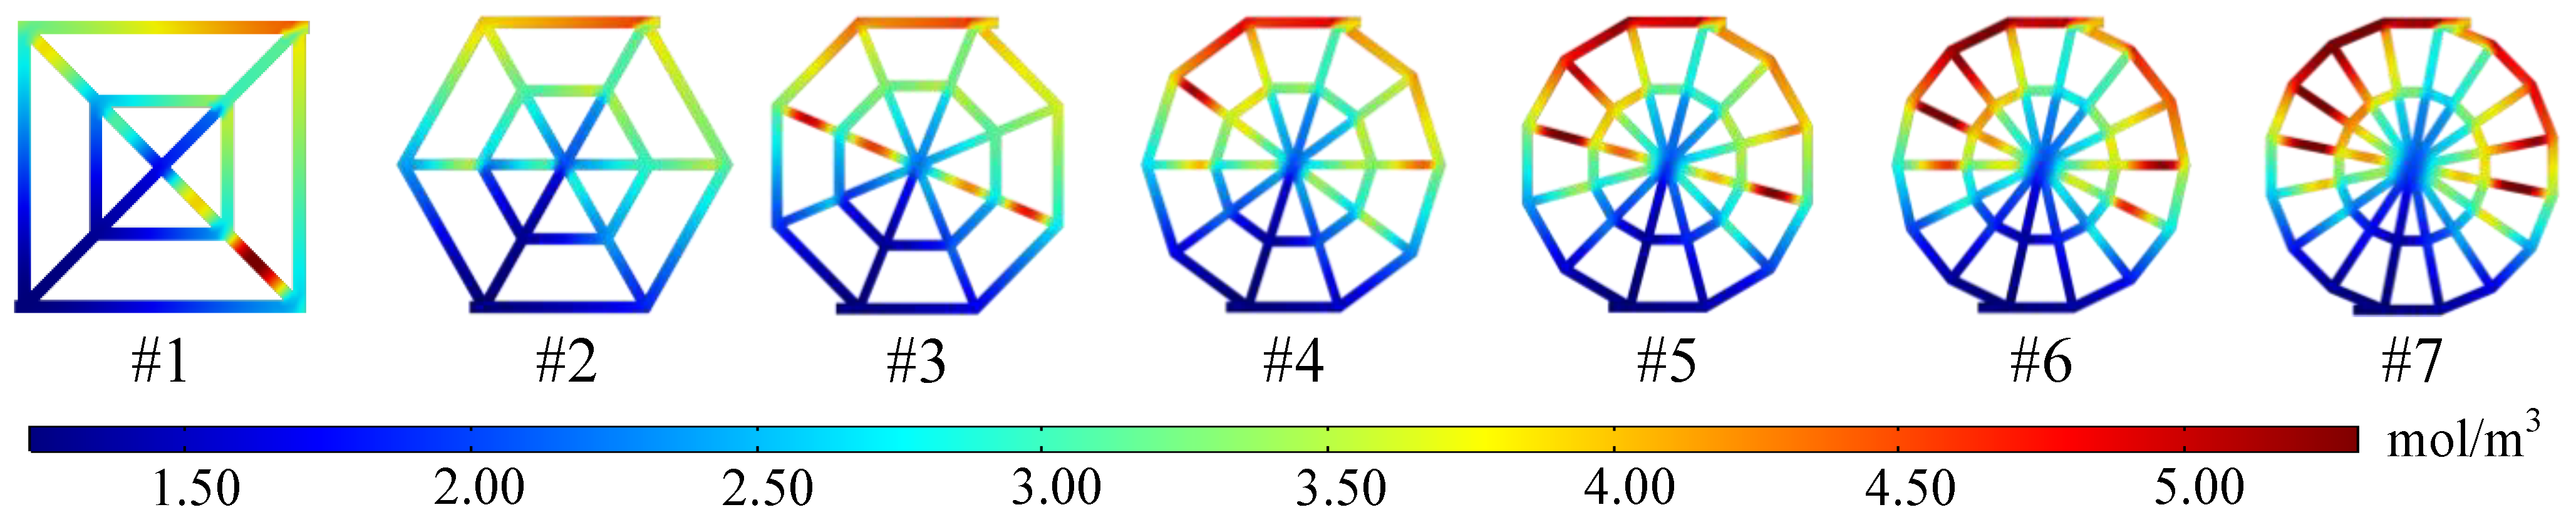
Figure 5 represents the oxygen distribution of different schemes at the interface of the cathode GDL and CL under the operating voltage of 0.7 V.
For all schemes, it can be seen from the figure that the distribution of oxygen in the cathode flow field showed good symmetry on both sides of the flow channel connecting the inlet and the outlet. In addition, in most single flow channels, the concentration of oxygen did not decrease significantly along the channel. These two characteristics are not available in some traditional flow fields.
In
Figure 5, the different schemes in each row reflect the influence of changing the shape of polygonal structures on the oxygen distribution at the interface. It is worth mentioning that changing the shape of polygonal structures means that the number of polygonal sides changed. In this paper, for the convenience of expression, the change of the shape was also expressed by the increase or decrease in the number of polygonal sides.
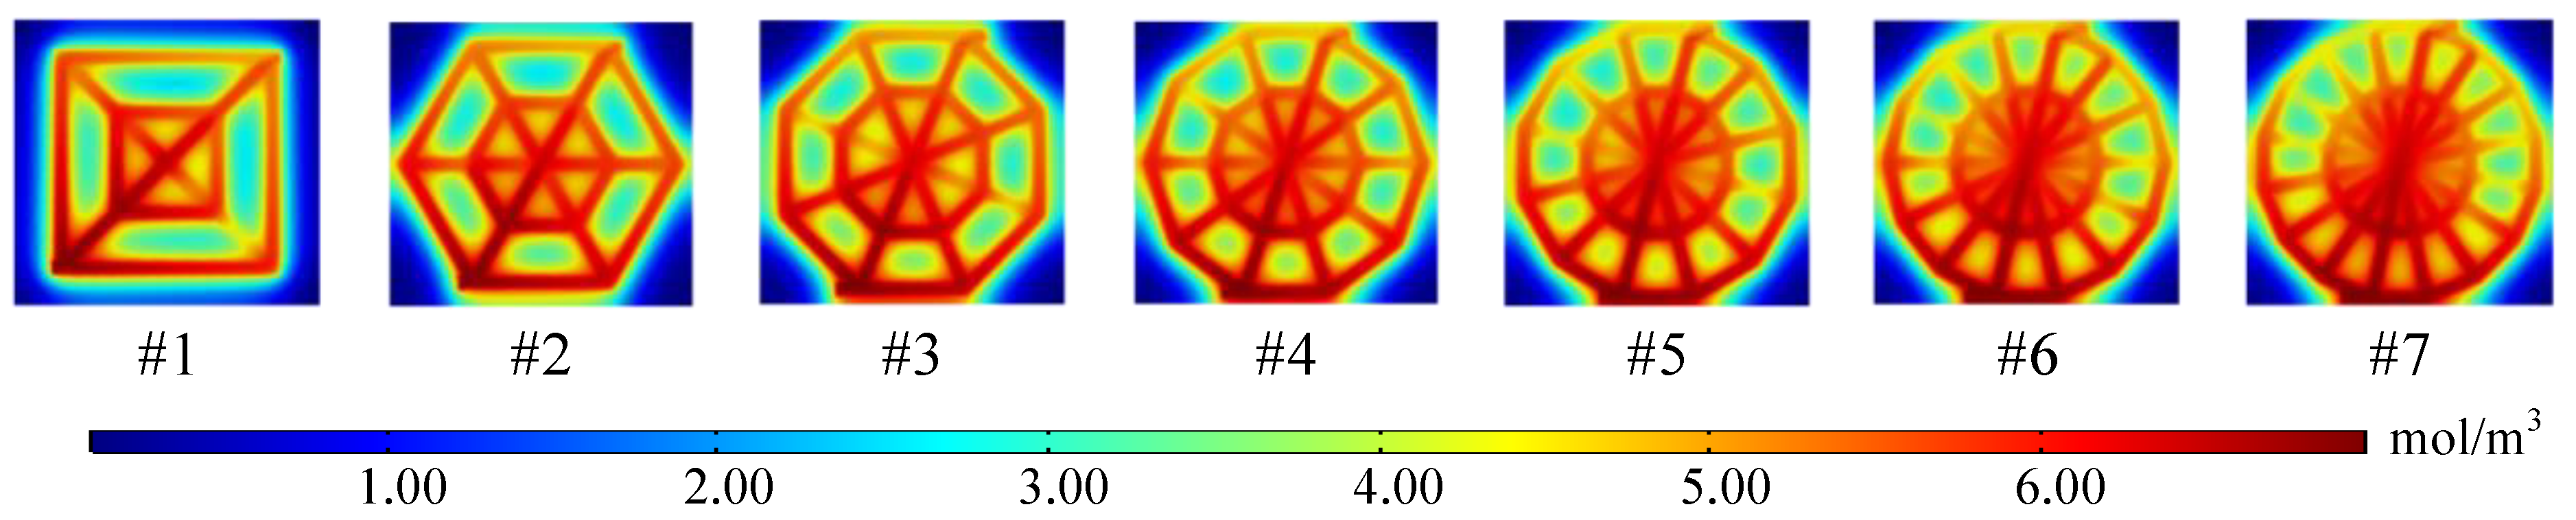
Taking schemes #1 to #7 as examples, their oxygen distribution is shown in
Figure 6. As the number of polygonal sides increased, the uniformity of oxygen distribution in the cathode flow field was becoming worse. Especially in the area near the outlet, the oxygen concentration in some spiral and connecting flow channels reduced obviously. The interaction between the inflection points and the included angles at the junction of adjacent spiral flow channels in the second half of the flow field played a key role in causing this phenomenon.
On the one hand, the increase in the number of polygonal sides led to an increasing number of spiral flow channels, and the number of inflection points between adjacent spiral flow channels grew as a result. The more the number of inflection points, the more frequently the flow direction of the gas changed, which would undoubtedly affect the smoothness of the gas flow. However, the increase in the number of inflection points was not all bad. In the first half of the flow field, the sufficient gas supply made the influence caused by the inflection points less obvious. However, when oxygen reached to the second half of the flow field, it was consumed continuously due to the participation in the reaction. At this point, the increasing number of inflection points produced a favorable influence on the transport of the remaining gas. The frequent changes in the flow direction of the remaining gas caused by inflection points resulted in a constant change in its flow velocity. At the same time, the pressure received by the remaining gas from the side wall of the flow channel also became stronger. These two factors led to an increased ability of the remaining gas to continue flowing towards the outlet, and the problem of gathering in the flow channel due to insufficient pressure and a reduced flow rate was less likely to occur.
On the other hand, the included angle between adjacent spiral flow channels gradually increased with the growing number of polygonal sides, making the transition between adjacent spiral channels smoother than before. However, the increased angle was not all good. Additionally, in the second half of the flow field, the smoother transition was, on the contrary, not conducive to the remaining gas transport, and the gas instead converged there due to the lack of flow pressure. In contrast, the sharper the angle was, the greater the instantaneous velocity changed when oxygen flows through the inflection points, which was more conducive to the delivery of residual oxygen to the outlet.
From the above analysis, it can be seen that in the second half of the flow field, the increase in the number of inflection points favored the flow of the remaining gas, while the larger included angles, on the contrary, caused the accumulation of the gas. Continuously increasing the number of polygonal sides, both influencing factors increased, but the role of the included angle gradually dominated; thus, causing an adverse effect on the oxygen transport and distribution in the cathode flow field.
The growing polygonal sides not only increased the number of spiral flow channels, but also the number of connecting flow channels. Especially near the outlet, the increase in inflection points and included angles between adjacent spiral flow channels had already affected the oxygen distribution. However, the newly added connecting flow channels made the oxygen flow in this area encounter a new problem of gas diversion, which aggravated the phenomenon of low oxygen concentration and uneven distribution in the second half of the flow field. In some schemes, the number of connecting flow channels with insufficient oxygen distribution even exceeded that with the normal oxygen concentration near the outlet.
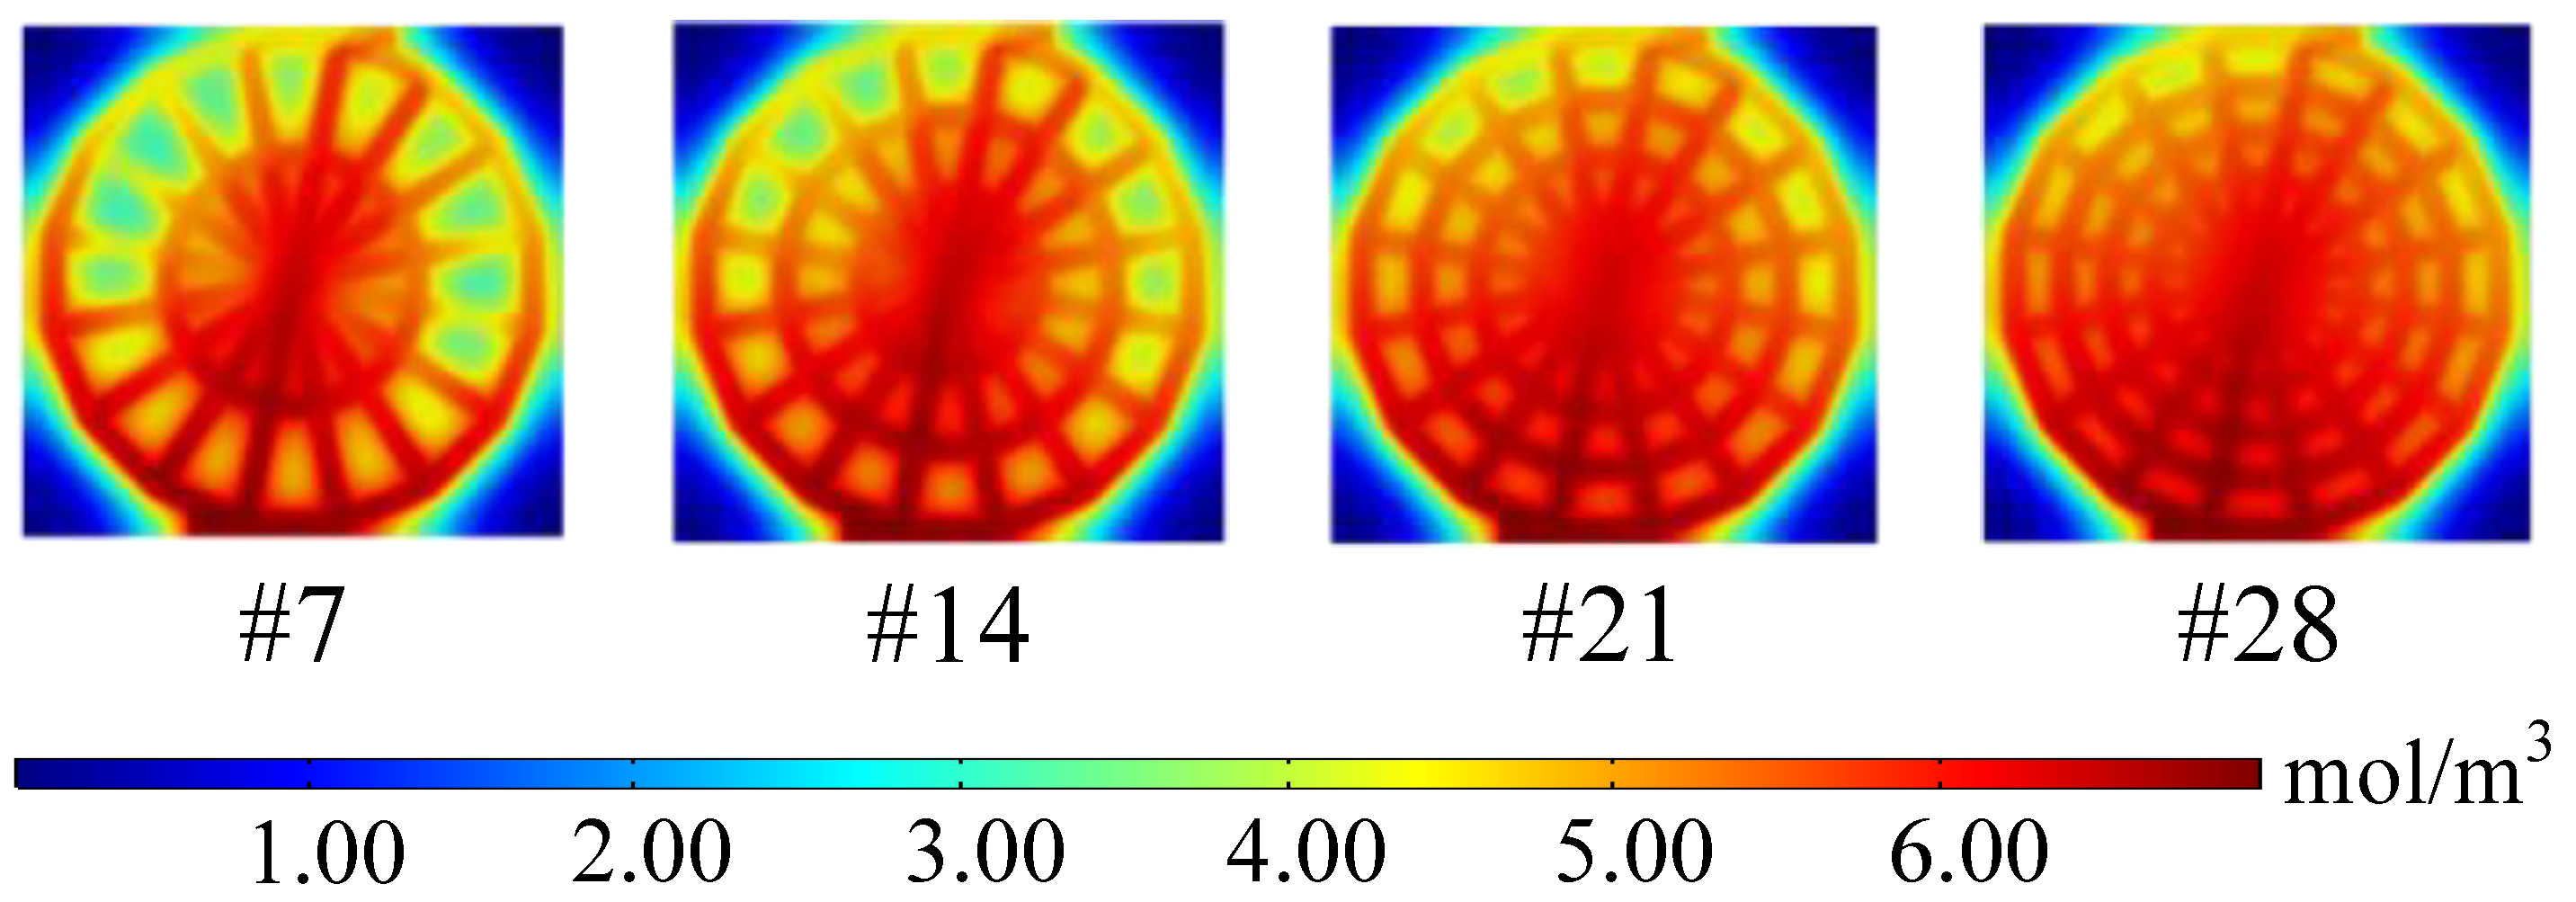
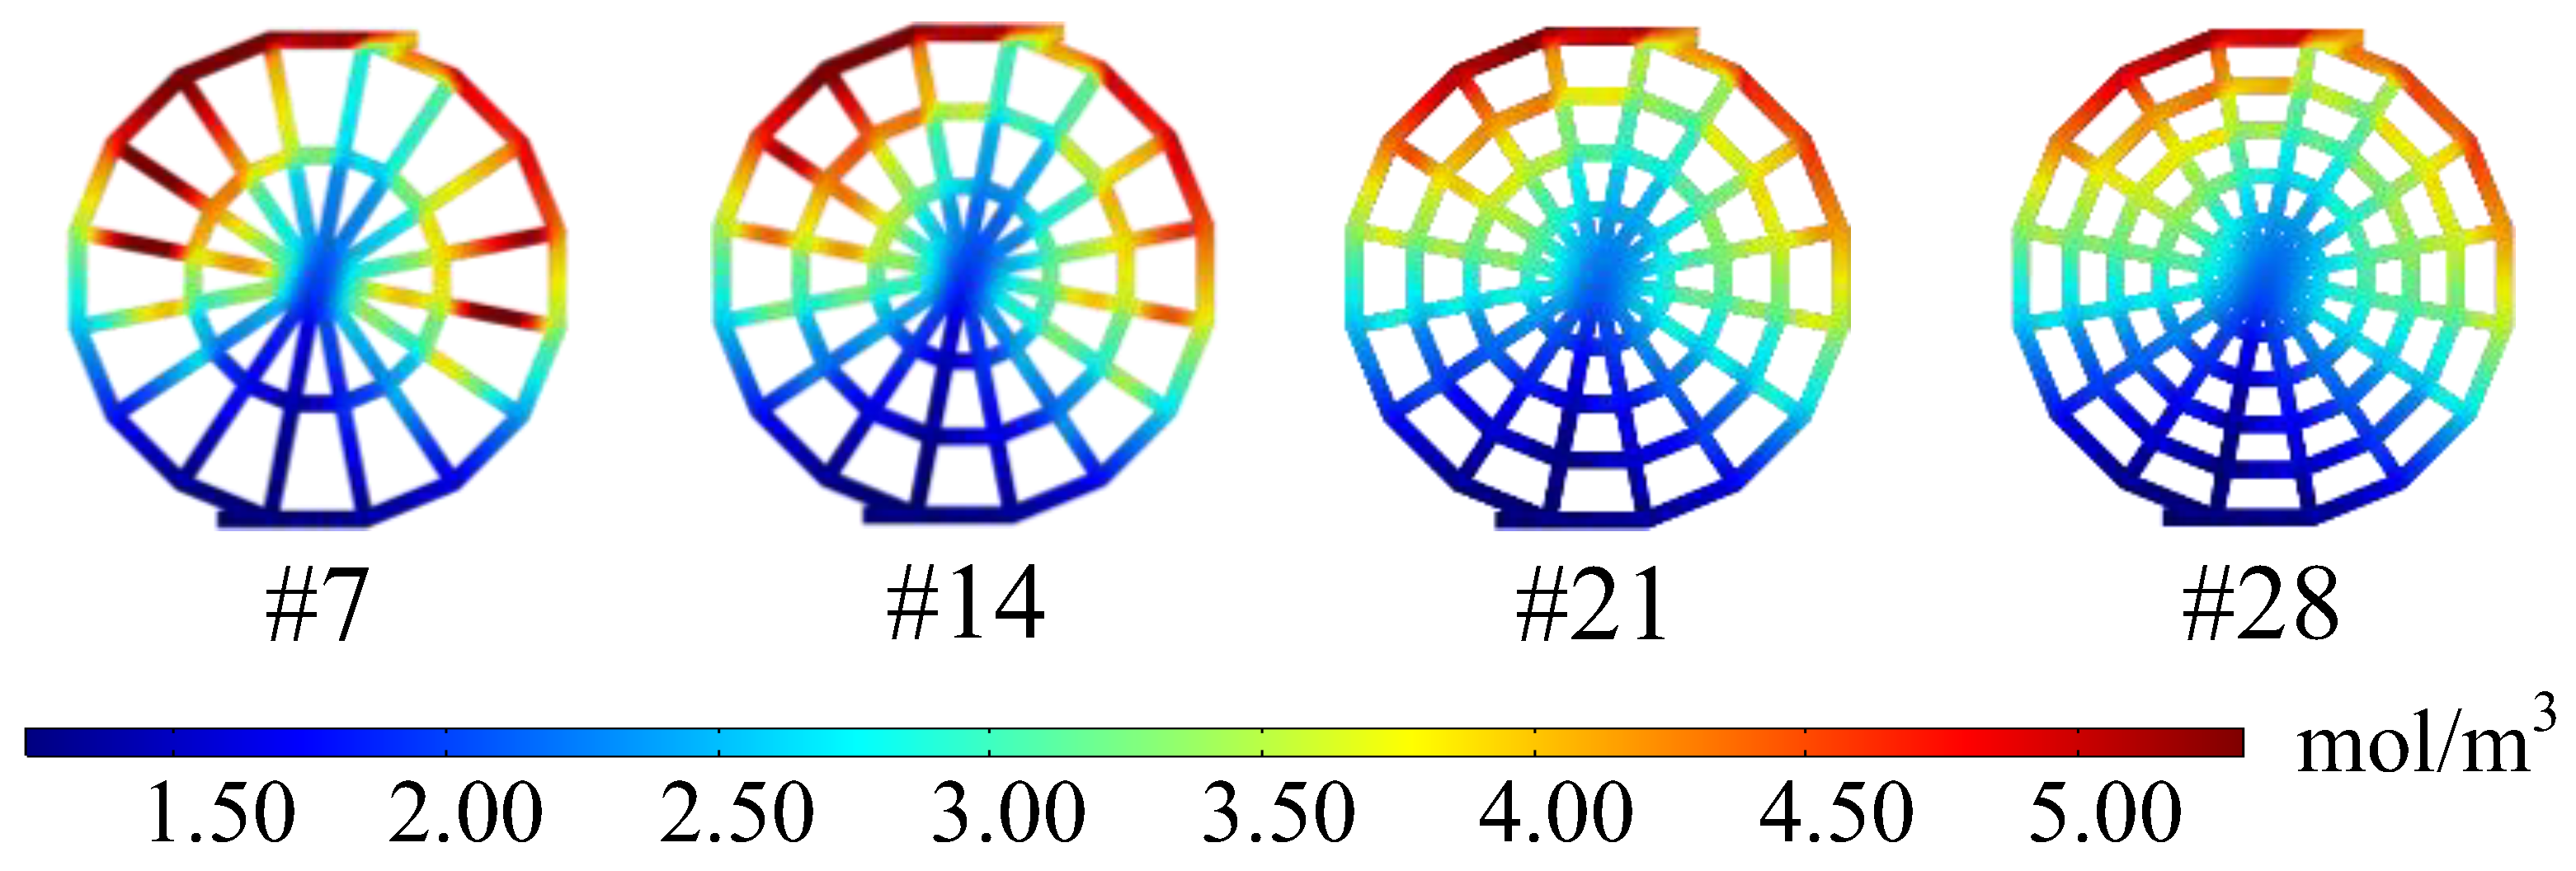
Increasing the number of layers of spiral flow channels was an effective way to improve the uniformity of oxygen. Each column in
Figure 5 illustrates the influence of different number of layers on oxygen distribution at the interface. Choosing #7, #14, #21 and #28 as the comparison schemes, it can be seen from
Figure 7 that the effect of increasing the number of layers on the uniformity of oxygen distribution was mainly reflected in the flow channels of the outer layers. In the inner layers, the gas distribution in each scheme maintained a good uniformity and density. This is because the distance between the inner flow channels, especially the connecting flow channels, was small, making it easier for the gas to diffuse through the convection under the ribs. However, in the outer layers, the distance between the flow channels was constantly expanding, and it was extremely difficult to realize the convection under the ribs, which led to the phenomenon that the oxygen concentration in the area under the ribs was lower than that in the area under flow channels. With the growing of the number of layers, the space between the spiral flow channels was gradually reduced, and the closer distance improved the convection flow of the gas under the ribs, so the oxygen concentration in this region increased to a certain extent. Similarly, the increase in the number of layers also made the length of the connecting flow channels gradually shortened, leading to the result that the resistance overcome by oxygen diffusing through such channels was reduced, so the performance of oxygen transmission in connecting flow channels was enhanced.
3.2. Water Removal Performance
Figure 8 shows the water distribution of different schemes in the cathode flow field under the operating voltage of 0.7 V.
As can be seen from the Figure, the water concentration was lower in the flow channels at the front part of the flow field. However, in the middle and latter part of the flow field, the water concentration gradually increased, especially in the channels near the outlet, where the water concentration was the highest in the whole flow field. The reasons for this phenomenon could be considered that the accumulated water in the flow channels was mainly discharged from the flow field by the purge of the residual reaction gas, so the concentration and distribution of oxygen were highly correlated with that of water. The oxygen concentration in the first half of the flow field was high, which could effectively carry the water produced by the reaction to the second half of the flow field. However, oxygen was gradually consumed in the reaction. When it flowed to the second half, its concentration decreased obviously. For this reason, in these places, the water accumulated and blocked the flow channels, which eventually obstructed the transmission of the gas.
Figure 9 shows the water distribution of schemes #1 to #7. As shown in the Figure, after increasing the number of polygonal sides, the area with a high water concentration in the second half of the flow field gradually became larger, and the number of flow channels with a significantly increased water content also increased.
According to the analysis of oxygen distribution in
Figure 6, in the second half of the flow field, continuously increasing the number of polygonal sides, the role of the included angle gradually dominated, and the remaining oxygen tended to accumulate in the flow channels due to the lack of flow pressure and the reduction in the flow velocity. At this time, in these flow channels, the water generated by the reaction and carried here by oxygen also accumulated here because the remaining oxygen could no longer effectively purge them to the outlet. In contrast, in the flow field with a small number of polygonal sides, the difference between the effect of the inflection points and the included angle on oxygen transport was smaller, and the uniformity of oxygen distribution and its concentration in the second half of the flow field was higher, so the water removal capacity of such schemes was better.
Similarly, as shown in
Figure 10, increasing the number of layers had a positive effect on the performance of water removal. The improvement was mainly reflected in the reduction in water concentration in the connecting flow channels. After increasing the number of layers, the length of the connecting flow channels gradually shortened and it was easier for oxygen to diffuse through them, so the removal effect of water in these flow channels was relatively better. In contrast, the water concentration in the spiral flow channels, especially in the outermost channels near the outlet, did not decrease with the increase in the number of layers.
3.3. Fuel Cell Performance
The output voltage, current density and power density of the spider-web-type flow field were mainly affected by the joint action of the flow channels and the ribs. In PEMFC, electrons were generated in the membrane electrode assembly (MEA) and conducted to the external circuit through the ribs on the bipolar plate. The larger the contact area between the ribs and the MEA, the more favorable the current conduction. However, the gas diffused as uniformly as possible to all positions of the membrane through the flow channel. As the contact area between the ribs and the MEA increased, the total area of the flow channels would inevitably decrease, and the contact area between the flow channels and the gas diffusion layer would naturally decrease, which was not conducive to the full entry of the reacting gas into the membrane to participate in the reaction to generate electrons. It can be seen that there was an optimal value between the total area of the ribs and the total area of the flow channels (in this paper, altering the polygonal structure or the number of layers changed the ratio of the rib area to flow channel area), which maximized the current conduction of the bipolar plate while ensuring the full diffusion of the reacting gas to the electrodes to participate in the reaction. In this section, a comparative analysis of the output voltage, current density and power density of the spider-web-type flow field was performed to determine this optimal configuration, which in turn determined the polygonal structure and the number of layers under this configuration.
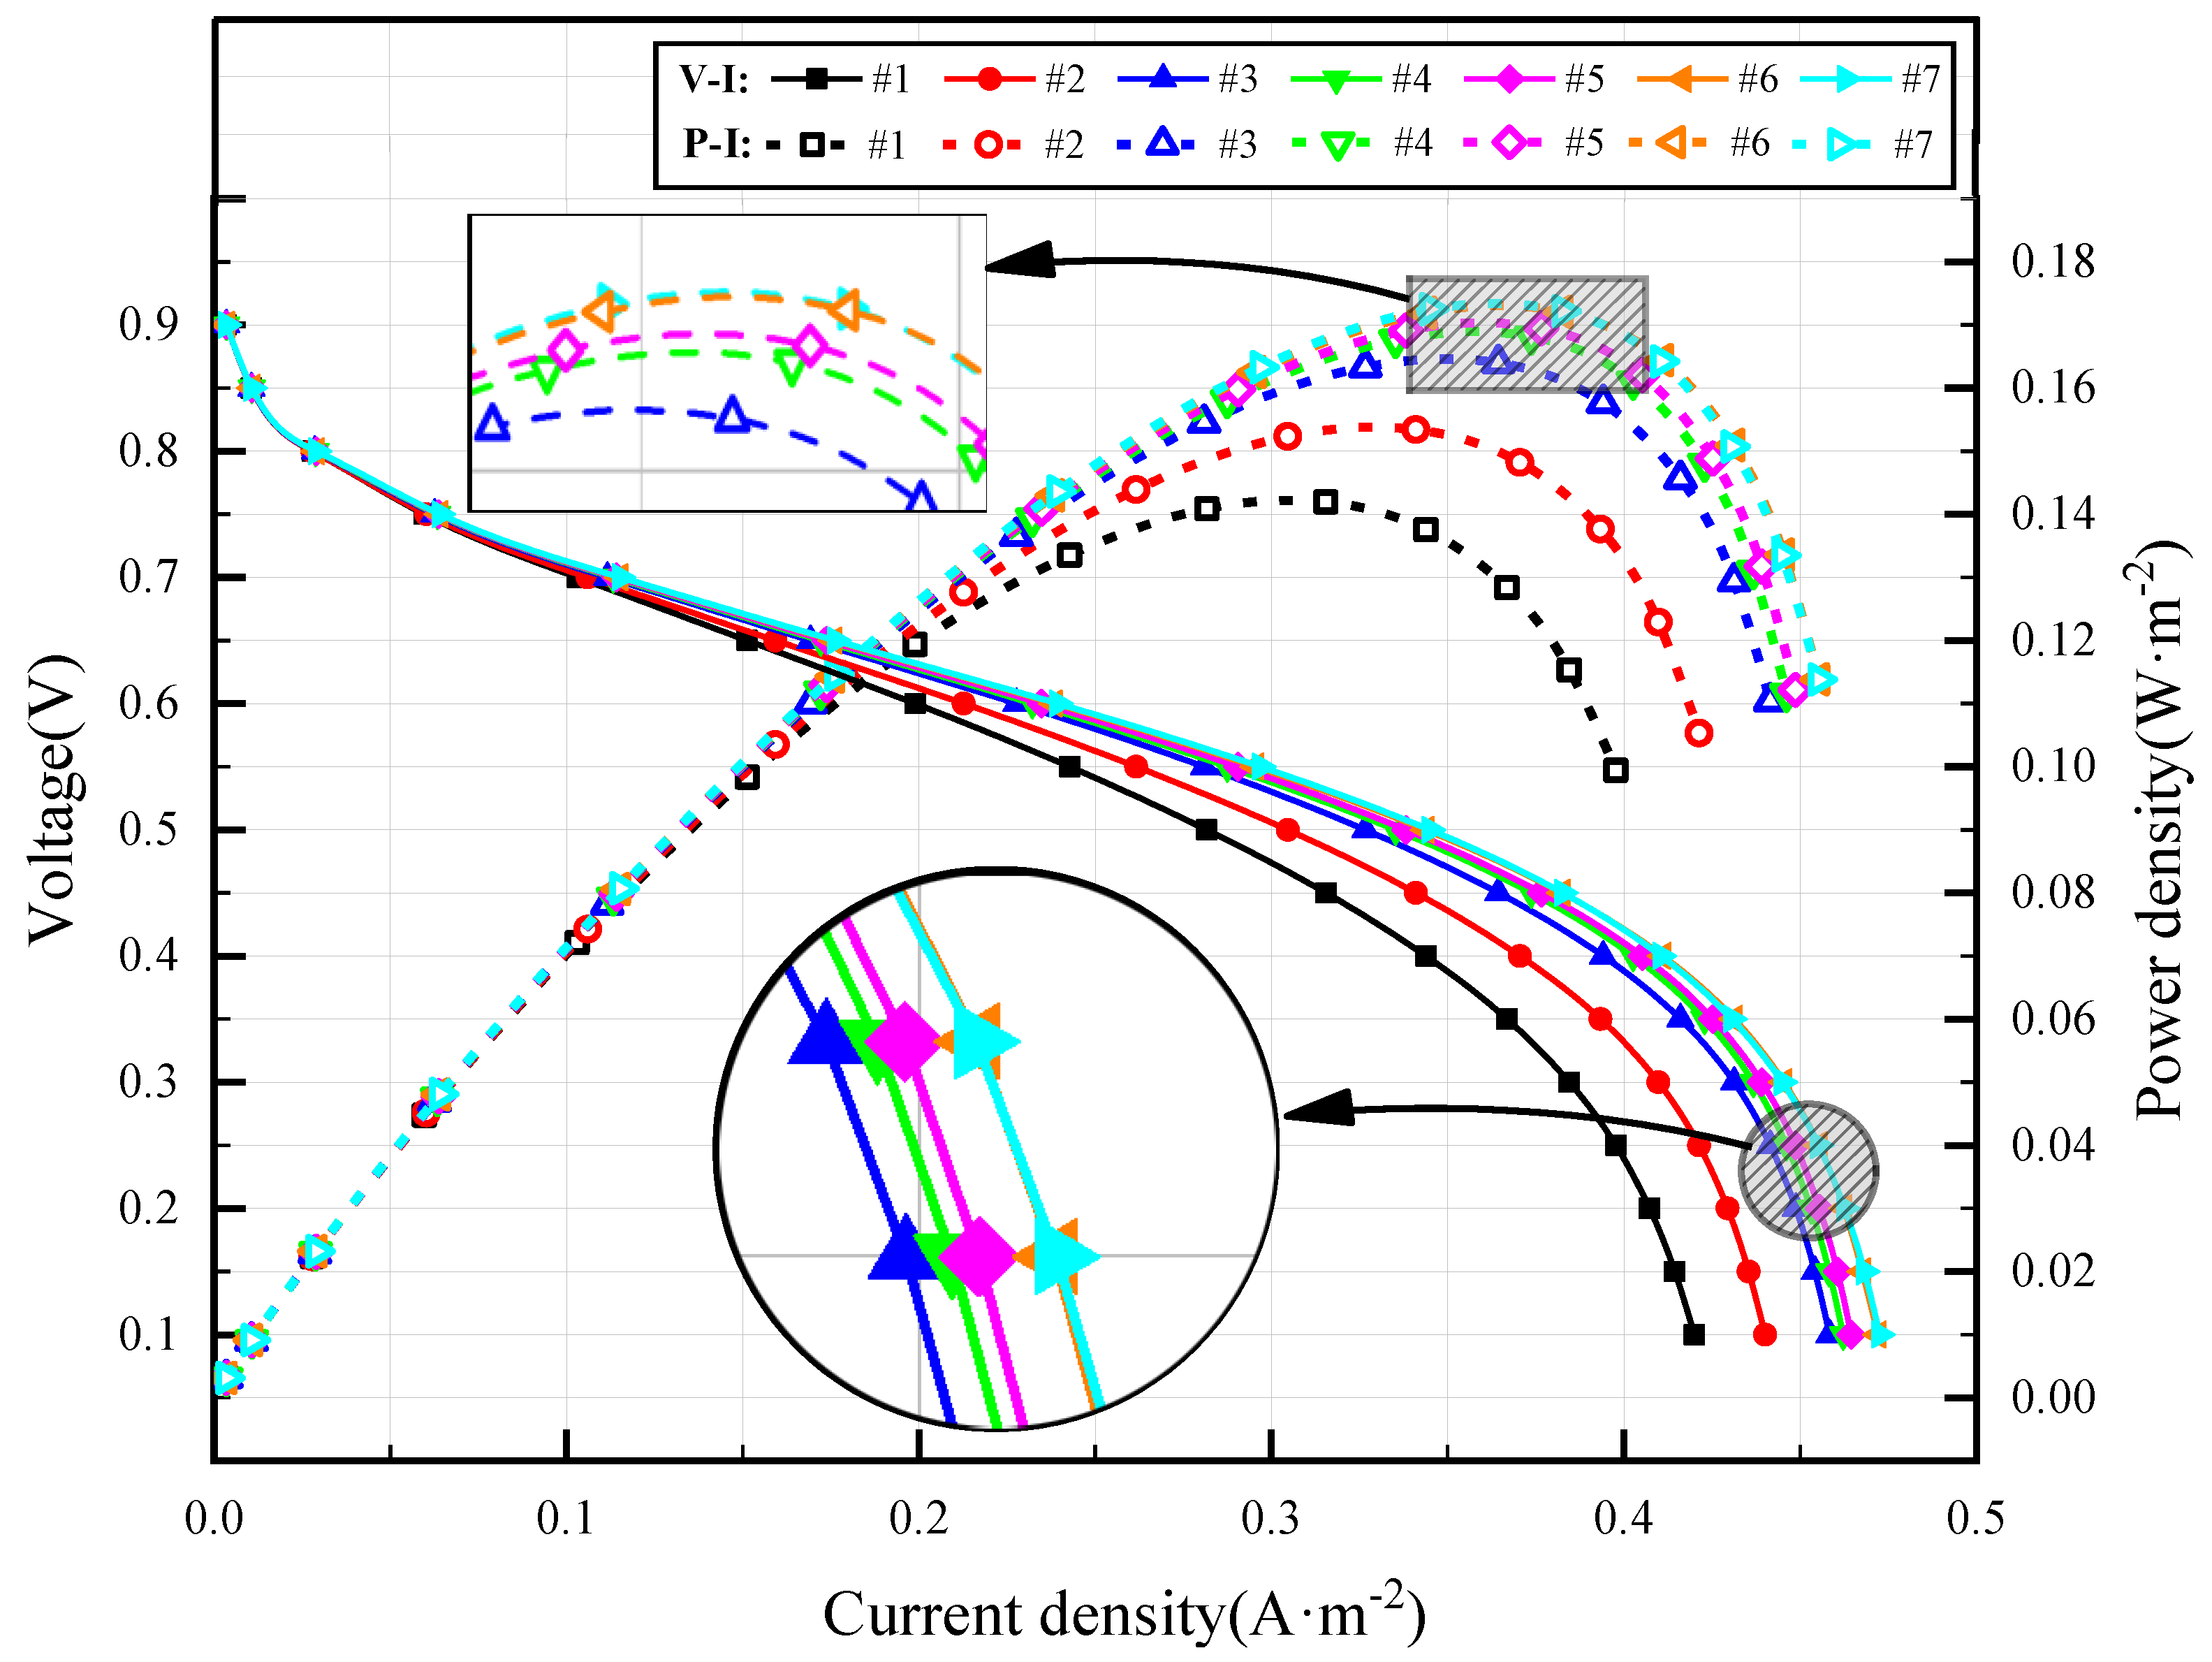
Figure 11 shows the polarization curves and power density curves of schemes #1 to #7.
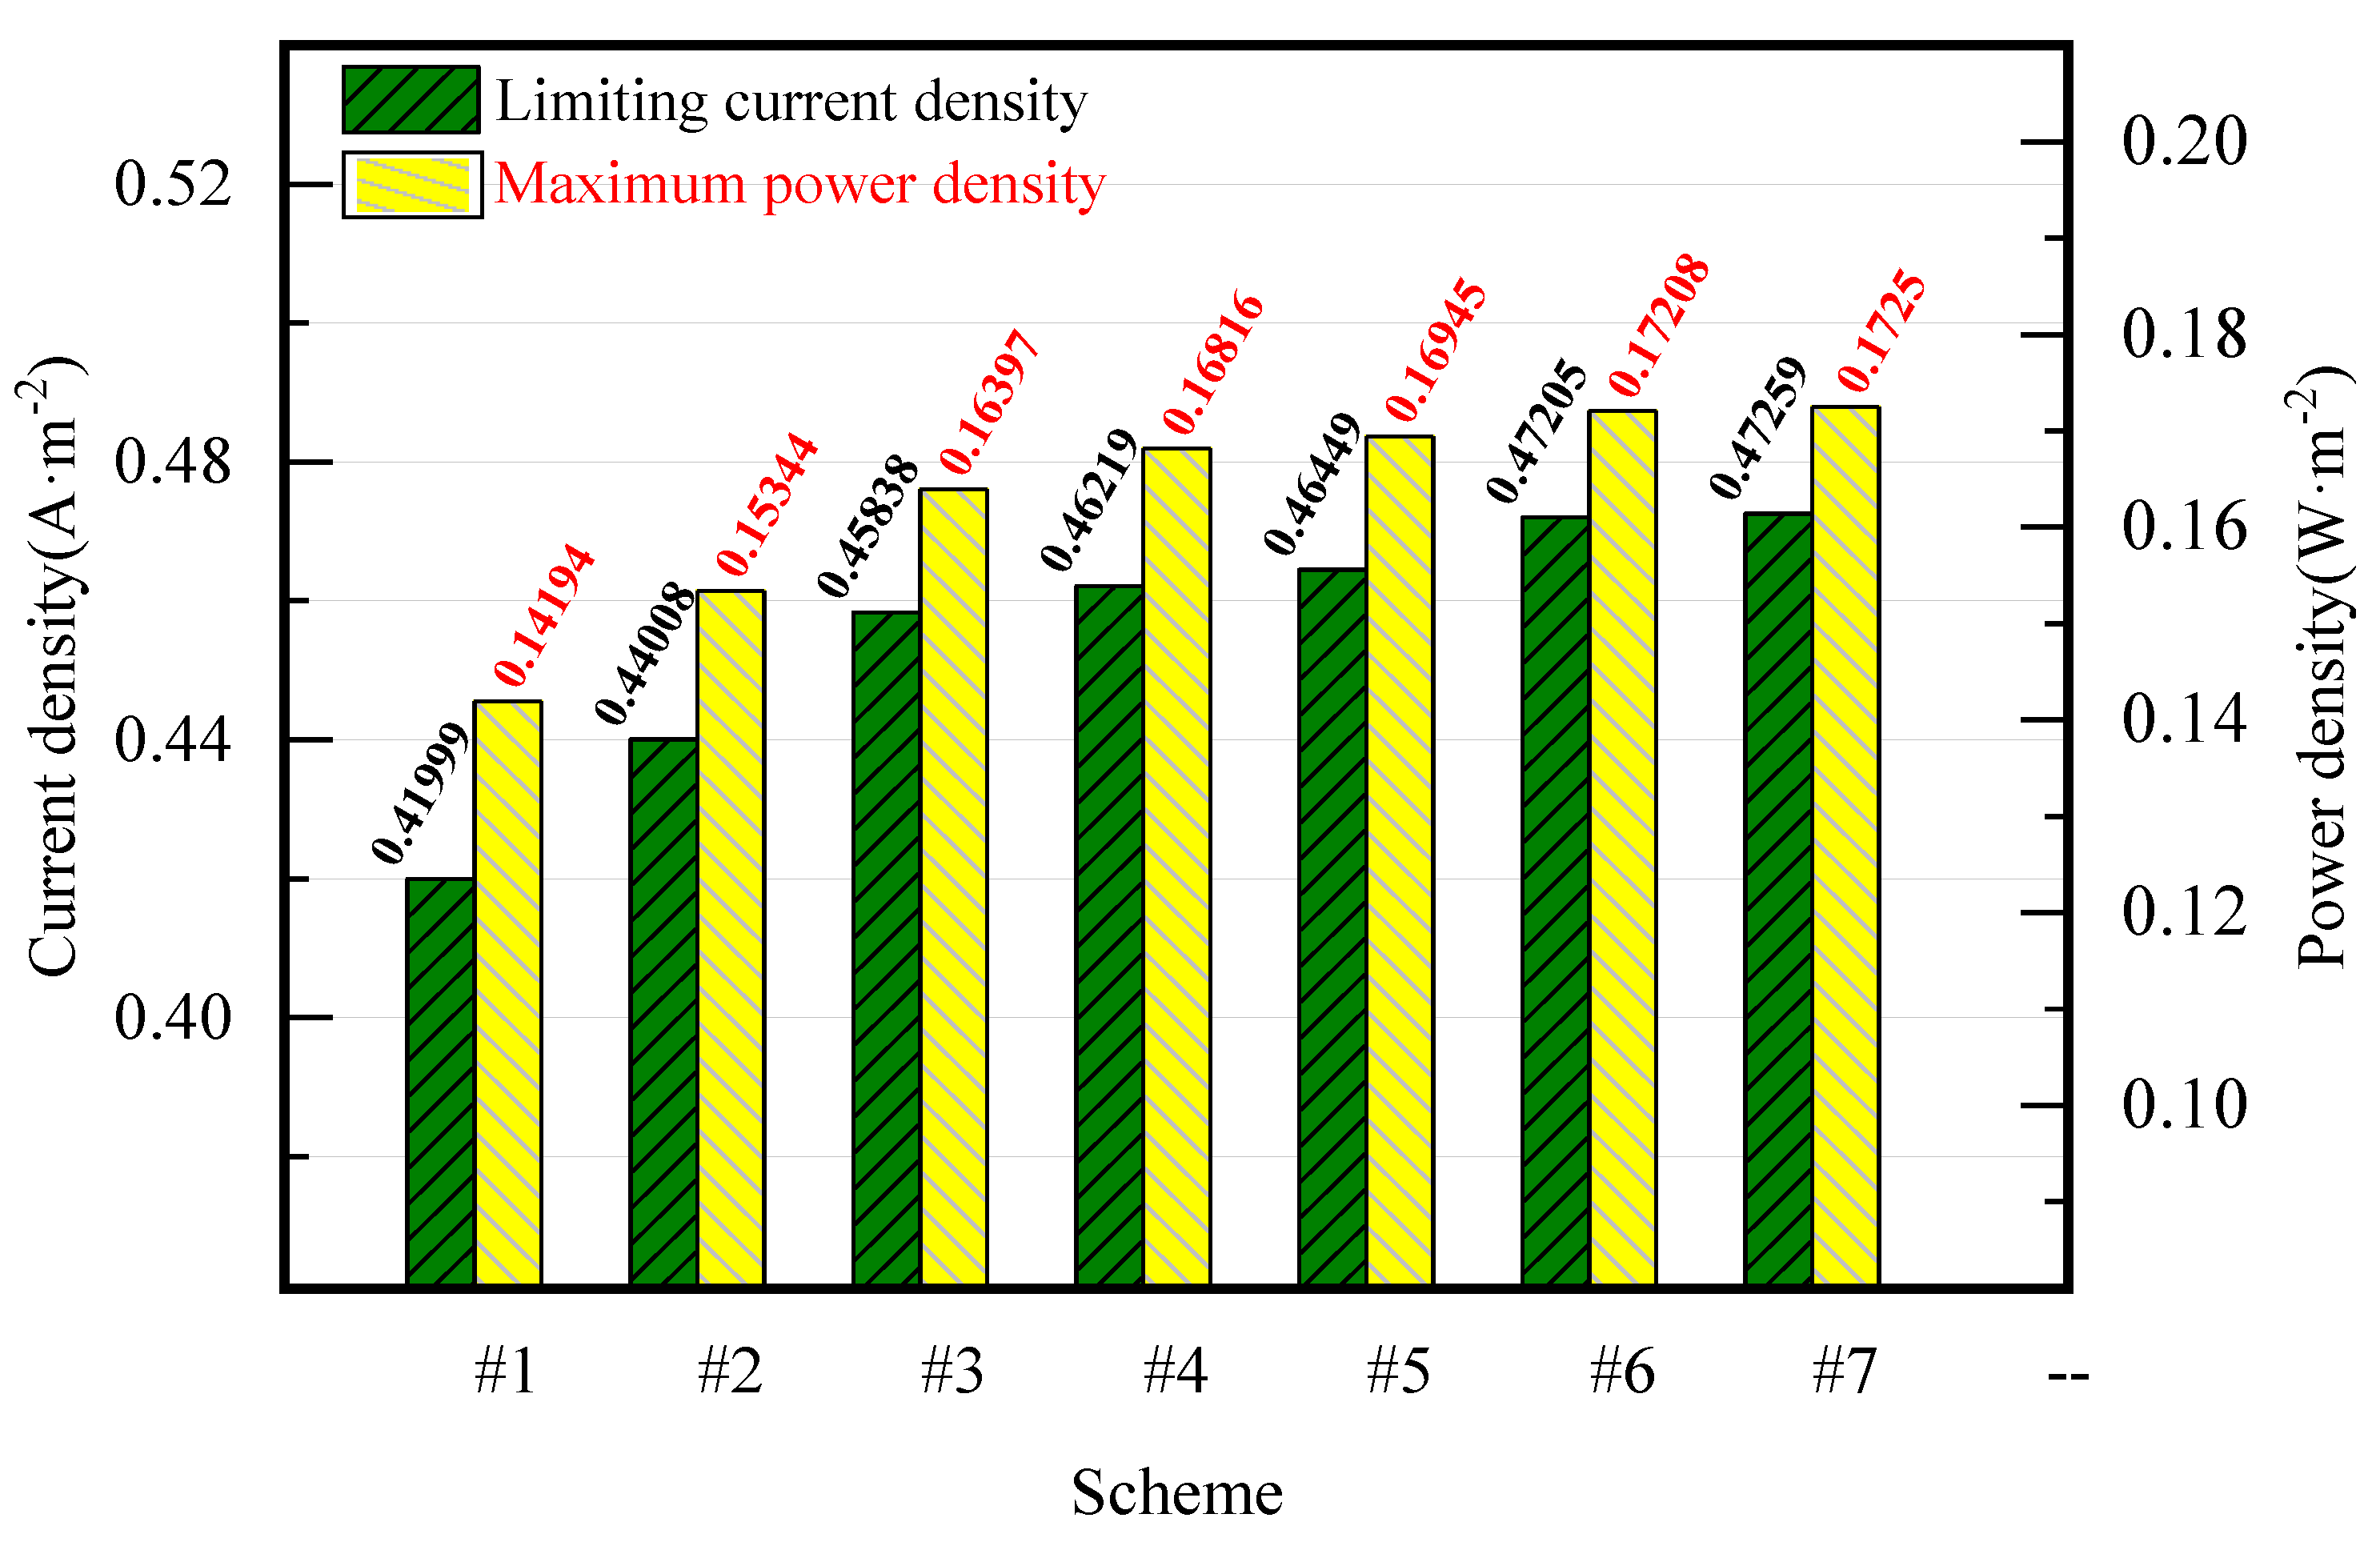
The polarization curve reflects the variation law between the voltage and current density of the fuel cell. It can be seen from the Figure that the voltage decreased with the increase in current density. At low current densities, schemes #1 to #7 all generated high voltages, and the difference between them was small. By contrast, the voltage gap between different schemes gradually increased at the intermediate and high current densities. This is because in these regions, as the number of polygonal sides increased, the total area of the flow channels gradually increased, which meant that the effective contact area between the reactant gas and the MEA also gradually increased, eventually causing the increase in the voltage produced by the fuel cell. What was shown from schemes #1 to #3 is that when the number of polygonal sides increased gradually, the voltage increased obviously and greatly at the intermediate and high current densities, which meant that changing the shape of polygonal structures at the beginning had a significant effect on the increase in voltage caused by the increase in the area of flow channels. However, the growth gap of voltages between schemes #4 and #7 became smaller with the continuous increasing polygonal sides. It is no doubt that the effect of the flow field structure on the fuel cell performance was diminishing. Especially between scheme #6 and scheme #7, the difference in their polarization curves was negligible, which meant that the difference in the interaction between the flow channels and the ribs corresponding to the two schemes was similar. In brief, changing the structure can indeed improve the voltage generated by the fuel cell, but the principle of moderation should be followed. Blindly increasing the number of polygonal sides cannot make the voltage produce a sustained and significant increase. The interaction between the flow channels and the ribs would eventually remain in a floating range and would not grow with the increasing number of polygonal sides. The same trend was reflected in the limiting current density of different schemes in
Figure 12. The limiting current density from schemes #1 to #7 increased gradually, but the growth gap between adjacent two schemes decreased with the increasing number of polygonal sides. The difference between the limiting current density of scheme #6 (0.47205 A·m
−2) and scheme #7 (0.47259 A·m
−2) was even less than 0.1%.
The power density was the product of the current density and its corresponding voltage. Additionally, the power density curve composed of a current density and power density was not a monotonically increasing curve, but showed a trend of increasing first and then decreasing. The highest point in this curve corresponded to the maximum power density that could be achieved by the fuel cell (in
Figure 12, yellow columns show the maximum power density of schemes #1 to #7). As can be seen from
Figure 11, the change of polygonal structures improved the power density at the intermediate and high current densities. However, this did not mean that the power density could continue to increase substantially. The amplitude of the increase in power density due to the change of polygonal structures was the same as the variation trend revealed in voltage, showing an obvious decline. Take scheme #6 and scheme #7 for example, the growth gap of the power density between the two was very small, which could also be reflected in their maximum power density, and the difference between them was even less than 0.25% (scheme #6: 0.1721 W·m
−2; scheme #7: 0.1725 W·m
−2). The test results of the other three groups (schemes #8–#14, #15–#21, #22–#28) also showed similar characteristics. In a word, changing the shape of polygonal structures (by increasing the number of polygonal sides) can improve the output voltage and power density of the fuel cell, but the number of polygonal sides should not be blindly increased. The scheme with more polygonal sides could not achieve better results instead.
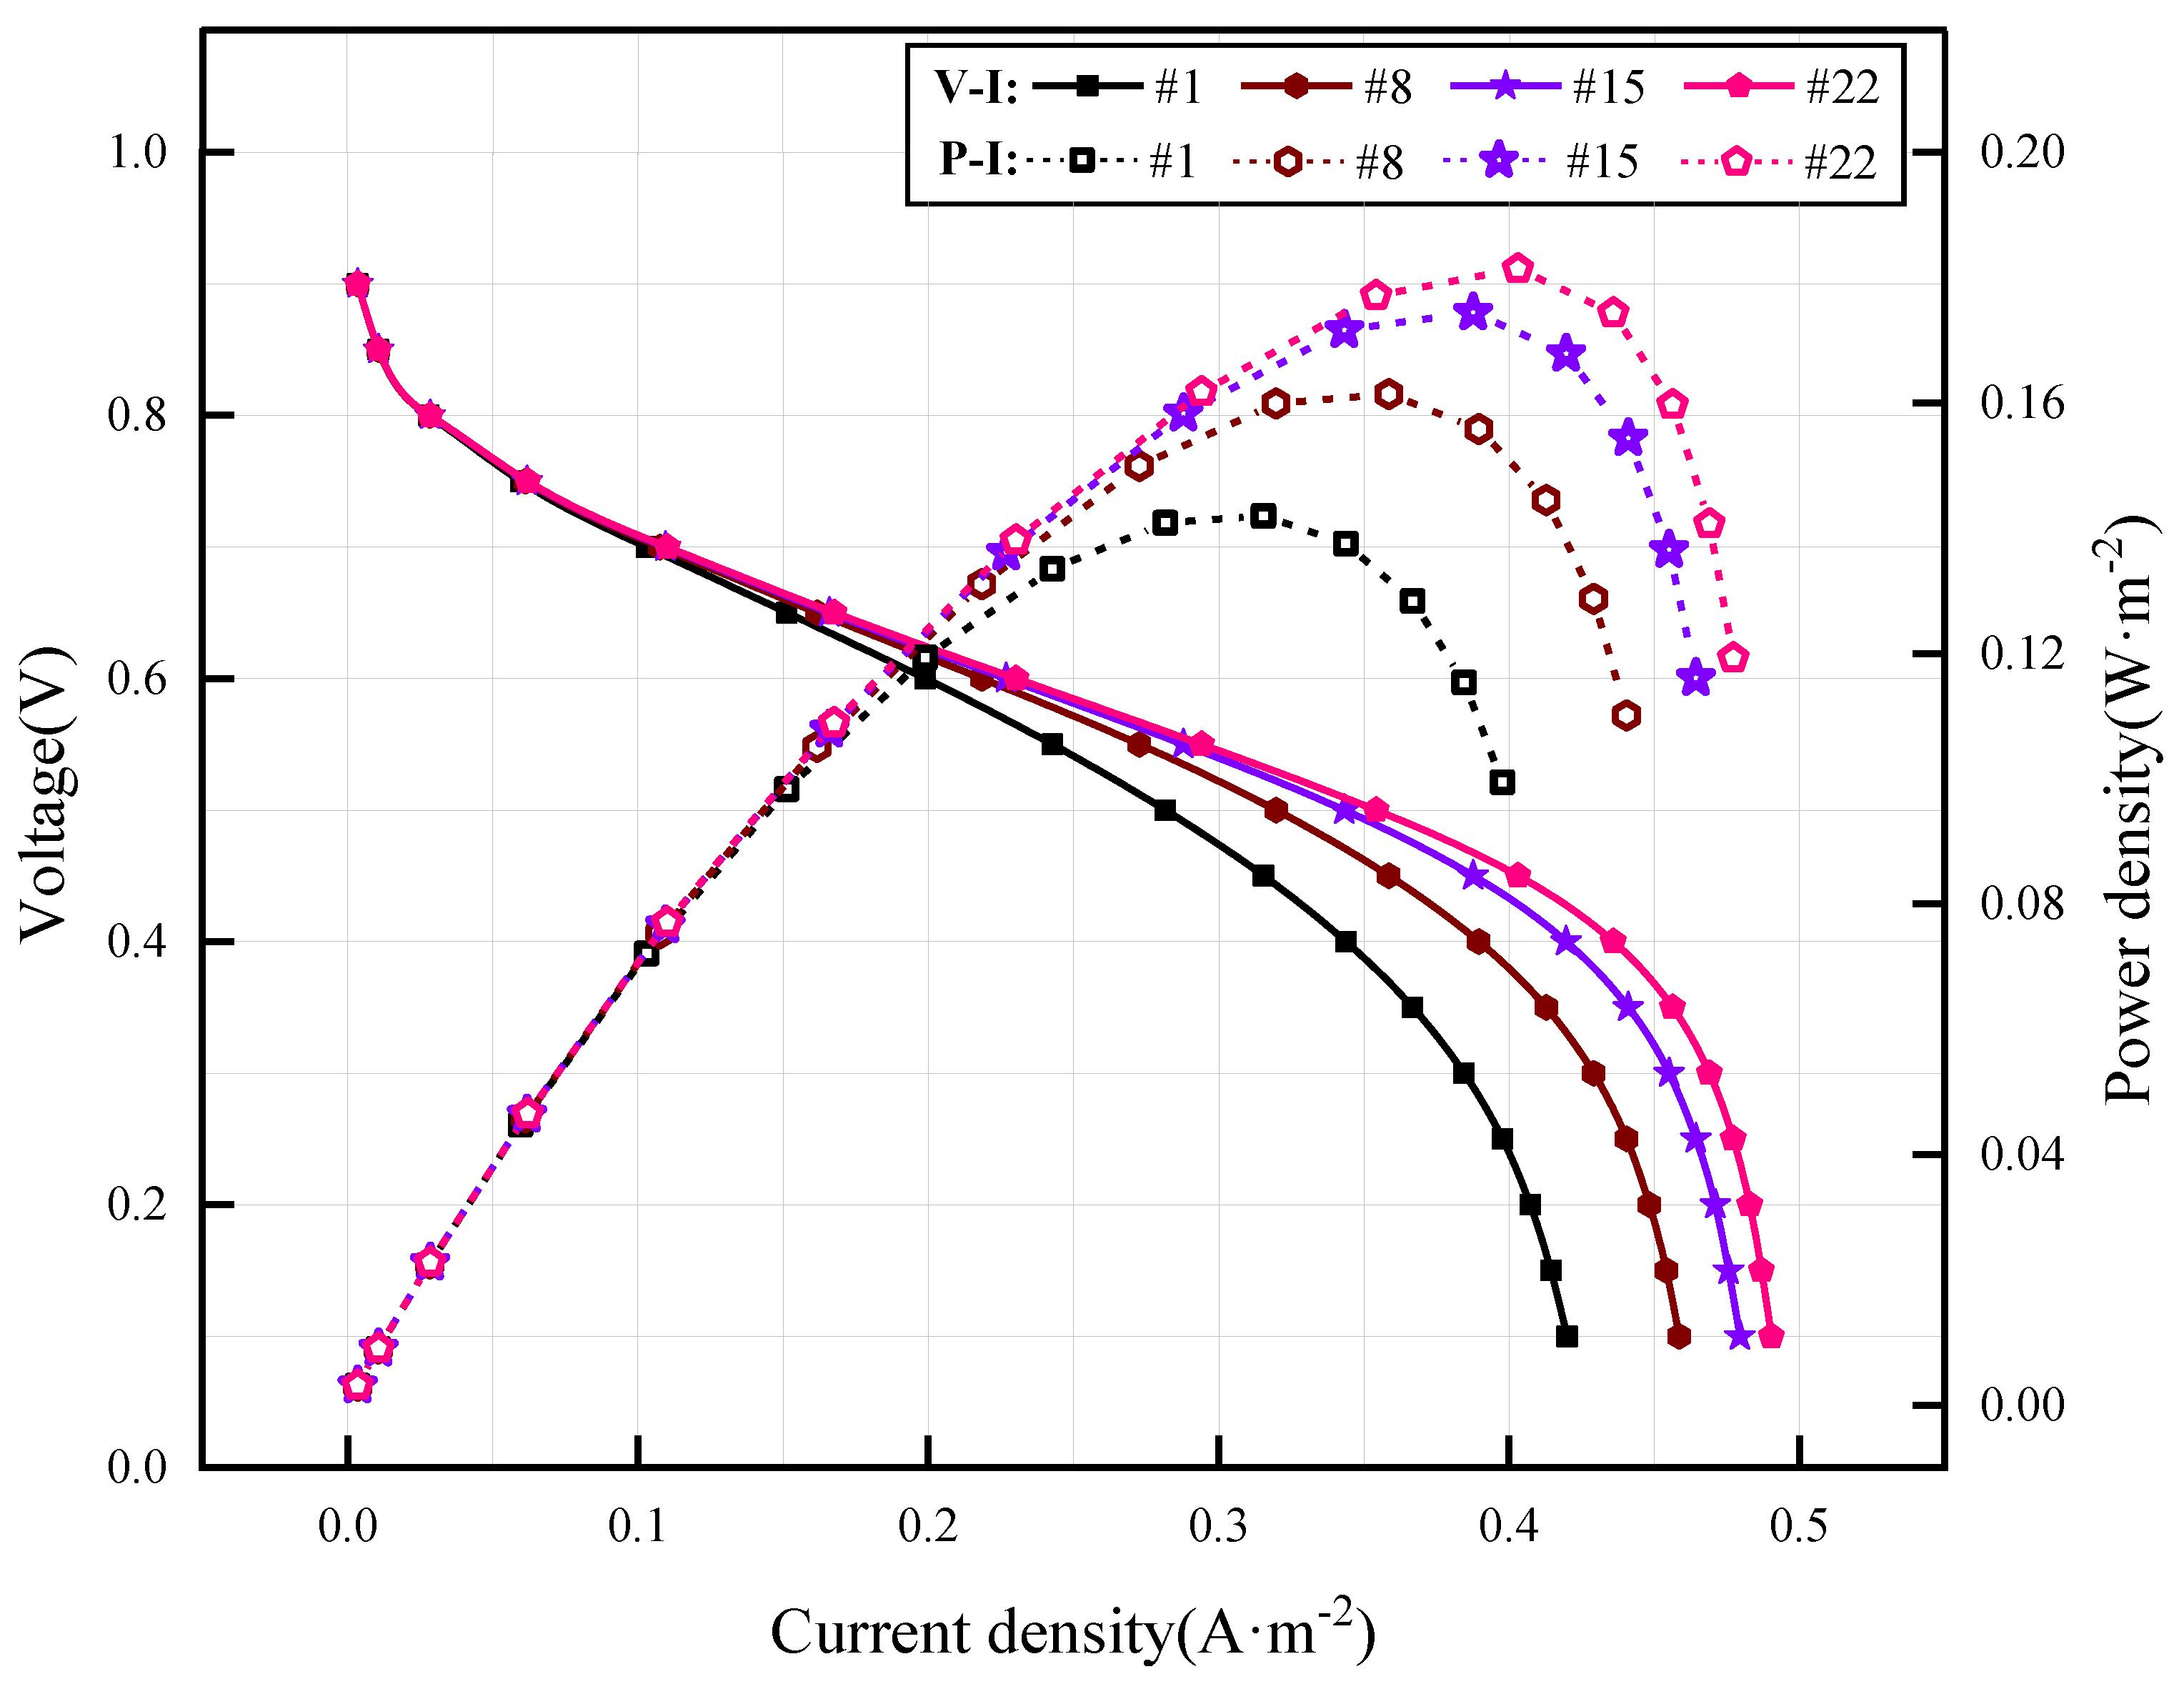
Figure 13 shows the polarization curves and power density curves among schemes #1, #8, #15 and #22. These four schemes had a different number of layers of spiral flow channels.
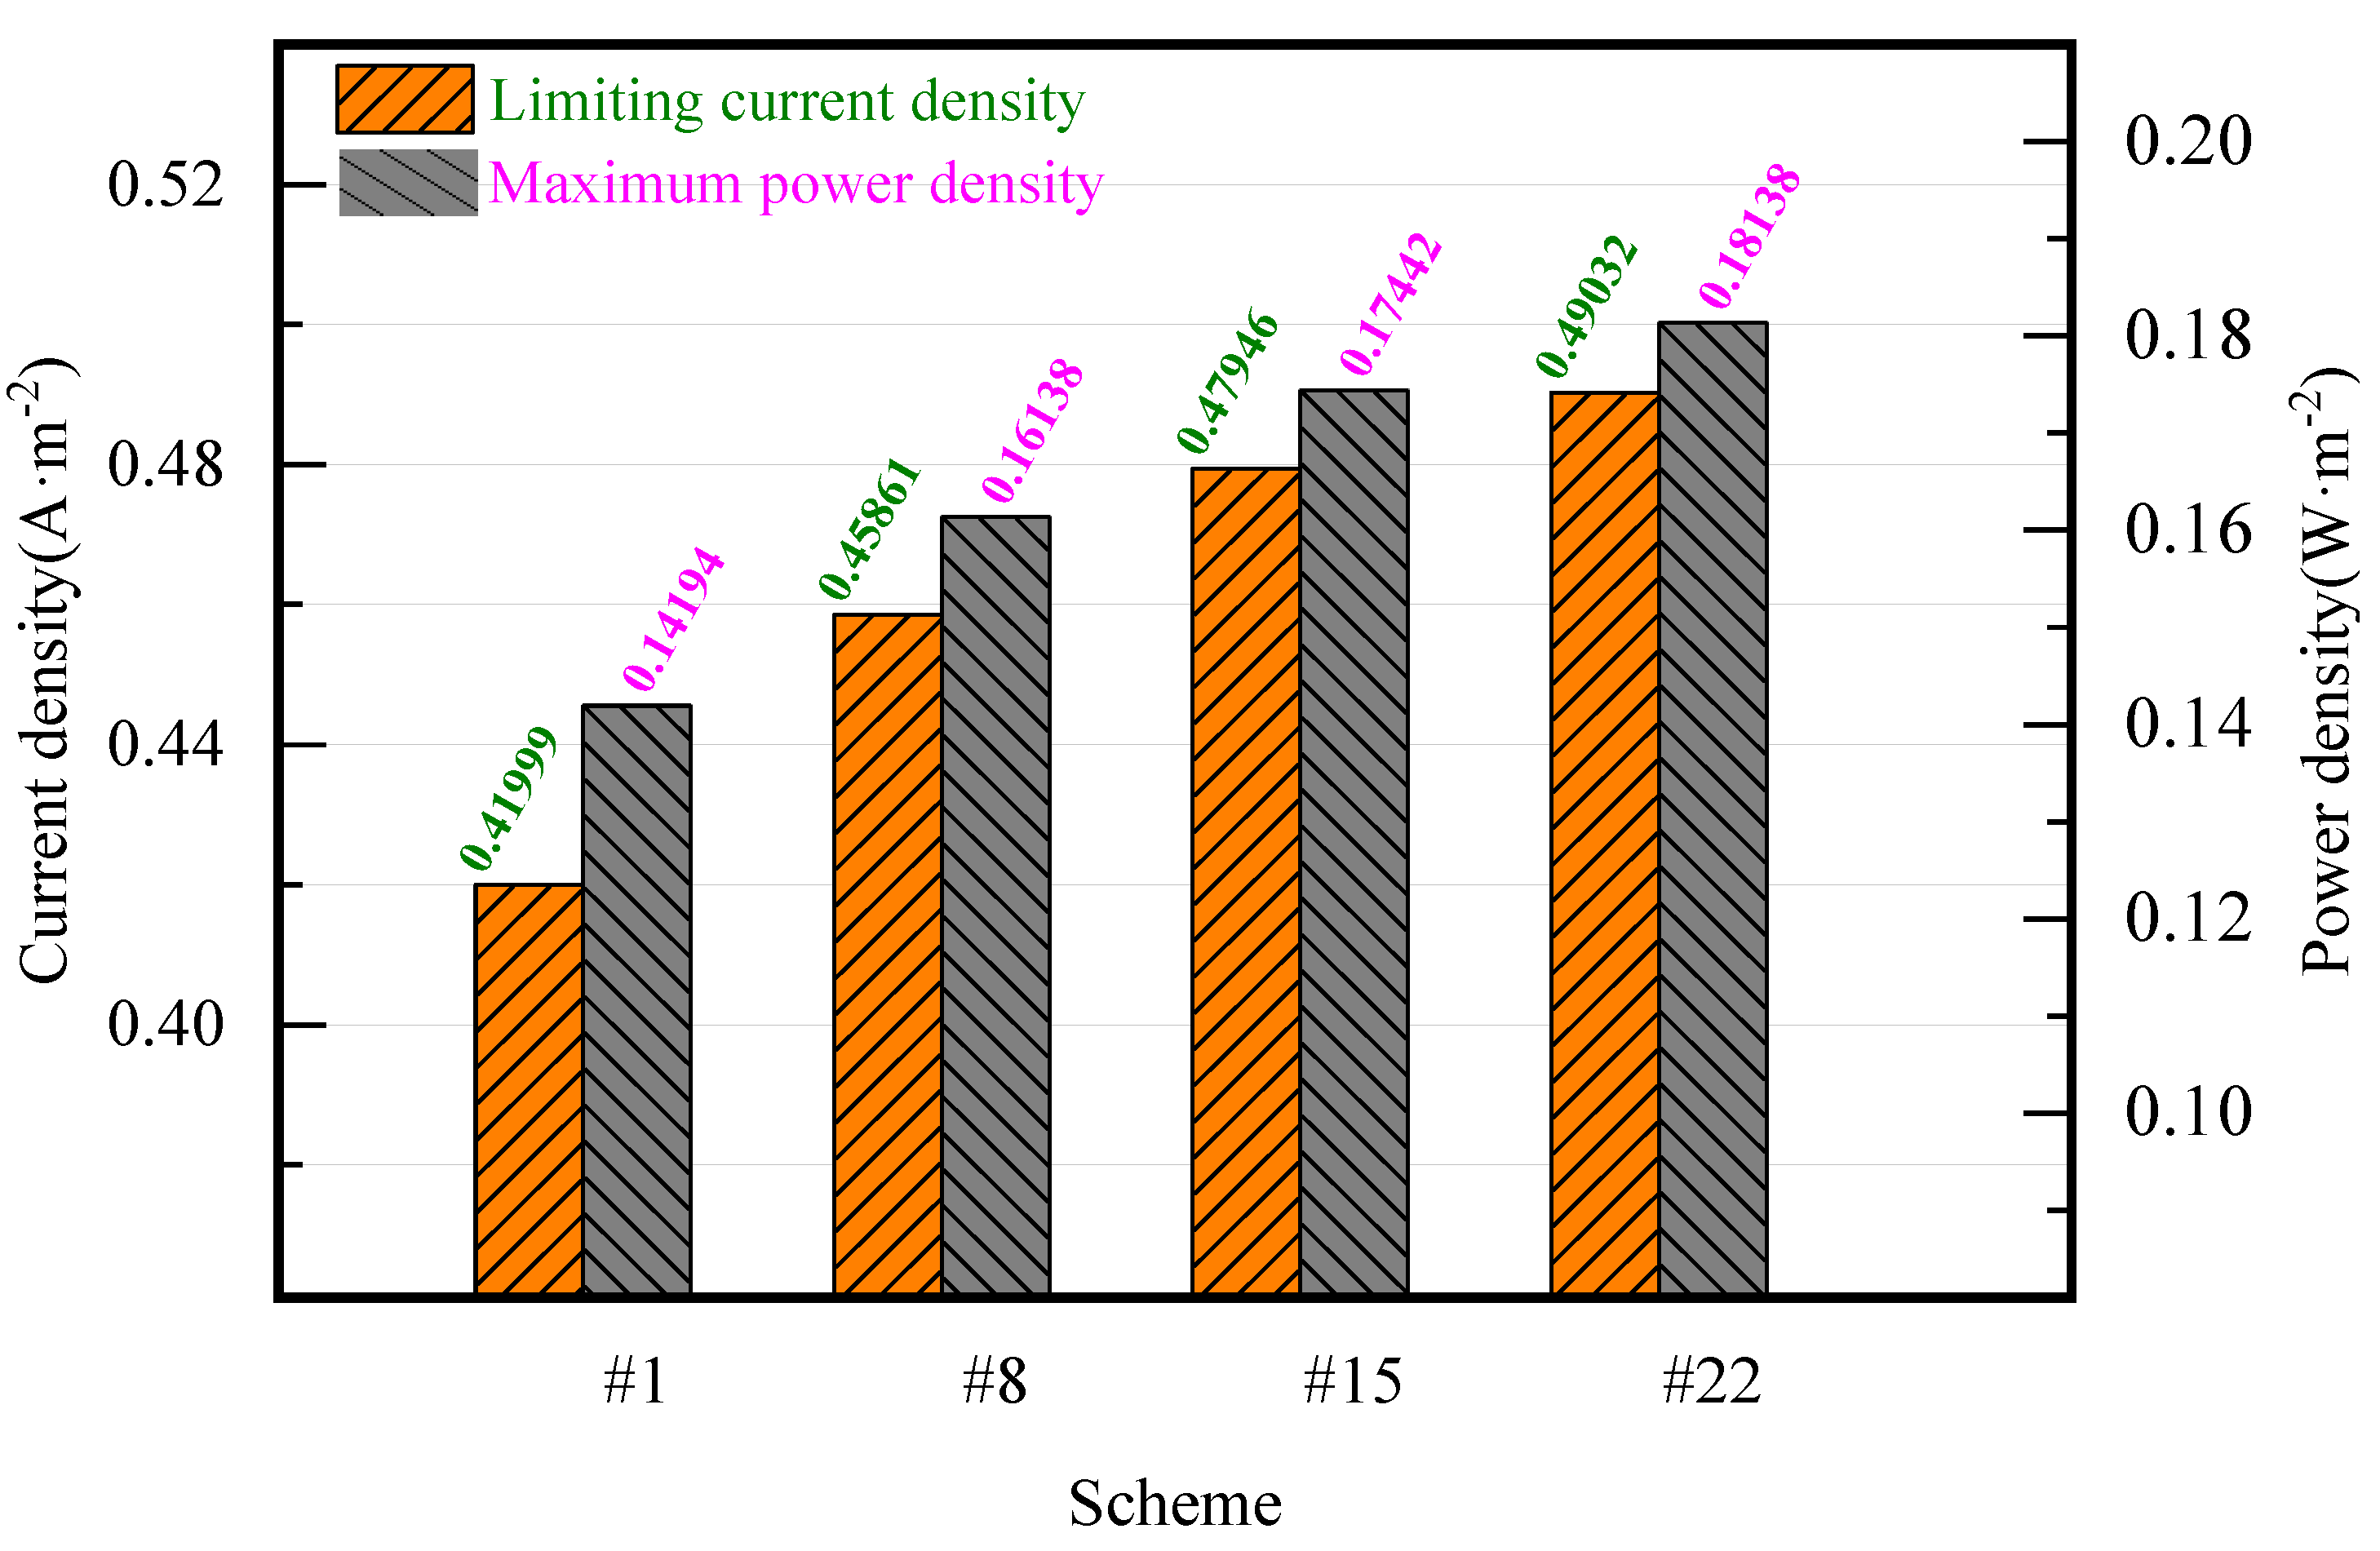
The influence of the number of layers on each scheme was also mainly reflected at the intermediate and high current densities. In these areas, the voltage increased accordingly with the growing number of layers. This is due to that the increase in the number of layers also effectively increasing the total area of the flow channels, which in turn promoted the full diffusion of the reactant gas into the MEA to participate in the electrochemical reaction; finally, resulting in an increase in the voltage of the fuel cell. Similar to the impact of changing the flow field structure on the fuel cell performance, the growth gap of voltages between four schemes became smaller with the continuous increase in layers. However, the difference between two key variables was that the gap of adjacent schemes with different layers could not be ignored. In the aspect of power density, increasing the number of layers has a positive effect on the improvement of the power density in the region with the intermediate and high current densities. Similarly, the magnitude of this growth was gradually diminishing. The comparison of the limiting current density and the maximum power density of four schemes in
Figure 14 also conformed to the above variation characteristics. In a word, increasing the number of layers, such as increasing the number of polygonal sides, can change the interaction between the flow channel and the rib by increasing the area of flow channels, which in turn promoted the fuel cell to produce a greater voltage and power. In addition, increasing the number of layers also faced a gradual decrease in the growth rate. However, the difference between two key factors was that increasing the number of layers corresponded to a longer duration of the effective increase in the output voltage and power density of the fuel cell, and the floating range was higher when the interaction between the flow channel and the rib reached stability.
It is worth mentioning that, in addition to schemes #1 to #28, we continued to build and simulate the models with more polygonal sides and layers. The results showed the voltage and power density generated by these structures were not as good as the original schemes. Therefore, we believe that increasing the number of polygonal sides and layers should be moderate, and an excessive increase is counterproductive.
3.4. Pressure Drop Performance
Pressure drop is another important indicator to measure the design of the flow field. An excessive pressure drop would increase the pumping power needed to transport the reaction gas in the flow channels. Accordingly, the energy loss of PEMFC increased, leading to the decline of its performance.
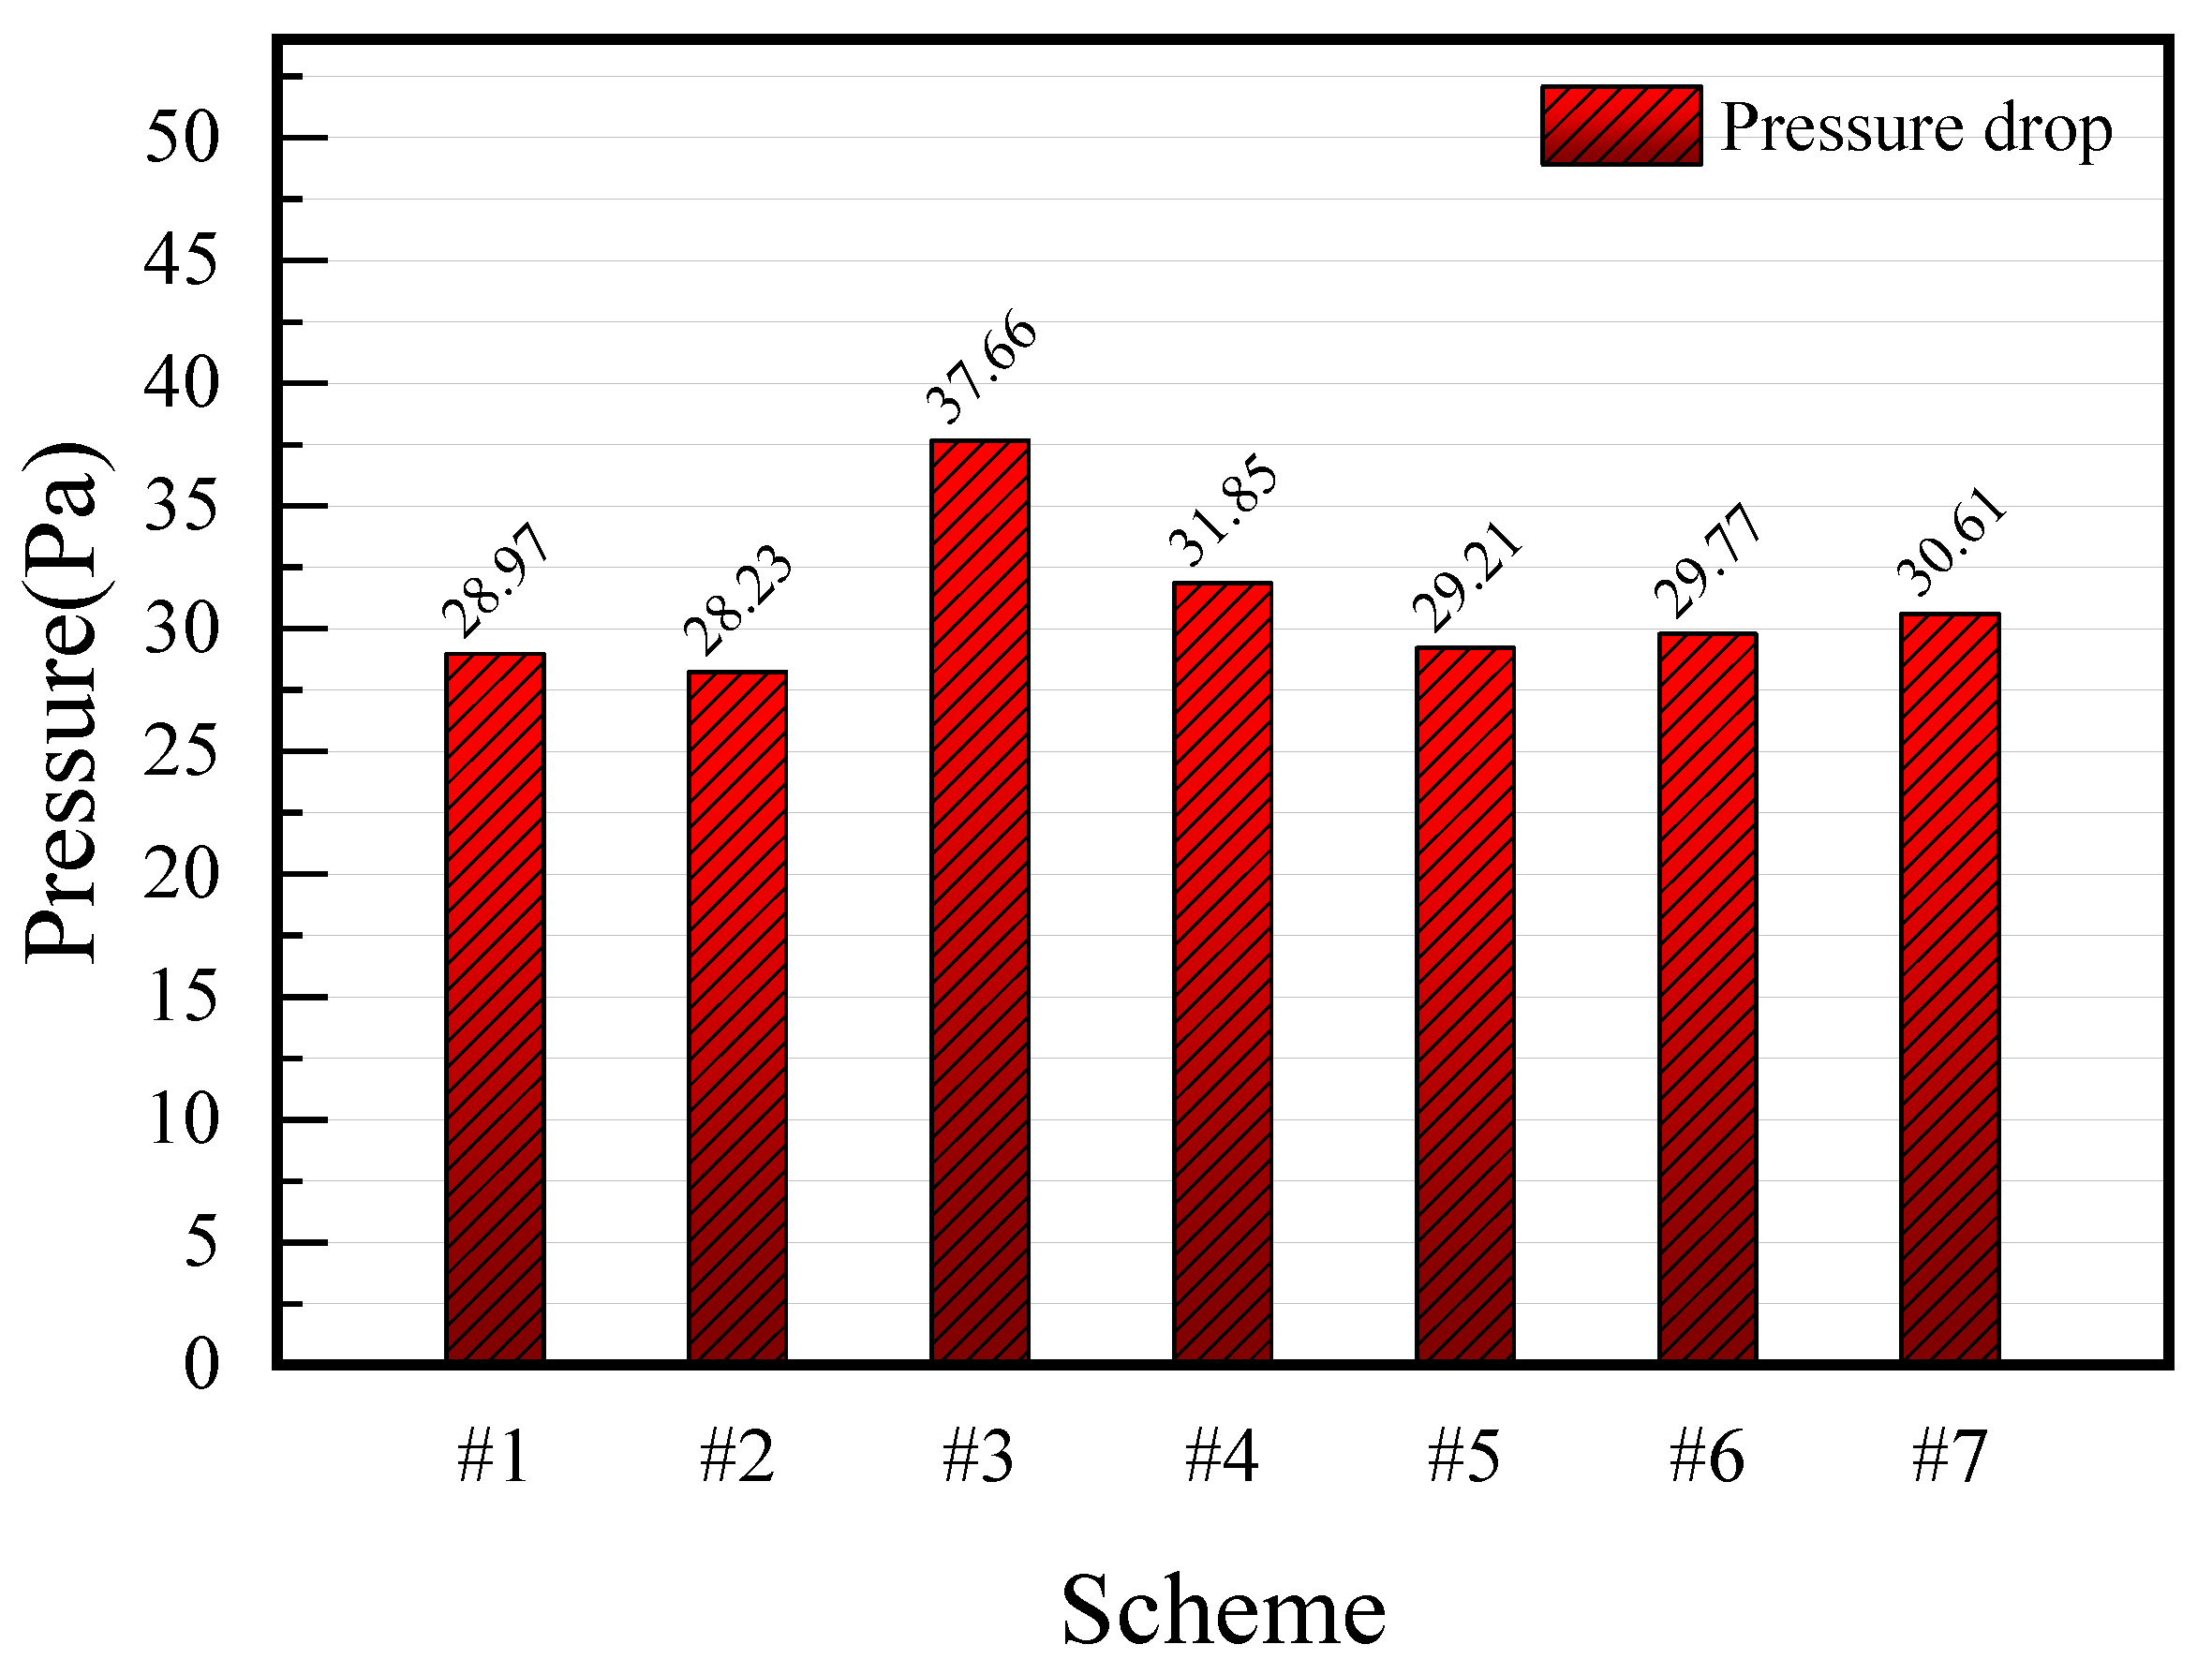
Figure 15 shows the comparison of the pressure drop in the cathode flow field from schemes #1 to #7.
It can be seen that changing the polygonal structure did not reduce the pressure drop. With the increase in the number of polygonal sides, the pressure drop of the corresponding scheme, consequently, increased instead. Even in scheme #3, there was an increase of 10 Pa higher than the lowest scheme. Except for scheme #3, by contrast, the difference of pressure drop between the other six schemes was small, so it could be considered that their effects on the pressure drop in the cathode flow field were similar.
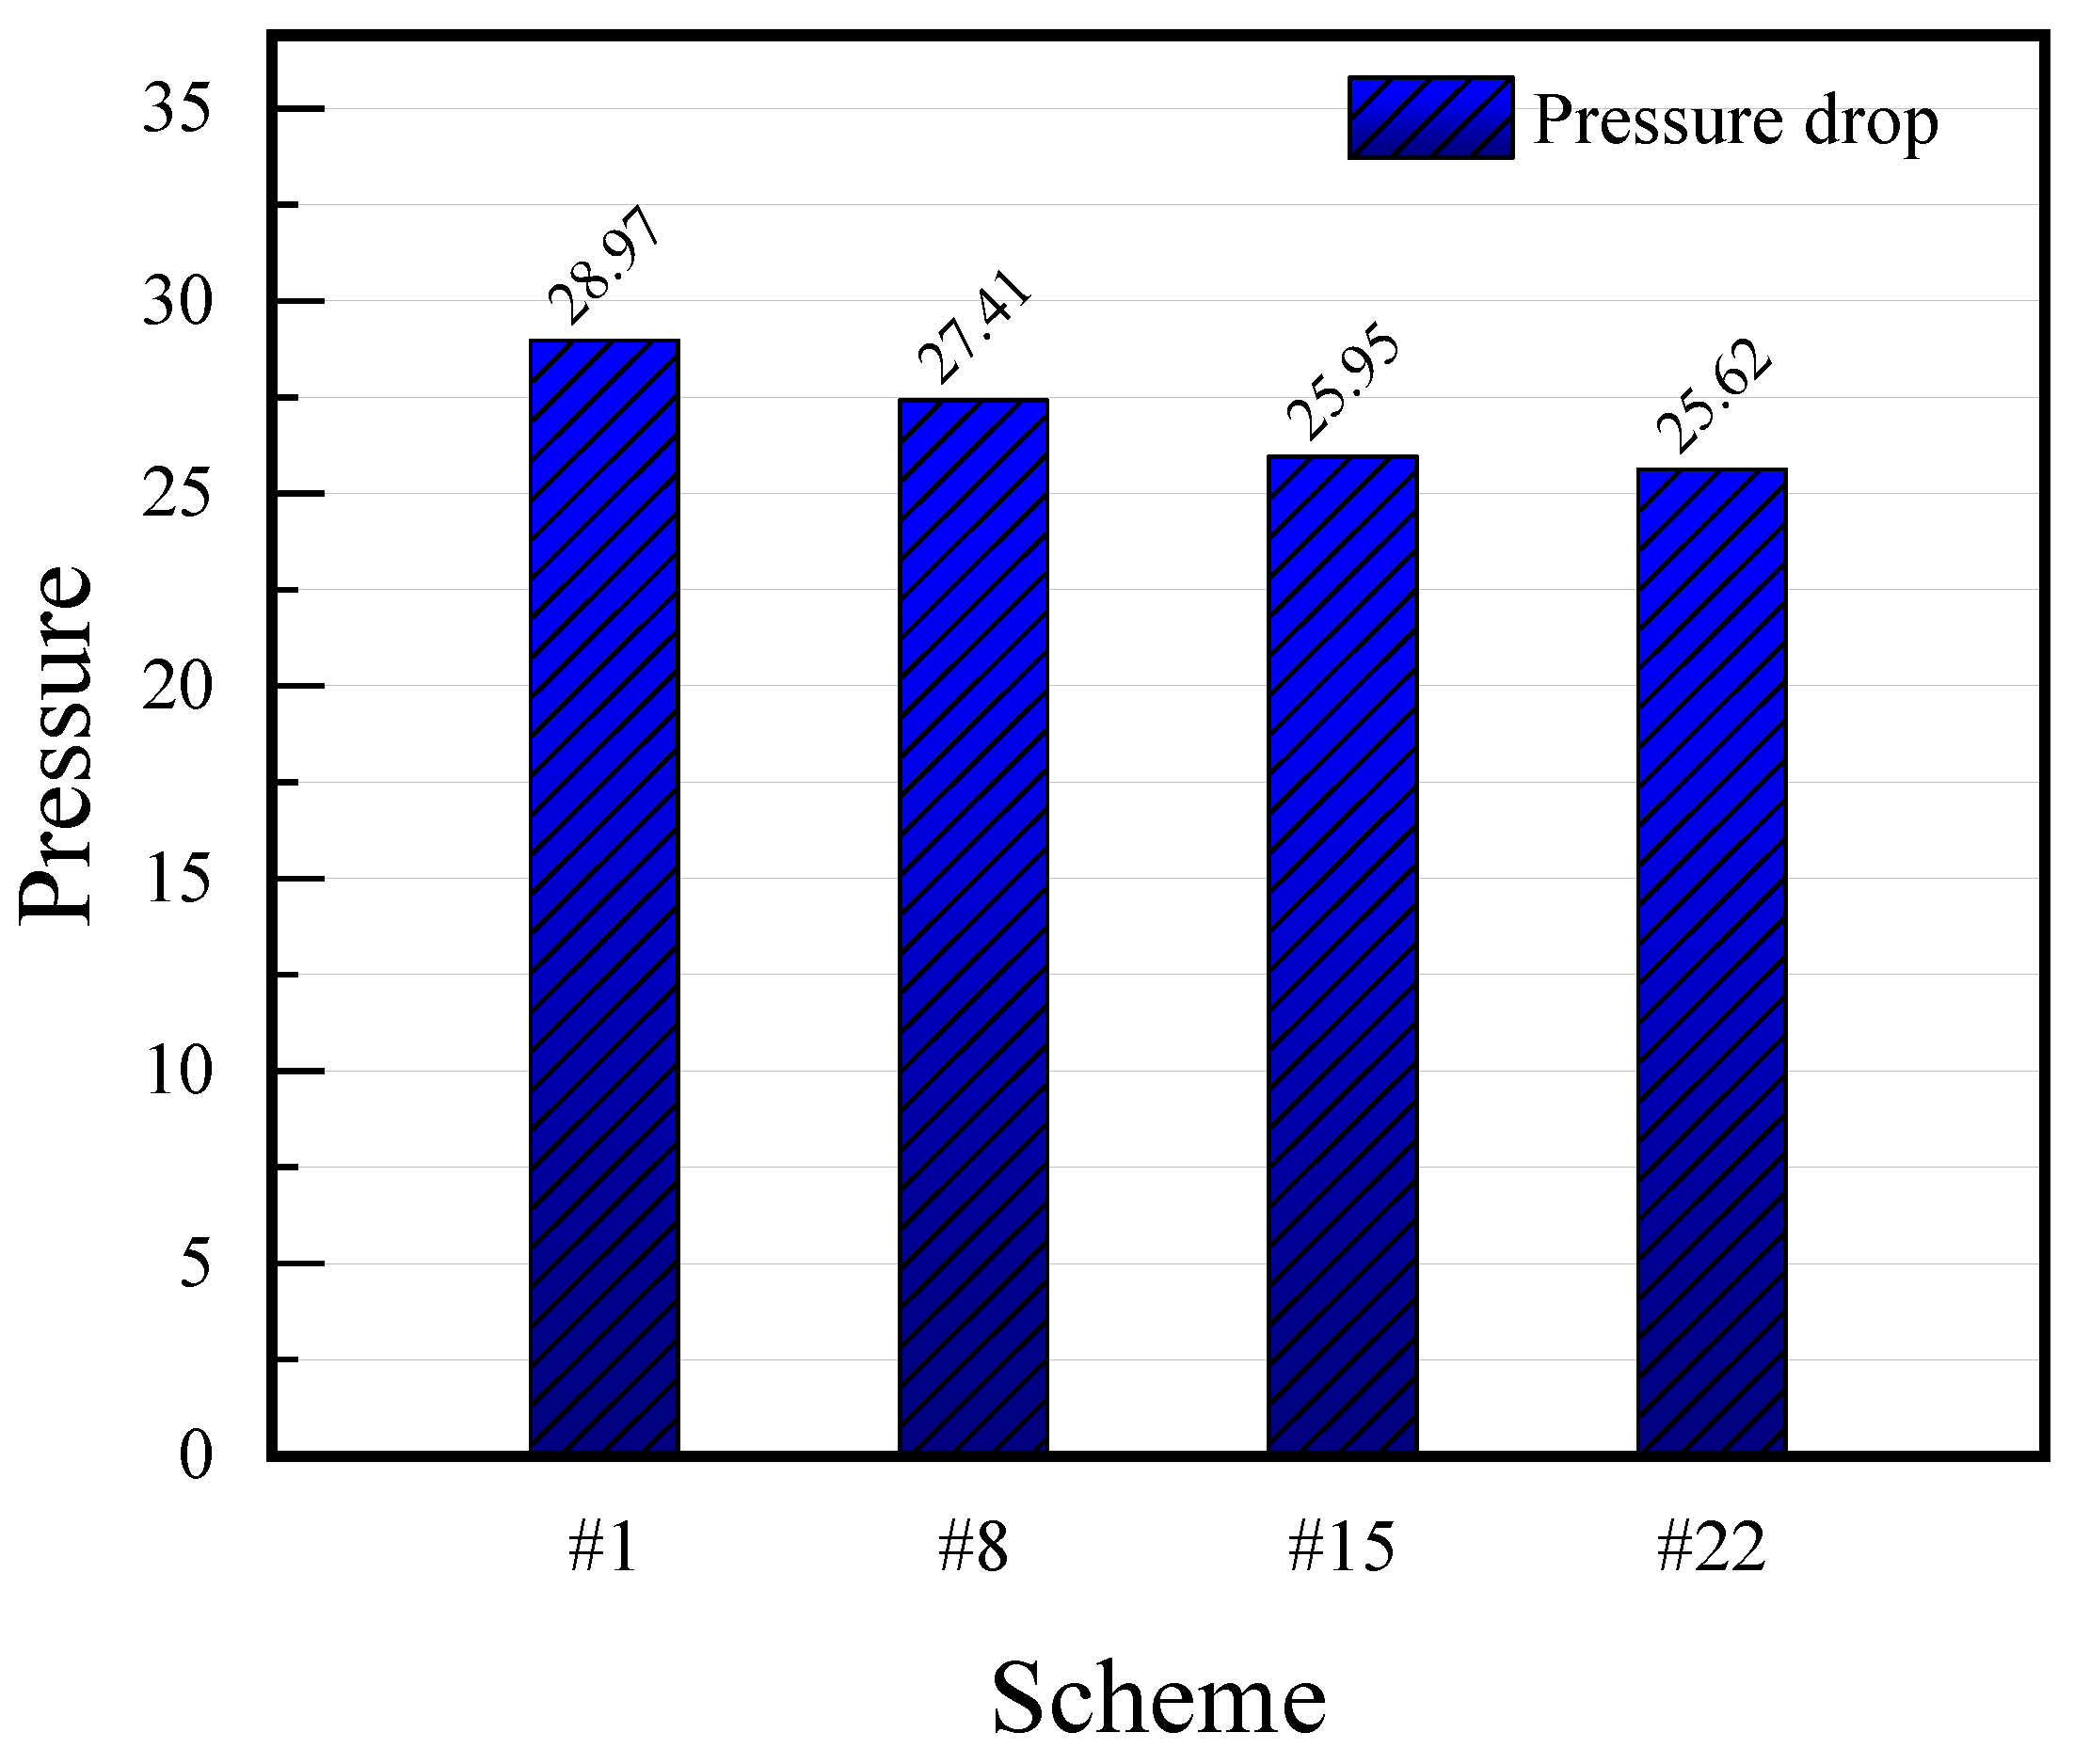
Figure 16 shows the effect of increasing the number of layers on the pressure drop in the flow field. In contrast, the pressure drop in the flow field gradually decreased with the increase in the number of layers, so the pumping power needed to transport the reaction gas decreased, which led to the reduction in the energy loss and the improvement of the output performance of the cathode flow field in PEMFC.
Results of other control groups showed similar trends. Therefore, it can be considered that changing the shape of the flow field structure cannot reduce the pressure drop. On the contrary, in most schemes, the pressure drop increased slightly. By contrast, increasing the number of layers can effectively reduce the pressure drop, thereby improving the performance of the cathode flow field in PEMFC.
3.5. Comparison with the Traditional Flow Field Structure
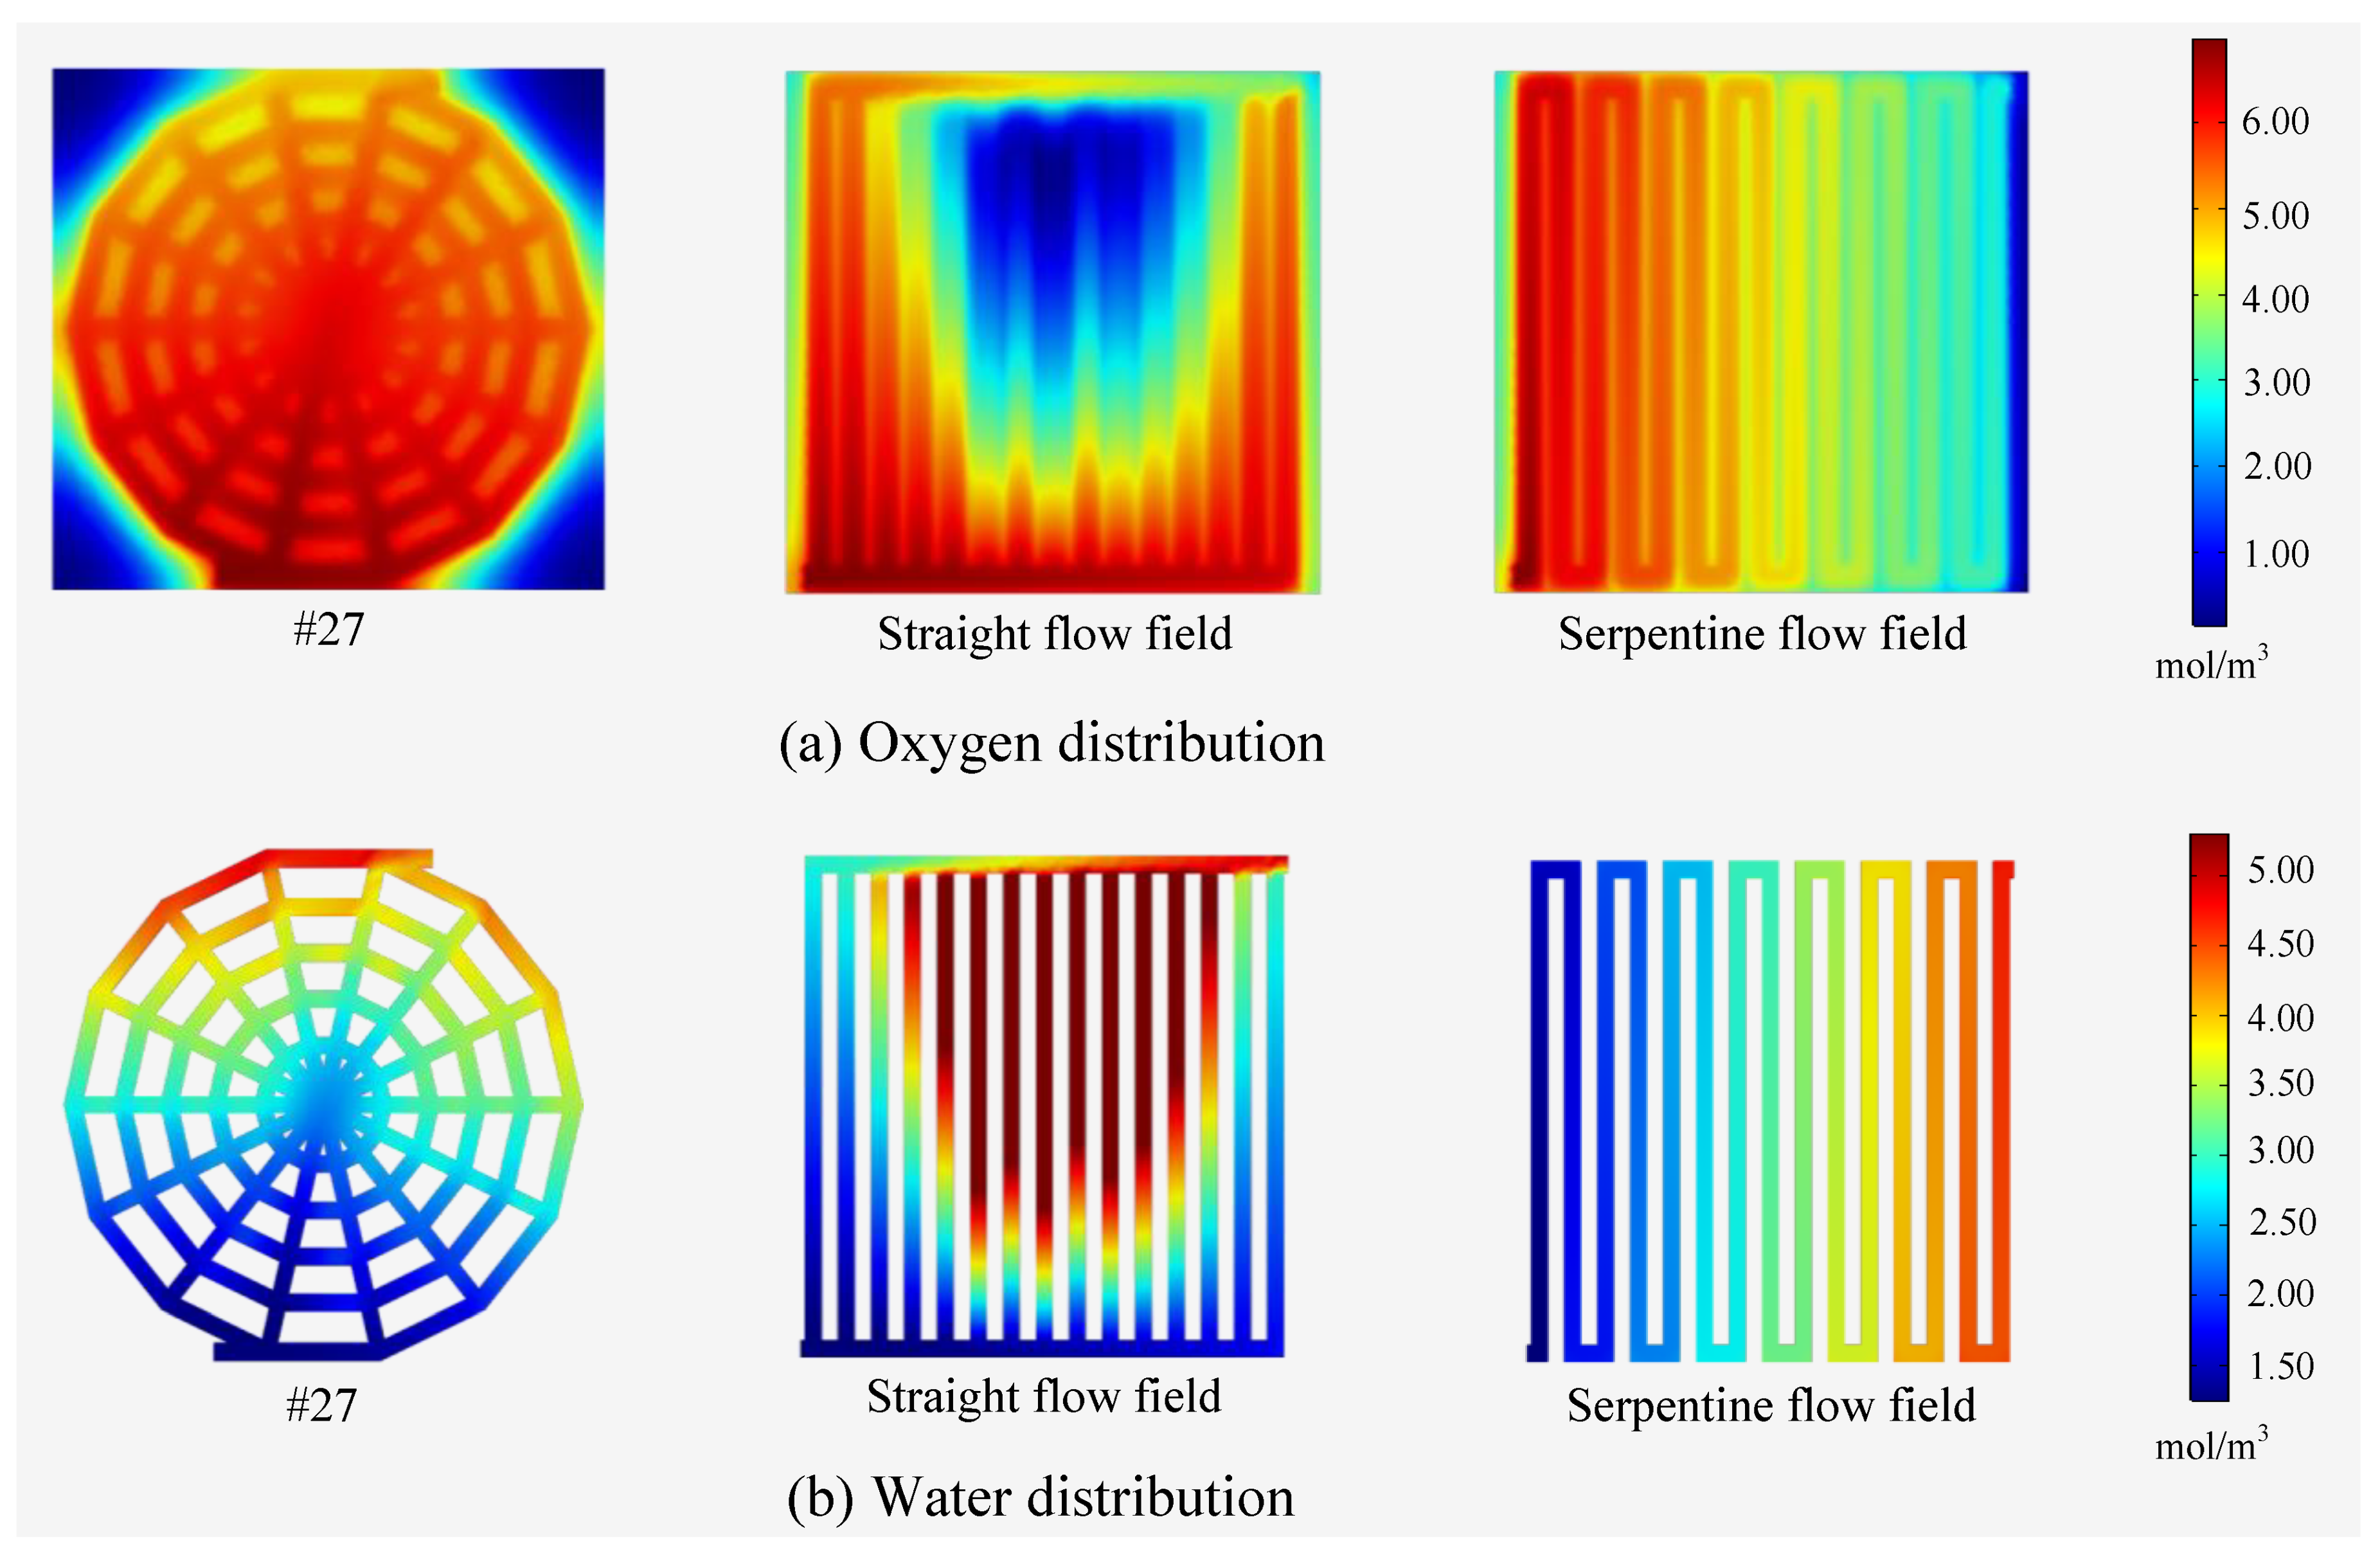
After a comprehensive consideration, scheme #27 was selected to compare with the straight flow field and the serpentine flow field under the same working area. It can be seen from
Figure 17a that the oxygen distribution of scheme #27 was more uniform than that of the other two structures. The oxygen concentration in the middle part of the straight flow field decreased obviously, while in the serpentine flow field it reduced severely from the inlet to the outlet. The same phenomenon also appeared in the water removal performance (
Figure 17b). Although scheme #27 was not the best in all spider-web-type flow fields, its water removal performance was relatively better than the other two traditional structures. There was an obvious accumulation of water in the middle and latter part of the straight flow field. The same phenomenon also appeared in the flow channel near the outlet of the serpentine flow field. In contrast, the area with a high water concentration in scheme #27 was much smaller.
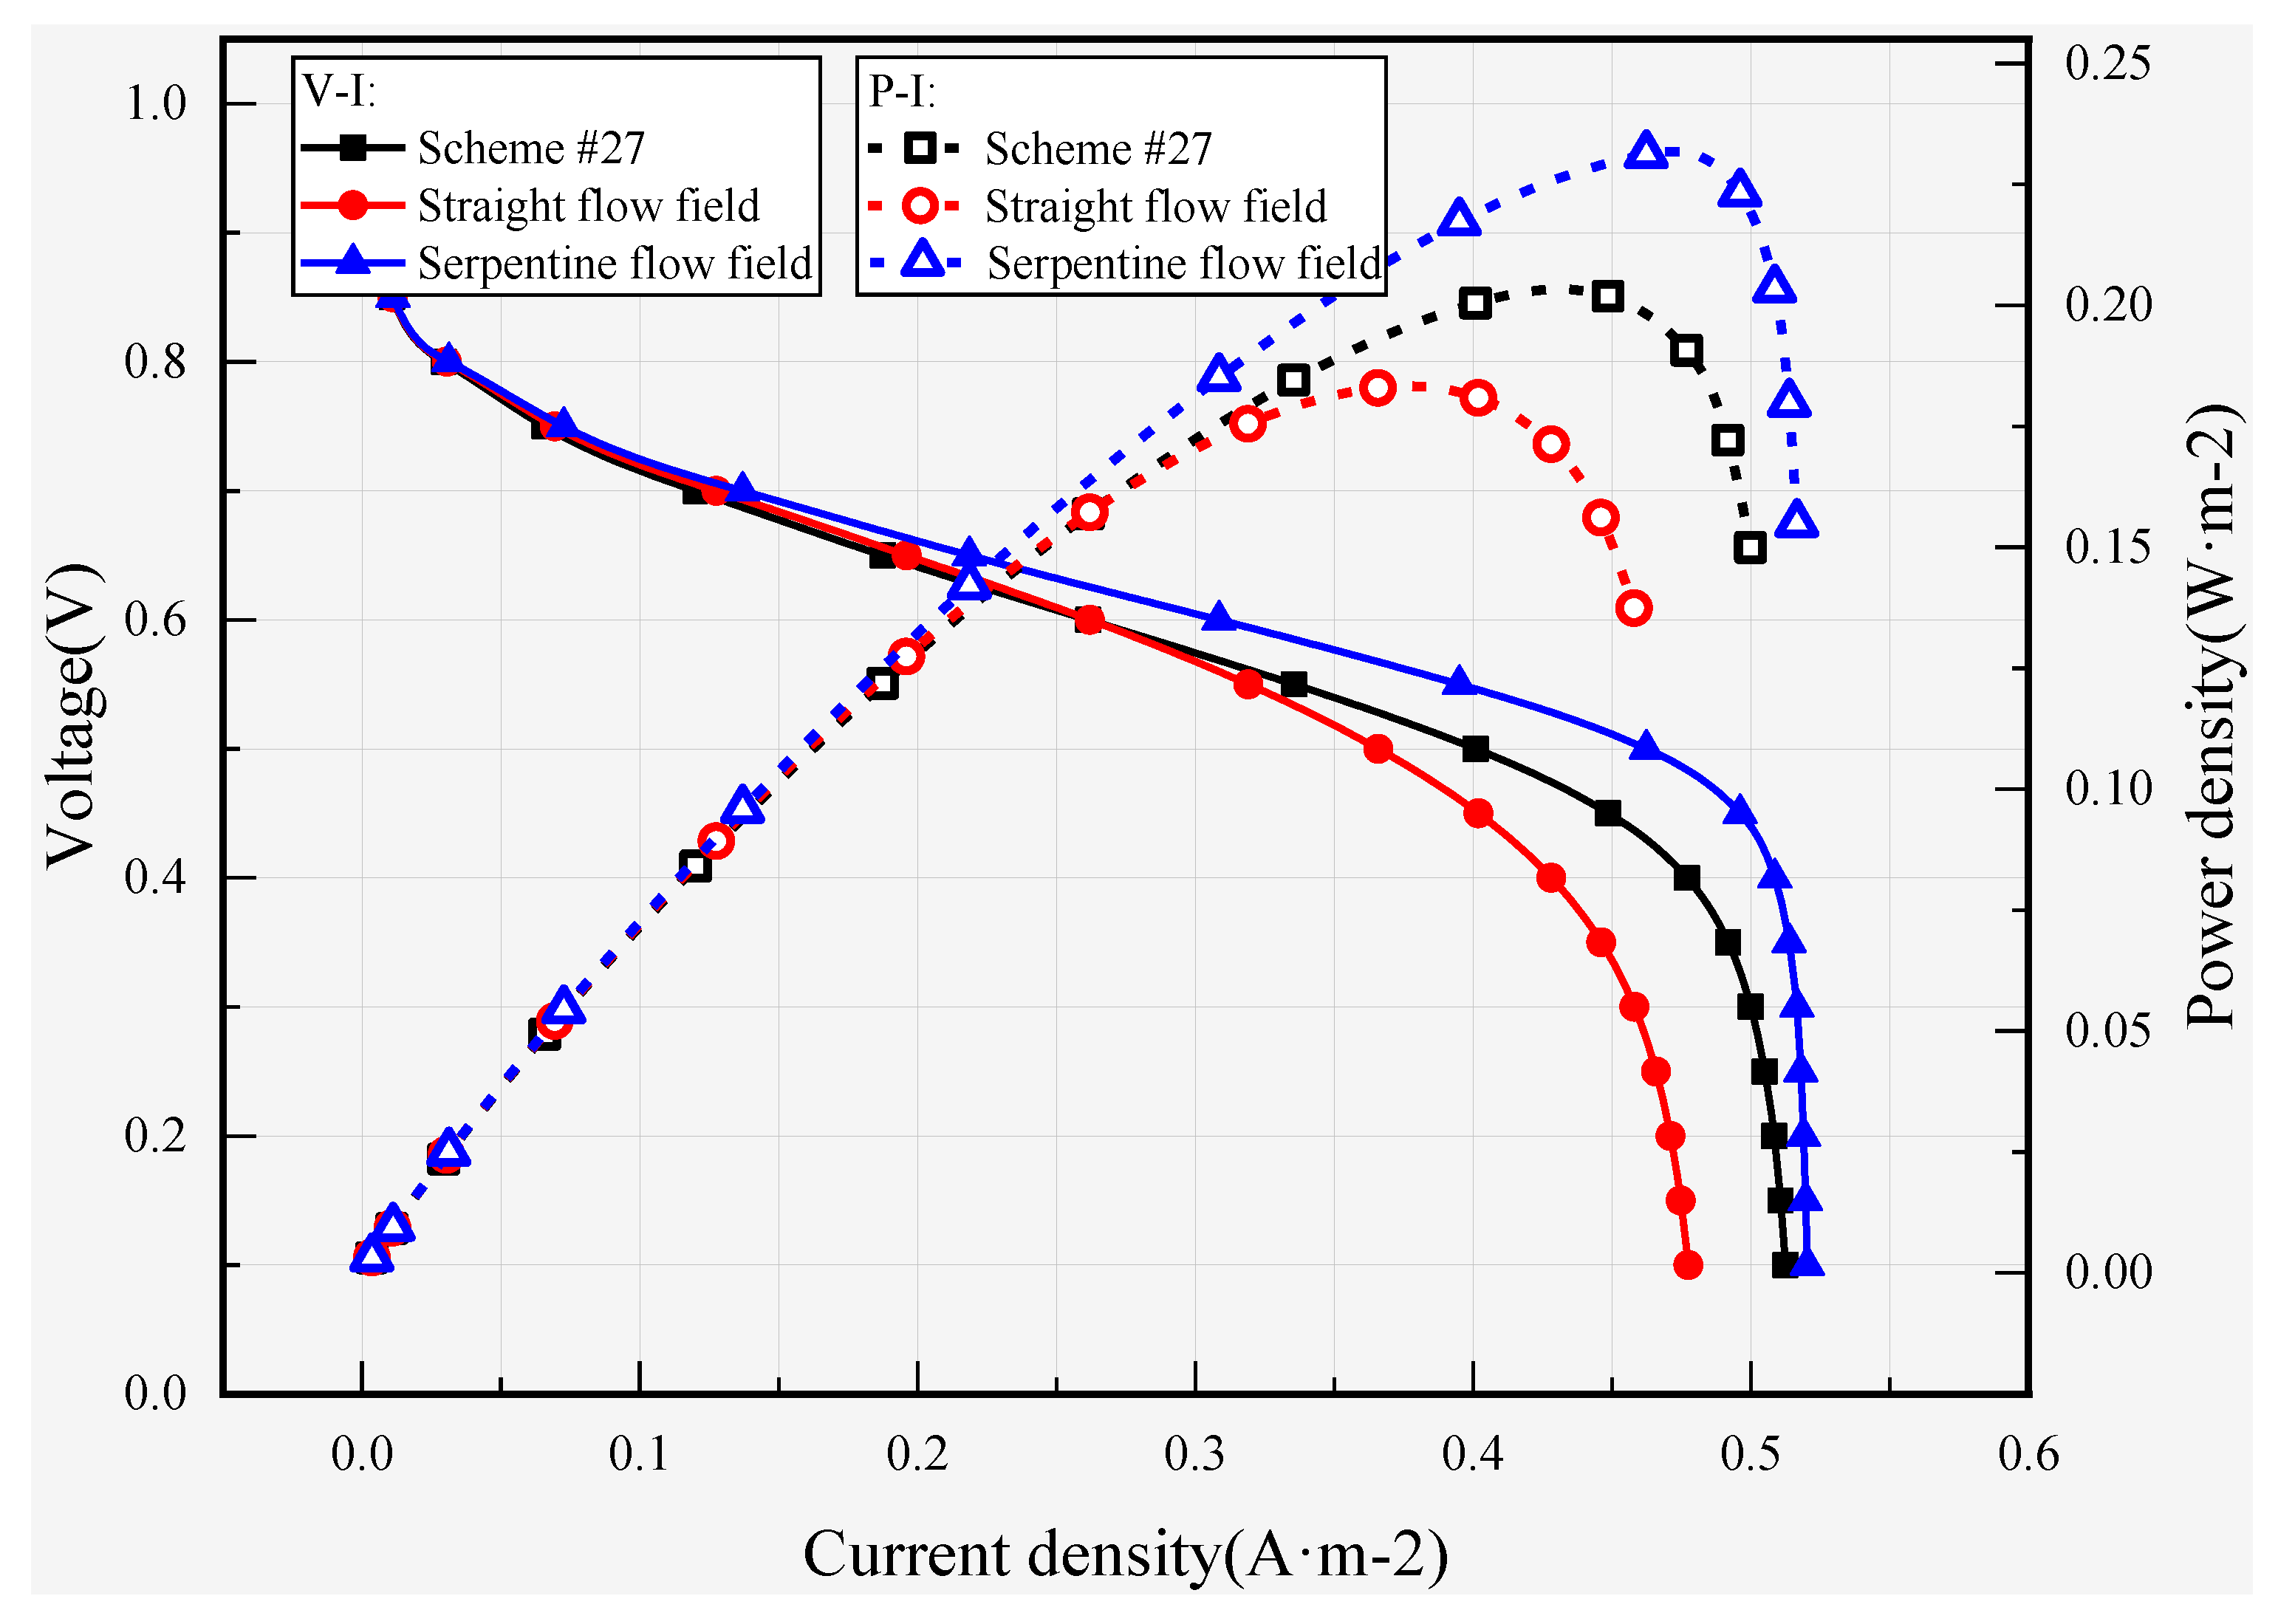
Figure 18 shows the polarization curves and power density curves of these three schemes. It can be seen from the figure that scheme #27 was able to a produce higher voltage compared to the straight flow field under the same current densities. In addition, the limiting current density (0.512 A·m
−2) and the maximum power density (0.202 W·m
−2) of scheme #27 were also significantly higher than the straight flow field (0.477 A·m
−2/0.183 W·m
−2). The serpentine flow field produced a higher voltage than scheme #27 at the same current densities, and a higher limiting current density (0.52 A·m
−2) and maximum power density (0.23 W·m
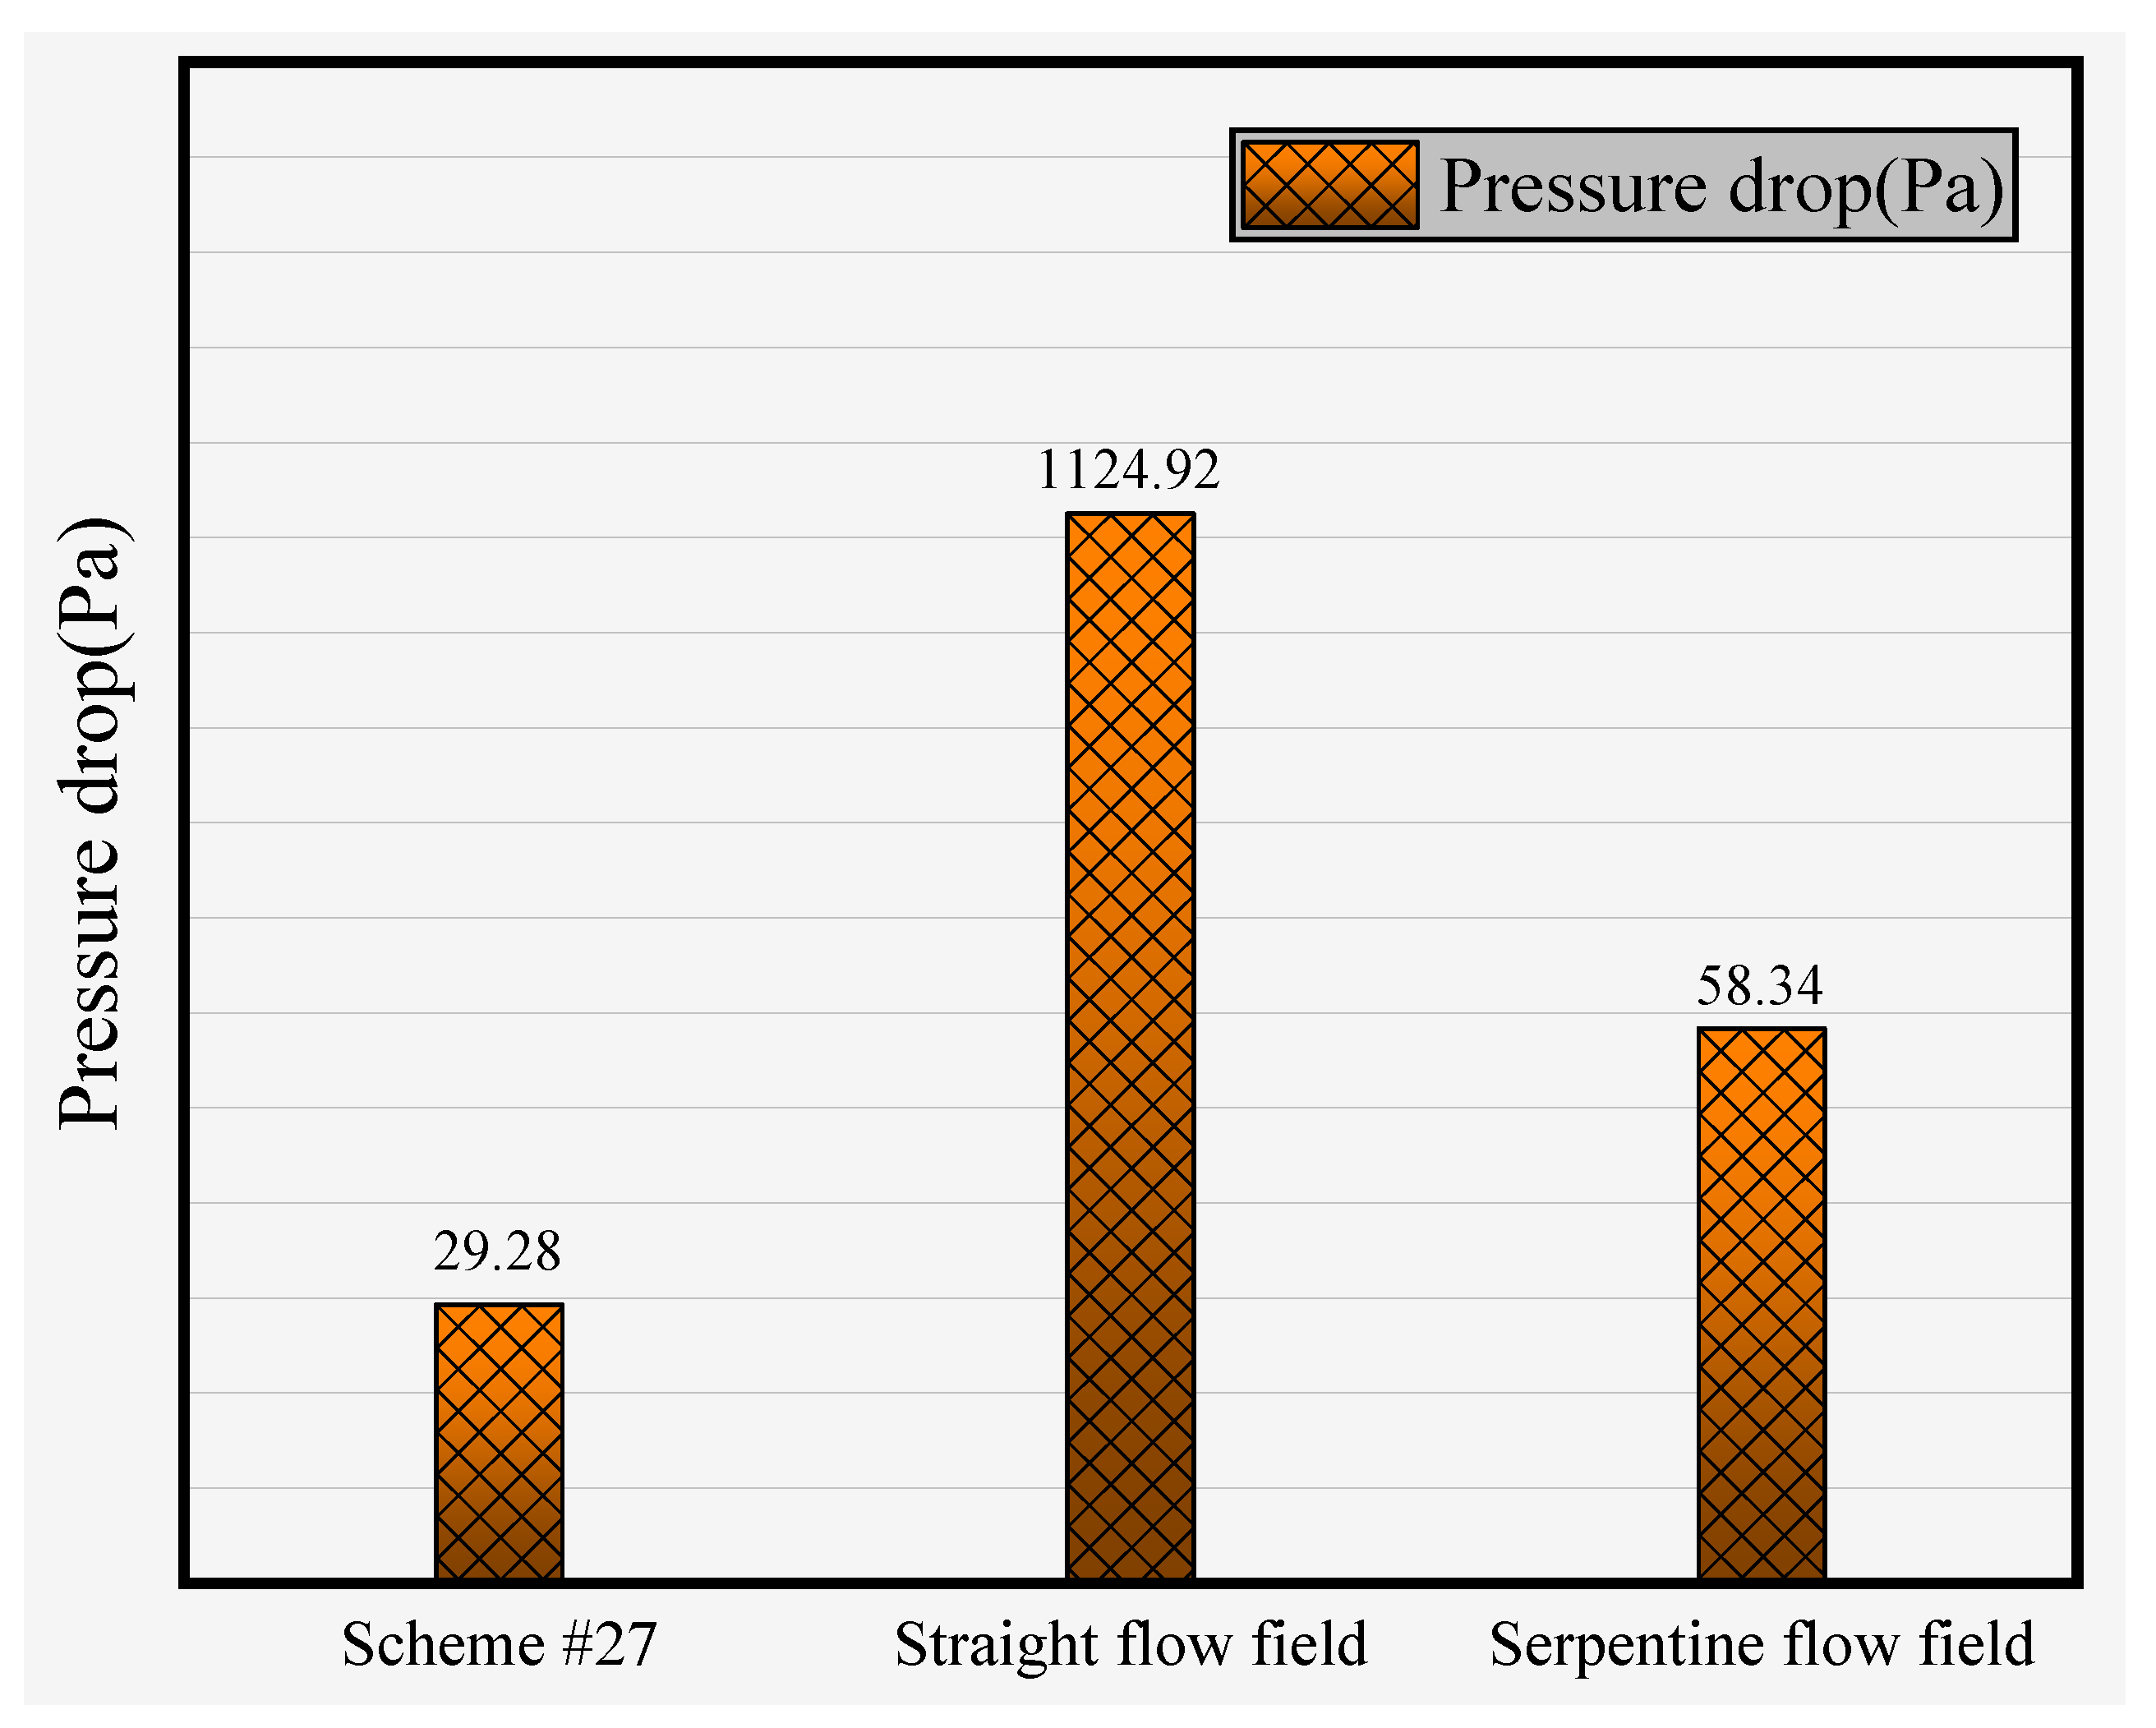
−2). However, the pressure drop in the cathode flow channels of the serpentine flow field was too high. By contrast, the pressure drop in the cathode flow channels of scheme #27 was much smaller, even lower than that of the straight flow field, as shown in
Figure 19.
From the comparison in this section, it can be concluded that the optimized scheme selected for the spider-web-type flow field was superior to the straight flow field in terms of oxygen distribution, water removal, pressure drop and fuel cell output performance at the cathode. Although the voltage and power densities generated by scheme #27 at the intermediate and high current densities were not as great as those of the serpentine flow field, the excessive pressure drop in the flow channels of the serpentine flow field hindered its further development. In contrast, the pressure drop of the spider-web-type flow field was much smaller. In addition, the performance of such a flow field in oxygen distribution and water removal was better than that of the serpentine flow field. In summary, this structure was of reference value for improving the performance of the cathode flow field in PEMFC.
4. Conclusions
The products generated by the electrochemical reaction in the PEM fuel cell (PEMFC) were mainly concentrated in the flow field on the cathode side of the bipolar plate, and the oxygen introduced on the cathode had higher requirements to improve its diffusion performance by using the flow field structure. For this reason, the optimization of the cathode flow field of the PEMFC was essential. Inspired by the structure of a spider web, this paper proposed a novel bionic spider-web-type flow field, which was composed of two types of flow channels—the spiral flow channels and the connecting flow channels. The spiral flow channels were distributed in multiple layers, and such flow channels of each layer were connected to form the overall shape of the flow field structure while the connecting flow channels were used to connect the spiral flow channels of each layer. Based on this, the change in the polygonal structure of the flow field and the change in the number of layers of spiral flow channels can be considered as the two most critical factors that affect the performance of this type of flow field. In order to explore how these two factors affect the performance of the spider-web-type flow field in the fuel cell, we established complete three-dimensional PEMFC models with different values of the two factors and then simulated through the method of CFD. By observing the simulation results of different schemes in terms of oxygen distribution, water removal performance and cell output performance, the optimal scheme of polygonal structure and the number of layers were determined. After comparing with the straight flow field and the serpentine flow field, the desirability of this optimal scheme in improving the performance of the cathode flow field in PEMFC was proved.
In this kind of cathode flow field, the distribution of oxygen and water presented a good symmetry. In addition, the oxygen concentration in each single flow channel did not significantly decrease along the channel. These two characteristics were difficult to realize in the traditional flow field structure.
As the number of polygonal sides increased, the uniformity of oxygen distribution in the cathode flow field, especially in the area near the outlet, became worse. The reason for this phenomenon was that the oxygen distribution and water distribution in the spider-web-type flow field were mainly influenced by the interaction between the inflection points and the included angles from adjacent spiral flow channels. On the one hand, the increase in the number of polygonal sides led to an increasing number of spiral flow channels, and the number of inflection points between adjacent spiral flow channels grew as a result. The more the number of inflection points, the more frequently the flow direction of gas changed, which would undoubtedly affect the smoothness of the gas flow. However, when the reactant gas flowed to the second half of the flow field, it was continuously consumed due to the participation in the reaction. At this point, the frequent change of gas flow direction caused by the increase in the number of inflection points instead facilitated the gas transport and avoided the problem of stagnation of the remaining reactant gas due to the lack of pressure and the decrease in the flow rate. On the other hand, the included angle between adjacent spiral flow channels gradually increased with the growing number of polygonal sides. The larger the included angle, the smoother the transition between the two adjacent spiral flow channels and the better the stability of the gas flow. Nevertheless, also in the second half of the flow field, the smooth transition was instead detrimental to the gas transport, where the gas also accumulated due to the lack of flow pressure. From the above analysis, it can be seen that in the second half of the flow field, the increase in the number of inflection points favored the flow of the remaining gas, while the larger included angles, on the contrary, caused the accumulation of the gas. Continuously increasing the number of polygonal sides, both influencing factors increased, but the role of the included angle gradually dominated; thus, causing an adverse effect on the oxygen transport and distribution in the cathode flow field.
Different from the adverse effect of changing the structure on the oxygen distribution in the flow field, increasing the number of layers was a reliable way to improve the uniformity of the oxygen distribution in the flow field. This is because the increase in the number of layers reduced the distance between the layers of spiral flow channels, and the convection effect under the ribs was enhanced. In addition, the increase in the number of layers also meant that the length of connecting flow channels was shortened, which was more favorable to gas transmission.
The water accumulated in the cathode flow channels mainly relied on the purge of the remaining reaction gas to discharge the flow field, so the distribution of oxygen in the flow field was highly contrasted with the distribution of water. With the increase in the number of polygonal sides, the area of high water concentration in the latter part of the flow field gradually became larger, and the number of flow channels with a higher water content also increased. This is because in the second half of the flow field, continuously increasing the number of polygonal sides, the role of the included angle gradually dominated, and the remaining oxygen tended to accumulate in the flow channels due to the lack of flow pressure and the reduction in flow velocity. At this time, in these flow channels, the water generated by the reaction and carried here by oxygen also accumulated here because the remaining oxygen could no longer effectively purge them to the outlet. In contrast, in the flow field with a small number of polygonal sides, the difference between the effect of the inflection points and the included angle on oxygen transport was smaller, and the uniformity of oxygen distribution and its concentration in the second half of the flow field was higher, so the water removal capacity of such schemes was better. Similarly, increasing the number of layers also played a positive role in water removal. The uniformity of oxygen distribution was improved with the growing number of layers, and the oxygen concentration in the latter part of the flow field was relatively becoming higher and more beneficial to carrying the water out of the flow field.
The output voltage, current density and power density of the spider-web-type flow field were mainly affected by the joint action of the flow channels and the ribs. In PEMFC, there was an optimal value between the total area of the ribs and the total area of the flow channels (in this paper, altering the polygonal structure or the number of layers changed the ratio of the rib area to flow channel area), which maximized the current conduction of the bipolar plate while ensuring the full diffusion of the reacting gas to the electrodes to participate in the reaction. A comparative analysis of the output voltage, current density and power density of the spider-web-type flow field was performed to achieve this purpose.
In the spider-web-type flow field, as the number of polygonal sides or flow channel layers increased, the total area of the flow channels gradually increased, which meant that the effective contact area between the reactant gas and the MEA also gradually increased, eventually causing the increase in the voltage produced by the fuel cell. However, the growth gap between adjacent schemes was significantly decreasing at the same time, and there was no doubt that the effect of the flow field structure on fuel cell performance was diminishing at this point. In brief, changing the structure can indeed improve the voltage generated by the fuel cell, but the principle of moderation should be followed. Blindly increasing the number of polygonal sides or flow channel layers cannot make the voltage produce a sustained and significant increase. The interaction between the flow channels and the ribs will eventually remain in a floating range and will not grow with the increasing number of polygonal sides or flow channel layers. At this time, the output voltage and power density of the fuel cell gradually become stable. Among the two variables, increasing the number of flow channel layers is relative better for a sustainably improving output voltage and power of the fuel cell, and its floating range is higher when the interaction between the flow channel and the rib reaches stability.
Finally, as far as the influence of the two on the pressure drop is concerned, changing the polygonal structure cannot effectively reduce the pressure drop in the flow field. Instead, there was a slight increase in most of the schemes. By contrast, the increase in the number of layers can reduce the pressure drop of the cathode flow field, thereby reducing the pumping power when carrying the gas in the flow channels and reducing the energy loss of the PEMFC.
After analysis and comparison, the optimal scheme was selected to compare with the structure of the straight flow field and the serpentine flow field. The results showed that the optimized scheme selected for the spider-web-type flow field was superior to the straight flow field in terms of oxygen distribution, water removal, pressure drop and fuel cell output performance at the cathode. Although the voltage and power densities generated by the optimal scheme at the intermediate and high current densities were not as great as those of the serpentine flow field, the excessive pressure drop in the flow channels of the serpentine flow field hindered its further development. In contrast, the pressure drop of the spider-web-type flow field was much smaller. In addition, the performance of such a flow field in oxygen distribution and water removal was better than that of the serpentine flow field. In summary, this structure was of a reference value for improving the performance of the cathode flow field in PEMFC.


