
Numerical Study on the Influence of Well Layout on Electricity Generation Performance of Enhanced Geothermal Systems

Abstract
:1. Introduction
1.1. Background
1.2. Research Objectives
2. Numerical Method
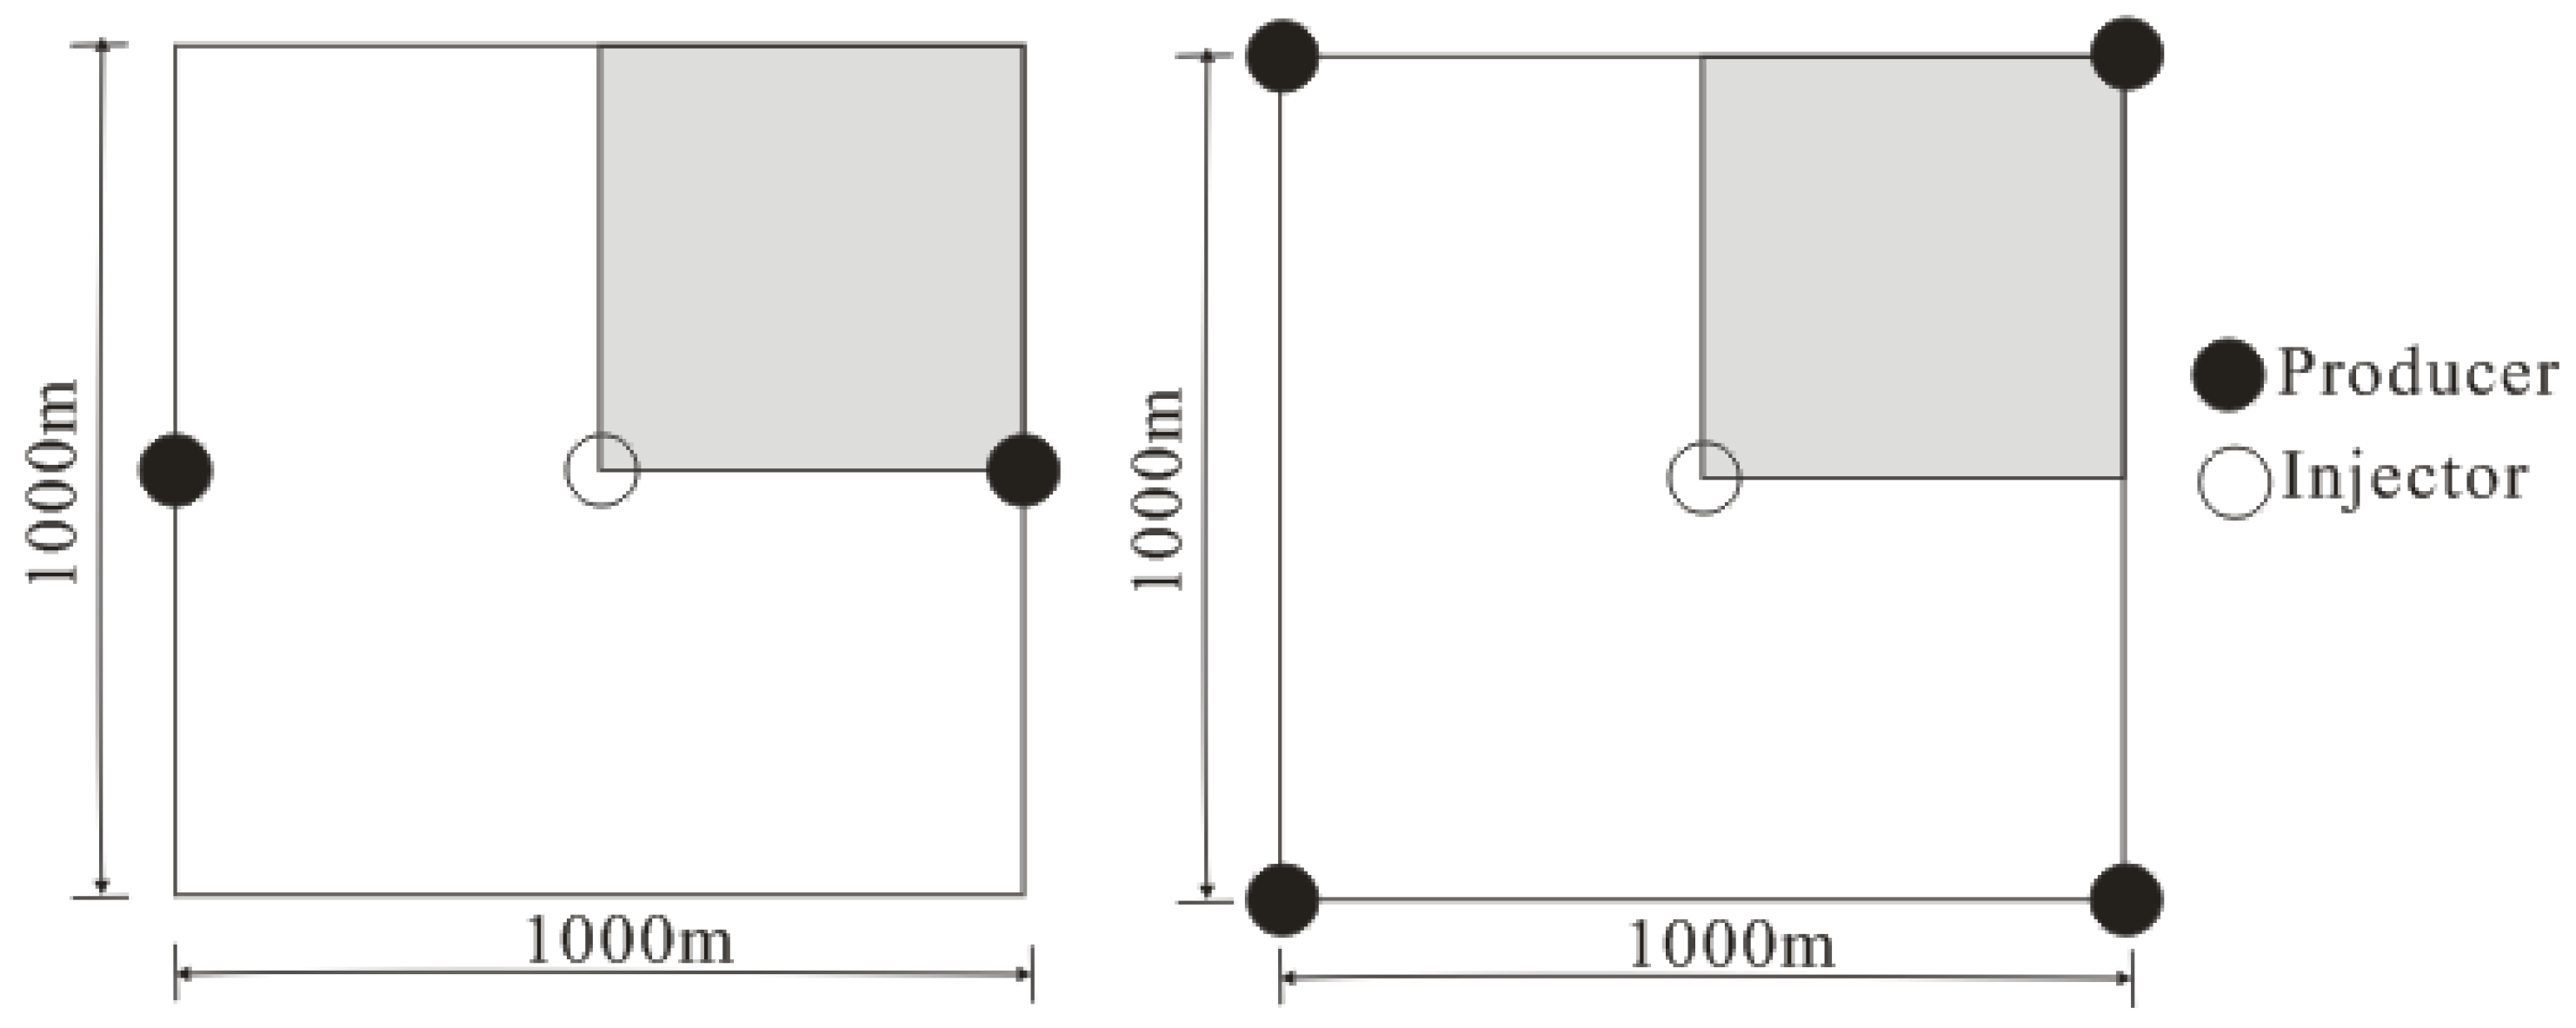
2.1. Physical Model
2.2. Mathematical Model
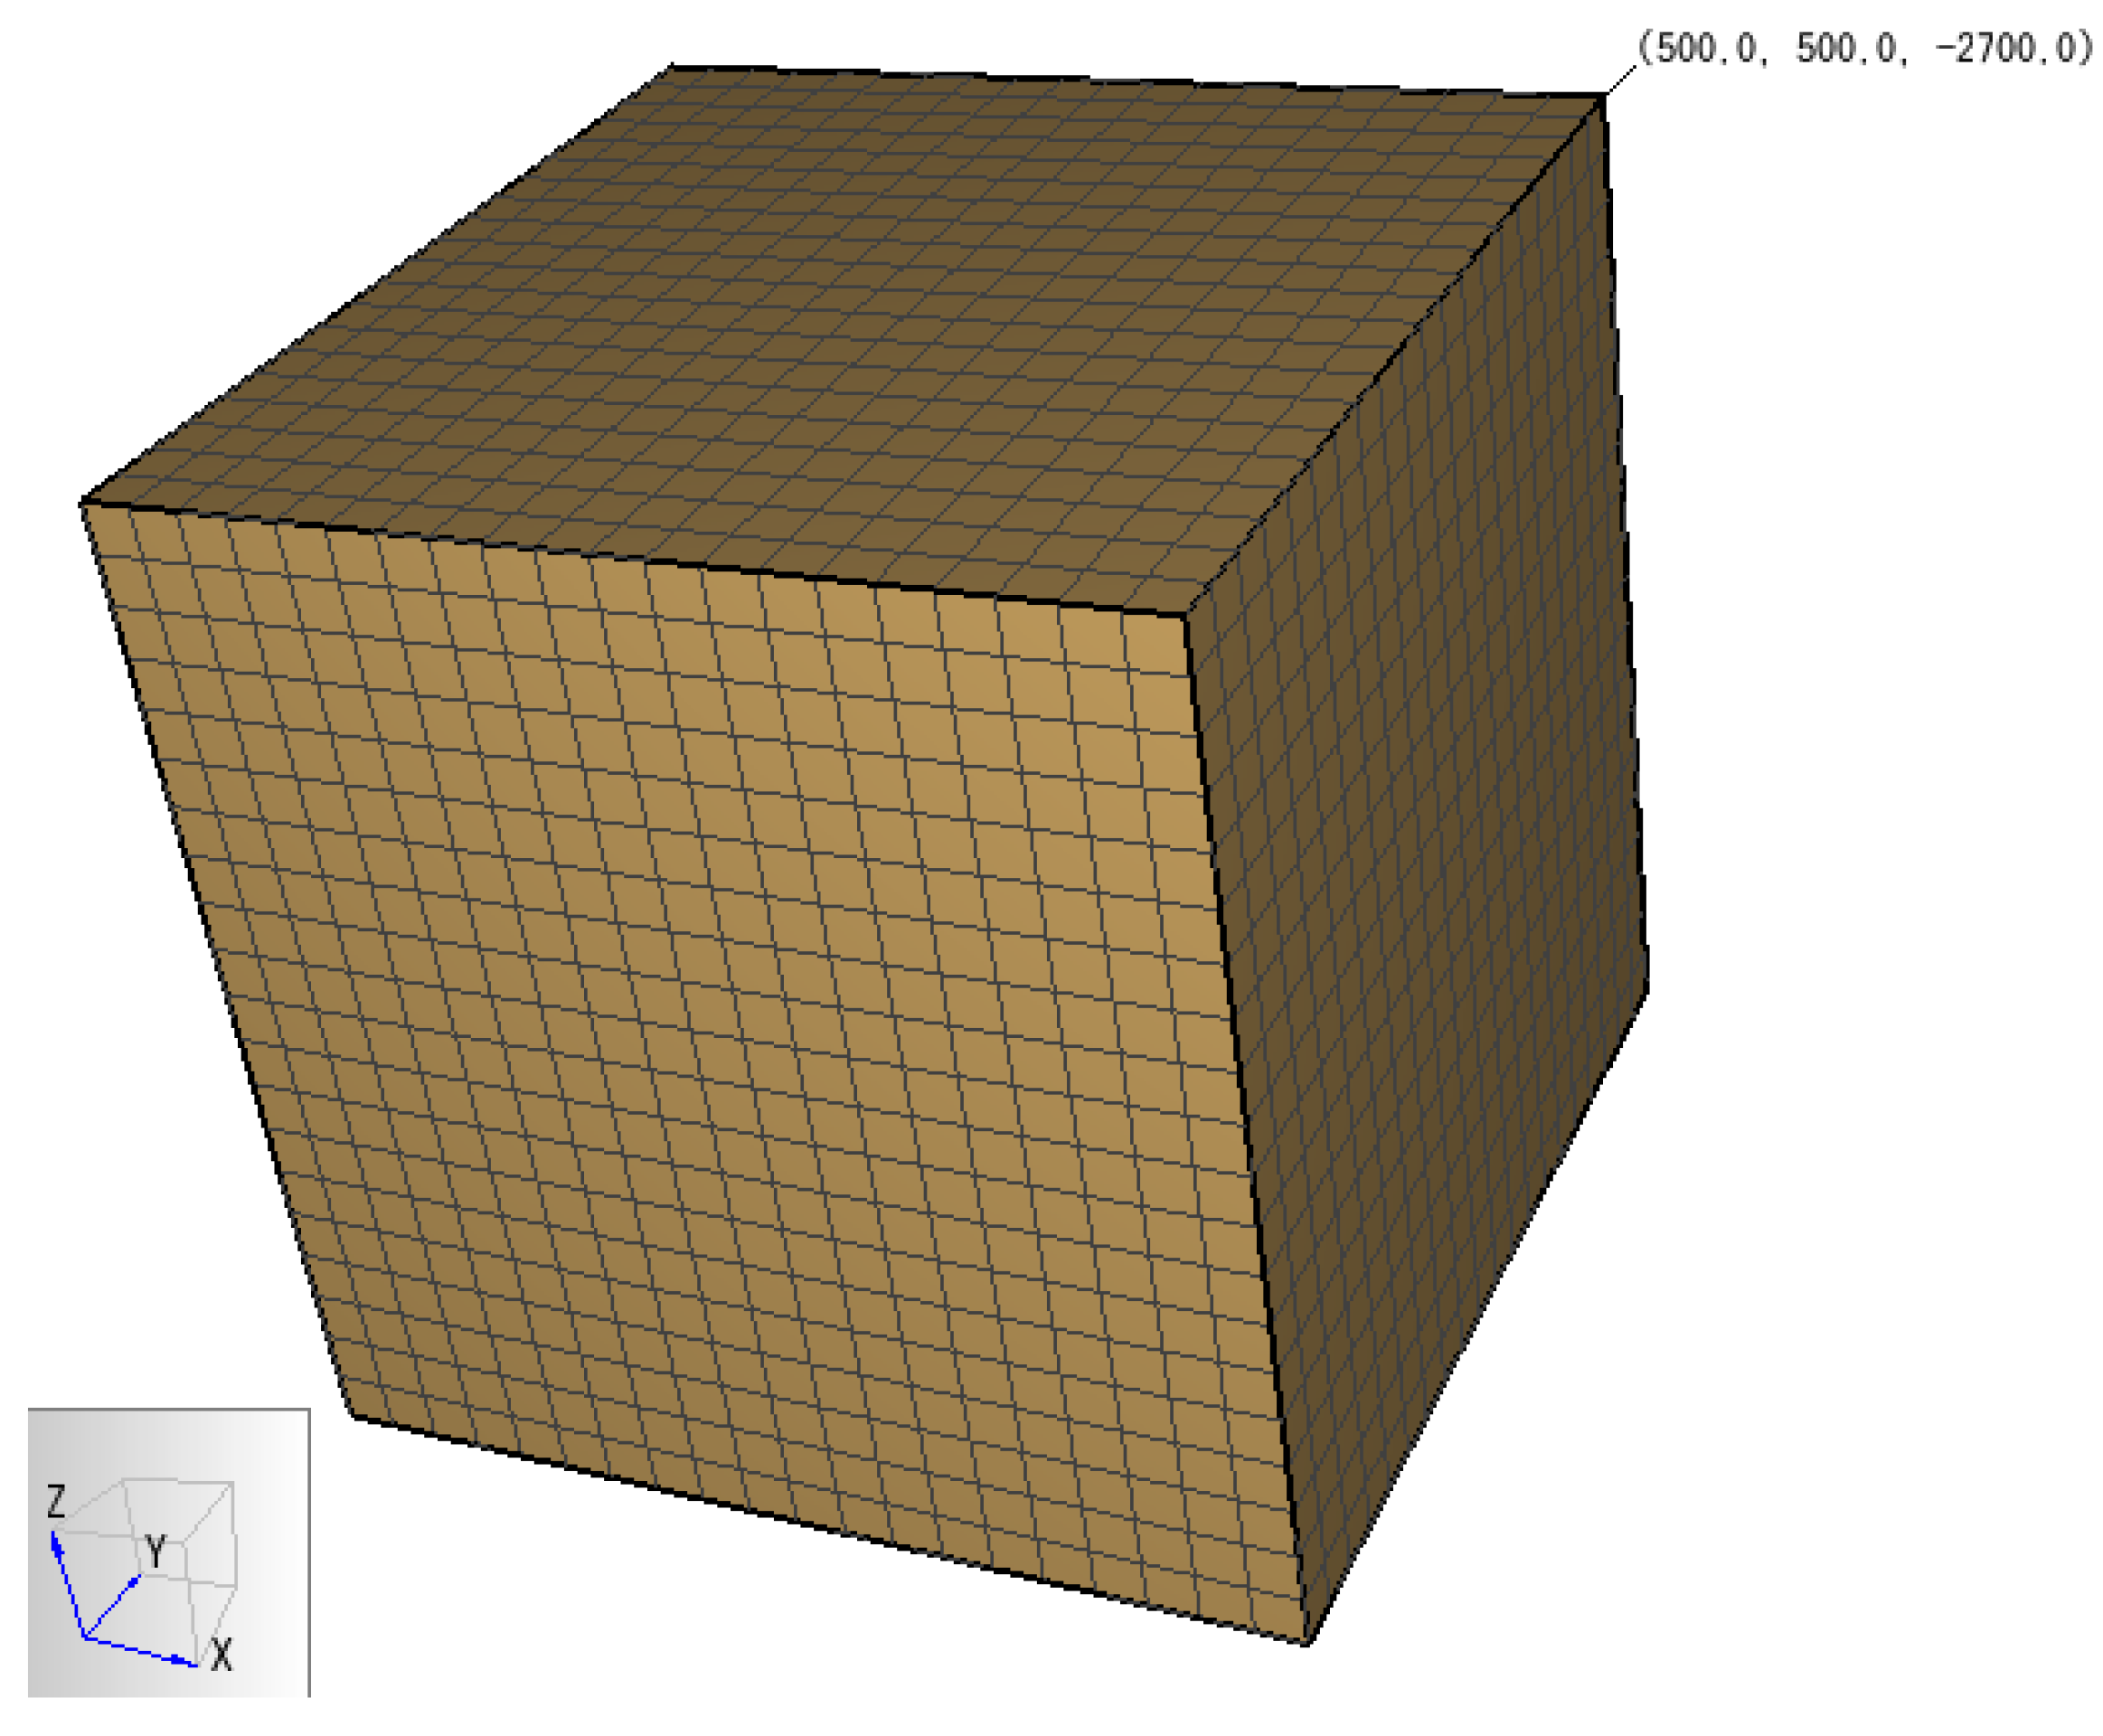
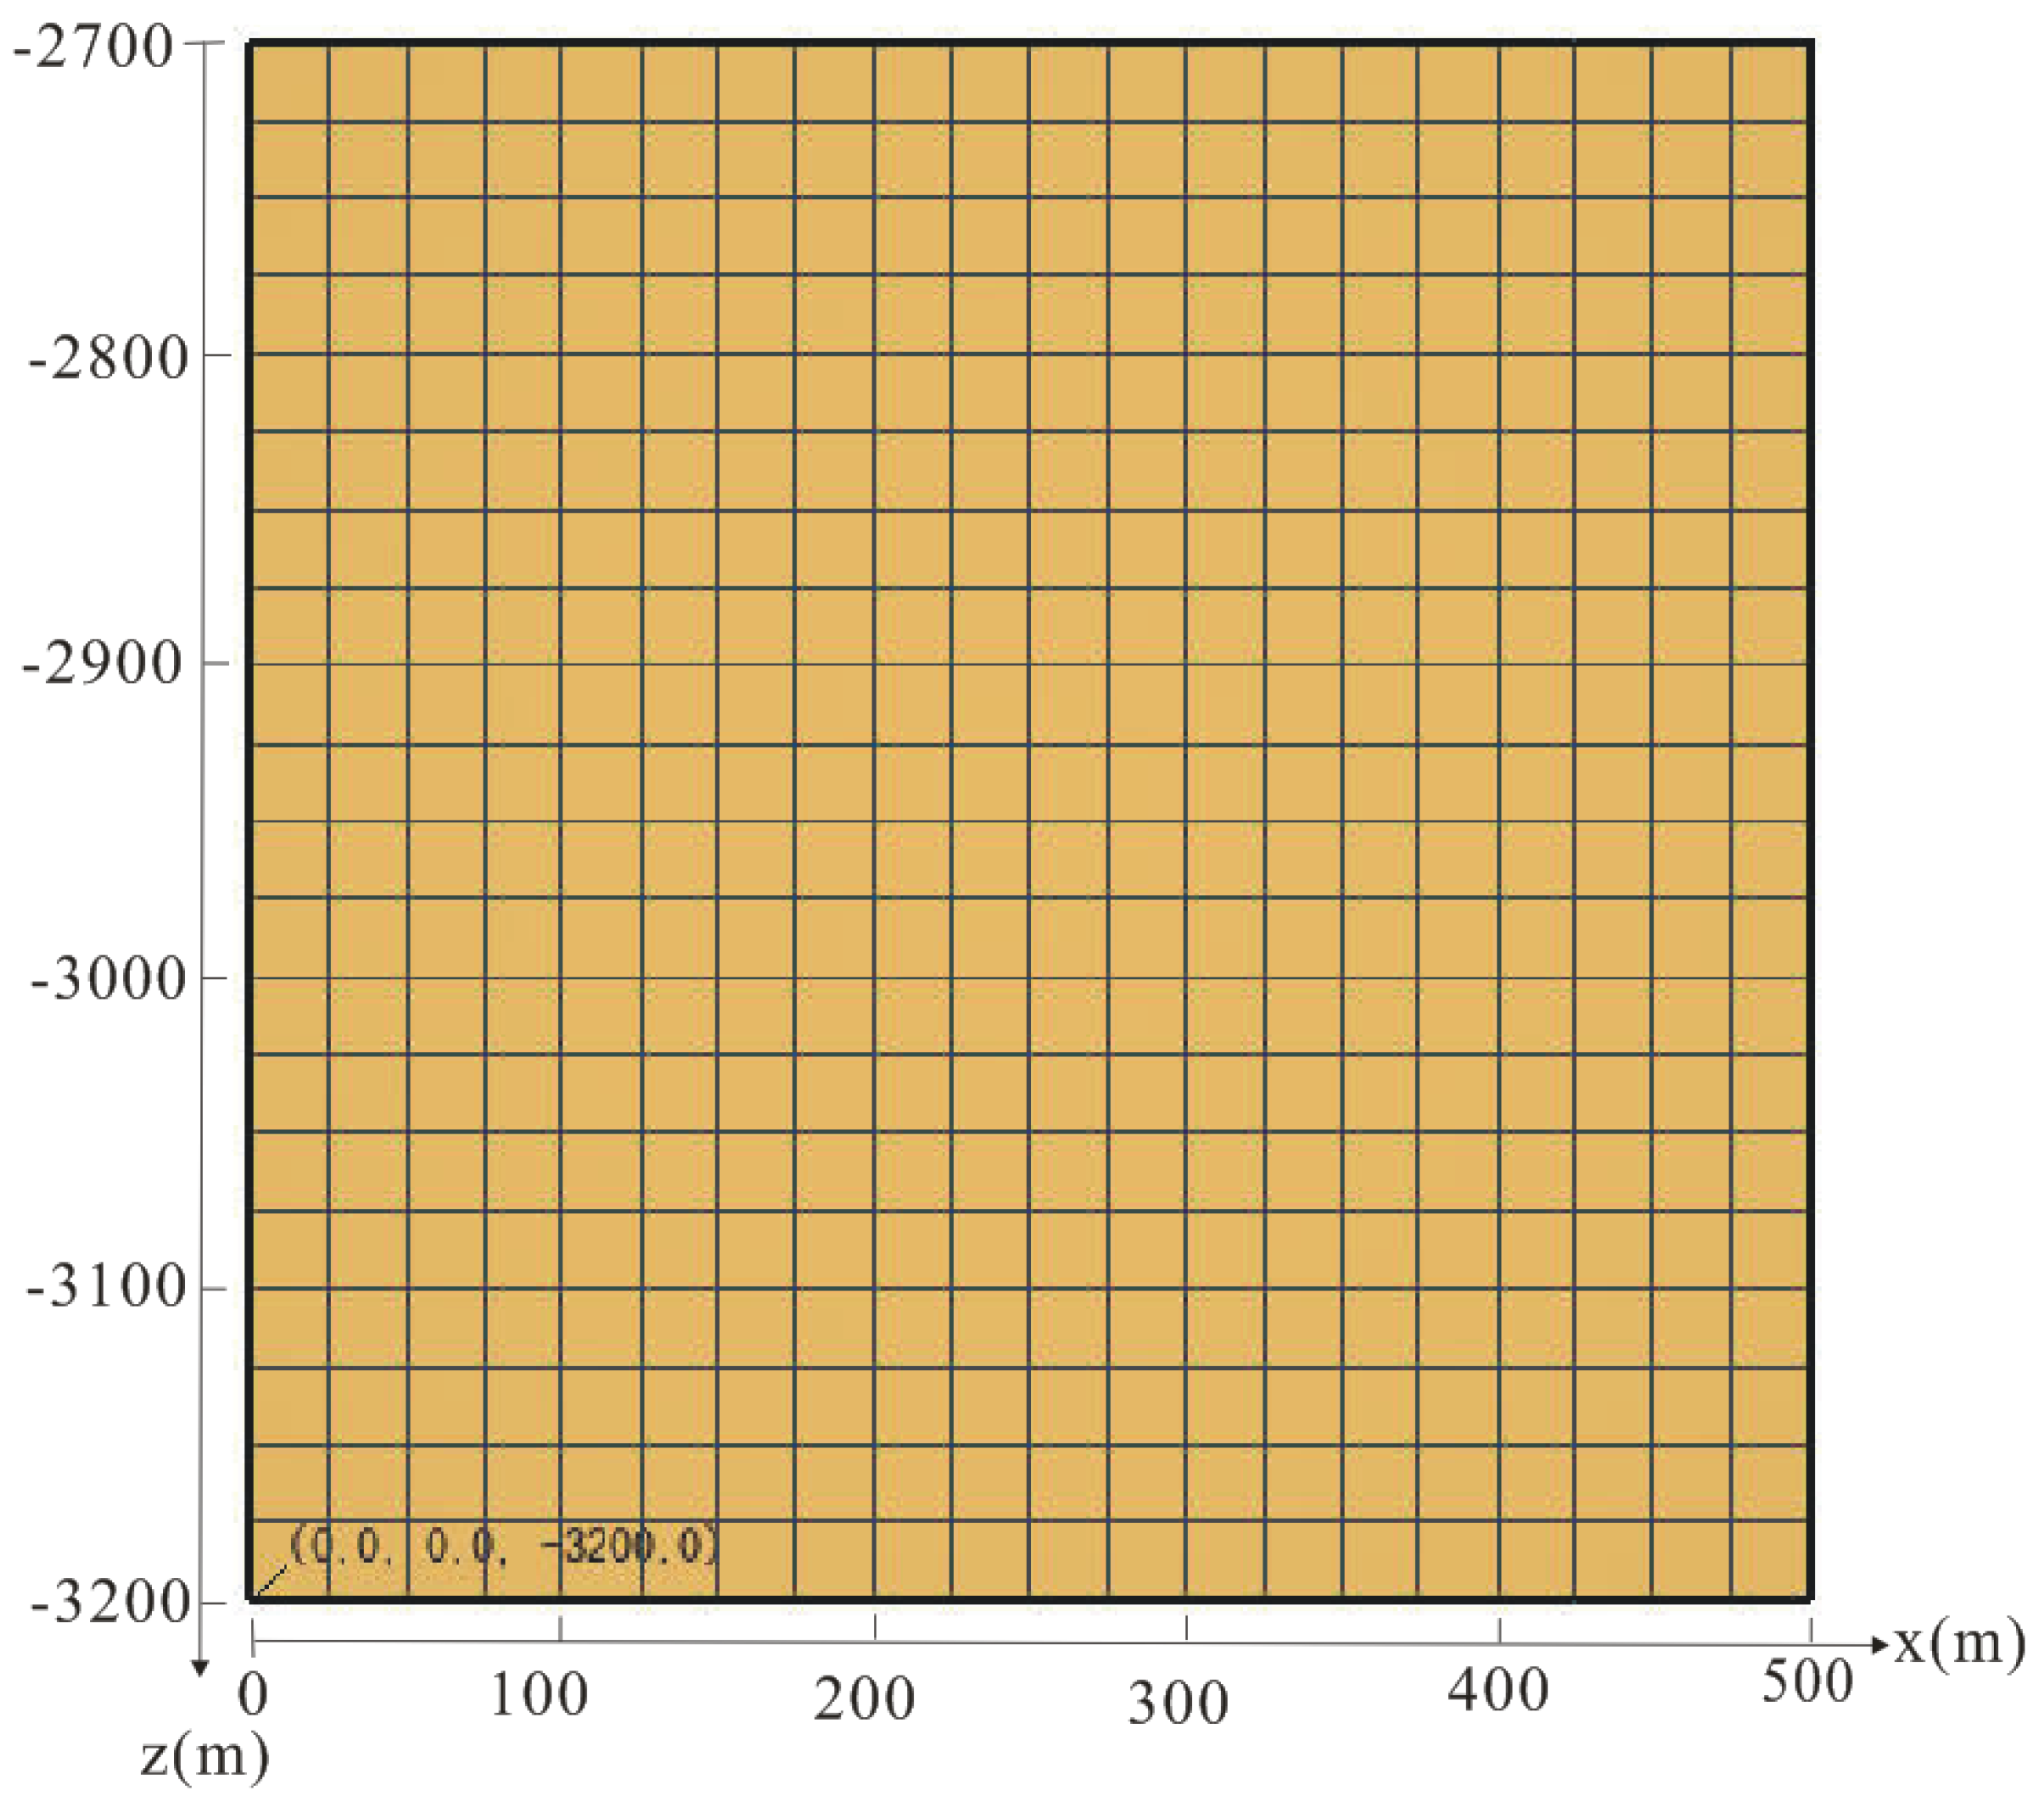
2.3. Domain, Grid and Parameters
2.4. Boundary and Initial Conditions
3. Results and Discussion
3.1. The Determination of Water Production Rate
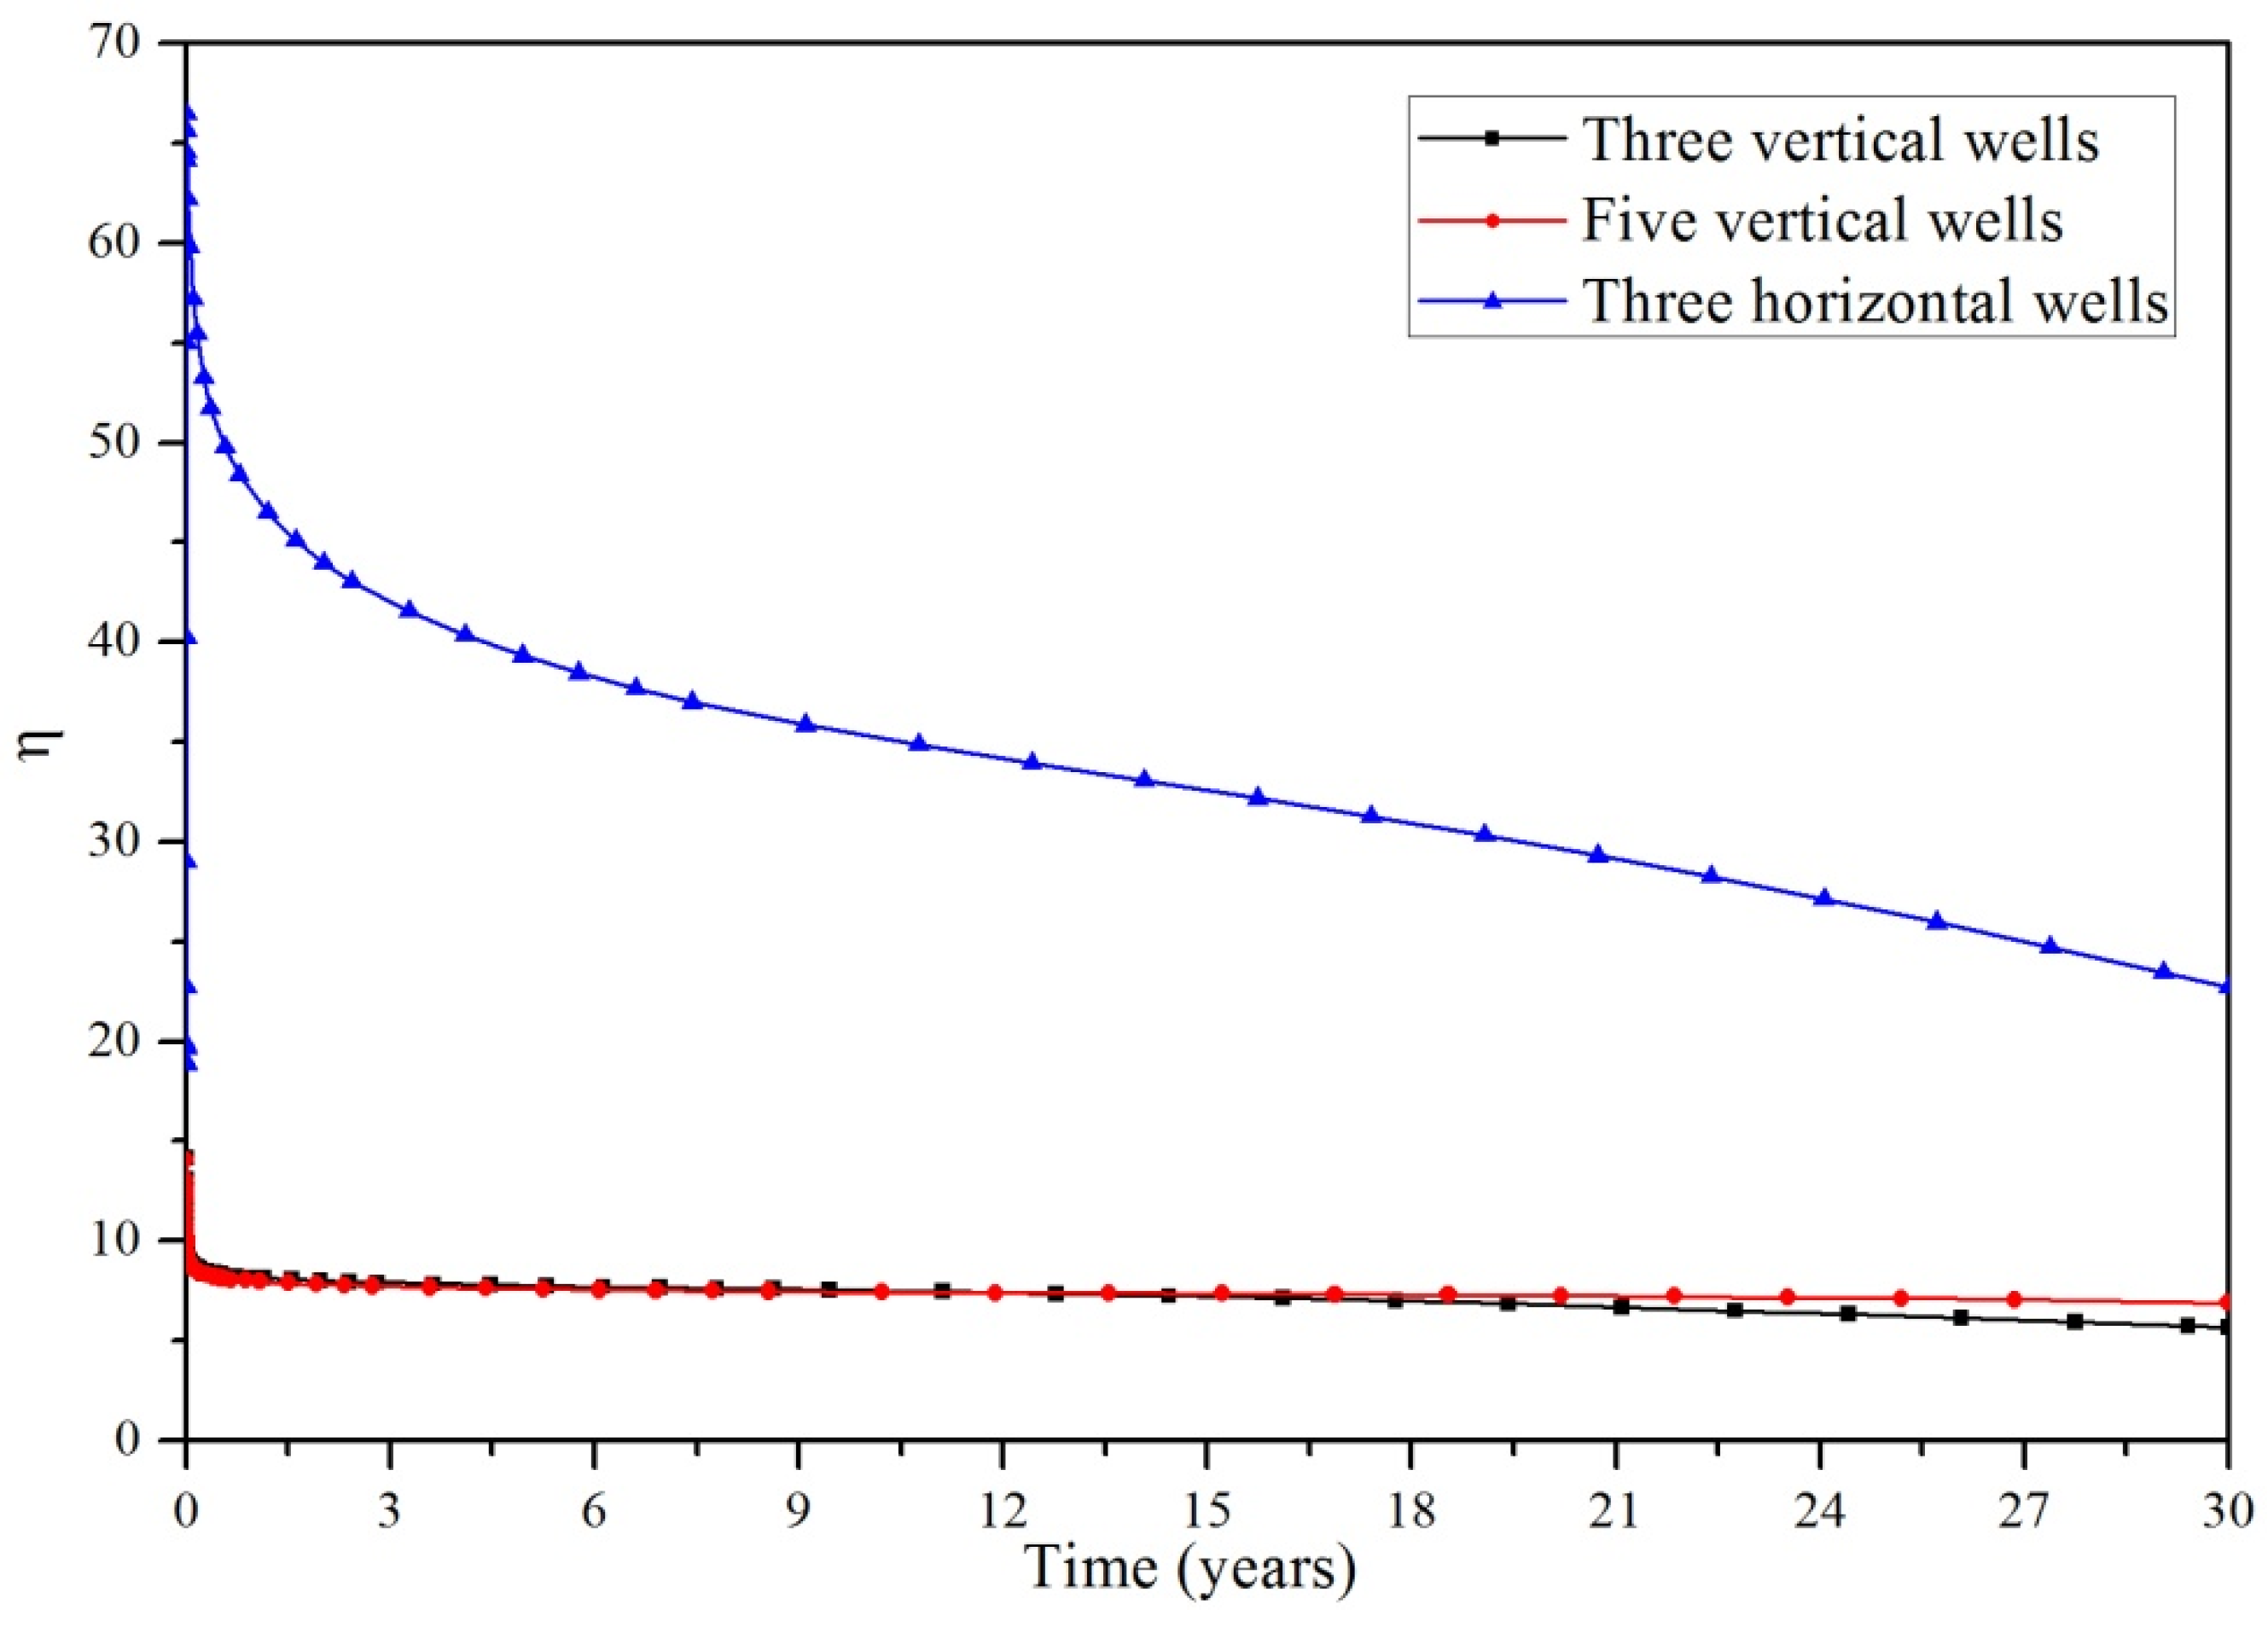
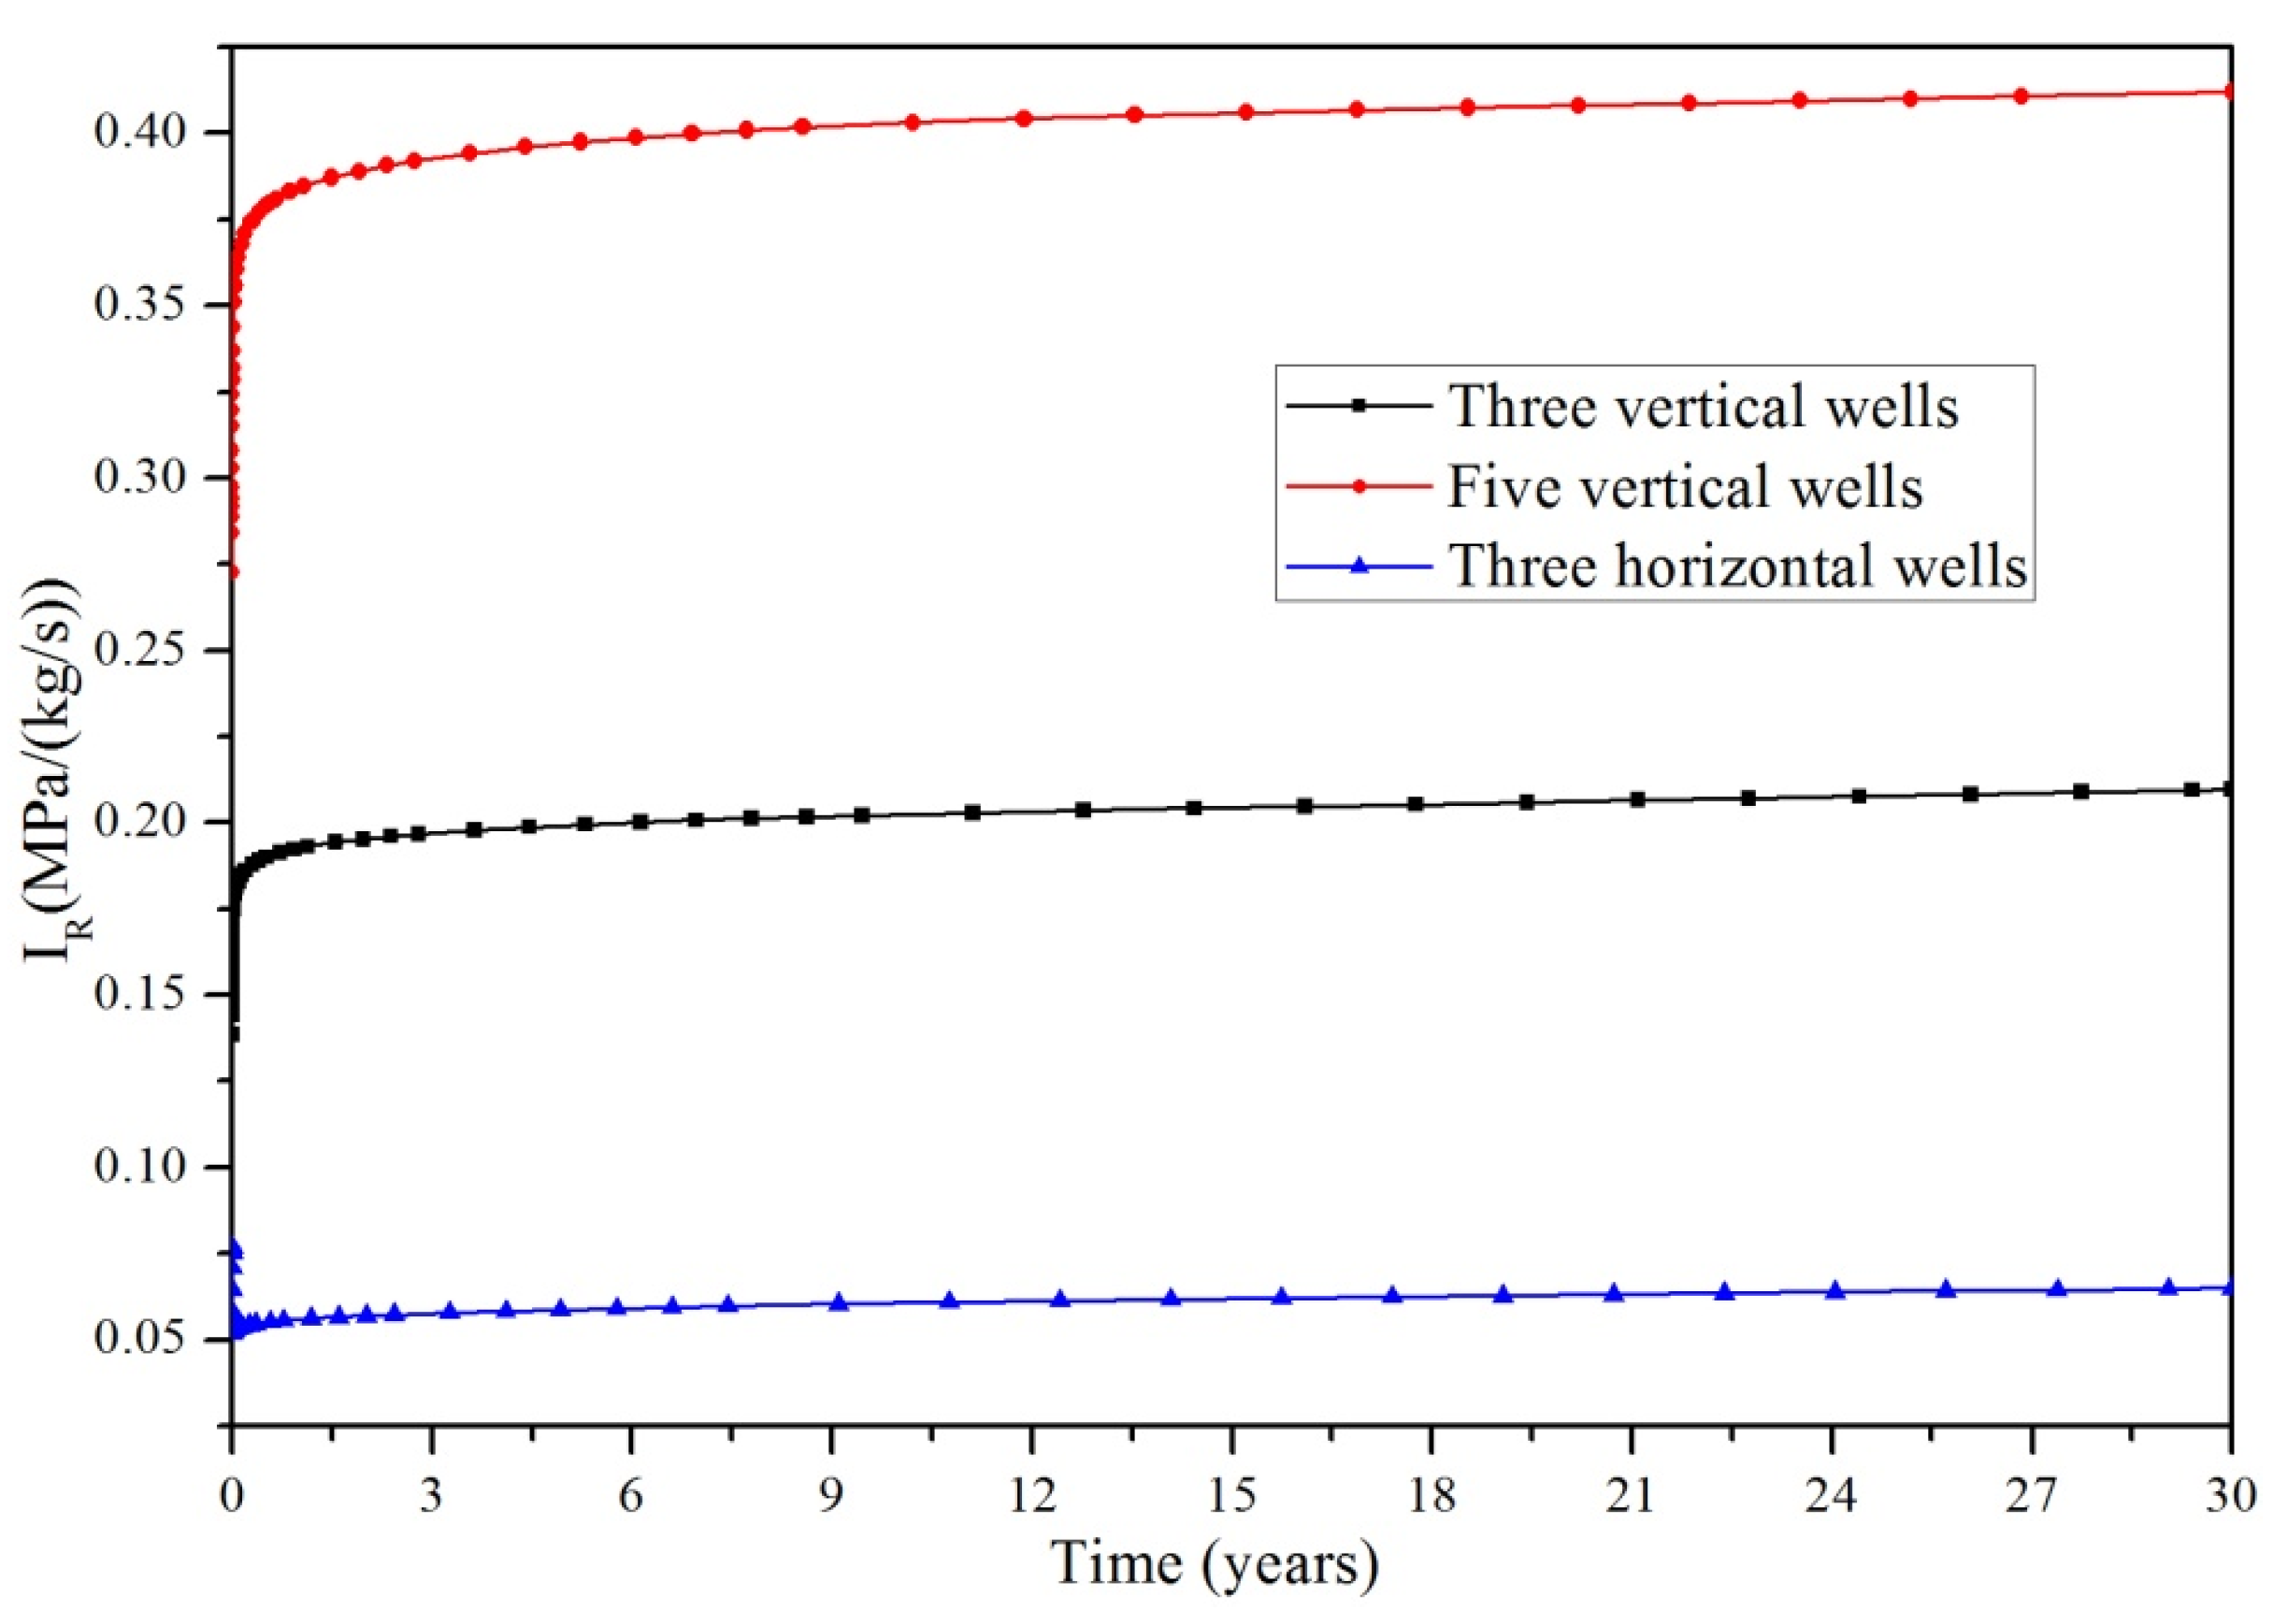
3.2. The Influence of the Well Layout
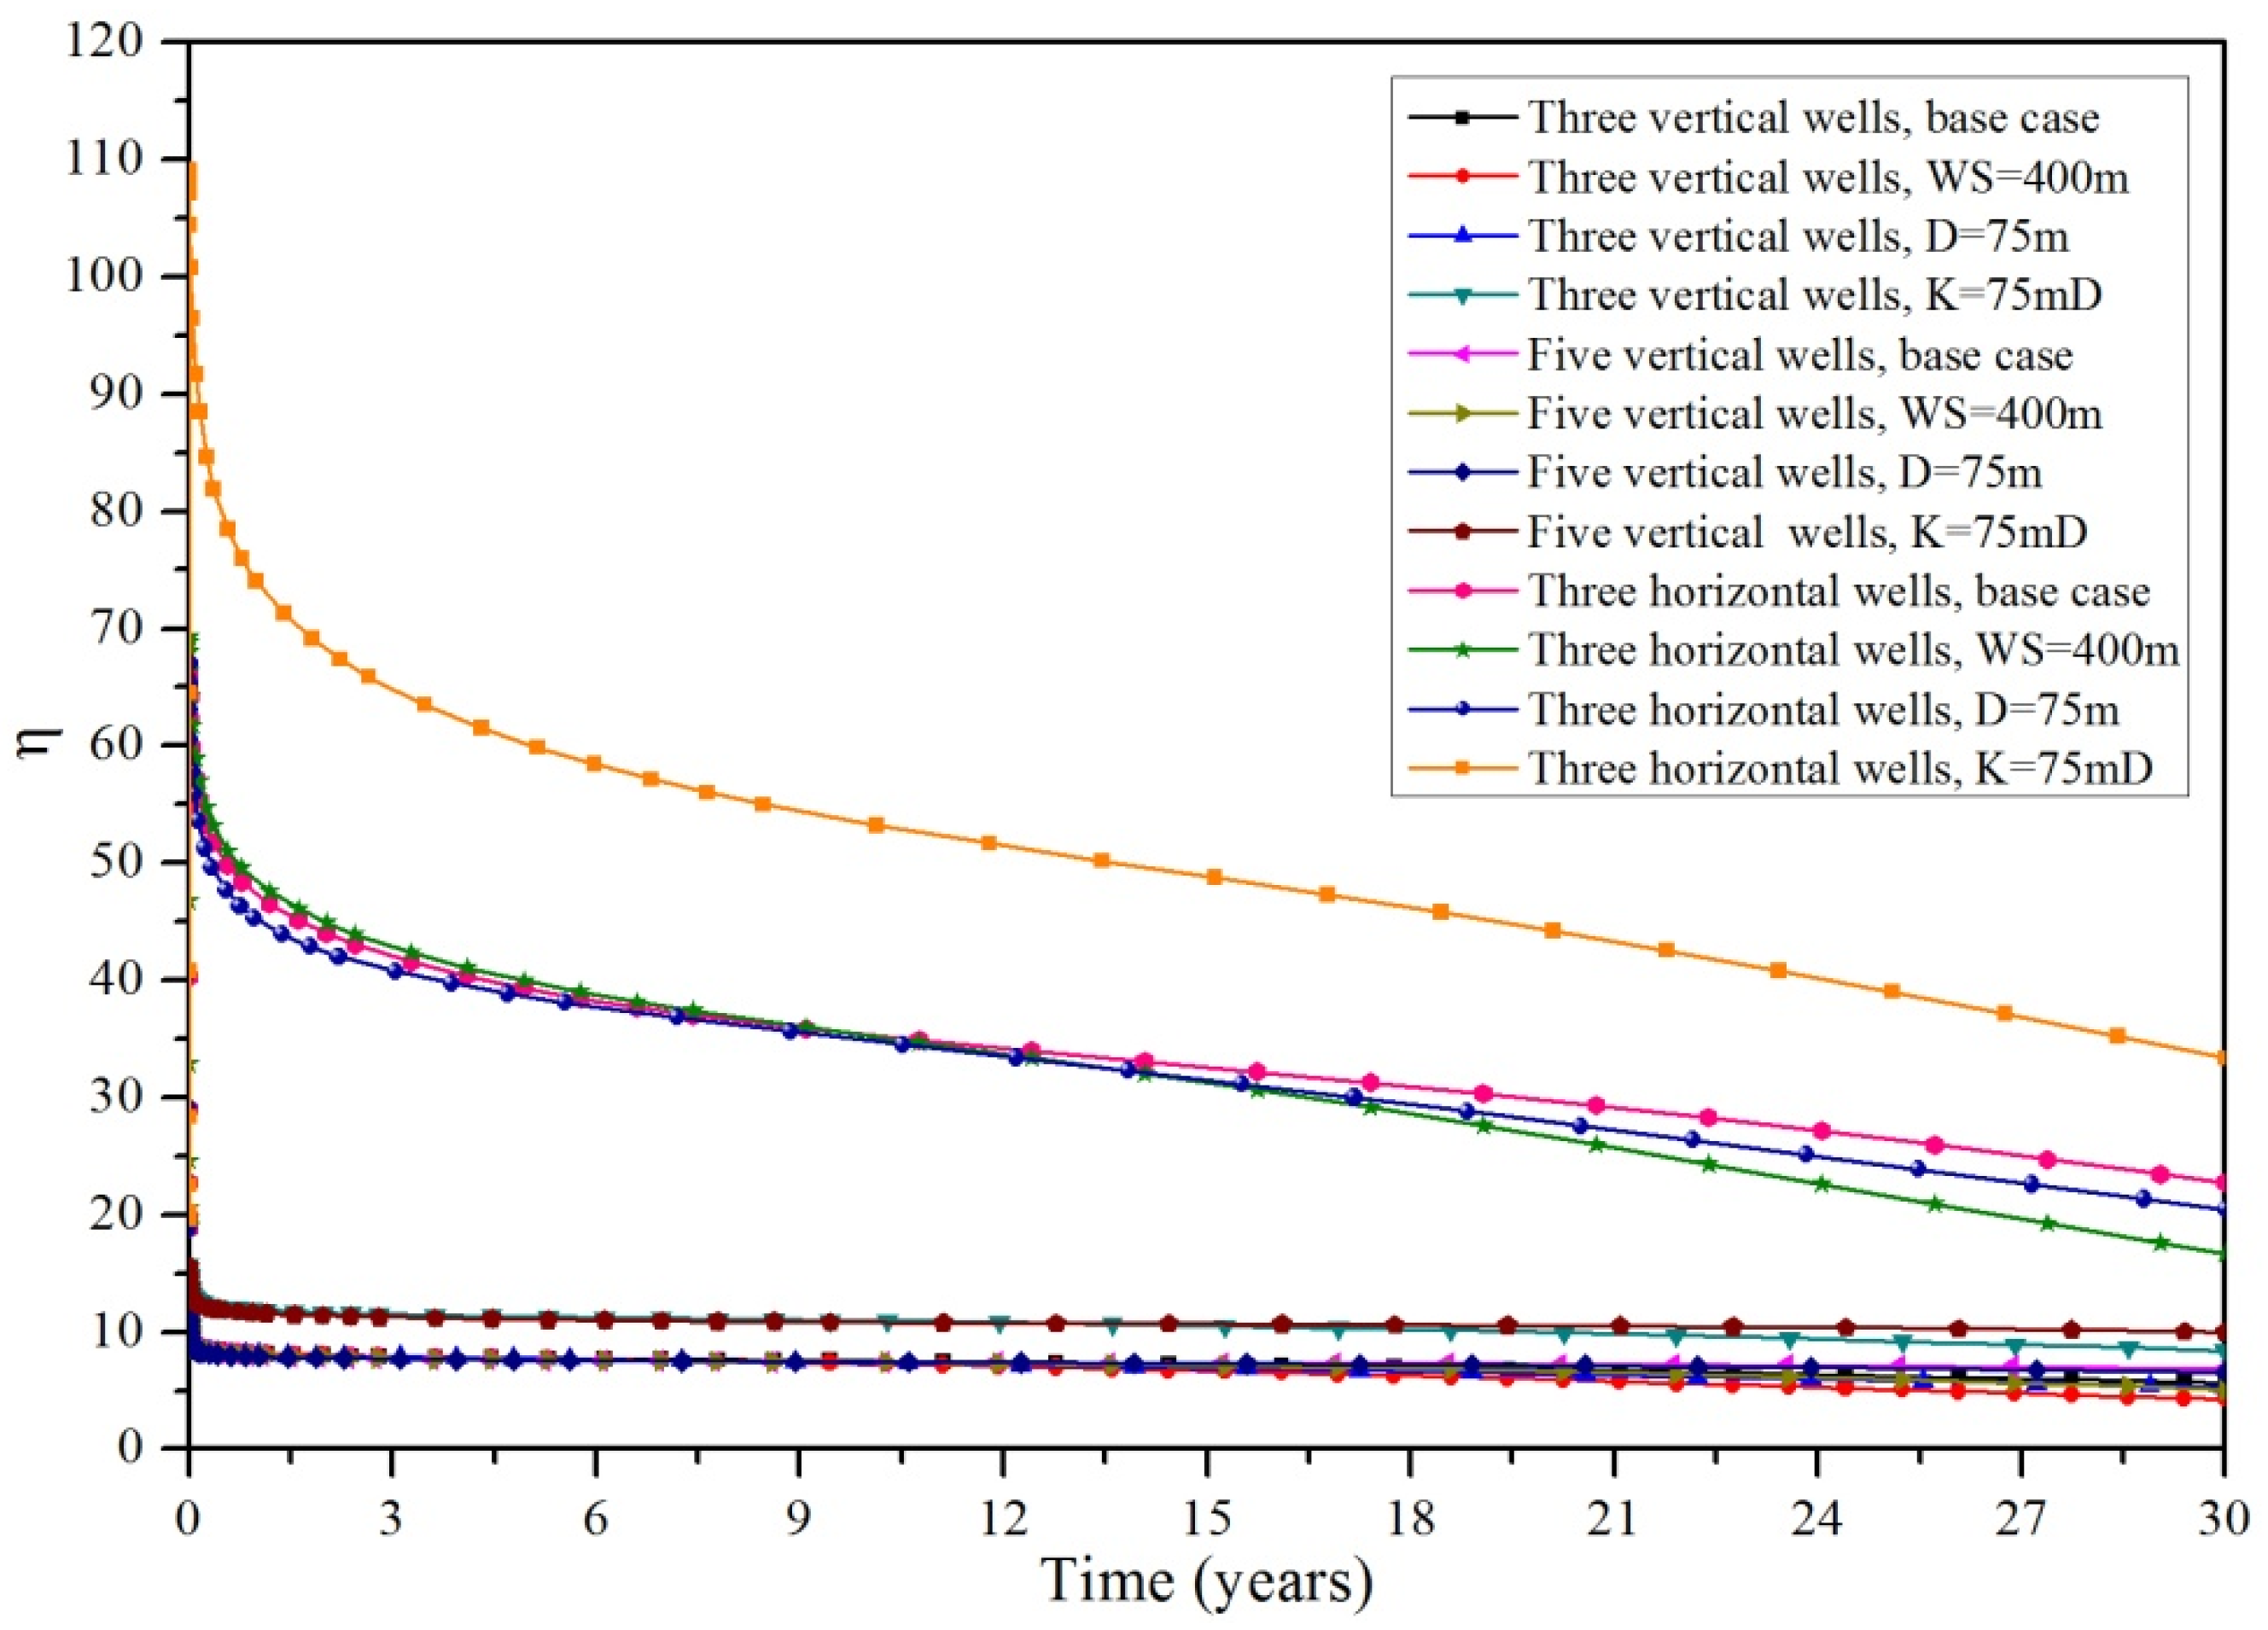
3.3. Sensitivity Analysis
3.3.1. Sensitivity to Well Spacing
3.3.2. Sensitivity to Fracture Spacing
3.3.3. Sensitivity to Fracture Permeability
3.4. Model Validation
4. Conclusions
- (1)
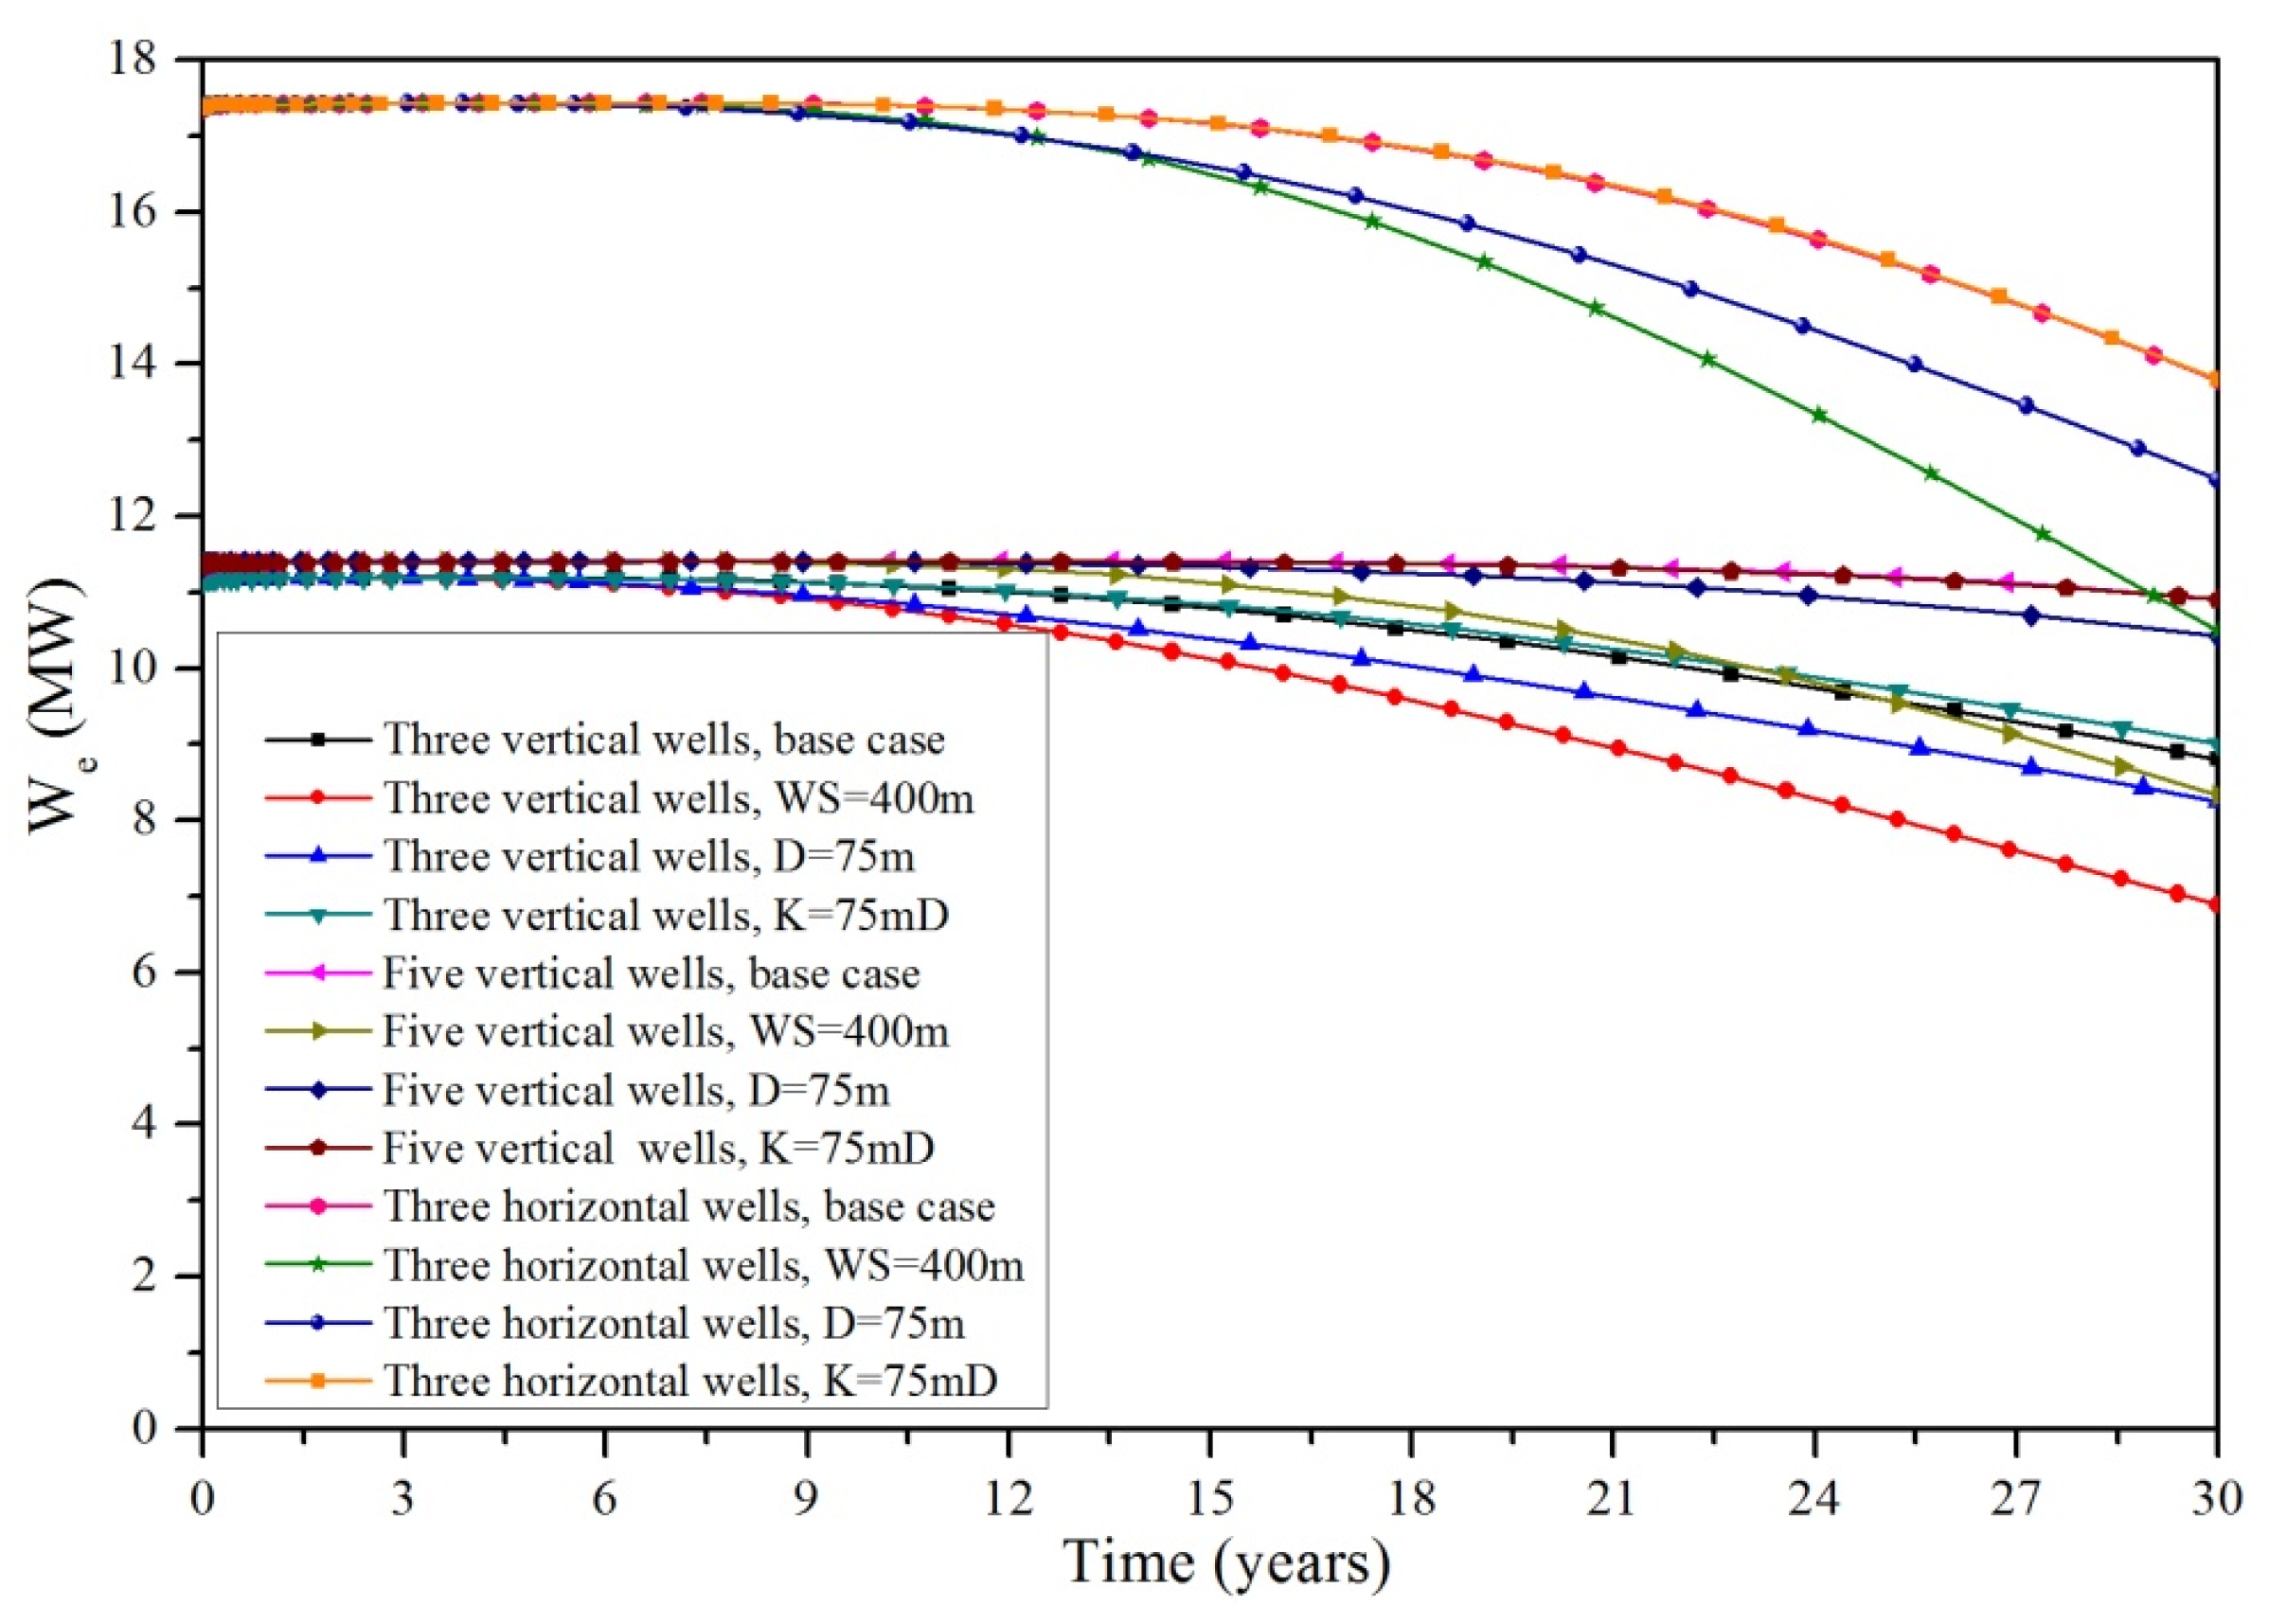
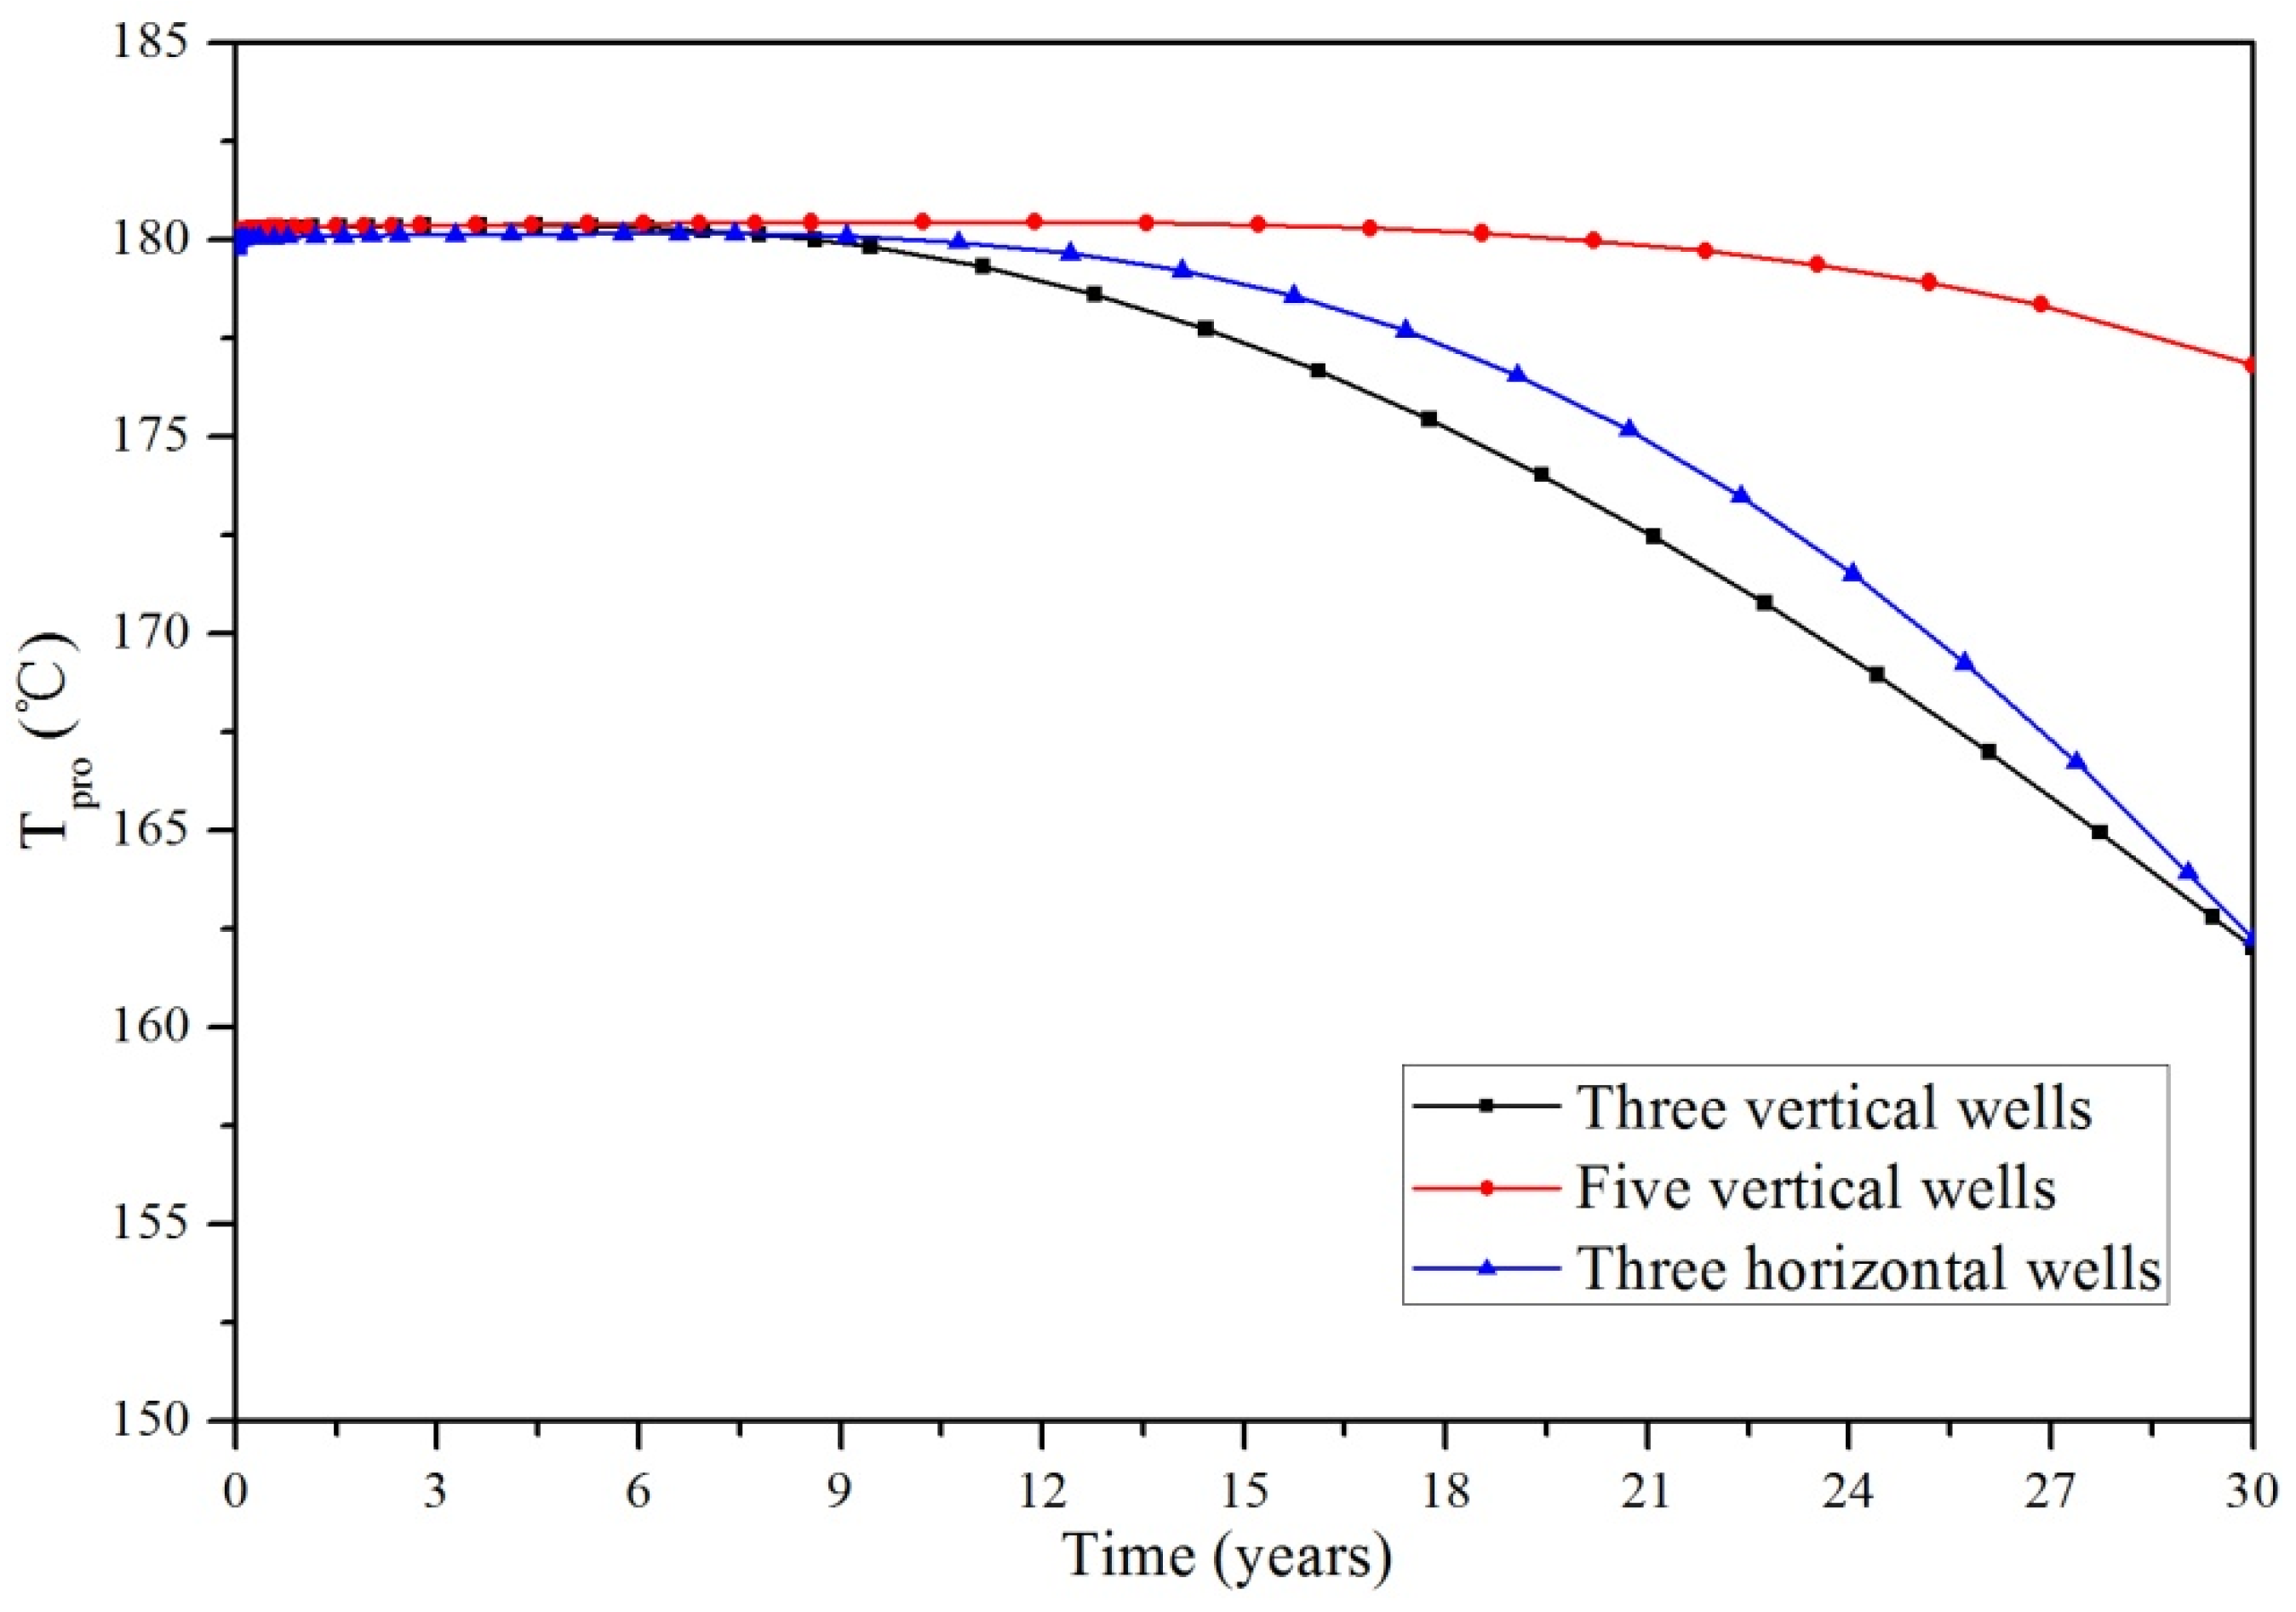
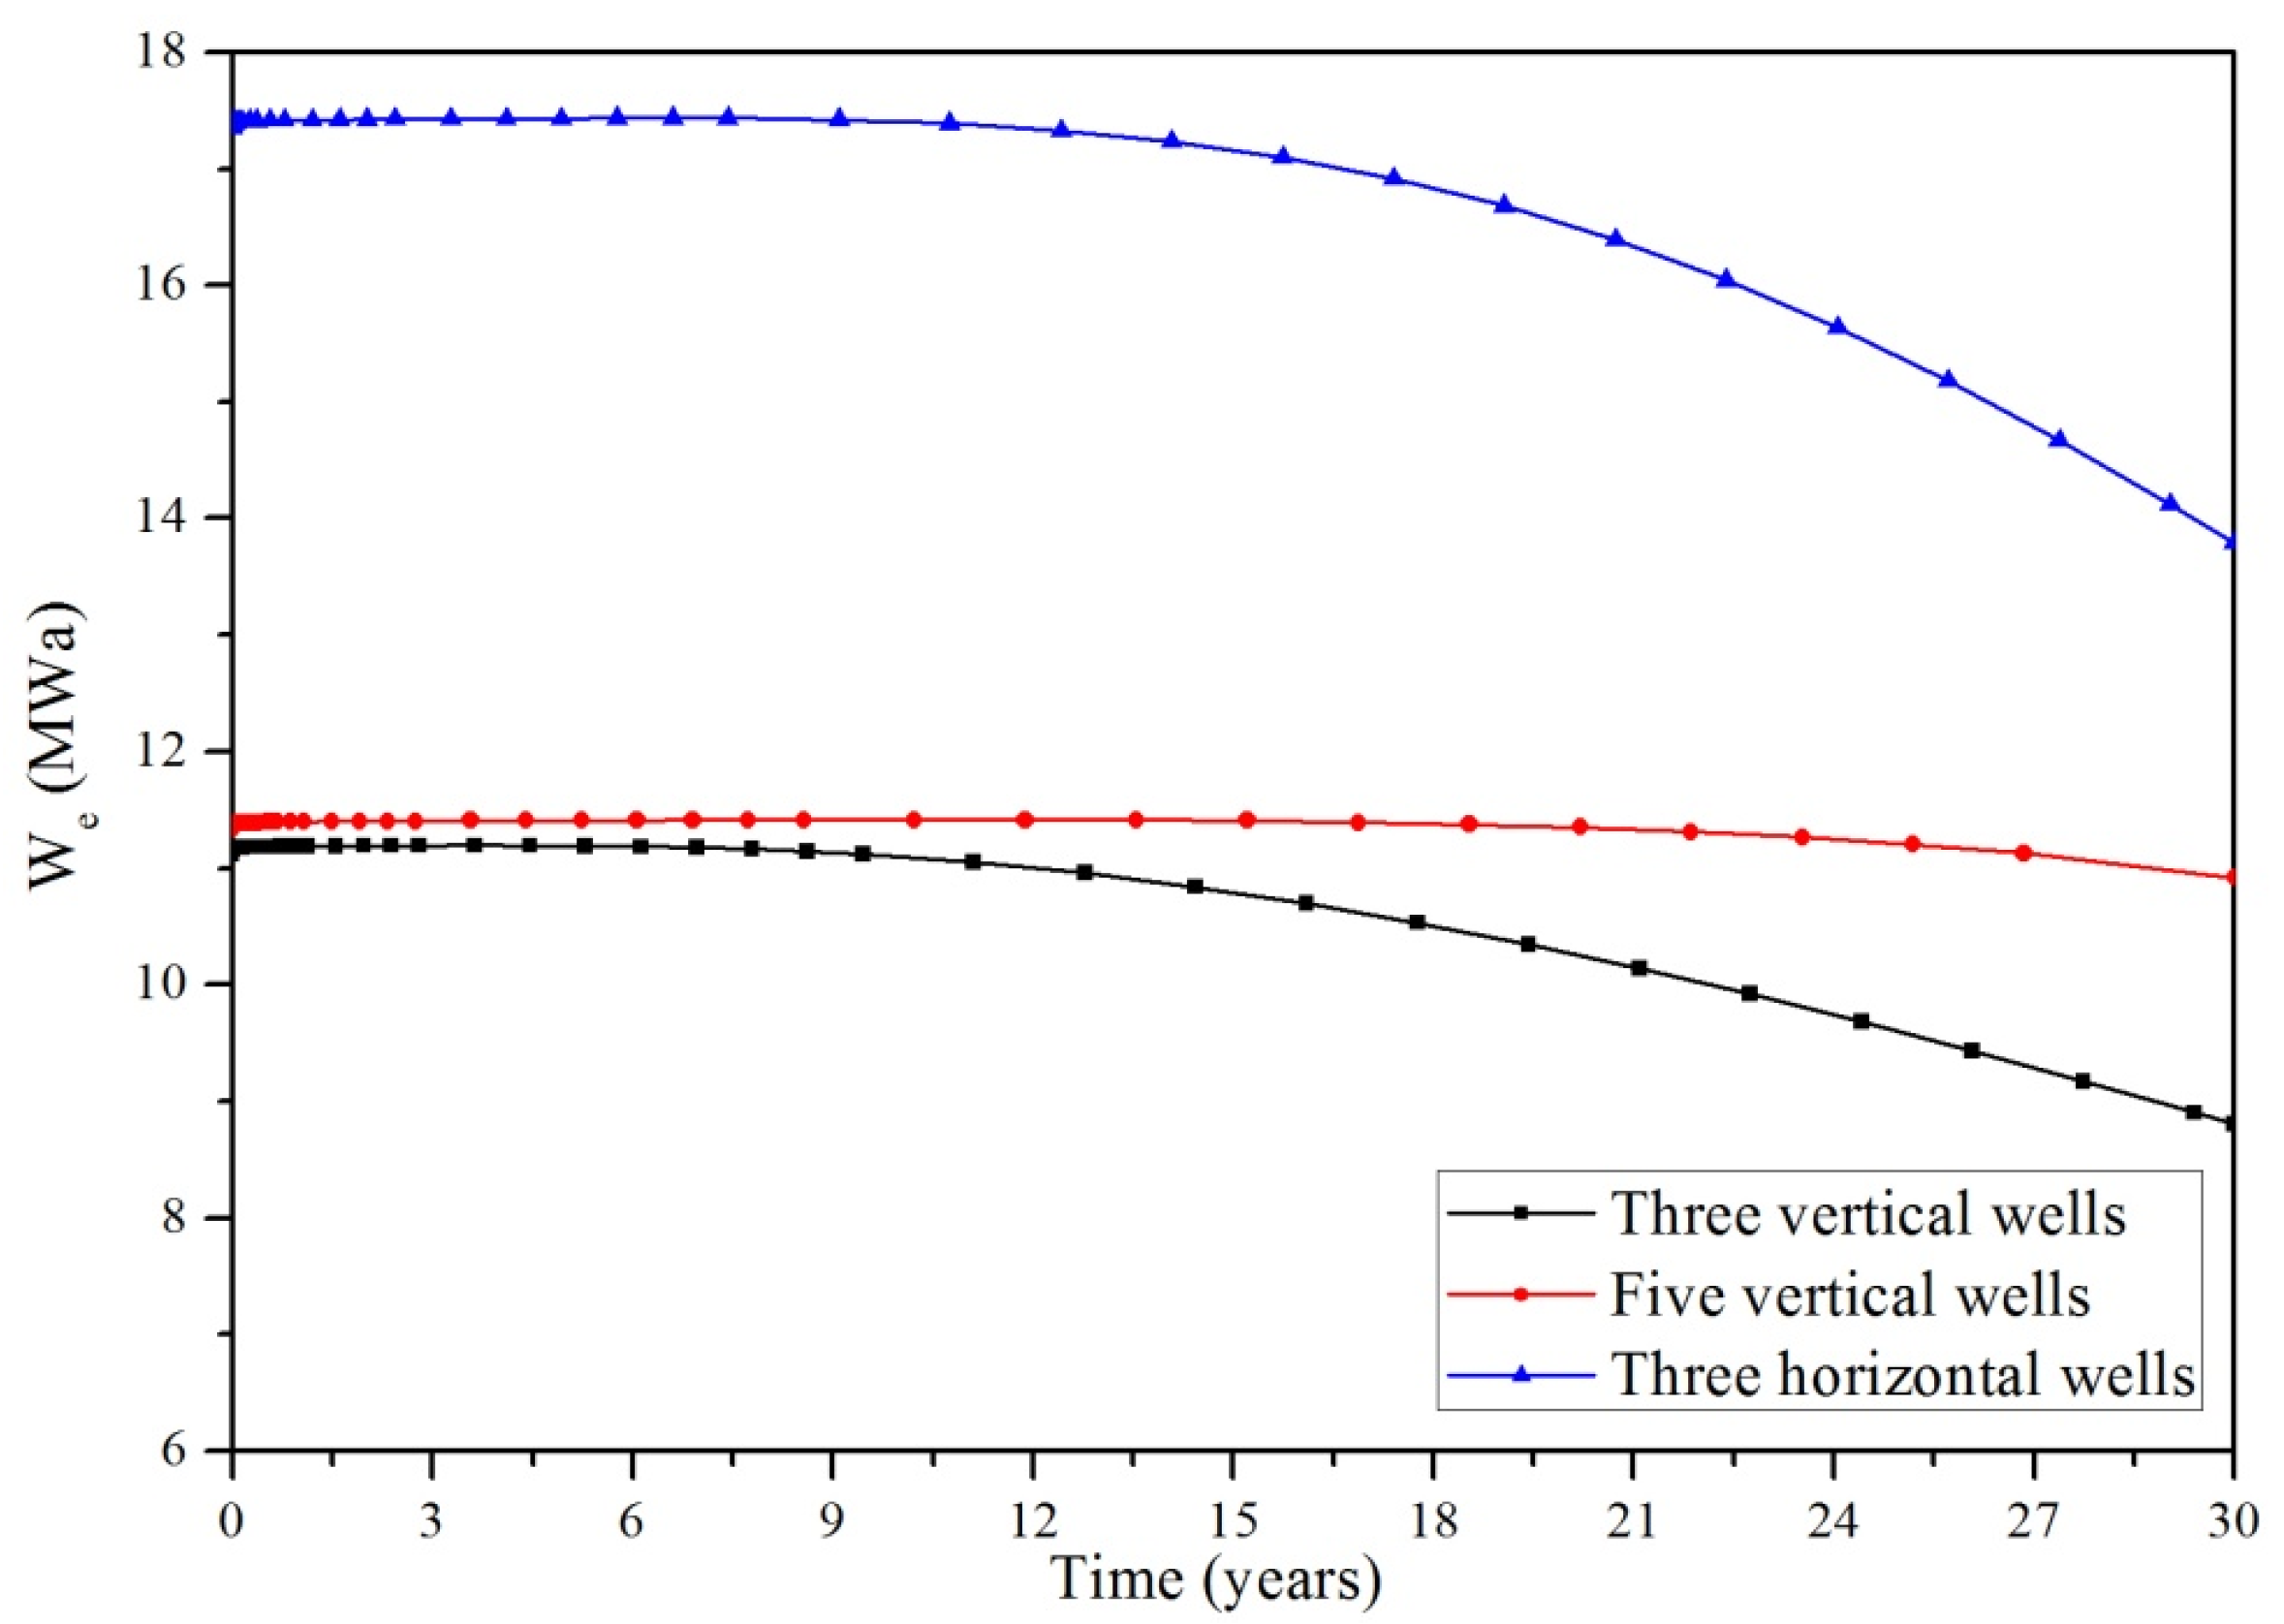
- For reservoirs of the same size of 1000 × 1000 × 500 m, the electric power via three horizon wells is higher than that via five vertical wells, and the electric power via five vertical wells is higher than that via three vertical wells.
- (2)
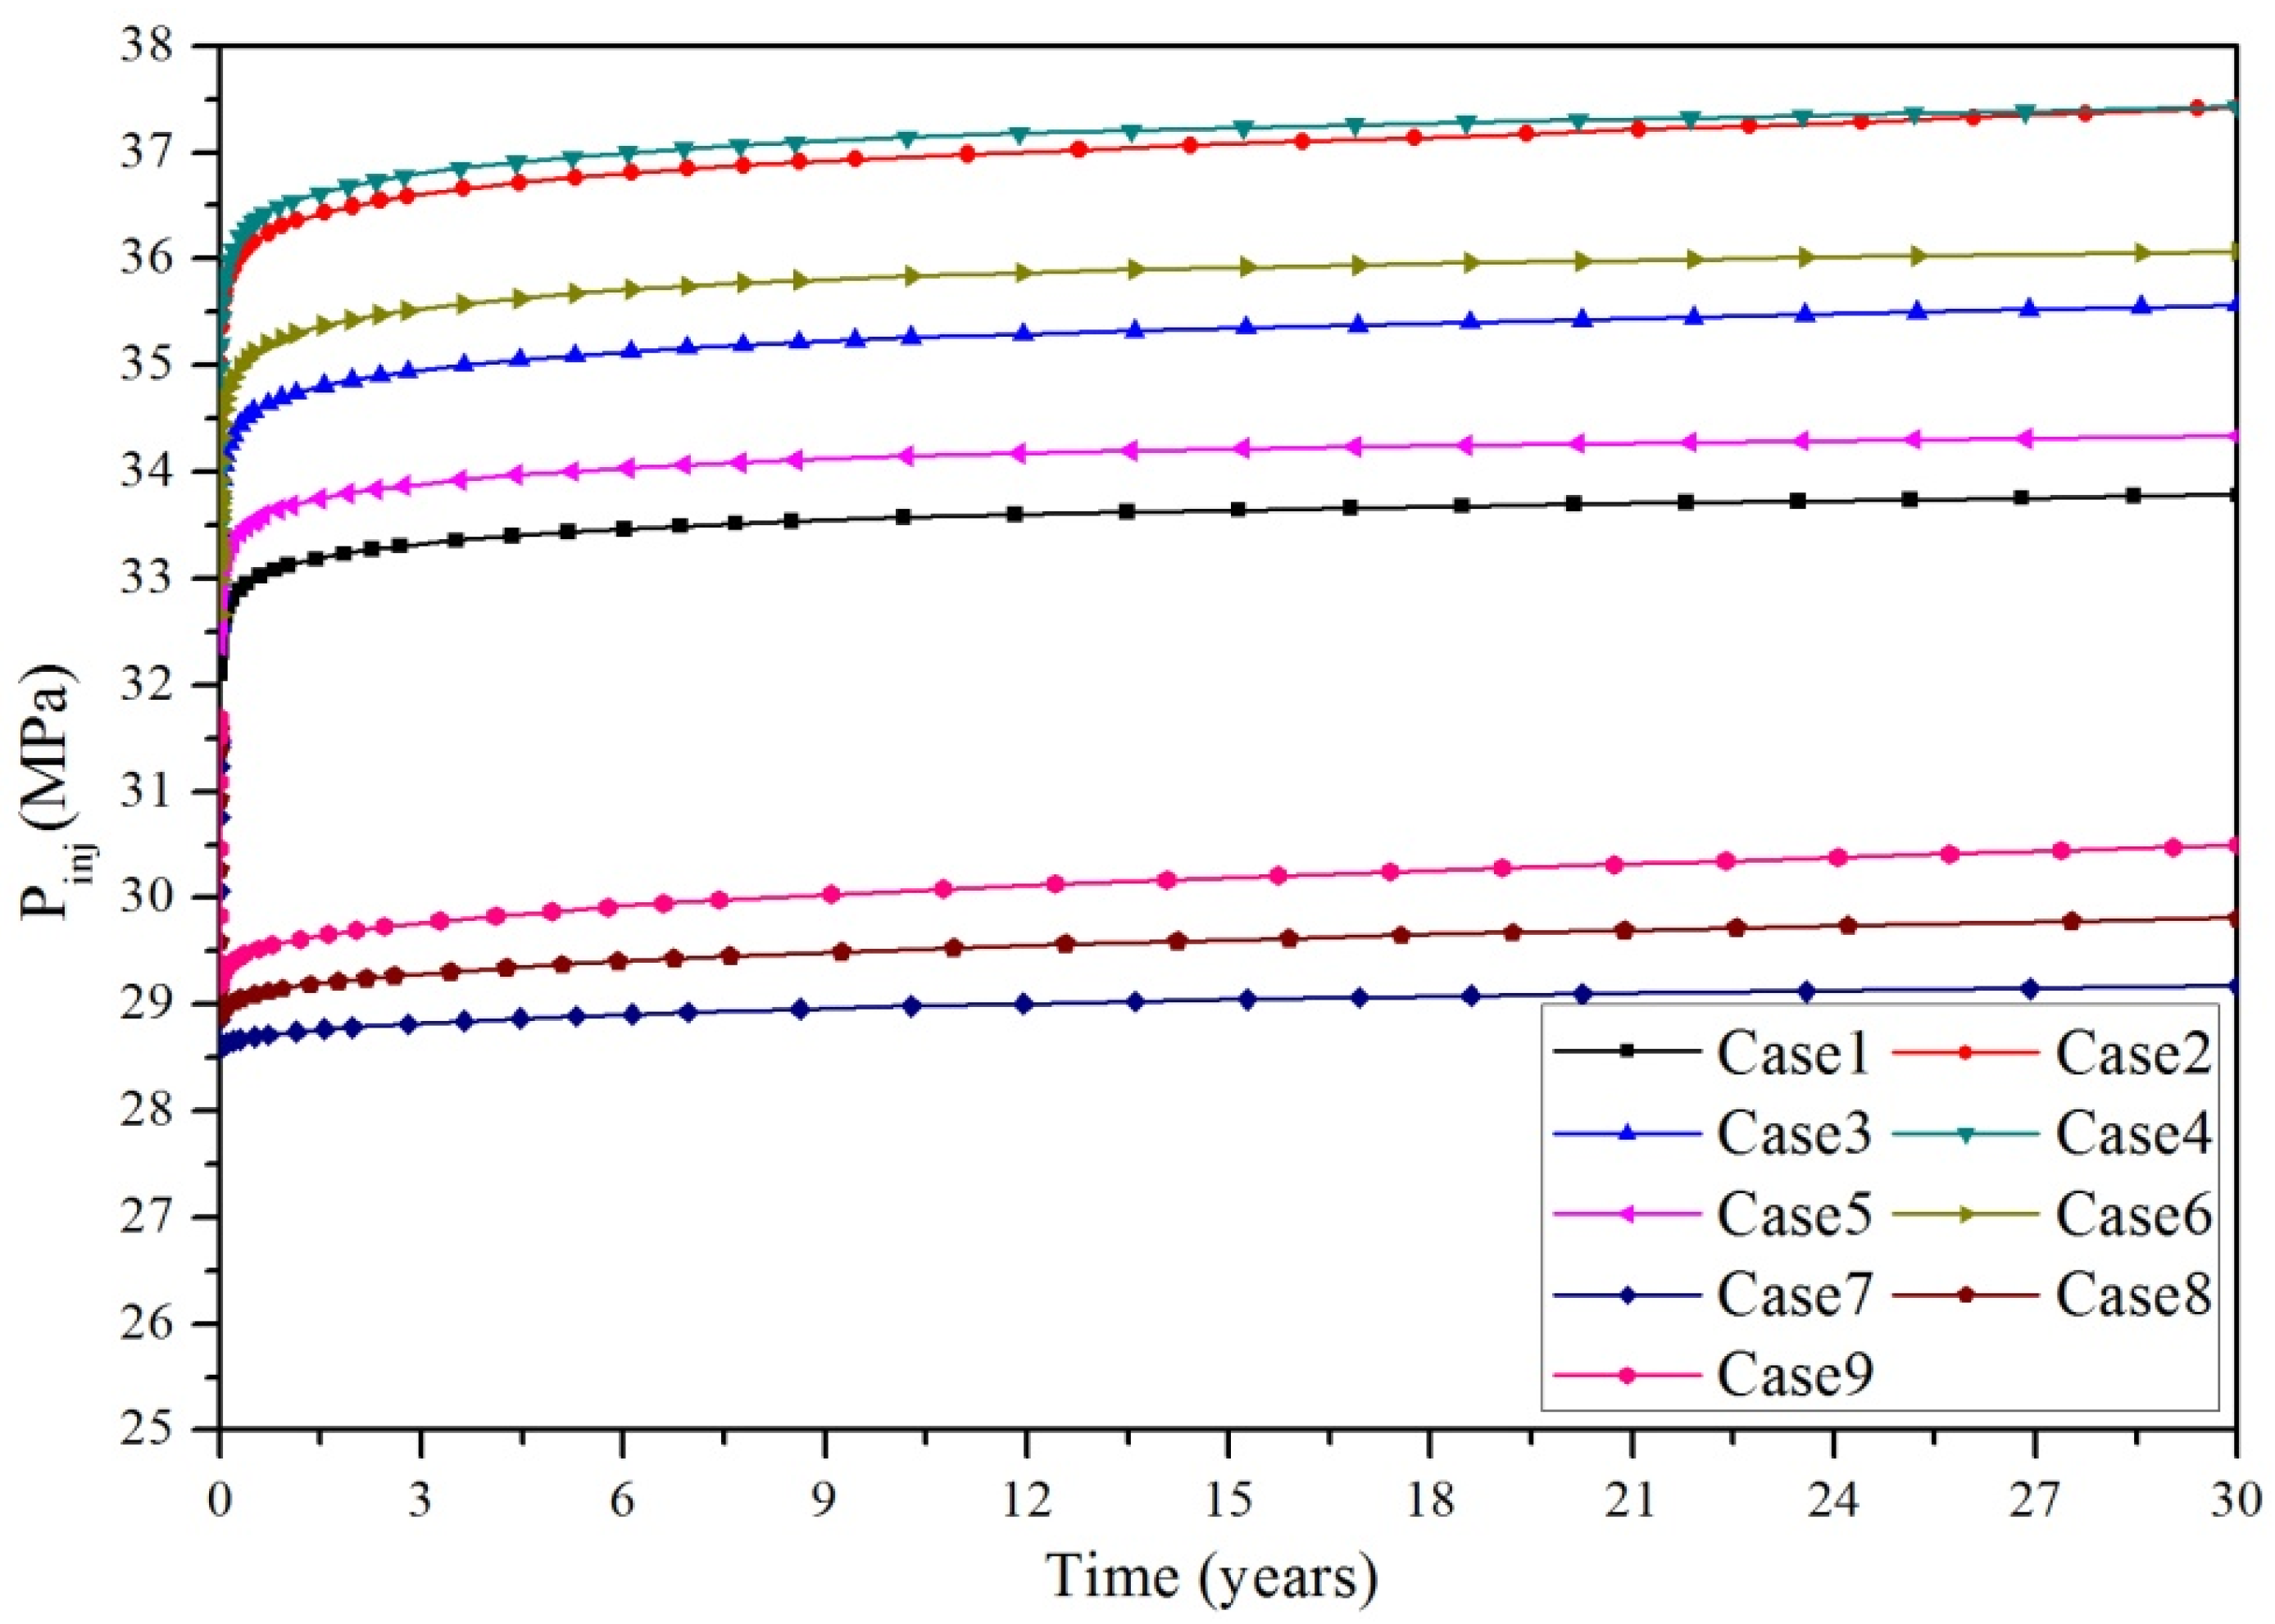
- For reservoirs of the same size of 1000 × 1000 × 500 m, because the injection pressure of the horizontal well system is far lower than that of the vertical well system, the energy efficiency of the horizontal well system is far higher than that of the vertical well system. There is no significant difference in the energy efficiency between the five vertical well system and the three vertical well system.
- (3)
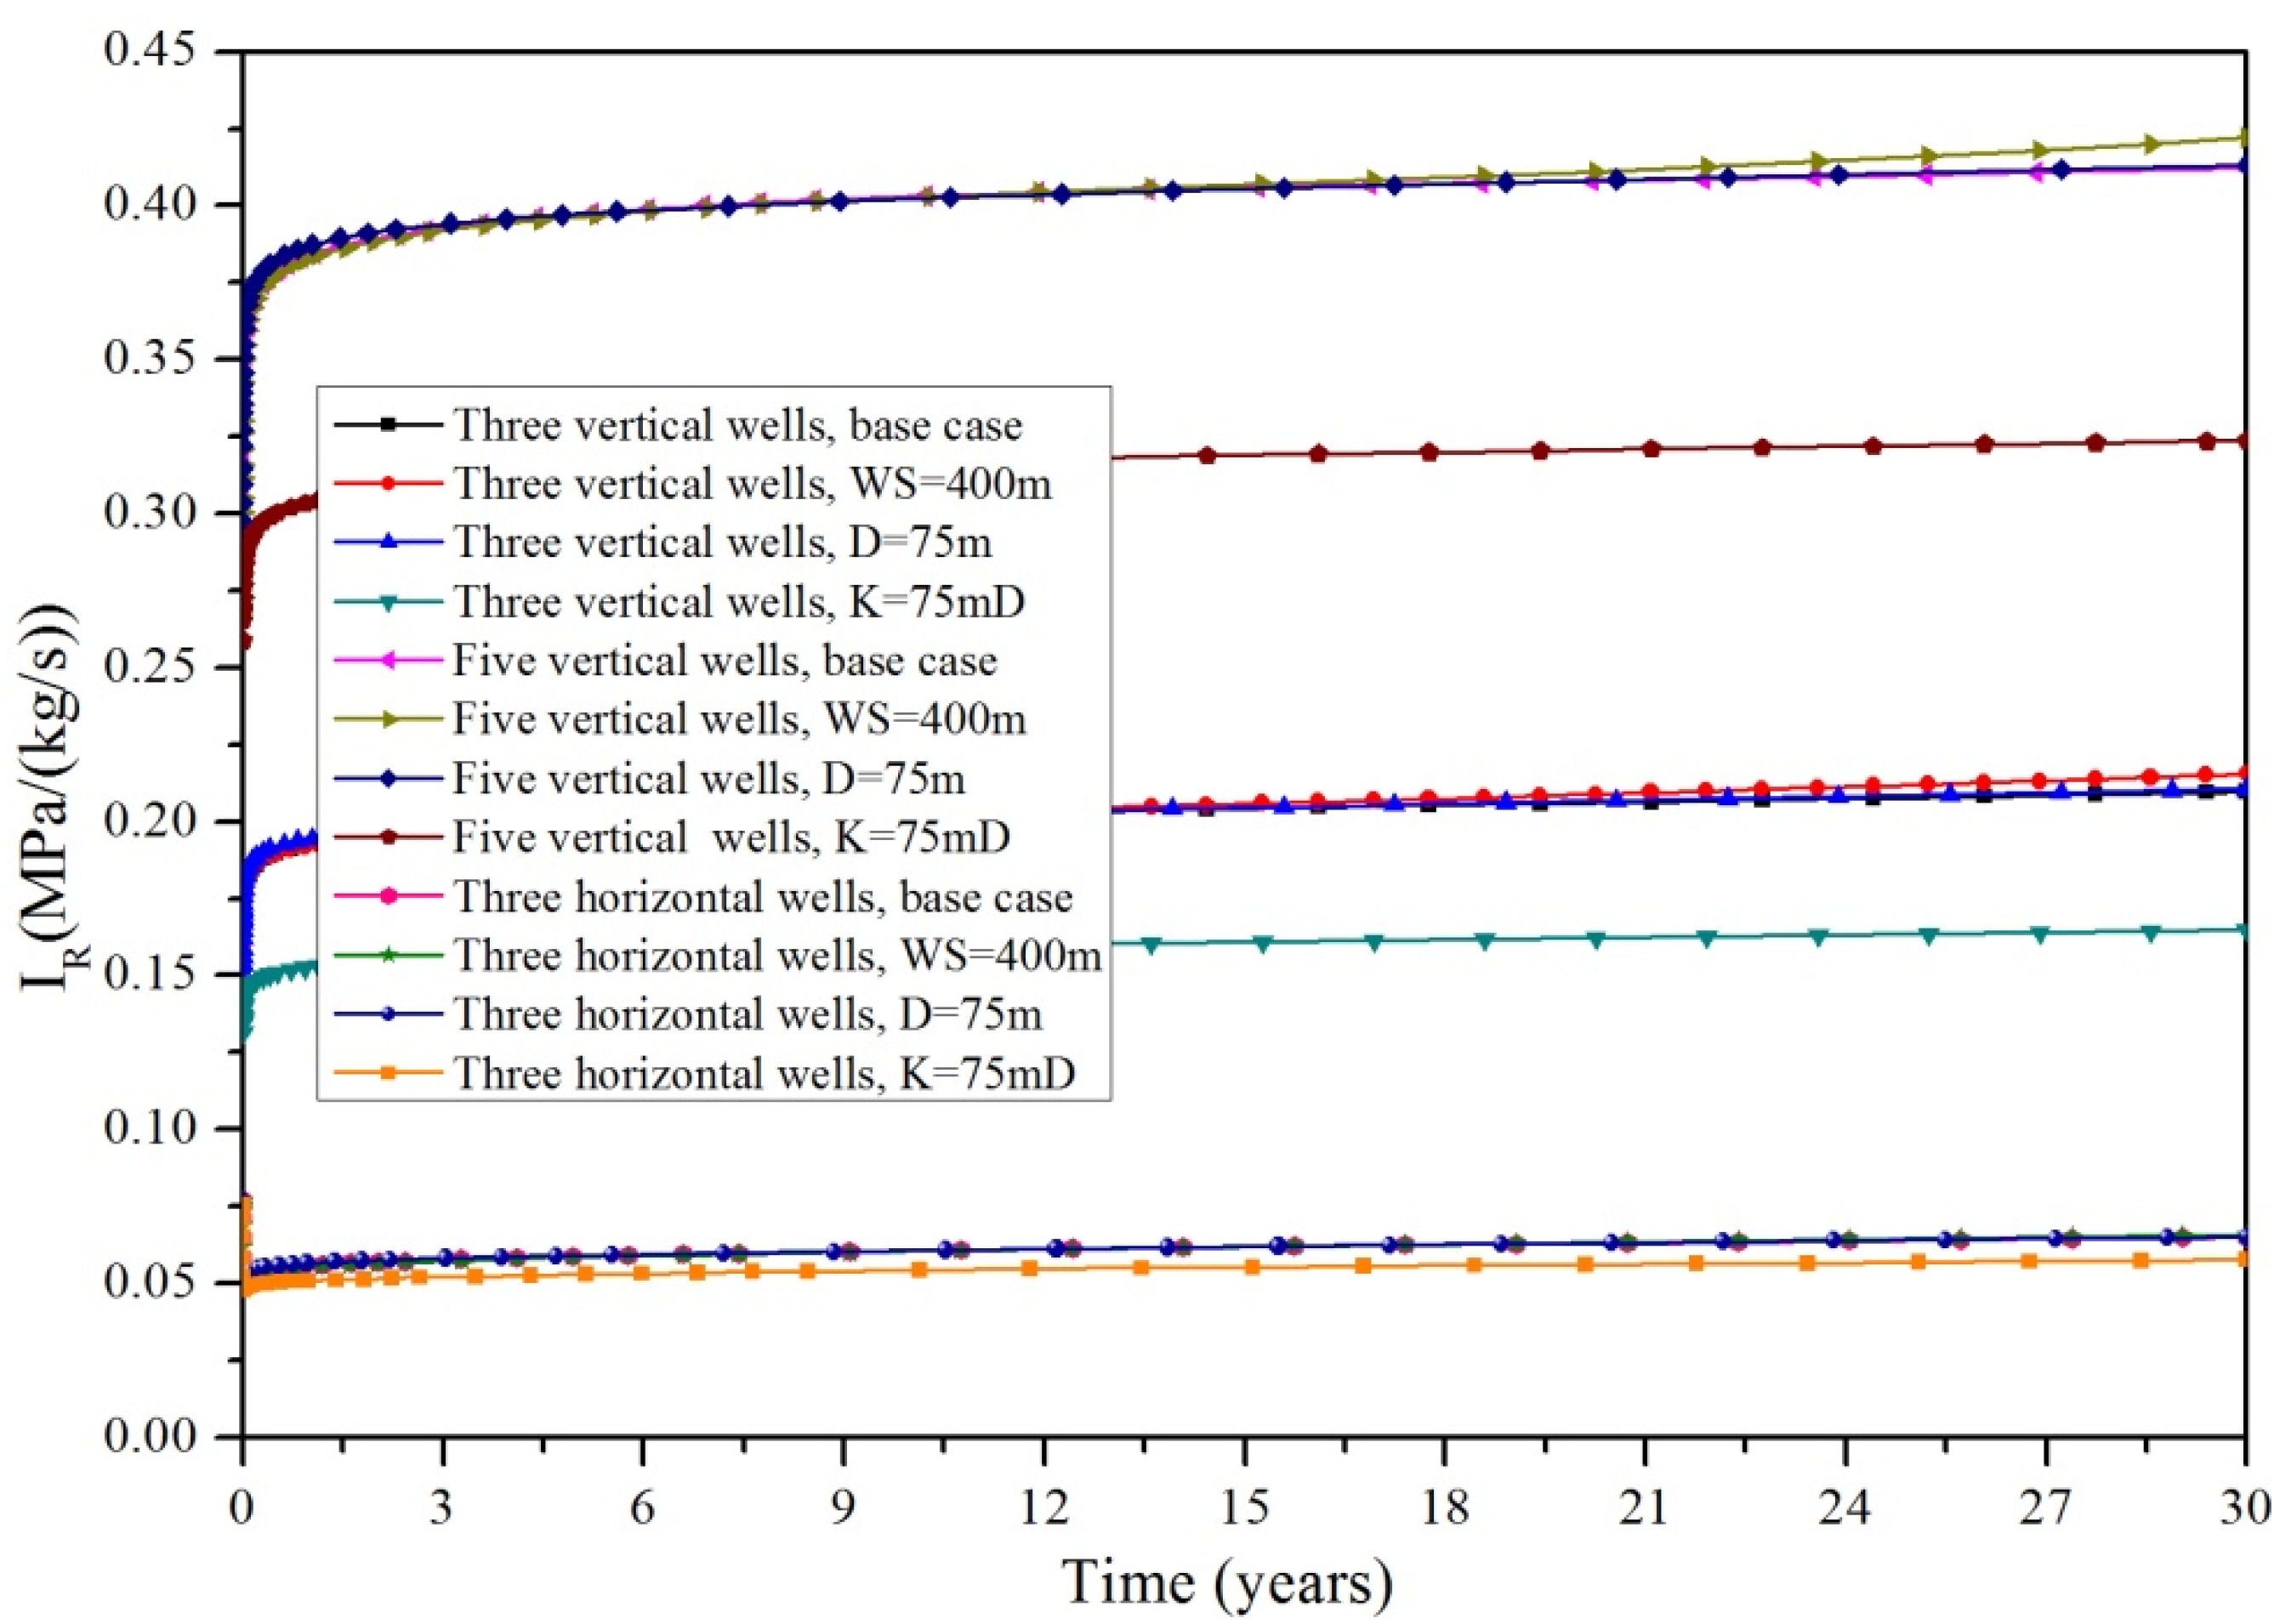
- For reservoirs of the same size of 1000 × 1000 × 500 m, the reservoir impedance of the three horizontal well system is lowest, that of the five vertical well system is highest and that of the three vertical well system is in between.
- (4)
- The well spacing has an obvious impact on the system production performance; within a certain range, decreasing well spacing will reduce the electric power, reduce the energy efficiency and have only very slight influence on the reservoir impedance.
- (5)
- The fracture spacing has an obvious impact on the production performance; within a certain range, increasing the fracture spacing will reduce the electric power, reduce the energy efficiency, and have only very slight effect on the reservoir impedance.
- (6)
- The fracture permeability has an obvious impact on the system production performance; within a certain range increasing the fracture permeability will improve the energy efficiency, reduce the reservoir impedance, and have only very slight effect on the electric power.
Author Contributions
Funding
Acknowledgments
Conflicts of Interest
Nomenclature
| g | gravity, 9.80 m/s2 |
| h | well depth, m |
| h1 | depth of injection well, m |
| h2 | depth of production well, m |
| hinj | injection specific enthalpy, kJ/kg |
| production specific enthalpy, kJ/kg | |
| IR | reservoir impedance, MPa/(kg/s) |
| k | reservoir permeability, m2 |
| kf | fracture permeability, m2 |
| km | matrix permeability, m2 |
| kx | intrinsic permeability along x, m2 |
| ky | intrinsic permeability along y, m2 |
| kz | intrinsic permeability along z, m2 |
| P | pressure, MPa |
| Pmax | critical pressure, MPa |
| injection pressure, MPa | |
| production pressure, MPa | |
| P0 | bottomhole production pressure, MPa |
| q | water production rate, kg/s |
| Q | total water production rate, kg/s |
| T | temperature, °C |
| T0 | mean heat rejection temperature, 282.15 K |
| production temperature, °C | |
| electric power of pump, MW | |
| We | electric power, MW |
| x, y, z | cartesian coordinates, m |
| reservoir porosity | |
| η | energy efficiency |
| pump efficiency, 80% | |
| ρ | water density, kg/m3 |
References
- Tester, J.W.; Livesay, B.; Anderson, B.J.; Moore, M.C.; Bathchelor, A.S.; Nichols, K.; Petty, S.; Toksoz, M.N.; Veatch, R.W.; Baria, R.; et al. The Future of Geothermal Energy: Impact Enhanc. Geotherm. Syst. (EGS) United States 21st Century; An Assessment by an MIT-led Interdisciplinary Panel; Massachusetts Institue of Technology: Cambridge, MA, USA, 2006. [Google Scholar]
- Zeng, Y.C.; Tang, L.S.; Wu, N.Y.; Cao, Y.F. Analysis of influencing factors of production performance of enhanced geothermal system: A case study at Yangbajing geothermal field. Energy 2017, 127, 218–235. [Google Scholar] [CrossRef]
- Zhao, Y.S.; Wan, Z.J.; Kang, J.R. Introduction to HDR Geothermal Development; Science Press: Beijing, China, 2004. (In Chinese) [Google Scholar]
- Wang, J.; Hu, S.; Pang, Z.; He, L.; Zhao, P.; Zhu, C.; Rao, S.; Tang, X.; Kong, Y.; Luo, L.; et al. Estimate of Geothermal Resources Potential for Hot Dry Rock in the Continental Area of China; Science & Technology Review: Beijing, China, 2012; Volume 30, pp. 25–30. (Special issues) (In Chinese) [Google Scholar]
- Genter, A.; Goerke, X.; Graff, J.; Cuenot, N.; Krall, G.; Schindler, M.; Ravier, G. Current status of the EGS soultz geothermal project (France). In Proceedings of the World Geothermal Congress 2010, Bali, Indonesia, 25–29 April 2010. [Google Scholar]
- Benato, S.; Taron, J. Desert peak EGS: Mechanisms influencing permeability evolution investigated using dual-porosity simulator TFReact. Geothermics 2016, 63, 157–181. [Google Scholar] [CrossRef]
- Schindler, M.; Baumgartner, J.; Gandy, T.; Hauffe, P.; Hettkamp, T.; Menzel, H.; Penzklfer, P.; Teza, D.; Tischner, T.; Wahl, G. Successful hydraulic stimulation techniques for electric power production in the Upper Rhine Graben, Central Europe. In Proceedings of the World Geothermal Congress 2010, Bali, Indonesia, 25–29 April 2010. [Google Scholar]
- Pruess, K. Modelling of geothermal reservoirs: Fundamental processes, computer simulation, and field applications. In Proceedings of the 10th New Zealand Geothermal Workshop, Auckland, 15 August 1988. [Google Scholar]
- Willis-richards, J.; Wallroth, T. Approaches to the modeling of HDR reservoirs: A review. Geothermics 1995, 24, 307–332. [Google Scholar] [CrossRef]
- Hayashi, K.; Willis-Richards, J.; Hopkirk, R.J.; Niibori, Y. Numerical models of HDR geothermal reservoirs- a review of current thinking and progress. Geothermics 1999, 28, 507–518. [Google Scholar] [CrossRef]
- Sanyal, S.K.; Butler, S.J.; Swenson, D.; Hardeman, B. Review of the state-of-the-art of numerical simulation of enhanced geothermal system. In Proceedings of the World Geothermal Congress; Kyushu-Tohoku, Japan, 28 May–10 June 2000. [Google Scholar]
- O’Sullivan, M.J.; Pruess, K.; Lippmann, M.J. State of the art of geothermal reservoir simulation. Geothermics 2001, 30, 395–429. [Google Scholar] [CrossRef]
- Zeng, Y.C.; Zheng, S.; Nengyou, W. Numerical simulation of heat production potential from hot dry rock by water circulating through two horizontal wells at Desert Peak geothermal field. Energy 2013, 56, 92–107. [Google Scholar] [CrossRef]
- Zeng, Y.C.; Nengyou, W.; Zheng, S. Numerical simulation of heat production potential from hot dry rock by water circulating through a novel single vertical fracture at Desert Peak geothermal field. Energy 2013, 63, 268–282. [Google Scholar] [CrossRef]
- Zeng, Y.; Nengyou, W.; Zheng, S. Numerical simulation of electricity generation potential from fractured granite reservoir through a single horizontal well at Yangbajing geothermal field. Energy 2014, 65, 472–487. [Google Scholar] [CrossRef]
- Shaik, A.R.; Rahman, S.S.; Tran, N.H.; Tran, T. Numerical simulation of fluid-rock coupling heat transfer in naturally fractured geothermal system. Appl. Therm. Eng. 2011, 31, 1600–1606. [Google Scholar] [CrossRef]
- Jiang, F.M.; Luo, L.; Chen, J.L. A novel three-dimensional transient model for subsurface heat exchange in enhanced geothermal systems. Int. Commun. Heat Mass Transf. 2013, 41, 57–62. [Google Scholar] [CrossRef]
- Jiang, F.M.; Chen, J.L.; Huang, W.B.; Luo, L. A three-dimensional transient model for EGS subsurface thermo-hydraulic process. Energy 2014, 72, 300–310. [Google Scholar] [CrossRef]
- Zeng, Y.; Zhan, J.; Nengyou, W. Numerical simulation of electricity generation potential from fractured granite reservoir through vertical wells at Yangbajing geothermal field. Energy 2016, 103, 290–304. [Google Scholar] [CrossRef]
- Zeng, Y.; Zhan, J.; Nengyou, W. Numerical investigation of electricity generation potential from fractured granite reservoir by water circulating through three horizontal wells at Yangbajing geothermal field. Appl. Therm. Eng. 2016, 104, 1–15. [Google Scholar] [CrossRef]
- Zeng, Y.; Zhan, J.; Nengyou, W. Numerical investigation of electricity generation potential from fractured granite reservoir through a single vertical well at Yangbajing geothermal field. Energy 2016, 114, 24–39. [Google Scholar] [CrossRef]
- Zeng, Y.; Tang, L.; Nengyou, W.; Song, J.; Cao, Y. Orthogonal test analysis on conditions affecting electricity generation performance of an enhanced geothermal system at Yangbajing geothermal field. Energies 2017, 10, 2015. [Google Scholar] [CrossRef] [Green Version]
- Watanabe, N.; Wang, W.Q.; McDermott, C.I.; Taniguchi, T.; Kolditz, O. Uncertainly analysis of thermo-hydro-mechanical coupled processes in heterogeneous porous media. Comput. Mech. 2010, 45, 263–280. [Google Scholar] [CrossRef]
- Mcdermott, C.I.; Randriamanjatosoa, A.R.; Tenzer, H.; Kolditz, O. Simulation of heat extraction from crystalline rocks: The influence of coupled processes on differential reservoir cooling. Geothermics 2006, 35, 321–344. [Google Scholar] [CrossRef]
- Birdsell, S.; Robinson, B. A three-dimensional model of fluid, heat, and tracer transport in the Fenton Hill hot dry rock reservoir. In Proceedings of Thirteenth Workshop on Geothermal Reservoir Engineering, Stanford University, Stanford, CA, USA, 19–21 January 1988. [Google Scholar]
- Cheng, W.-L.; Wang, C.-L.; Nian, Y.-L.; Han, B.-B.; Liu, J. Analysis of influencing factors of heat extraction from enhanced geothermal systems considering water losses. Energy 2016, 115, 274–288. [Google Scholar] [CrossRef]
- Hu, L.T.; Winterfeld, P.H.; Fakcharoenphol, P.; Wu, Y.S. A novel fully-coupled flow and geomechanics model in enhanced geothermal reservoirs. J. Pet. Sci. Eng. 2013, 107, 1–11. [Google Scholar] [CrossRef]
- Sanyal, S.K.; Butler, S.J. An analysis of power generation prospects from enhanced geothermal systems. In Proceedings of the World Geothermal Congress 2005, Antalya, Turkey, 24–29 April 2005; pp. 1–6. [Google Scholar]
- Gelet, R.; Loret, B.; Khalili, N. A thermal-hydro-mechanical coupled model in local thermal non-equilibrium for fractured HDR reservoir with double porosity. J. Geophys. Res. 2012, 117, 1–23. [Google Scholar] [CrossRef]
- Gelet, R.; Loret, B.; Khalili, N. Thermal recovery from a fractured medium in local thermal non-equilibrium. Int. J. Numer. Anal. Method Geomech. 2013, 37, 2471–2501. [Google Scholar] [CrossRef] [Green Version]
- Taron, J.; Elsworth, D.; Min, K.B. Numerical simulation of thermal-hydrologic-mechanical-chemical processes in deformable, fractured porous media. Int. J. Rock Mech. Min. Sci. 2009, 46, 842–854. [Google Scholar] [CrossRef]
- Taron, J.; Elsworth, D. Thermal-hydrologic-mechanical-chemical processes in the evolution of engineered geothermal reservoirs. Int. J. Rock Mech. Min. Sci. 2009, 46, 855–864. [Google Scholar] [CrossRef]
- Pruess, K. Enhanced geothermal system (EGS) using CO2 as working fluid-A novel approach for generating renewable energy with simultaneous sequestration of carbon. Geothermics 2006, 35, 351–367. [Google Scholar] [CrossRef] [Green Version]
- Pruess, K. On production behavior of enhanced geothermal systems with CO2 as working fluid. Energy Convers. Manag. 2008, 49, 1446–1454. [Google Scholar] [CrossRef] [Green Version]
- Spycher, N.; Pruess, K. A phase-partitioning model for CO2-brine mixtures at elevated temperatures and pressures: Application to CO2-enhanced geothermal systems. Transp. Porous Media 2010, 82, 173–1796. [Google Scholar] [CrossRef] [Green Version]
- Borgia, A.; Pruess, K.; Kneafsey, T.J.; Oldenburg, C.M.; Pan, L. Numerical simulation of salt precipitation in the fractures of a CO2-enhanced geothermal system. Geothermics 2012, 44, 13–22. [Google Scholar] [CrossRef]
- Xu, T.F.; Yuan, Y.L.; Jia, X.F.; Lei, Y.D.; Li, S.T.; Feng, B.; Hou, Z.Y.; Jiang, Z.J. Prospects of power generation from an enhanced geothermal system by water circulation through two horizontal wells: A case study in the Gonghe Basin, Qinghai Province, China. Energy 2018, 148, 196–207. [Google Scholar] [CrossRef]
- Zeng, Y.; Tang, L.; Wu, N.; Cao, Y. Numerical simulation of electricity generation potential from fractured granite reservoir using the MINC method at the Yangbajing geothermal field. Geothermics 2018, 75, 122–136. [Google Scholar] [CrossRef]
- Kolditz, O.; Clauser, C. Numerical simulation of flow and heat transfer in fractured crystalline rocks: Application to the hot dry rock site in Rosemanowes. Geothermics 1998, 27, 1–23. [Google Scholar] [CrossRef]
- Kolditz, O. Modelling flow and heat transfer in fractured rocks: Conceptual model of a 3-D deterministic fracture network. Geothermics 1995, 24, 451–470. [Google Scholar] [CrossRef]
- Jing, Z.; Willis-Richards, J.; Hashida, K.W. A three-dimensional stochastic rock mechanics model of engineered geothermal systems in fractured crystalline rock. J. Geophys. Res. 2000, 105, 23663–23679. [Google Scholar] [CrossRef]
- Jing, Z.; Watanabe, K.; Willis-Richards, J.; Hashida, T. A 3-D water/rock chemical interaction model for prediction of HDR/HWR geothermal reservoir performance. Geothermics 2002, 31, 1–28. [Google Scholar] [CrossRef]
- Jing, Y.N.; Jing, Z.Z.; Willis-Richards, J.; Hashida, T. A simple 3-D thermoelastic model for assessment of the long-term performance of the Hijiori deep geothermal reservoir. J. Volcanol. Geotherm. Res. 2014, 269, 14–22. [Google Scholar] [CrossRef]
- Baujard, C.; Bruel, D. Numerical study of the impact of fluid density on the pressure distribution and stimulated volume in the Soultz HDR reservoir. Geothermics 2006, 35, 607–621. [Google Scholar] [CrossRef]
- Sun, Z.X.; Zhang, X.; Xu, Y.; Yao, J.; Wang, H.X.; Lv, S.H.; Sun, Z.L.; Huang, Y.; Cai, M.Y.; Huang, X.X. Numerical simulation of the heat extraction in EGS with thermal-hydraulic-mechanical coupling method based on discrete fractures model. Energy 2017, 120, 20–33. [Google Scholar] [CrossRef]
- Yao, J.; Zhang, X.; Sun, Z.X.; Huang, Z.Q.; Liu, J.R.; Li, Y.; Xin, Y.; Yan, X.; Liu, W.Z. Numerical simulation of the heat extraction in 3D-EGS with thermal-hydraulic-mechanical coupling method based on discrete fractures model. Geothermics 2018, 74, 19–34. [Google Scholar] [CrossRef]
- Chen, J.L.; Luo, L.; Jiang, F.M. Analyzing heat extraction and sustainability of EGS with a novel model. J. Earth Sci. Eng. 2013, 3, 690–700. [Google Scholar]
- Chen, J.L.; Jiang, F.M. Designing multi-well layout for enhanced geothermal system to better exploit hot dry rock geothermal energy. Renew. Energy 2015, 74, 37–48. [Google Scholar] [CrossRef]
- Chen, J.L.; Jiang, F.M. A numerical study of EGS heat extraction process based on a thermal non-equilibrium model for heat transfer in subsurface porous heat reservoir. Heat Mass Transf. 2016, 52, 255–267. [Google Scholar] [CrossRef]
- Cao, W.J.; Huang, W.B.; Jiang, F.M. Numerical study on variable thermophysical properties of heat transfer fluid affecting EGS heat extraction. Int. J. Heat Mass Transf. 2016, 92, 1205–1217. [Google Scholar] [CrossRef]
- Cao, W.J.; Huang, W.B.; Jiang, F.M. A novel thermal-hydraulic-mechanical model for the enhanced geothermal system heat extraction. Int. J. Heat Mass Transf. 2016, 100, 661–671. [Google Scholar] [CrossRef] [Green Version]
- Pruess, K.; Oldenburg, C.; Moridis, G. TOUGH2 User’s Guide, Version 2.0.; Lawrence Berkeley National Laboratory: Berkeley, CA, USA, 1999. [Google Scholar]


| Project Name | Location | Reservoir Temperature (°C) | Reservoir Depth (km) | Well Design | Generating Capacity (MWe) |
|---|---|---|---|---|---|
| Soultz EGS | France | 200 | 5 | Three vertical wells | 1.5 |
| Desert Peak EGS | USA | 210 | 1.771 | Two vertical wells | 1.7 |
| Landau EGS | Germany | 160 | 2.1~2.2 | Two vertical wells | 3 |
| Cooper Basin | Australia | 250 | 4 | Two vertical wells | 6 |
| Parameter | Value |
|---|---|
| Rock grain density | 2650 kg/m3 |
| Rock specific heat | 1000 J/(kg·K) |
| Rock heat conductivity | 2.50 W/(m·K) |
| Fracture system volume fraction | 2% |
| Fracture spacing | 50 m |
| Porosity in fracture system | 0.5 |
| Porosity in matrix | 1.0 × 10⁻⁵ |
| Permeability in fracture system | 50 × 10−15 m2 |
| Permeability in matrix | 1.0 × 10⁻¹⁸ m2 |
| Injection temperature | 60 °C (277.221 kJ/kg) |
| Bottomhole production pressure | 24.0 MPa |
| Productivity index | 5.0 × 10⁻¹² m3 |
| Case Number | Well Layout | Simulated Water Production Rate (kg/s) | Total Water Production Rate (kg/s) |
|---|---|---|---|
| 1 | Three vertical wells | 20 | 80 |
| 2 | Three vertical wells | 32 | 128 |
| 3 | Three vertical wells | 26 | 104 |
| 4 | Five vertical wells | 32.6 | 130.4 |
| 5 | Five vertical wells | 22 | 88 |
| 6 | Five vertical wells | 28 | 112 |
| 7 | Three horizontal wells | 0.5 | 100 |
| 8 | Three horizontal wells | 0.75 | 150 |
| 9 | Three horizontal wells | 1.0 | 200 |
Publisher’s Note: MDPI stays neutral with regard to jurisdictional claims in published maps and institutional affiliations. |
© 2021 by the authors. Licensee MDPI, Basel, Switzerland. This article is an open access article distributed under the terms and conditions of the Creative Commons Attribution (CC BY) license (https://creativecommons.org/licenses/by/4.0/).
Share and Cite
Zeng, Y.; Sun, F.; Zhai, H. Numerical Study on the Influence of Well Layout on Electricity Generation Performance of Enhanced Geothermal Systems. Processes 2021, 9, 1474. https://doi.org/10.3390/pr9081474
Zeng Y, Sun F, Zhai H. Numerical Study on the Influence of Well Layout on Electricity Generation Performance of Enhanced Geothermal Systems. Processes. 2021; 9(8):1474. https://doi.org/10.3390/pr9081474
Chicago/Turabian StyleZeng, Yuchao, Fangdi Sun, and Haizhen Zhai. 2021. "Numerical Study on the Influence of Well Layout on Electricity Generation Performance of Enhanced Geothermal Systems" Processes 9, no. 8: 1474. https://doi.org/10.3390/pr9081474
APA StyleZeng, Y., Sun, F., & Zhai, H. (2021). Numerical Study on the Influence of Well Layout on Electricity Generation Performance of Enhanced Geothermal Systems. Processes, 9(8), 1474. https://doi.org/10.3390/pr9081474