Article

Study on the Flow Characteristics of Desulfurization Ash Fine Particles in a Circulating Fluidized Bed

State Key Laboratory of Heavy Oil Processing, China University of Petroleum (Beijing), Beijing 102249, China
*
Author to whom correspondence should be addressed.
Processes 2021, 9(8), 1343; https://doi.org/10.3390/pr9081343
Submission received: 15 June 2021 / Revised: 26 July 2021 / Accepted: 26 July 2021 / Published: 30 July 2021

Abstract

:
In view of the current status of catalytic cracking flue gas treatment, it is necessary to study the flow environment of desulfurization ash particles, which are a type of Geldart C particle, in a circulating fluidized bed (CFB) for semi-dry flue gas desulphurization using CFB technology. This study investigated the flow characteristics of desulphurization ash particles in a riser with an inner diameter of 70 mm and a height of 12.6 m, at a gas velocity of 4–7 m/s and a solids circulation rate of 15–45 kg/m2·s. The solids holdup in the axial distribution is relatively high near the bottom of the riser, and gradually decreases as the riser height increases, with a stable value from the middle to the top of the riser. In the radial distribution, the solids holdup of desulfurization ash particles is low in the center and high in the wall region. Within the above operating conditions, the solids holdup ranges from 0.008 to 0.025. The particle-based Archimedes number has a linear relationship with the solids holdup at all operating conditions.

1. Introduction

The 2018 environmental statistics report shows that China’s total SO2 emissions reached 1859.5 tons, of which more than 80% came from coal combustion and refineries. In refinery flue gas, catalytic cracking flue gas accounted for more than 62% of the total [1]. According to the requirements of “Comprehensive implementation of ultra-low emission and energy-saving transformation work plan for coal-fired power plants”, by 2020 the mass concentration of SO2 emissions should be not higher than 35 mg/m3. Therefore, the flue gas must be purified [2].
At present, there are many methods for treating flue gas in China and abroad [3,4,5,6,7]. According to the state of the desulfurizer, it is divided into three types: the wet method [8,9,10,11], the dry method [12], and the semi-dry method [13,14,15]. Among these, the wet flue gas desulfurization method has the highest market share. In wet flue gas desulfurization, limestone-gypsum flue gas desulfurization technology has the greatest market share, of up to 82.8%, and the desulfurization efficiency is more than 90% [16]. The market share is mainly divided into other wet flue gas desulfurization and circulating fluidized bed (CFB) flue gas desulfurization methods [17]. However, the wet flue gas desulfurization method also has limitations, such as its requirements of a significant area and large investment, high water consumption, and generation of significant amounts of waste water, waste gas, and waste residue (the “three wastes”). Water consumption of the limestone-gypsum method can reach 0.45 t/MW·h. By comparison, for circulating fluidized bed (CFB) flue gas desulfurization, which has a similar investment cost to that of the limestone-gypsum method, the water consumption can be reduced by nearly half [18,19]. In thermal power generation, the annual water saving can reach more than 100,000 tons, and the “three wastes” produced are also reduced by orders of magnitude [20,21]. However, the utilization rate of the desulfurizer in the circulating fluidized bed flue gas desulfurization is relatively low, and the desulfurization efficiency is 80-85%, and thus lower than that of the wet method [22,23,24]. As shown in Table 1, many scholars have studied the flue gas desulfurization process by experiment or simulation [25,26,27,28,29].
Table 1 shows that research on circulating fluidized bed flue gas desulfurization is mostly focused on improving the adsorbent’s adsorbability [30,31,32,33,34,35,36,37], improving the pore structure of the adsorbent [31,38,39,40], and establishing different desulfurization models [41,42,43] to improve the utilization rate of the desulfurizing agent. Li et al. [42] established a mass balance model using fast hydrating adsorbents, and predicted the system status from the aspects of particle wear, particle residence time, particle segregation, and the desulfurization process, and optimized operating conditions. Studies indicated that the circulating ash adsorbent has a better desulfurization effect and higher desulfurization efficiency than the fly ash adsorbent, which is beneficial to the mass balance of the circulating fluidized bed desulfurization system. You et al. [30] used the corrected population balance model of the circulating fluidized bed flue gas desulfurization system to analyze the impact of model parameters, reactor structure, operating conditions, and adhesion carrier particles on the population balance of the circulating fluidized bed flue gas desulfurization system. Yang et al. [8] established a static balance calculation model for CFB boilers with coal ash as the bed material, focusing on the ash formation characteristics, ash abrasion level, particle residence time, particle stratification, and other important factors that affect the ash balance of the circulating fluidized bed. It can be seen that scholars have undertaken less research on the flow characteristics of desulphurization ash particles in the reactor.
It is well known that the distribution of particle flow characteristics in the reactor has a significant influence on the efficiency of the desulfurization reaction and the utilization rate of the desulfurizer. Therefore, it is necessary to study the flow characteristics of desulfurization ash particles in a circulating fluidized bed. In this study, systematic research was carried out in a circulating fluidized bed with an inner diameter of 0.7 mm and a height of 12.6 m. The gas velocity (Ug) was 5–7 m/s and the solids circulation rate (Gs) was 15–45 kg/m2·s. The distribution of the solids holdup, including the axial and radial distribution of the solids holdup of desulphurization ash particles, was investigated. The experimental data indicate that the solids holdup of the desulphurization ash particles is correlated with flow parameters.

2. Experimental Setup and Particle Properties

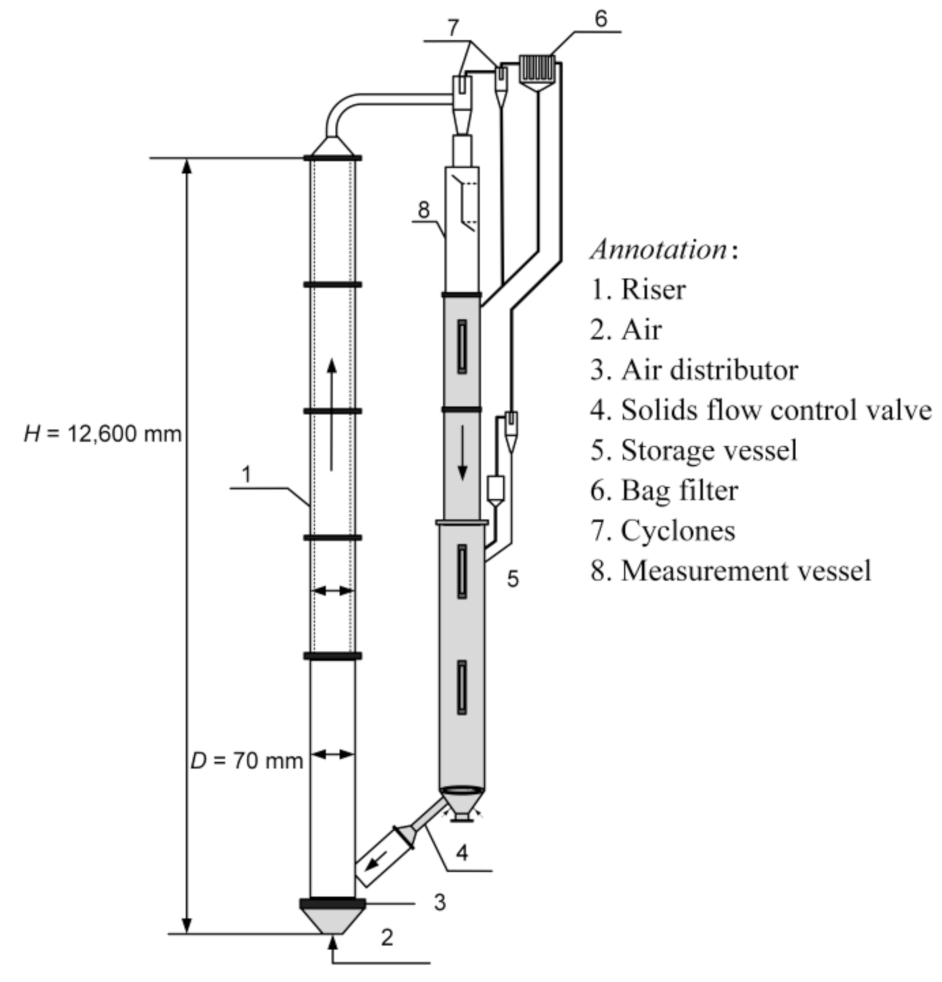
2.1. Experimental Setup

The experimental setup was built by the State Key Laboratory of Heavy Oil, China University of Petroleum (Beijing), as shown in Figure 1.
As shown in the figure, the main part of the equipment is composed of a riser, a gas–solids separation system, a storage tank, and a solids recovery system. To facilitate the observation of the flow characteristics in the circulating fluidized bed, the main structure of the riser is made of plexiglass. To ensure its mechanical strength and stability, the riser is reinforced with inlaid steel plates. To reduce the accumulation of static electricity during the experiment, the entire system was grounded. The gas–solids separation system is composed of a three-stage cyclone separator, and the outlet of each cyclone is connected with a bag filter to fully separate gas and solids. This can achieve high particle separation efficiency of up to 99%. The solids circulation equipment includes a downer with an inner diameter of 215 mm and a storage tank with an inner diameter of 317 mm. The total quantity of particles that can be stored is 400 kg, and its equivalent height may be 10 m, which facilitates the realization of experimental operations within a wider range of operating conditions. The gases used in this study, including the main air and the aeration air, were air at ambient temperature, provided by a compressor, at a rate of up to 32 Nm3 per minute at 700 kPa.
The solids holdup was obtained using an optical fiber probe (Model PV6D) developed by the Institute of Processing Engineering, Chinese Academy of Sciences, Beijing, China. Detailed information of the calibration process was elaborated in a previous study by Zhang et al. [44]. The calculation of the solids holdup can be found in the research of Wang et al. [45].

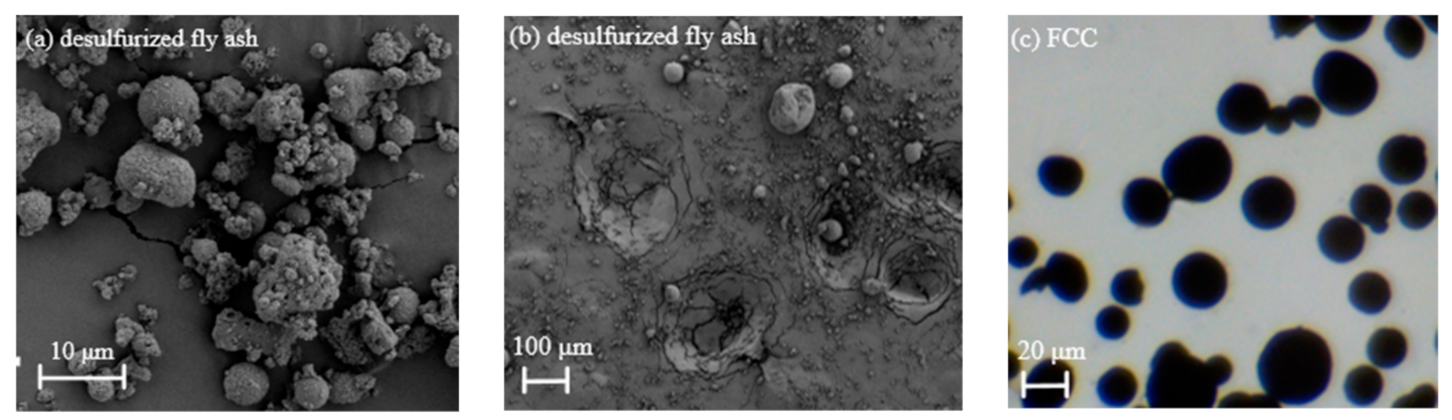
2.2. Particle Properties

Particle properties are important for fluidization and setup operation. Properties including the particle shape, particle density, and particle size distribution were tested by SEM. Figure 2a,b shows the SEM images of desulfurization ash particles at different magnification ratios. As can be seen, the particle size of most particles is less than 10 μm. Most of the particles are spherical. Figure 2c is an optical microscope photograph of the FCC particles used in the experiment conducted by Wang [46] (the instrument model is an Evergreen ST). By comparing these three figures, it can be easily seen that the desulfurization ash particles are a type of Geldart C particle, to some extent [47].
The density measurement of the desulphurization ash particles resulted in a particle density of 1788 kg/m3 and a bulk density of 722 kg/m3. The measured particle size distribution of the desulphurization ash is shown in Table 2. The angle of repose is a parameter that can be used to indicate the fluidization state of the particles. Based on the results, the angle of repose for the desulphurization ash particles is 52.6°, whereas the angle of repose for FCC particles is 32°. According to the research of Geldart et al. [48], the flow properties of the desulphurization ash particles are significantly poorer than those of FCC particles.

3. Results

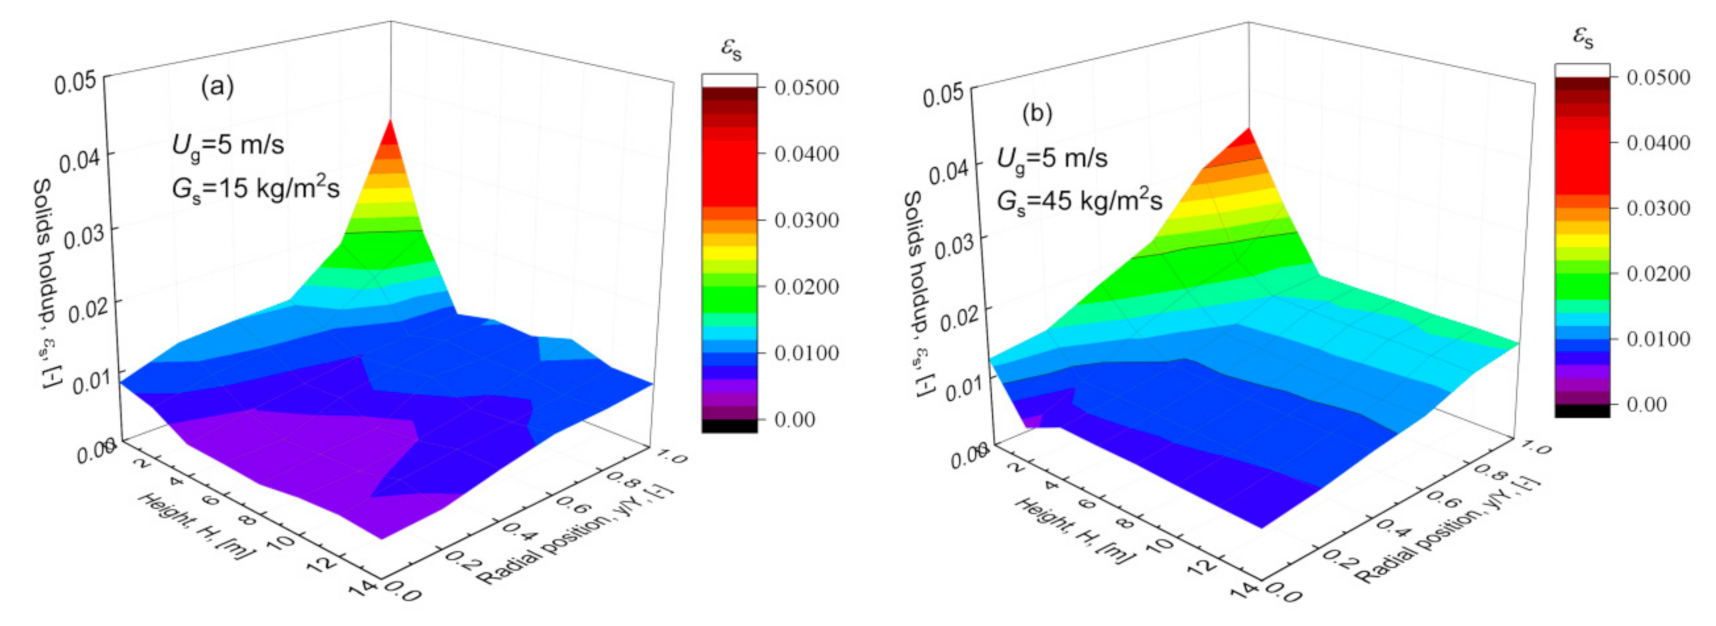
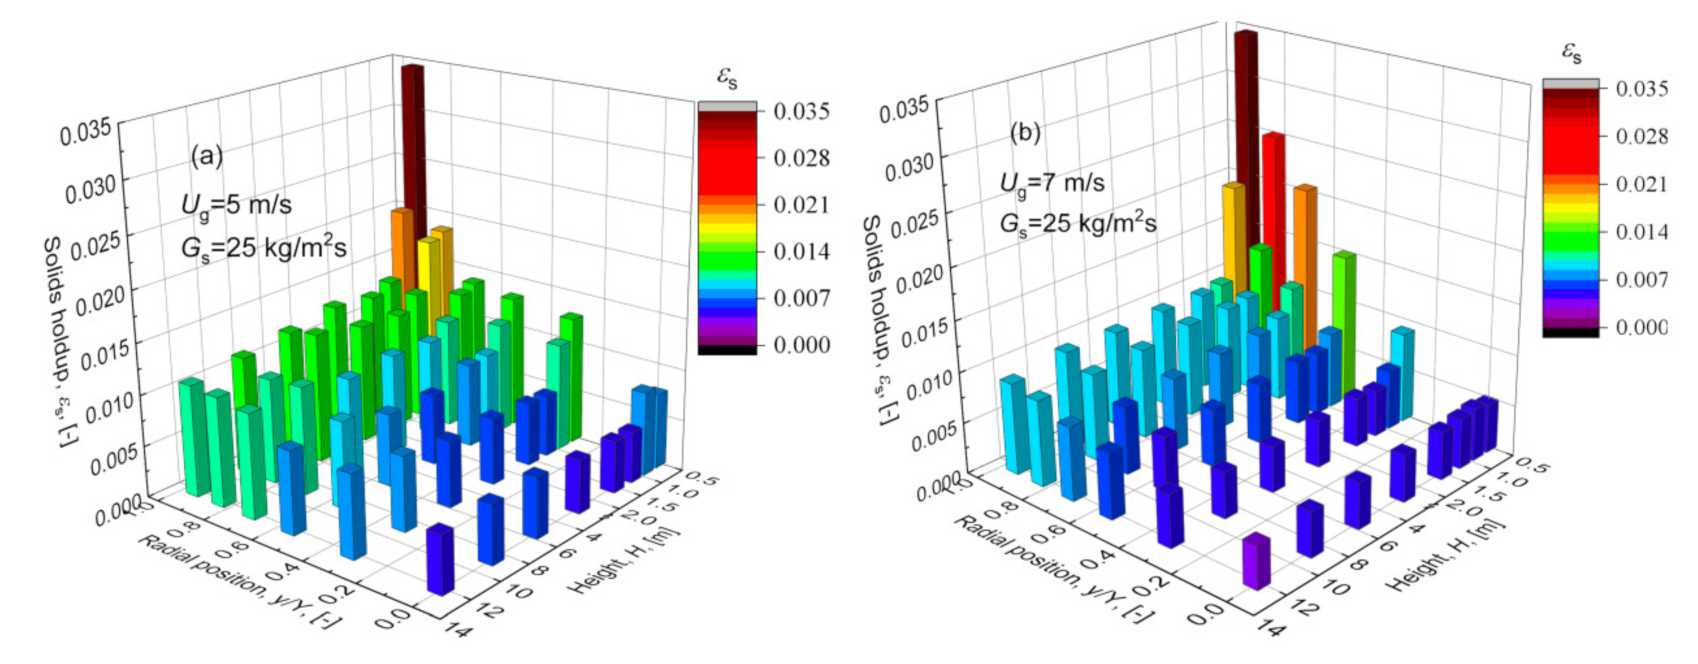
3.1. Distribution of Solids Holdup of Desulphurization Ash Particles

Figure 3 compares the cross-sectional averaged solids holdup (averaged solids holdup, ε s ¯ ) of the desulphurization ash particles processed on the basis of the pressure signal and the optical fiber probe [49,50]. It can be seen that the distribution characteristics of the solids holdup for the desulphurization ash particles obtained by the two methods are similar across the entire axial position of the riser. The averaged solids holdup of the desulphurization ash particles shows that solids holdup decreases with the increase in the riser height. After reaching a certain height, the solids holdup no longer decreases and remains stable. Therefore, the following experimental results and discussions mainly relate to the fiber probe method.
Figure 4 shows the radial distribution diagram of the solids holdup under different operating conditions. The radial distribution shows a tendency in which the solids holdup in the central area is lower, and is slightly higher towards the wall region.
Compared with the literature data [34], the radial distribution of the solids holdup is similar to that in the research of Wang [34]. There is also some difference between these two studies. It can be seen that the solids holdup near the wall region is higher in the research of Wang et al. [34]. This is mainly due to the different experimental setup. Wang et al. [34] conducted a discrete particle simulation to study the agglomeration behavior of C particles in a riser with an inner diameter of 50 mm and a height of 2.5 m. In this study, the experimental setup was much higher than that of Wang et al. [34]. The diameter of the riser in this study is also much larger than that of Wang et al. [34]. The flow of the desulphurization ash can be well developed in a larger riser, thus ensuring that the solids holdup distribution is more uniform in the radial direction. Therefore, the difference in the solids holdup between the center and the wall region is smaller in our study. In addition, it can be clearly seen that, with the increase in the superficial gas velocity from 5 to 7 m/s at a solids circulation rate of 15 kg/m2·s, the solids holdup of the desulphurization ash decreases at all radial positions. By comparison, at a fixed superficial gas velocity of 5 m/s, the solids holdup increases when the solids circulation rate increases from 15 to 35 kg/m2·s.

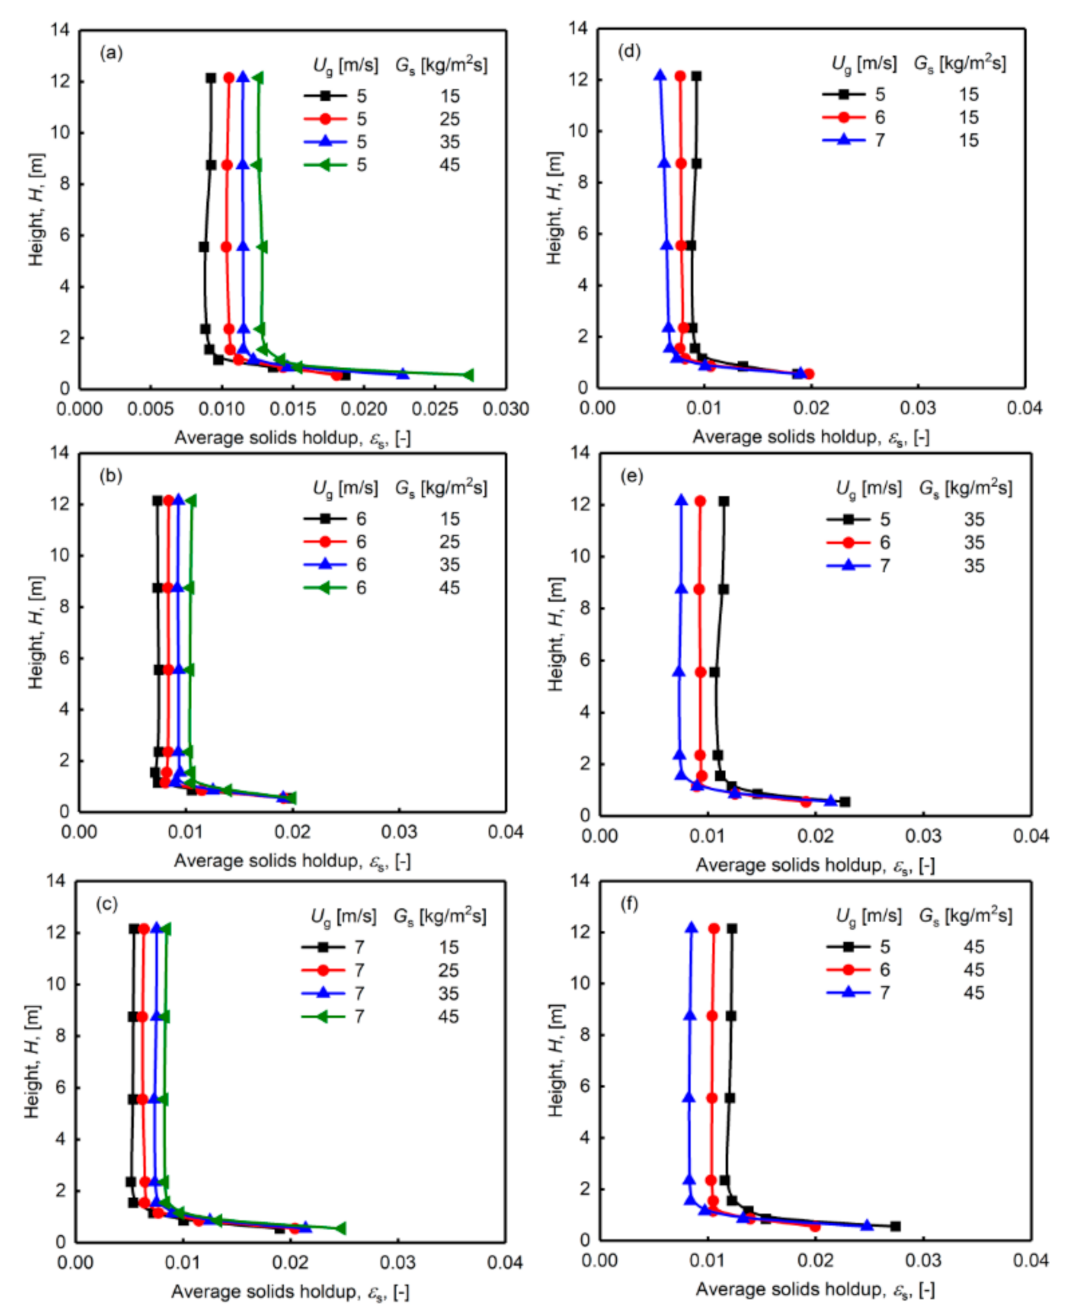
3.2. Influence of Operating Conditions on Solids Holdup of Desulphurization Ash Particles

Figure 5 shows the distribution of the solids holdup along the riser under different operating conditions. In general, it can be seen that the solids holdup at the bottom of the riser is relatively high, and the solids holdup decreases rapidly with the increase in the axial height, and then gradually stabilizes. This is because in this area where the inlet velocity of the particles is low, particles cannot be accelerated rapidly, so retention of the particles occurs. Therefore, the solids holdup is relatively high at the base of the riser. Particles are then followed upwards associated with the gas from the distributor. With the increase in the velocity caused by the acceleration of the gas, more particles are accelerated and carried upwards, resulting in a reduction of the solids holdup along the riser.
Figure 5a–c shows the changes of the solids holdup under different solids circulation rates at a certain superficial gas velocity. It can be seen that the solids holdup of the desulfurization ash particles changes with the solids circulation rate. The solids holdup gradually increases with the increase in the solids circulation rates. As shown in Figure 5a, when Ug = 5 m/s, and Gs = 15 and 45 kg/m2·s, the solids holdup values of desulphurization ash particles are 0.008 and 0.011, respectively, with a difference of 0.003. In Figure 5c, when Ug = 7 m/s, and Gs are 15 and 45 kg/m2·s, the solids holdup values of the desulphurization ash particles are 0.007 and 0.008, respectively, with a difference of 0.001. The change is more obvious when the gas velocity is lower, which indicates that the solids holdup is more sensitive to the change in the solids circulation rate at a lower superficial gas velocity.
Figure 5d–f shows the solids holdup of desulphurization ash particles at different gas velocities under a certain solids circulation rate. It can be seen that the desulfurization ash particles gradually decrease with the increase in gas velocity. In addition, this is more obvious at a higher solids circulation rate. As shown in Figure 5d, when Gs = 15 kg/m2·s, and Ug = 5 and 7 m/s, the solids holdup values are 0.008 and 0.007, and the difference between the two is 0.001. In Figure 5f, when Gs = 45 kg/m2·s, and Ug = 5 and 7 m/s, the solids holdup values are 0.011 and 0.008, with a difference of 0.003.
Figure 6 shows the radial distribution of the solids holdup under different operating conditions. Generally, the solids holdup of desulphurization ash particles in the radial position is low in the central area at all operating conditions, and gradually increases when the radial position moves from the central area to the wall.
Figure 6a–c shows the radial distribution of the solids holdup under a certain superficial gas velocity. It can be seen that when the gas velocity is constant, the solids holdup of the desulphurization ash particles increases with the increase in the solids circulation rate. The solids holdup values of different radial regions have different sensitivities to the circulation. At lower gas velocities, the changes in the riser center and wall region are similar. In Figure 6a, at Ug = 5 m/s, with Gs = 15 and 45 kg/m2·s, the solids holdup values in the central area are 0.0054 and 0.0072. The difference is 0.0018 due to the changes in the solids circulation rate. The solids holdup values near the wall area are 0.0114 and 0.0142. The difference is 0.0028. When the superficial gas velocity is higher, the solids holdup of the wall area is more prominently affected by the solids circulation rate than in the center area. As shown in Figure 6c, at Ug = 7 m/s, with the increase in Gs from 15 to 45 kg/m2·s, the solids holdup values of the central area are 0.0041 and 0.0045, respectively, with a difference of 0.0004. The solids holdup values near the wall area are 0.0080 and 0.0117, respectively, with a difference of 0.0037.
As shown in Figure 6d–f, when the solids circulation rate is constant, the solids holdup decreases with the increase in the superficial gas velocity, thus showing a similar trend as in Figure 5d–f for the axial distribution. The influence of the apparent gas velocity is different for different radial positions. As shown in Figure 6d, when Gs is relatively low, the influence of the gas velocity on the solids holdup in the central and wall areas has greater similarity. At a lower Gs of 15 kg/m2·s, with Ug increasing from 5 to 7 m/s, the solids holdup values in the central area are 0.0054 and 0.0041, respectively, with a difference of 0.0013. The solids holdup values near the wall area are 0.0114 and 0.0080, respectively, with a difference of 0.0034. When Gs is high, the influence of the gas velocity on the solids holdup in the central and wall areas is nearly equal. As shown in Figure 6f, at a high Gs of 45 kg/m2·s, with Ug increasing from 5 to 7 m/s, the solids holdup values in the central area are 0.0072 and 0.0045, respectively, with a difference of 0.0027. Near the wall, the solids holdup values are 0.0142 and 0.0117, respectively, with a difference of 0.0025. A low Gs value indicates a small quantity of particles per area in the riser. In this situation, particle–particle interaction is relatively low across the whole area of the riser. Due to the wall effects, more particles tend to accumulate in the wall region with relative weak particle–particle interaction. When superficial gas velocity increases, particles near the wall region are sensitive to the gas velocity. More particles are carried out of the riser. Therefore, the solids holdup more obviously decreases in the wall region. In contrast, for a high Gs, particle–particle interaction increases due to a larger quantity of particles per area. Particles tend to be stable in the entire riser. When the superficial gas velocity increases, the influence in the center and wall regions is similar due to larger particle–particle interactions in both areas.
To obtain an overall view of the flow characteristics, Figure 7 shows a three-dimensional diagram of the solids holdup under the conditions of Ug = 5 m/s with Gs = 15 and 45 kg/m2·s.
Axially, the solids holdup of desulphurization ash particles is denser in the riser bottom, and gradually decreases along the riser. Radially, the solids holdup near the wall region is higher than that in the center area. When the superficial gas velocity is constant, the solids holdup at the bottom increases significantly with the increase in the solids circulation rate. The particle velocity at the bottom of the riser is nearly zero. Particles in this region are accelerated slowly. When the solids circulation rate increases, more particles flow into the bottom region. Due to the low acceleration rate, particle accumulation increases with a larger solids circulation rate. Therefore, the solids holdup clearly increases with the increase in the solids circulation rate at the riser bottom. Due to the development of the gas–solids flow, more particles are blown upwards with gas. The difference in the solids holdup decreases with the increase in the solids circulation rate [51,52]. Figure 8 shows a three-dimensional diagram of the solids holdup under the conditions of Gs = 25 kg/m2·s, and Ug = 5 and 7 m/s, respectively. A similar trend is found, with the solids holdup higher in the wall area and lower in the center. The largest solids holdup occurs at the wall region at the bottom of the riser, and shows a nonuniform flow structure.

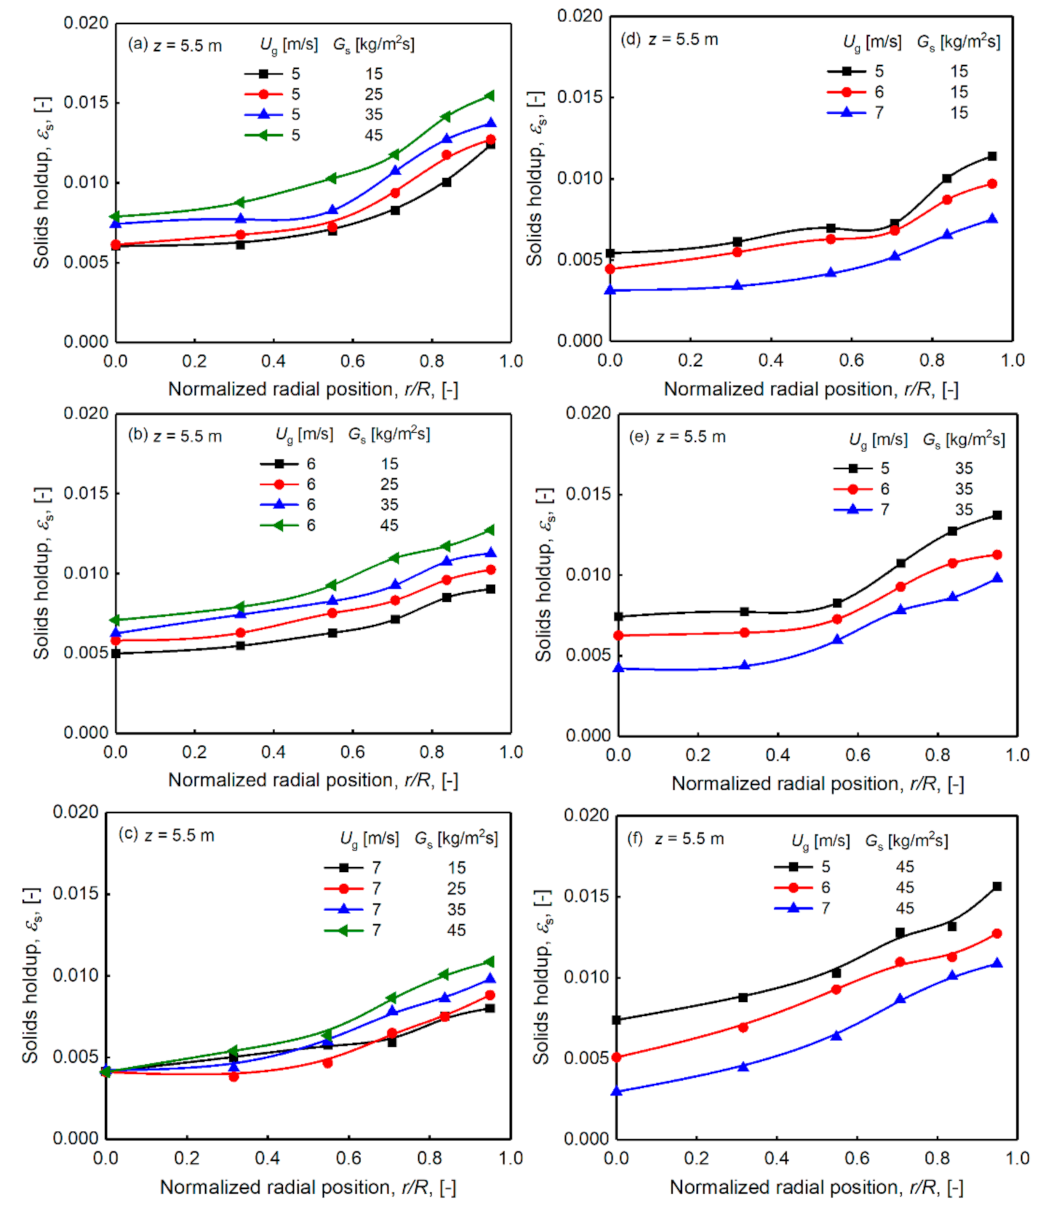
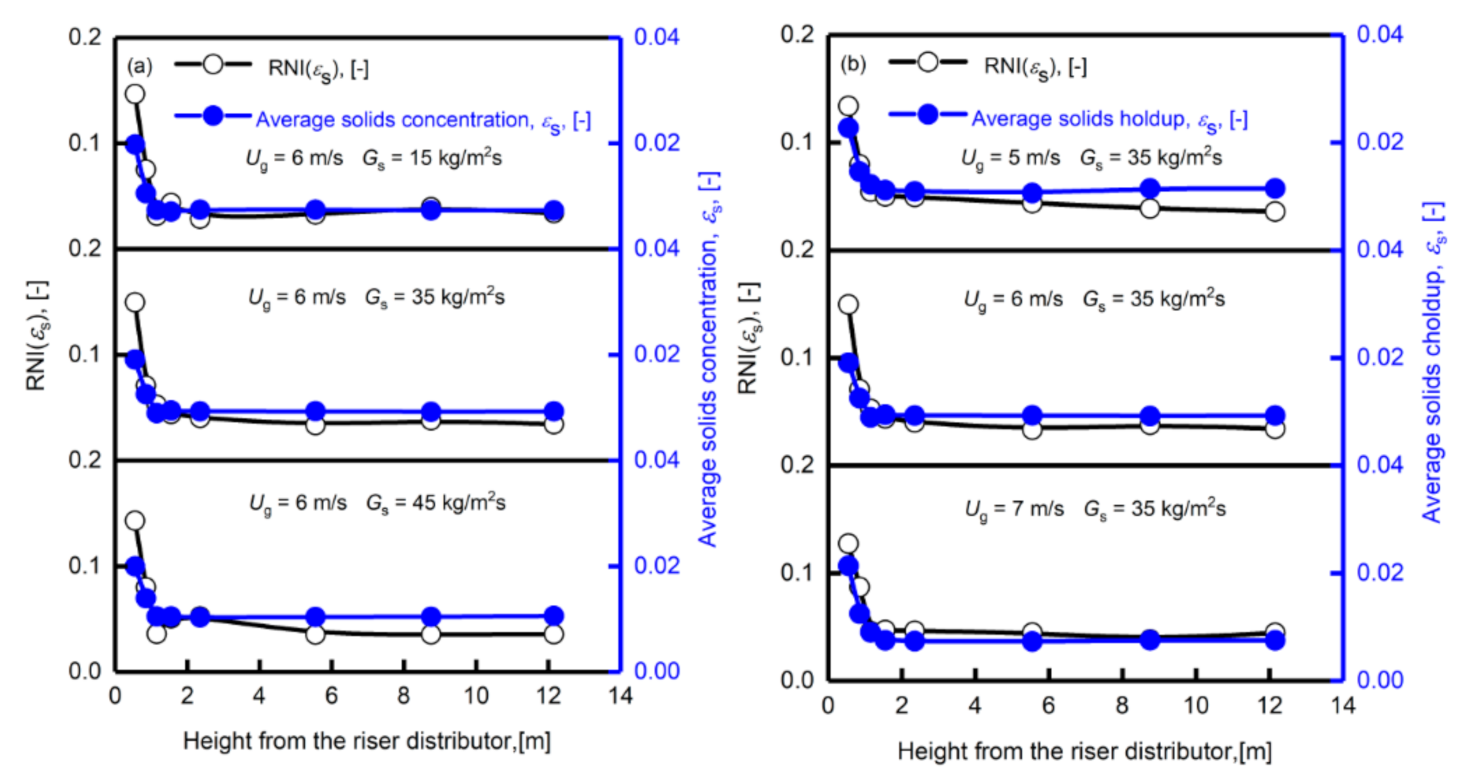
3.3. Radial Distribution of Particle Solids Holdup, Non-Uniform Distribution

The radial non-uniformity index (RNI) proposed by Zhu and Manyele [53] can be used to describe both the nonuniformity and the axial flow development. The RNI of the solids holdup (εs) can be calculated as follows:
R N I ( ε s ) = σ ( ε s ) σ ( ε s ) max = σ ( ε s ) ε s ¯ ( ε s , max ε s ¯ )
where σ(εs) represents the standard deviation of the solids holdup at each radial position, and σ(εs)max represents the largest possible standard deviation of the solids holdup in a certain section. εs,max represents the highest solids holdup. The larger the RNI (εs) value, the more uneven the distribution of the desulphurization ash particles in the radial direction, and vice versa.
Figure 9 shows the axial distribution of the RNI (εs) under different operating conditions. As shown in the figure, the RNI value of the solids holdup of the particles is higher in the bottom of the riser, indicating that the desulfurization ash in this area shows an uneven flow. This may be related to the inlet effect. Near the riser inlet, the gas–solids collision is more intense. Therefore, the fluctuation near the inlet is larger, which may result in a less uniform flow at the riser bottom. As the height increases, the RNI (εs) value decreases rapidly, showing that the particle flow becomes relatively uniform in the riser. As shown in Figure 9a,b, operating conditions have little effect on RNI (εs). This may be due to the lower solids holdup under these operating conditions. The nonuniformity between different operating conditions is small for slight changes of RNI (εs).

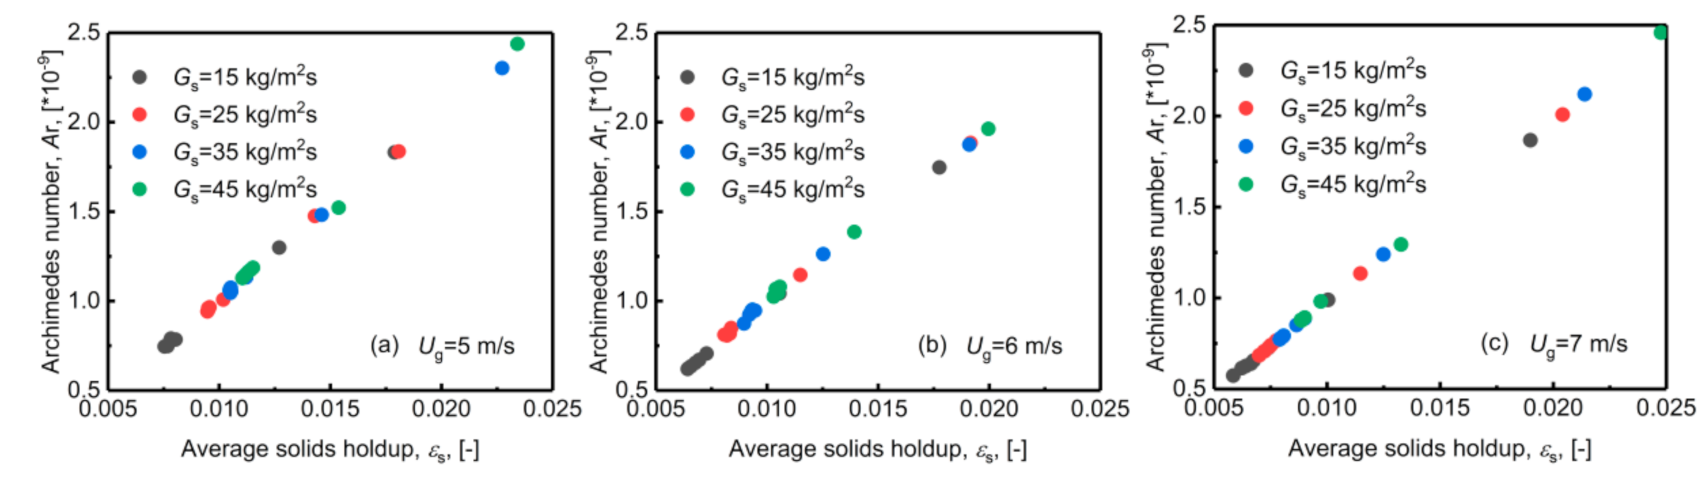
3.4. The Relationship between Particle Flow Parameters and Particle Solids Holdup

Dimensionless parameters are often considered for studying the flow field characteristics, e.g., the Archimedes and Reynolds numbers. The Archimedes number has shown significant potential to indicate the influence of the particle and fluid properties on the flow characteristics. The particle-based Archimedes number, Ars, can be defined as [54]:
A r s = d p 3 ρ f ρ p ε s ¯ ρ f g μ 2
where dp is the equivalent diameter of the particle, m; ε s ¯ is the averaged solids holdup; ρp and ρf are the particle density and gas density, kg/m3, respectively; and μ is the dynamic viscosity of fluidizing air, Pas.
Figure 10 shows the relationship between the particle-based Archimedes number and the averaged solids holdup. This Archimedes number was calculated based on a single particle using the averaged particle size. It is found that the Archimedean number is directly proportional to the averaged solids holdup at all operating conditions.

4. Conclusions

This study investigated the flow characteristics of the desulphurization ash particles in a circulating fluidized bed, including the axial and radial distribution of the solids holdup, and the influence of the superficial gas velocity and the solids circulation rate. The relationship between the Archimedes number and the solids holdup is also discussed. We obtained the following conclusions:
(1)
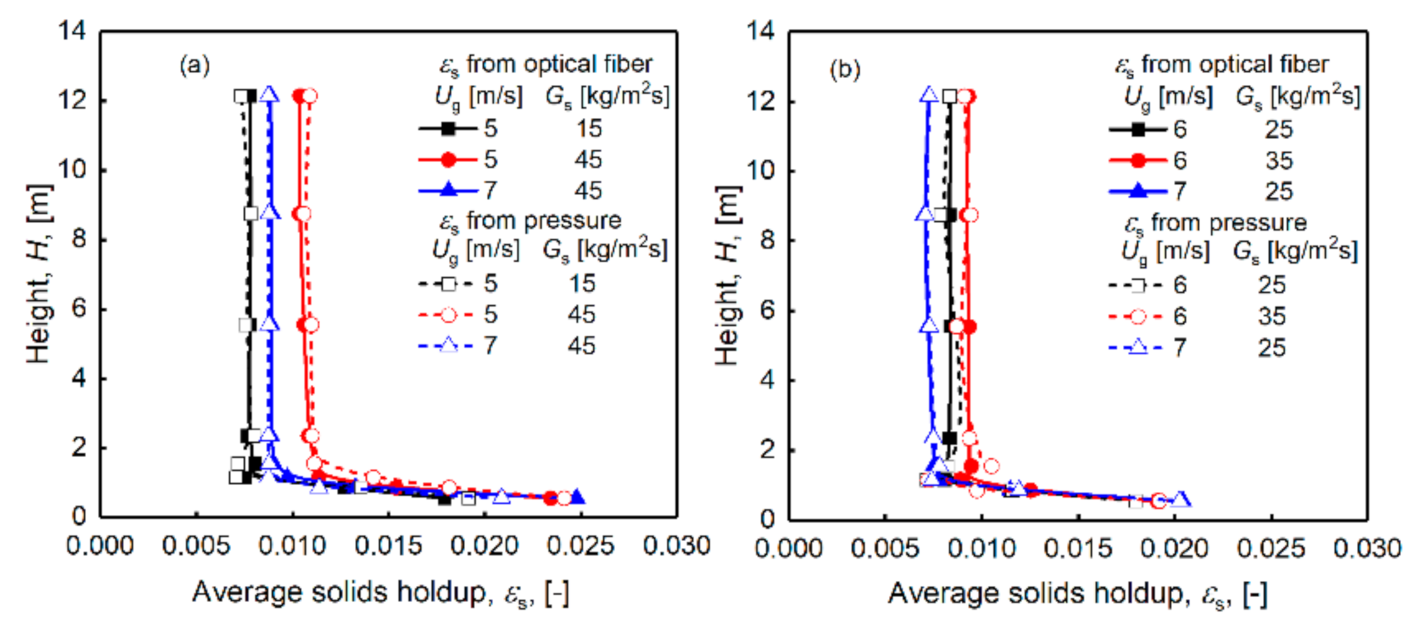
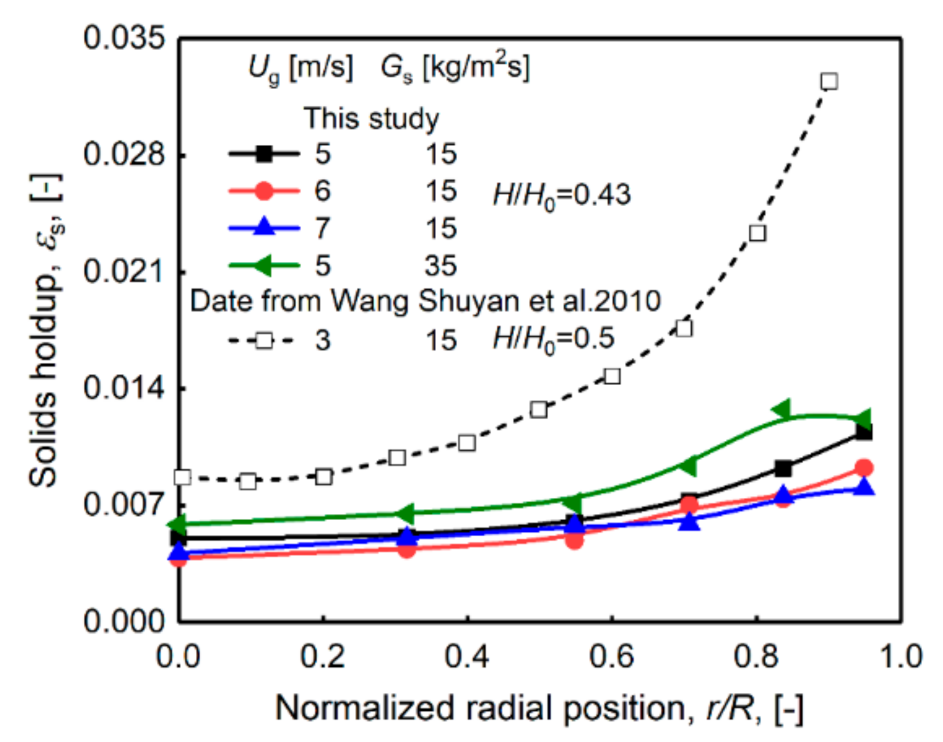
The solids holdup is relatively high at the riser bottom, gradually decreases with the increase in the axial height, and has a stable value at the top of the riser outlet. The solids holdup is between 0.005 and 0.03. There is also an uneven gas–solids distribution in the radial direction, which may affect the gas–solids contact and thus the efficiency of the desulfurization process.
(2)
The superficial gas velocity and the solids circulation rate have different influences on the solids holdup distribution. Changes in the solids holdup in the axial direction are more obvious when the gas velocity is lower, which indicates that the solids holdup is more sensitive to the change in the solids circulation rate at a lower superficial gas velocity. The solids holdup values of different radial regions have different sensitivities to the circulation. At lower gas velocities, the changes in the center and wall regions of the riser are roughly the same. When the superficial gas velocity is higher, the solids holdup of the wall area is more prominently affected by the solids circulation rate than in the center area.
(3)
The particle-based Archimedes number has a linear relationship with the solids holdup under all operating conditions.

Author Contributions

Conceptualization, C.W. and J.G.; methodology, C.W.; validation, X.L. and C.W.; data analysis, X.Y. and C.W.; investigation, X.Y.; writing—original draft, X.Y. and C.W. All authors have read and agreed to the published version of the manuscript.

Funding

This research was founded by the National Science Foundation of China (Nos. 21978320 and 91834302).

Institutional Review Board Statement

Not applicable.

Informed Consent Statement

All authors of this article are aware of the data details.

Data Availability Statement

All data presented in this study can be found from Figures in this manuscript.

Acknowledgments

The authors express their gratitude to Xin Su, Wei Zhu, Haiyong Zhang, Mengjie Luo, Zhihui Li for the experiments. Chengxiu Wang would like to thank Qiang Wei for his support with the experimental facilities.

Conflicts of Interest

The article has no conflicts of interest.

Abbreviations

ArsArchimedes number (-)
dpParticle diameter (μm)
DDevice diameter (m)
HDevice height (m)
GsSolids circulation rate (kg/m2·s)
gacceleration of gravity (m/s2)
UgSuperficial gas velocity (m/s)
zHeight (m)
ρfGas density (kg/m3)
ρgParticle density (kg/m3)
ε s ¯ Averaged solids holdup (-)
εsSolids holdup (-)
μDynamic viscosity of fluidizing air (Pas)

References

  1. Gao, H.; Sun, B. Influence of Energy Saving and Emission Reduction on Innovation of Science, Technology, Industry and Enterprises in China. IOP Conf. Ser. Earth Environ. Sci. 2021, 770, 012067. [Google Scholar] [CrossRef]
  2. Cui, L.; Liu, M.; Yuan, X.; Wang, Q.; Ma, Q.; Wang, P.; Hong, J.; Liu, H. Environmental and economic impact assessment of three sintering flue gas treatment technologies in the iron and steel industry. J. Clean. Prod. 2021, 311, 127703. [Google Scholar] [CrossRef]
  3. Qi, H.; You, C.; Xu, X. Interaction between SO2 from flue gas and sorbent particles in dry FGD processes. China Particuol. 2005, 3, 114. [Google Scholar] [CrossRef]
  4. Lidong, W.; Juan, W.; Peiyao, X.; Qiangwei, L.; Wendi, Z.; Shuai, C. Selectivity of transition metal catalysts in promoting the oxidation of solid sulfites in flue gas desulfurization. Appl. Catal. A Gen. 2015, 508, 52–60. [Google Scholar] [CrossRef]
  5. Wang, J.; Zhong, W. Simultaneous desulfurization and denitrification of sintering flue gas via composite absorbent. Chin. J. Chem. Eng. 2016, 24, 1104–1111. [Google Scholar] [CrossRef] [Green Version]
  6. Chen, Z.; Wang, H.; Zhuo, J.; You, C. Experimental and numerical study on effects of deflectors on flow field distribution and desulfurization efficiency in spray towers. Fuel Process. Technol. 2017, 162, 1–12. [Google Scholar] [CrossRef]
  7. Guo, J.; Li, Y.; Xiong, J.; Zhu, T. Coupling mechanism of activated carbon mixed with dust for flue gas desulfurization and denitrification. J. Environ. Sci. China 2020, 98, 205–214. [Google Scholar] [CrossRef] [PubMed]
  8. Yang, J.M.; Sun, B.S.; Qi, N.Z. Efficiency Prediction of Limestone-Gypsum Wet Desulphurization Based on Support Vector Machine. Adv. Mater. Res. 2014, 989–994, 913–917. [Google Scholar] [CrossRef]
  9. Nan, J.; Chen, X.; Wang, X.; Lashari, M.S.; Wang, Y.; Guo, Z.; Du, Z. Effects of applying flue gas desulfurization gypsum and humic acid on soil physicochemical properties and rapeseed yield of a saline-sodic cropland in the eastern coastal area of China. J. Soils Sediments 2015, 16, 38–50. [Google Scholar] [CrossRef]
  10. Pan, D.; Yu, R.; Bao, J.; Wu, H.; Huang, R.; Yang, L. Emission and Formation Characteristics of Aerosols from Ammonia-Based Wet Flue Gas Desulfurization. Energy Fuels 2015, 30, 666–673. [Google Scholar] [CrossRef]
  11. Zhang, K.; Wang, C.; Wang, P.; Zhang, K. Effect of Fe3+ concentration and pH on arsenic removal, migration and speciation transformation in lab-scale wet flue gas desulfurization system. Fuel 2021, 295. [Google Scholar] [CrossRef]
  12. Li, Y.; You, C. Experimental and model investigation on the mass balance of a dry circulating fluidized bed for flue gas desulfurization system. Korean J. Chem. Eng. 2011, 28, 1956–1963. [Google Scholar] [CrossRef]
  13. Wang, N.; Zhang, X. Effect of Humidification Water on Semi-Dry Flue Gas Desulfurization. Procedia Environ. Sci. 2011, 11, 1023–1028. [Google Scholar] [CrossRef] [Green Version]
  14. Wang, X.; Li, Y.; Zhu, T.; Jing, P.; Wang, J. Simulation of the heterogeneous semi-dry flue gas desulfurization in a pilot CFB riser using the two-fluid model. Chem. Eng. J. 2015, 264, 479–486. [Google Scholar] [CrossRef]
  15. Wu, F.; Yue, K.; Gao, W.; Gong, M.; Ma, X.; Zhou, W. Numerical simulation of semi-dry flue gas desulfurization process in the powder-particle spouted bed. Adv. Powder Technol. 2020, 31, 323–331. [Google Scholar] [CrossRef]
  16. Sun, M.; Lou, Z.; Cheng, G.; Baig, S.A.; Fang, L.; Zhou, X.; Shen, Y.; Xu, X. Process migration and transformation of mercury in simulated wet flue gas desulfurization slurry system. Fuel 2015, 140, 136–142. [Google Scholar] [CrossRef]
  17. Jiang, L.; Mei, K.; Chen, K.; Dao, R.; Li, H.; Wang, C. Design and prediction for highly efficient SO2 capture from flue gas by imidazolium ionic liquids. Green Energy Environ. 2020. [Google Scholar] [CrossRef]
  18. Zhu, Z.; Ma, Y.; Qu, Z.; Fang, L.; Zhang, W.; Yan, N. Study on a new wet flue gas desulfurization method based on the Bunsen reaction of sulfur-iodine thermochemical cycle. Fuel 2017, 195, 33–37. [Google Scholar] [CrossRef]
  19. Zhang, Y.; Qian, W.; Zhou, P.; Liu, Y.; Lei, X.; Li, B.; Ning, P. Research on red mud-limestone modified desulfurization mechanism and engineering application. Sep. Purif. Technol. 2021, 272. [Google Scholar] [CrossRef]
  20. Cheng, T.; Zhou, X.; Yang, L.; Wu, H.; Fan, H. Transformation and removal of ammonium sulfate aerosols and ammonia slip from selective catalytic reduction in wet flue gas desulfurization system. J. Environ. Sci. China 2020, 88, 72–80. [Google Scholar] [CrossRef]
  21. Wang, Q.; Wang, L.; Wu, H.; Yang, H. Promoting fine particle removal in double-tower cascade wet flue gas desulfurization system by flue gas temperature reduction. Powder Technol. 2020, 373, 581–589. [Google Scholar] [CrossRef]
  22. Li, H.; Zhang, H.; Li, L.; Ren, Q.; Yang, X.; Jiang, Z.; Zhang, Z. Utilization of low-quality desulfurized ash from semi-dry flue gas desulfurization by mixing with hemihydrate gypsum. Fuel 2019, 255. [Google Scholar] [CrossRef]
  23. Wang, X.; Zhao, B.; Ye, Q.; Su, Y. Wet flue gas desulfurization using micro vortex flow scrubber: Characteristics, modeling and simulation. Sep. Purif. Technol. 2020, 247. [Google Scholar] [CrossRef]
  24. Zhou, D.; Wei, R.; Zhu, Y.; Long, H.; Huang, B.; Wang, Y.; Wu, S. Calcium sulfate whisker one-step preparation using semi-dry flue gas desulfurization ash and directional growth control. J. Clean. Prod. 2021, 290. [Google Scholar] [CrossRef]
  25. Zhang, W.; Wang, H.; Chang, D.; You, C. Numerical Simulation of Moderate Temperature Desulfurization in Circulating Fluidized Bed Reactor Considering Sorbent Abrasion. Energy Fuels 2018, 33, 484–492. [Google Scholar] [CrossRef]
  26. Chen, B.; Sun, F.; Gao, M.; Shi, Y. A 1-D model of spraying performance for wet flue gas desulfurization scrubber based on predicted slurry temperature. Appl. Therm. Eng. 2019, 155, 259–266. [Google Scholar] [CrossRef]
  27. Chen, Z.; You, C.; Wang, H.; Liu, Q. Experimental study on the synergetic removal of fine particles by wet flue gas desulfurization tower with a flow pattern control device. Powder Technol. 2019, 343, 122–128. [Google Scholar] [CrossRef]
  28. Salehi, E.; Eidi, B.; Soleimani, Z. An integrated process consisting of Mg(OH)2—Impregnated ceramic foam filters as adsorbent and Mg(OH)2 as scrubbing solution for intensified desulfurization of flue gas. Sep. Purif. Technol. 2019, 216, 34–42. [Google Scholar] [CrossRef]
  29. Li, X.; Dong, M.; Li, S.; Feng, Z.; Zhang, Z.; Li, W.; Ren, Y.; Lu, J. A numerical study of the ammonia desulfurization in the spray scattering tower. Chem. Eng. Process. Process. Intensif. 2020, 155. [Google Scholar] [CrossRef]
  30. You, C.; Qi, H.; Wang, W.; Xu, X. A model for flue gas desulfurization with lime absorbent at middle temperature. Dev. Chem. Eng. Mineral. Process. 2001, 9, 289–300. [Google Scholar] [CrossRef]
  31. You, C.; Li, Y. Desulfurization characteristics of rapidly hydrated sorbents with various adhesive carrier particles for a semidry CFB-FGD system. Environ. Sci. Technol. 2013, 47, 2754–2759. [Google Scholar] [CrossRef] [PubMed]
  32. Yang, T.Y.; Leu, L. Multiresolution analysis on identification and dynamics of clusters in a circulating fluidized bed. AIChE J. 2009, 55, 612–629. [Google Scholar] [CrossRef]
  33. Fan, B.; You, C.; Qi, H.; Xiang, G.; Xu, X. Influence of Chemical and Thermodynamic Parameters on the Flue Gas Desulphurization Efficiency in a Circulating Fluidized Bed. J. Therm. Sci. 2000, 10, 286–290. [Google Scholar] [CrossRef]
  34. Wang, F.; Ma, S.; Wen, J.; Lu, C. Gas hydrodynamics of a novel MTO high-speed loop reactor: The bypassing and backmixing along with average residence time. Powder Technol. 2020, 364, 1062–1075. [Google Scholar] [CrossRef]
  35. Li, Y.; Qi, H.; Wang, J. SO2 capture and attrition characteristics of a CaO/bio-based sorbent. Fuel 2012, 93, 258–263. [Google Scholar] [CrossRef]
  36. Zhou, G.; Zhong, W.; Zhou, Y.; Wang, J.; Wang, T. 3D simulation of sintering flue gas desulfurization and denitration in a bubbling gas absorbing tower. Powder Technol. 2017, 314, 412–426. [Google Scholar] [CrossRef]
  37. Zhao, Z.; Zhang, Y.; Gao, W.; Baleta, J.; Liu, C.; Li, W.; Weng, W.; Dai, H.; Zheng, C.; Gao, X. Simulation of SO2 absorption and performance enhancement of wet flue gas desulfurization system. Process. Saf. Environ. Prot. 2021, 150, 453–463. [Google Scholar] [CrossRef]
  38. Li, Y.; Song, C.; You, C. Experimental Study on Abrasion Characteristics of Rapidly Hydrated Sorbent for Moderate Temperature Dry Flue Gas Desulfurization. Energy Fuels 2010, 24, 1682–1686. [Google Scholar] [CrossRef]
  39. Li, Y.; You, C.; Song, C. Adhesive carrier particles for rapidly hydrated sorbent for moderate-temperature dry flue gas desulfurization. Environ. Sci. Technol. 2010, 44, 4692–4696. [Google Scholar] [CrossRef]
  40. Zhang, Y.; Wang, T.; Yang, H.; Zhang, H.; Zhang, X. Experimental study on SO2 recovery using a sodium–zinc sorbent based flue gas desulfurization technology. Chin. J. Chem. Eng. 2015, 23, 241–246. [Google Scholar] [CrossRef]
  41. Chang, G.; Song, C.; Wang, L. A modeling and experimental study of flue gas desulfurization in a dense phase tower. J. Hazard. Mater. 2011, 189, 134–140. [Google Scholar] [CrossRef]
  42. Li, S.H.; Qi, G.C.; Tang, G.X.; Wang, H. Numerical Simulation of Venturi Device in Flue-Gas Circulating Fluidized Bed Desulphurization Tower. Adv. Mater. Res. 2011, 356–360, 1262–1266. [Google Scholar] [CrossRef]
  43. Montagnaro, F.; Salatino, P.; Scala, F.; Urciuolo, M. A Population Balance Model on Sorbent in CFB Combustors: The Influence of Particle Attrition. Ind. Eng. Chem. Res. 2011, 50, 9704–9711. [Google Scholar] [CrossRef]
  44. Zhang, H.; Johnston, P.M.; Zhu, J.X.; de Lasa, H.I.; Bergougnou, M.A. A novel calibration procedure for a fiber optic solids concentration probe. Powder Technol. 1998, 100, 260–272. [Google Scholar] [CrossRef]
  45. Wang, C.; Zhu, J.; Barghi, S.; Li, C. Axial and radial development of solids holdup in a high flux/density gas–solids circulating fluidized bed. Chem. Eng. Sci. 2014, 108, 233–243. [Google Scholar] [CrossRef]
  46. Wang, C.; Li, C.; Zhu, J. Axial solids flow structure in a high density gas–solids circulating fluidized bed downer. Powder Technol. 2015, 272, 153–164. [Google Scholar] [CrossRef]
  47. Geldart, D.; Harnby, N.; Wong, A. Fluidization of cohesive powders. Powder Technol. 1984, 25, 25–37. [Google Scholar] [CrossRef]
  48. Geldart, D.; Abdullah, E.C.; Hassanpour, A.; Nwoke, L.C.; Wouters, I. Characterization of powder flowability using measurement of angle of repose. China Particuol. 2006, 4, 104–107. [Google Scholar] [CrossRef]
  49. Werther, J. Measurement techniques in fluidized beds. Powder Technol. 1999, 102, 15–36. [Google Scholar] [CrossRef]
  50. Van Ommen, J.R.; Mudde, R.F. Measuring the gas–solids distribution in fluidized beds—A review. Int. J. Chem. React. Eng. 2008, 6, 1–32. [Google Scholar] [CrossRef]
  51. Chang, J.; Zhang, K.; Zhu, W.; Yang, Y. Gas–solid flow in a high-density circulating fluidized bed riser with Geldart A particles. Particuology 2016, 29, 103–109. [Google Scholar] [CrossRef]
  52. Wei, Y.; Cheng, L.; Wu, E.; Li, L. Experimental research on steady-state operation characteristics of gas–solid flow in a 15.5 m dual circulating fluidized bed system. Chin. J. Chem. Eng. 2021, 32, 70–76. [Google Scholar] [CrossRef]
  53. Zhu, J.; Manyele, S.V. Radial nonuniformity index (RNI) in fluidized beds and other multiphase flow systems. Can. J. Chem. Eng. 2001, 79, 203–214. [Google Scholar] [CrossRef]
  54. Xu, G.; Hartge, E.-U.; Werther, J.; Gao, S. Saturation carrying capacity at high archimedes number of vertical concurrent gas–particle flow. Chem. Eng. Sci. 2006, 61, 7115–7124. [Google Scholar] [CrossRef]
Figure 1. Schematic diagram of the experimental device for the circulating fluidized bed reactor.
Processes 09 01343 g001
Figure 2. Morphology of desulfurization ash particles and FCC particles.
Processes 09 01343 g002
Figure 3. Axial distributions of the cross-sectional averaged solids holdup from optical fiber probe and pressure measurements. ((a,b) represents the axial distribution of solid holdup under different operating conditions with two methods).
Processes 09 01343 g003
Figure 4. Radial distribution of the solids holdup under different operating conditions.
Processes 09 01343 g004
Figure 5. Axial distributions of the averaged solids holdup under various operating conditions. ((ac) represents the axial distribution of solids holdup under different solids circulation rates. (df) represents the axial distribution of solids holdup at different superficial gas velocities).
Processes 09 01343 g005
Figure 6. Radial distributions of solids holdup under various operating conditions. ((ac) represents the axial distribution of solids holdup of particles under different particle circulation rates. (df) represents the axial distribution of solids holdup of particles at various superficial gas velocities).
Processes 09 01343 g006
Figure 7. Three-dimensional diagram of the solids holdup with superficial gas velocity of 5 m/s. ((a) represents the axial and radial distribution of solid holdup of particles when Ug = 5 m/s, Gs = 15 kg/m2·s, (b) represents the axial and radial distribution of solid holdup of particles when Ug = 5 m/s, Gs = 45 kg/m2·s).
Processes 09 01343 g007
Figure 8. Three-dimensional diagram of the solids holdup with solids circulation rate of 25 kg/m2·s. ((a) represents the distribution of solid holdup with Ug = 5 m/s, Gs = 25 kg/m2·s, (b) represents the distribution of solid holdup wtih Ug = 7 m/s, Gs = 25 kg/m2·s).
Processes 09 01343 g008
Figure 9. Axial distributions of the solids holdup and RNI (εs). ((a) represents the distribution of RNI under different solids circulation rates. (b) represents the distribution of RNI under different superficial gas velocities).
Processes 09 01343 g009
Figure 10. Archimedes number under various operating conditions. ((ac) represents the relationship between Archimedes number and solids holdup under the gas velocity of 5, 6 and 7 m/s, respectively).
Processes 09 01343 g010
Table 1. Summary of the literature on the research of flue gas desulfurization.
AuthorsDevice Size, mUg, m/s
Gs, kg/m2·s
Particle TypeParticle Size, μm
You et al., 2001 [30]----CaO282–560
Qi et al., 2005 [3]D: 0.15; H: 34–5.2
53–489
FCC78
Li et al., 2011 [12]D: 0.305; H: 62.5
--
ash sorbent<10
You et al., 2013 [31]D: 0.305; H: 61.5
--
fly ash; river sand<10, <1000
Zhang et al., 2018 [25]D: 0.305; H: 62.5
--
fresh sorbent116
Chen et al., 2017 [6]D: 1.2; H: 4.080.2–0.4
--
Ca(OH)2--
Chen et al., 2019 [27]D: 1.2; H: 4.083–4--0.05–4
Yang et al., 2016 [8]----Ca(OH)2154–280
Yang et al., 2009 [32]--<3.5Ash2
Wang et al., 2016 [5]----Ca(OH)2--
Fan et al., 2000 [33]D: 0.28; H: 61.9
4.5
Ca(OH)2--
Wang et al., 2020 [34]D: 0.05; H: 2.52.5
0–15
Fine particle100
Table 2. Particle size distribution of desulphurization ash.
Particle Size, μmVolume Fraction, %Particle Size, μmVolume Fraction, %
0–17.6050–10013.32
1–1039.67100–2006.71
10–5027.05200–5635.65
Publisher’s Note: MDPI stays neutral with regard to jurisdictional claims in published maps and institutional affiliations.

