Article

Biogas Upgrading by Pressure Swing Adsorption with Design of Experiments

1
Department of Chemical and Materials Engineering, National Central University, Zhongli District, Taoyuan City 320, Taiwan
2
Chemistry Division, Institute of Nuclear Energy Research, Atomic Energy Council, Longtan District, Taoyuan City 325, Taiwan
*
Author to whom correspondence should be addressed.
Processes 2021, 9(8), 1325; https://doi.org/10.3390/pr9081325
Submission received: 30 June 2021 / Revised: 17 July 2021 / Accepted: 28 July 2021 / Published: 29 July 2021
(This article belongs to the Special Issue Biomass to Renewable Energy Processes)

Abstract

:
Global warming is predominantly caused by methane (CH4) and carbon dioxide (CO2) emissions. CH4 is estimated to have a global warming potential (GWP) of 28–36 over 100 years. Its impact on the greenhouse effect cannot be overstated. In this report, a dual-bed eight-step pressure swing adsorption (PSA) process was used to simulate the separation of high-purity CH4 as renewable energy from biogas (36% CO2, 64% CH4, and 100 ppm H2S) in order to meet Taiwan’s natural gas pipeline standards (>95% CH4 with H2S content < 4 ppm). Three selectivity parameters were used to compare the performance of the adsorbents. In the simulation program, the extended Langmuir–Freundlich isotherm was used for calculating the equilibrium adsorption capacity, and the linear driving force model was used to describe the gas adsorption kinetics. After the basic case simulation and design of experiments (DOE) for the laboratory-scale PSA, we obtained a top product CH4 purity of 99.28% with 91.44% recovery and 0.015 ppm H2S purity, and the mechanical energy consumption was estimated to be 0.86 GJ/ton-CH4. Lastly, a full scale PSA process simulation was conducted for the commercial applications with 500 m3/h biogas feed, and the final CH4 product with a purity of 96.1%, a recovery of 91.39%, and a H2S content of 1.14 ppm could be obtained, which can meet the standards of natural gas pipelines in Taiwan.

Graphical Abstract

1. Introduction

Methane (CH4) is a valuable renewable energy source and one of the leading gases responsible for the greenhouse effect. CO2 has a global warming potential (GWP) of 1 regardless of the time period used, whereas CH4 is estimated to have a GWP of 28–36 over 100 years [1]. After CO2, CH4 is the second most abundant anthropogenic greenhouse gas, accounting for approximately 20 percent of global emissions [2]. The main components of biogas are 60–70% CH4, 30–40% CO2, and other trace gas compounds, such as 0–4000 ppm hydrogen sulfide (H2S) produced by anaerobic decomposition [3]. In order to mitigate global warming, biogas upgrading technologies have been promoted in various countries worldwide in recent years.
Gas separation technologies can not only recover CH4 and capture CO2 in order to reduce greenhouse gas emissions, but can also produce high-purity natural gas for use in industrial applications, such as heating and power generation, or as biofuel for vehicles. After removing excess components from biogas in order to achieve ≥97% CH4 purity, the purified biogas can be injected into the natural gas grid [4] or compressed into bio-compressed natural gas (bio-CNG) at a high pressure range of 20~25 MPa, which can be used as vehicular fuel [5]. In comparison to gasoline and diesel, bio-natural gas can reduce air pollution caused by automobile exhaust emissions and net greenhouse gas emissions. In addition, the content of H2S must be less than 4 ppm for the natural gas pipeline standards in Taiwan.
The main sulfide in biomass biogas is H2S, and because it is toxic and causes corrosion in compressors, gas storage tanks, and engines, and forms more toxic gases (SO2 and SO3) during biogas combustion [6,7], biogas must be desulfurized before entering the PSA process, unless the concentration of H2S is less than 300 ppm [8].
In 2017, thermal power generation was Taiwan’s primary source of energy. For example, the proportion of coal-fired power generation is 39.2%, followed by natural gas power generation at 38.6%. Taiwan is dependent on imports for more than 97% of its natural gas, so it is critical to developing Taiwan’s natural gas production. Among them was the Danish continuous stirred tank reactor technology installed at the Shi-An farm in Kaohsiung. The chicken manure and wastewater are mixed and stirred together to produce biogas during the anaerobic fermentation process. Following desulfurization, the biogas is burned to generate electricity, and the electricity generator is connected in parallel with the Taiwan Power Company (TPC) grid to directly sell green power to TPC, saving waste disposal and reducing carbon emissions by 93%, thus, reflecting circular economy practice [9].
As the cost of petroleum rises, so do the associated greenhouse gas emissions caused by the extensive use of fuel combustion; many researchers are committed to using modern technology to obtain energy from renewable energy sources. As a result, it is important to implement biogas upgrading techniques. There are several significant technologies for CH4/CO2 separation in industrial practice, including organic physical scrubbing, water scrubbing, chemical scrubbing, PSA, membrane separation methods, and cryogenic technology [4,5,10,11]. PSA benefits include low energy requirements, low capital cost, safety, and ease of operation [12]. PSA has enormous potential for gas separation and purification. Therefore, it is widely used in the industry for gas drying, solvent vapor recovery, air separation, hydrogen purification, etc. [13]. Many researchers use the PSA process to recover greenhouse gases, sulfur dioxide, and nitrogen oxides.
Heck et al. [14] compared the separation performance of zeolites 13X, 5A, and 4A for biogas upgrading. The results show that zeolites 13X and 5A can produce 98% pure CH4 with a 60–70% recovery rate. Gholipour and Mofarahi [15] measured the pure and binary adsorption isotherm data on zeolite 13X using a volumetric method, then calculated the selectivity and evaluated the optimal separation conditions at a pressure of 4 bar and a temperature of 303 K. Augelletti et al. [12] used zeolite 5A as an adsorbent to separate biogas (60% CH4/40% CO2) at a feed flow rate of 100 Nm3/h, and they simulated a two-stage PSA process and obtained 99% pure CH4 with 81% recovery.
Liu and Ritter [16] used a fractional factorial design to investigate factor interaction effects on the PSA process performance. They discussed the influence of seven factors: purge feed ratio, pressure level, pressure ratio, heat transfer coefficient, feed concentration, feed volumetric flow rate, and bed length to diameter ratio. The results showed that the light product purity was affected by all seven factors, and the bed capacity factor was affected mainly by the purge to feed ratio, the heat transfer coefficient, and the feed concentration. In Grande’s study [17], the results showed that PSA is an efficient technology for biogas upgrading under different operating conditions. Better results of PSA can be achieved through process improvements, and the factors affecting product purity include pressure, purge ratio, purge and blowdown volumetric flow rate, etc.
Design of experiment (DOE) and factorial analysis were frequently used to evaluate the performance of different systems. For example, Qian et al. [18] used a factorial design method to investigate and evaluate the effects of air circulation strategies and operating conditions on the cooling performance, and then observed the significant factors that can achieve the research purpose. Alvarez et al. [19] discussed the methane production from llama and cow manures from the Bolivian high plateau, and used a fractional factorial design for the two raw materials. Llama manure was found to be the best raw material of the two for biogas production. Furthermore, it was found that the temperature factor significantly affected the production. Qian et al. [20] used a factorial design to discuss the safety of stair ascent and descent, and used an analysis of variance (ANOVA) table to observe whether the main effect and the interaction effect between two factors are significant or not. After the statistical analysis, moderately adjusting the factor can reduce the possibility of injuries and fatalities during stair climbing at both the home and the workplace. DOE and factorial analysis can also be effective and innovative in analyzing the PSA process.
Most articles in the literature studying biogas upgrading by PSA mainly only discussed the separation of CH4 and CO2 to produce the CH4 product, but the content of H2S in the produced product is less discussed. Due to the fact that Taiwan’s natural gas pipeline standards require >95% CH4 with H2S content < 4 ppm, the purpose of this research is to use DOE and factorial analysis to analyze the PSA process, and design a full scale PSA process with CH4 product purity greater than 97% (or at least not less than 95%) and content of H2S less than 4 ppm. The CH4 recovery is expected to be more than 90%.
This study compared various adsorbents and selected the one with the best separation performance based on three selectivity parameters. Then, biogas from Taiwan’s Institute of Nuclear Energy Research after desulphurization and water removal was used as the feed (64% CH4, 36% CO2, and 100 ppm H2S) for the PSA. Afterwards, we designed laboratory-scale PSA processes in order to generate high-purity CH4 product. Next, to find the optimal operating conditions that will yield optimal results, the DOE method was used. Lastly, a full scale PSA process was developed with adsorption towers dealing with 500 m3/h biogas feed for possible commercial applications. Figure 1 is the schematic diagram of the research design.

2. Methods

2.1. Breakthourgh Curve

Breakthrough curve experiments were conducted to validate the accuracy of the LDF coefficient in the simulation program. At a specific operating pressure and temperature, the mixed gas was fed into the adsorption bed. We measured the adsorbate concentration at the outlet end. When the concentration at the outlet end equals the concentration at the feed end, the adsorption bed has reached a breakthrough state. Table 1 shows the operating conditions. Due to the safety concerns of the laboratory, in all the sections of the simulation verification, we used N2 instead of CH4 for the experiment and simulation program verification.

2.2. Single-Bed Three-Step PSA Process

In this study, a single-bed three-step PSA process was used for simulation verification. Figure 2 depicts the process procedure, and Table 2 shows the step time of the bed. The process includes the following steps: adsorption (AD), cocurrent depressurization (CD), and blowdown (BD). Table 3 depicts the operating conditions.

2.3. Dual-Bed Six-Step PSA Process

In this study, a dual-bed six-step PSA process was also used for simulation verification. Figure 3 depicts the process procedure, and Table 4 shows the step time of the first bed. The process includes the following steps: AD, pressure equalization (PE), CD, and BD. The operating conditions are the same as Table 3 for the single-bed three-step PSA process.

2.4. Dual-Bed Eight-Step PSA Process

The feed composition of biogas in this study is 64% CH4, 36% CO2, and 100 ppm H2S, which is the biogas composition after water removal and desulfurization provided by Taiwan’s Institute of Nuclear Energy Research. To upgrade the biogas, a dual-bed eight-step PSA process was simulated for the basic case, the DOE study, and the full scale process. The following steps are involved in the process: pressurization (P), AD, PE, BD, and purge (PG). This process is adopted from the work of Santos et al. [21]. Figure 4 shows the process’s procedure. The steps of the two beds are shown in Table 5. Table 6 shows the adsorption bed parameters and operating conditions for the basic case.
  • Step 1 P: The feed gas is continuously fed to the bed bottom, and the bed pressure gradually rises to the feed pressure;
  • Steps 2 and 3 AD: Adsorption occurs at the feed pressure, and the CH4-rich product is obtained from the top product;
  • Steps 4 and 8 PE: The high-pressure bed and the low-pressure bed is connected in order to raise the pressure in the low-pressure bed, preparing it for the next adsorption step;
  • Steps 5 and 6 BD: The gas outlet at the bottom of the bed is opened and the bed pressure is released to desorption pressure by the vacuum pump; as the bed pressure drops, the strongly adsorbed substances (H2S, CO2) are gradually desorbed, and the CO2-rich product is obtained from the bed’s bottom;
  • Step 7 PG: The strong adsorptive is purged and discharged from the bottom of the bed, with a portion of the top product from another bed entering the bed top. PG can regenerate the adsorbent more effectively. Typically, the outlet flow from the bottom of the bed is not considered a product.

2.5. The DOE Method

The bed length is the first factor investigated. The volume of the adsorption bed is proportional to the bed length, with the bed diameter kept constant while the amount of adsorbent changes. Therefore, the equilibrium adsorption capacity of each bed varies with its length. Adsorption pressure, vacuum pressure, and vent pressure can all affect the equilibrium adsorption capacity of the gas component and the adsorbent’s selectivity, affecting the purity and recovery of each product. As a result, these three design factors were also chosen in DOE. The step time in the PSA process is another critical variable. When the time of the adsorption step and purge steps are determined for the dual-bed eight-step process we studied, the time of the blowdown step is fixed, so we only used these two step times as factors. Table 7 displays the high- and low-level setting values for each factor we chose.
In this study, the DOE method of full factorial design was used. The full factorial design method with statistical analysis is used to further determine whether the PSA separation performance of the system is significantly affected by these operating conditions. In ANOVA test, through F-test and p-value, it can be judged whether the interaction effect between factors and main effect of factor is significant to the response. The smaller the p-value or the larger the F-value, the more significant the factor is. In this study, statistical significance was set at 5%. Due to the fact that we chose 6 factors, each of which having 2 levels, we conducted 64 sets of simulations in total, and these 64 data were analyzed using Minitab software.

2.6. Mathematical Modeling

The following assumptions underpin the mathematical model used to describe the system:
  • The mass transfer resistance between the gas and solid phases is considered, and the mass transfer rate is represented by the linear driving force (LDF) model;
  • The equilibrium adsorption amount is calculated using the Extended Langmuir–Freundlich equation;
  • Only axial concentration and temperature gradients are considered;
  • The ideal gas law is applied;
  • It is operating in a non-isothermal system;
  • Due to the large particle size, the pressure drop along the bed can be neglected.
The above assumptions are used in the following equations [22]. A set of partial differential equations describes the mathematical model, including overall mass balance, mass balance for component, and energy balance:
  • overall mass balance:
    q z = ε A R ( P / T ) t + ( 1 ε ) A i = 1 n n i t
  • mass balance for component i:
    z ( ε A D a x , i P R T y i z ) ( y i q ) z = ε A R t ( y i P T ) + ( 1 ε ) A n i t
  • energy balance:
    ( A k ¯ ) 2 T z 2 z ( C ¯ P q T ) π D i h ( T T ) = ε A R t ( C ¯ P P ) + ( 1 ε ) A i = 1 n t [ n i ( C ¯ P T H i ) ] + ( 1 ε ) ρ s C ^ p s A T t
The boundary conditions are reported in Chou et al. [23].

2.7. Adsorption Equilibrium and Kinetics

To fit isotherm data, the extended Langmuir–Freundlich equation was used as follows:
q i * = n i * ρ S = q m , i b i y i m i P m i 1 + Σ i = 1 n b i y i m i P m i
Here, we have
q m , i = a i , 1 + ( a i , 2 T ) ,     b i = b i , 0 e x p ( b i , 1 T ) ,       m i = m i , 1 + m i , 2 T
In Equation (4), q i * represents the equilibrium adsorption amount of component i per unit adsorbent mass, n i * represents the equilibrium adsorption amount of component i per unit adsorbent volume, ρ S is the adsorbent density, P is the pressure, y i is the mole fraction of component i, and T is the temperature. Equation (5) parameters refer to the isotherm parameters.
In this study, the LDF model is described by:
n i t = k L D F , i ( n i * n i )
In Equation (6), n i represents the adsorbed amount of component i per unit adsorbent volume, and the mass transfer rate is proportional to the difference between the equilibrium and the actual average adsorption capacities.

3. Materials and Experimental Procedure

In this study, biogas is produced from anaerobic fermentation, and the main components are CO2, CH4, and H2S. Measurements of amount of equilibrium adsorbed were performed on three different types of adsorbents at temperatures of 298 and 333 K. Afterwards, we compared the adsorbents’ performance based on the experimental results.

3.1. Materials

Three types of commercial adsorbents were used to perform the CO2 and CH4 equilibrium adsorption experiments. Zeolite 13X, zeolite 5A (produced by COSMO), and activated carbon (AC) were used. Furthermore, according to the literature, zeolite 13X was frequently used as an adsorbent in the biogas separation process. As a result, we conducted experiments with three different brands of zeolite 13X produced by COSMO, UOP, and EIKME.

3.2. Experimental Apparatus

In this study, the adsorption isotherm experiment was measured using a Micro-balance Thermo D-200. Figure 5 shows that the pressure can be operated up to 6.89 × 10⁶ Pa, the maximum temperature is 673 K, and the maximum load capacity is 1.5 × 10³ kg with a sensitivity of 1 × 10⁻¹⁰ kg. The weight of the adsorbent was determined by allowing the gas to pass via various pressures while maintaining a constant temperature. The adsorbent’s weight change under different pressures is recorded, and its isotherm curve is plotted.

3.3. Selectivity Parameters

Due to the fact that the adsorbent has a significant impact on the separation results, we compared the performance of each adsorbent by calculating three selectivity parameters.
The term “equilibrium selectivity” ( α ) is used in the following expression [24]:
α = x CO 2 x CH 4 y CO 2 y CH 4
In Equation (7), x CO 2 and x CH 4 represent the mole fractions of CO2 and CH4 on the adsorbent, respectively, and y CO 2 and y CH 4 represent the mole fractions in the gas phase.
The second parameter is the working capacity selectivity ratio ( W ) and is defined as [24]:
W = Δ q CO 2 Δ q CH 4
In Equation (8), Δ q i represents the adsorbent’s working capacity, which is typically defined as the difference between the adsorption amount at adsorption and desorption pressures for component i.
The selection parameter ( S ) can be calculated from the two parameters mentioned above and is defined as follows [24]:
S = α A B W
The higher the selection parameter, the more effectively the adsorbent can separate different gases under the specific gas composition.

4. Results and Discussion

4.1. Adsorption Isotherms

4.1.1. Pure Gas Adsorption Measurement

The equilibrium adsorption of pure CH4 and CO2 on five adsorbents measured using the Micro-balance Thermo D-200 is shown in Figure 6. The adsorbents are three brands of zeolite 13X, zeolite 5A, and AC. The measurement was taken at temperatures of 298 K and 333 K. For all adsorbents tested, the CO2 adsorption capacity was higher than the CH4 adsorption capacity; this is because the adsorption capacity of each component is due to the cationic nature of the adsorbent surface. CO2 possesses a large quadruple moment that produces a strong attraction to the electrostatic field of the cationic site and results in a high capacity. When the temperature increases, the kinetic energy of adsorbed molecules becomes increased, and they overcome the electrostatic force of attraction by the adsorbent surface. Therefore, a lower amount of molecules will become adsorbed on the surface of the adsorbent for physical adsorption as the temperature increases. This trend is the same as the trend of experimental measurements in Figure 6. In addition, the higher the pressure, the better the adsorption capacity.
In Figure 6e, the adsorption capacities of CH4 and CO2 are close; it could be judged from the trend in the figure that AC is not suitable as the adsorbent in this study. For the adsorption capacity of CO2, the performance of the zeolite 13X is better than the zeolite 5A. The reason is that the zeolite 13X has a larger pore size of around 10 Å compared to the zeolite 5A, which is around 5–6 Å, so it could be inferred that the zeolite 13X would be more suitable as the adsorbent for biogas upgrading in this study. In order to determine the adsorbent with the best separation, the calculation of selectivity parameters was used to select the adsorbent in the next part. It is also the key to evaluate the separation, due to the fact that the actual adsorption state will depend on the different gas composition.
Table 8 shows the selectivity parameter results for each adsorbent at 298 K and 333 K. The selectivity parameters were calculated based on using a feed pressure and compositions of 4 atm and (64% CH4 and 36% CO2), and a desorption pressure and compositions of 0.1 atm and (5% CH4 and 95% CO2). Generally speaking, the higher the selection parameter, the better the separation effect in PSA. The results showed that the COSMO’s zeolite 13X has the highest values of equilibrium selectivity, working capacity selectivity ratio, and selection parameter at 298 K and 333 K. Therefore, we chose the COSMO’s zeolite 13X as the adsorbent in this study. Table 9 displays the parameters of the COSMO zeolite 13X.

4.1.2. COSMO Zeolite 13X Adsorption Isotherm Parameter Fitting

In this study, we also measured the equilibrium adsorption amount measurements of CH4 and CO2 on the COSMO zeolite 13X at 298 K, 310.5 K, 323 K, and 335.5 K in order to use the simulation program. As a result of concerns about laboratory safety, the adsorption isotherm data of H2S were taken from Wynnyk et al. [25]. Furthermore, we measured the equilibrium adsorption amount measurements of N2 on the COSMO zeolite 13X for the next section, the simulation program verification. The Langmuir–Freundlich isotherm, shown in Equation (4), was then used as the equilibrium adsorption model, and the parameters were fitted using the MATLAB Curve Fitting Toolbox. Table 10 displays all the fitted parameters. We can tell from the R-square data that the fitting results are satisfactory. The fitted isotherm curves are shown in Figure 7.

4.2. The Verification of Simulation Program

In this section, we compared the breakthrough curve and PSA experiment results with the simulation results in order to validate the reliability of the PSA simulation program. As a result of the laboratory safety concern, N2 was used instead of CH4.

4.2.1. The Results of Breakthrough Curve Verification

Breakthrough curve experiments were conducted in order to validate the accuracy of the LDF coefficient in the simulation program. The operating conditions are shown in Table 1. After the experiment and simulation were conducted, we compared these two results in Figure 8. Figure 8 shows the CO2 concentration profile at the bed exit as C and feed concentration as C0. The results show that our simulation data are comparable to the experimental data. Therefore, the mass transfer coefficient accuracy was confirmed.

4.2.2. The Results of Single-Bed Three-Step PSA Process Verification

In this section, a single-bed three-step PSA process was used for simulation verification. The single-bed three-step experiment was carried out for 56 cycles, and it was observed that the process reached a cyclic steady state after approximately 21 cycles. The process procedure is shown in Figure 2. Table 2 shows the step time of the bed, and Table 3 shows the operating conditions. The COSMO zeolite 13X was served as the adsorbent in the simulation verification.
The experimental and simulation results are presented in Table 11, which are quite comparable. According to Figure 9, the simulation and experiment pressure profiles follow the same trend, confirming the simulation program’s accuracy.

4.2.3. The Results of Dual-Bed Six-Step PSA Process Verification

In this section, a dual-bed six-step PSA process was used for simulation verification. The dual-bed six-step experiment was carried out for 29 cycles, and it was observed that the process reached a cyclic steady state after approximately 17 cycles. The process procedure is shown in Figure 3. Table 4 shows the step time of the bed, and the operating conditions are the same as Table 3 for the single-bed three-step PSA process. The COSMO zeolite 13X was served as the adsorbent in the simulation verification.
The experimental and simulation results are presented in Table 12, which are quite comparable. According to Figure 10, simulation and experiment pressure profiles follow the same trend, confirming the simulation program’s accuracy.

4.3. The Basic Case of Laboratory-Scale PSA Process

The goal of this section is to design a laboratory-scale PSA device for biogas upgrading. The Institute of Nuclear Energy Research in Taiwan provided a feed flow rate of 2 m3/d (308.15 K after anaerobic fermentation). The COSMO zeolite 13X was used as the adsorbent in the PSA simulation. According to the study by Sigot et al. [26], water vapor reduces the equilibrium adsorption capacity of H2S when the zeolite 13X is used as an adsorbent. As a result, water and sulfur removal must be performed on biogas before entering the PSA device. The temperature of biogas after previous treatment and the piping transfer was estimated in this study to be 298.15 K, which was used as the PSA feed temperature.
The dual-bed eight-step PSA process mentioned in Section 2.4 was used to upgrade the biogas, and the detailed operating conditions, bed parameters, and step time are shown in Table 6. Table 13 displays the simulation results for the basic case PSA process.

4.4. PSA Process Optimization at the Laboratory Scale

This section focused on the laboratory-scale PSA process to find the best results for the purity and recovery of CH4 by DOE. In this study, the full factorial design method is used to find the optimal results. Due to the fact that six factors were chosen, as shown in Table 7, a total of 64 simulations were conducted in order to perform the analysis.

4.4.1. ANOVA Table

In order to further investigate the effects of all factors on CH4 purity and recovery, the full factorial design method and ANOVA test were used. First, we performed an ANOVA test on the purity of CH4 at the top product, discarded the interaction of more than three factors, and observed only the main effects and the two-way interactions, as shown in Table 14. ANOVA results indicate that all factors significantly affect the result of top product CH4 purity, because the p-values are all less than 0.05. From the F-values, we could observe that purge pressure is the most significant factor, followed by vacuum pressure. This also affects the interaction between purge pressure and other factors to have significant influence on CH4 purity. For the two-way interactions, which interaction effect is significant according to the standard with p-value less than 0.05 could be observed. Next, we performed an ANOVA test on the recovery of CH4 at the top product, and observed only the main effects and the two-way interactions, as shown in Table 15. It was found that all main effects are significant, and feed pressure and adsorption step time are the two most significant factors among them, because of their high F-values. On the contrary, purge step time and vacuum pressure have less effects. Regardless of top product CH4 purity or recovery, the six factors we chose have significant impacts on these two responses.

4.4.2. Dual-Bed Eight-Step PSA Process Optimization

Two of the DOE’s responses are top product CH4 purity and CH4 recovery. Due to the fact that lowering the H2S content in the top product is also important, the H2S purity was also included as one of the responses, and the importance of these three responses was set to 1. Then, using Minitab software, we could obtain the best analyzed results in Figure 11. The settings of maximum CH4 purity, maximum CH4 recovery, and minimum H2S purity yield the best results.
In Figure 11, the red line represents the optimal operating conditions for these six factors, while the blue dashed line represents the predicted results under this operating condition. The best results are obtained with a feed pressure of 4.5 atm, a vacuum and purge pressure of 0.1 atm, a bed length of 25 cm, and adsorption and purge times of 83 and 256 s, and the optimal results for each factor are shown in Table 16. In addition, we ran the simulation program with these optimal conditions in order to compare the results. Table 17 shows all operating conditions for the DOE optimal case and Table 18 shows the data comparison. The optimal operating conditions of the laboratory-scale PSA process give a top product CH4 purity of 99.28% with 91.44% CH4 recovery, and the content of H2S is 0.015 ppm.

4.5. The Design of Full Scale PSA Process

The goal of this section is to design a full scale PSA device for biogas upgrading, which is expected to handle a feed flow rate of 500 m3/h. The COSMO zeolite 13X was used as the adsorbent in the PSA simulation program.
The dual-bed eight-step PSA process mentioned in Section 2.4 was used to design this full scale process. The volume of the bed is enlarged in proportion to the feed ratio to the basic case, and the ratio of bed length to bed diameter was slightly adjusted. The detailed operating conditions, bed parameters, and step time are shown in Table 19. Table 20 displays the simulation results. A top product CH4 purity of 96.1% with 91.39% CH4 recovery was obtained, and the content of H2S was 1.14 ppm. Although the CH4 purity didn’t reach 97%, it was still higher than the 95% standard of natural gas pipelines in Taiwan, and the CH4 recovery was more than 90% expected. The content of H2S was less than 4 ppm, satisfying the requirement of Taiwan’s natural gas pipelines.

5. Conclusions

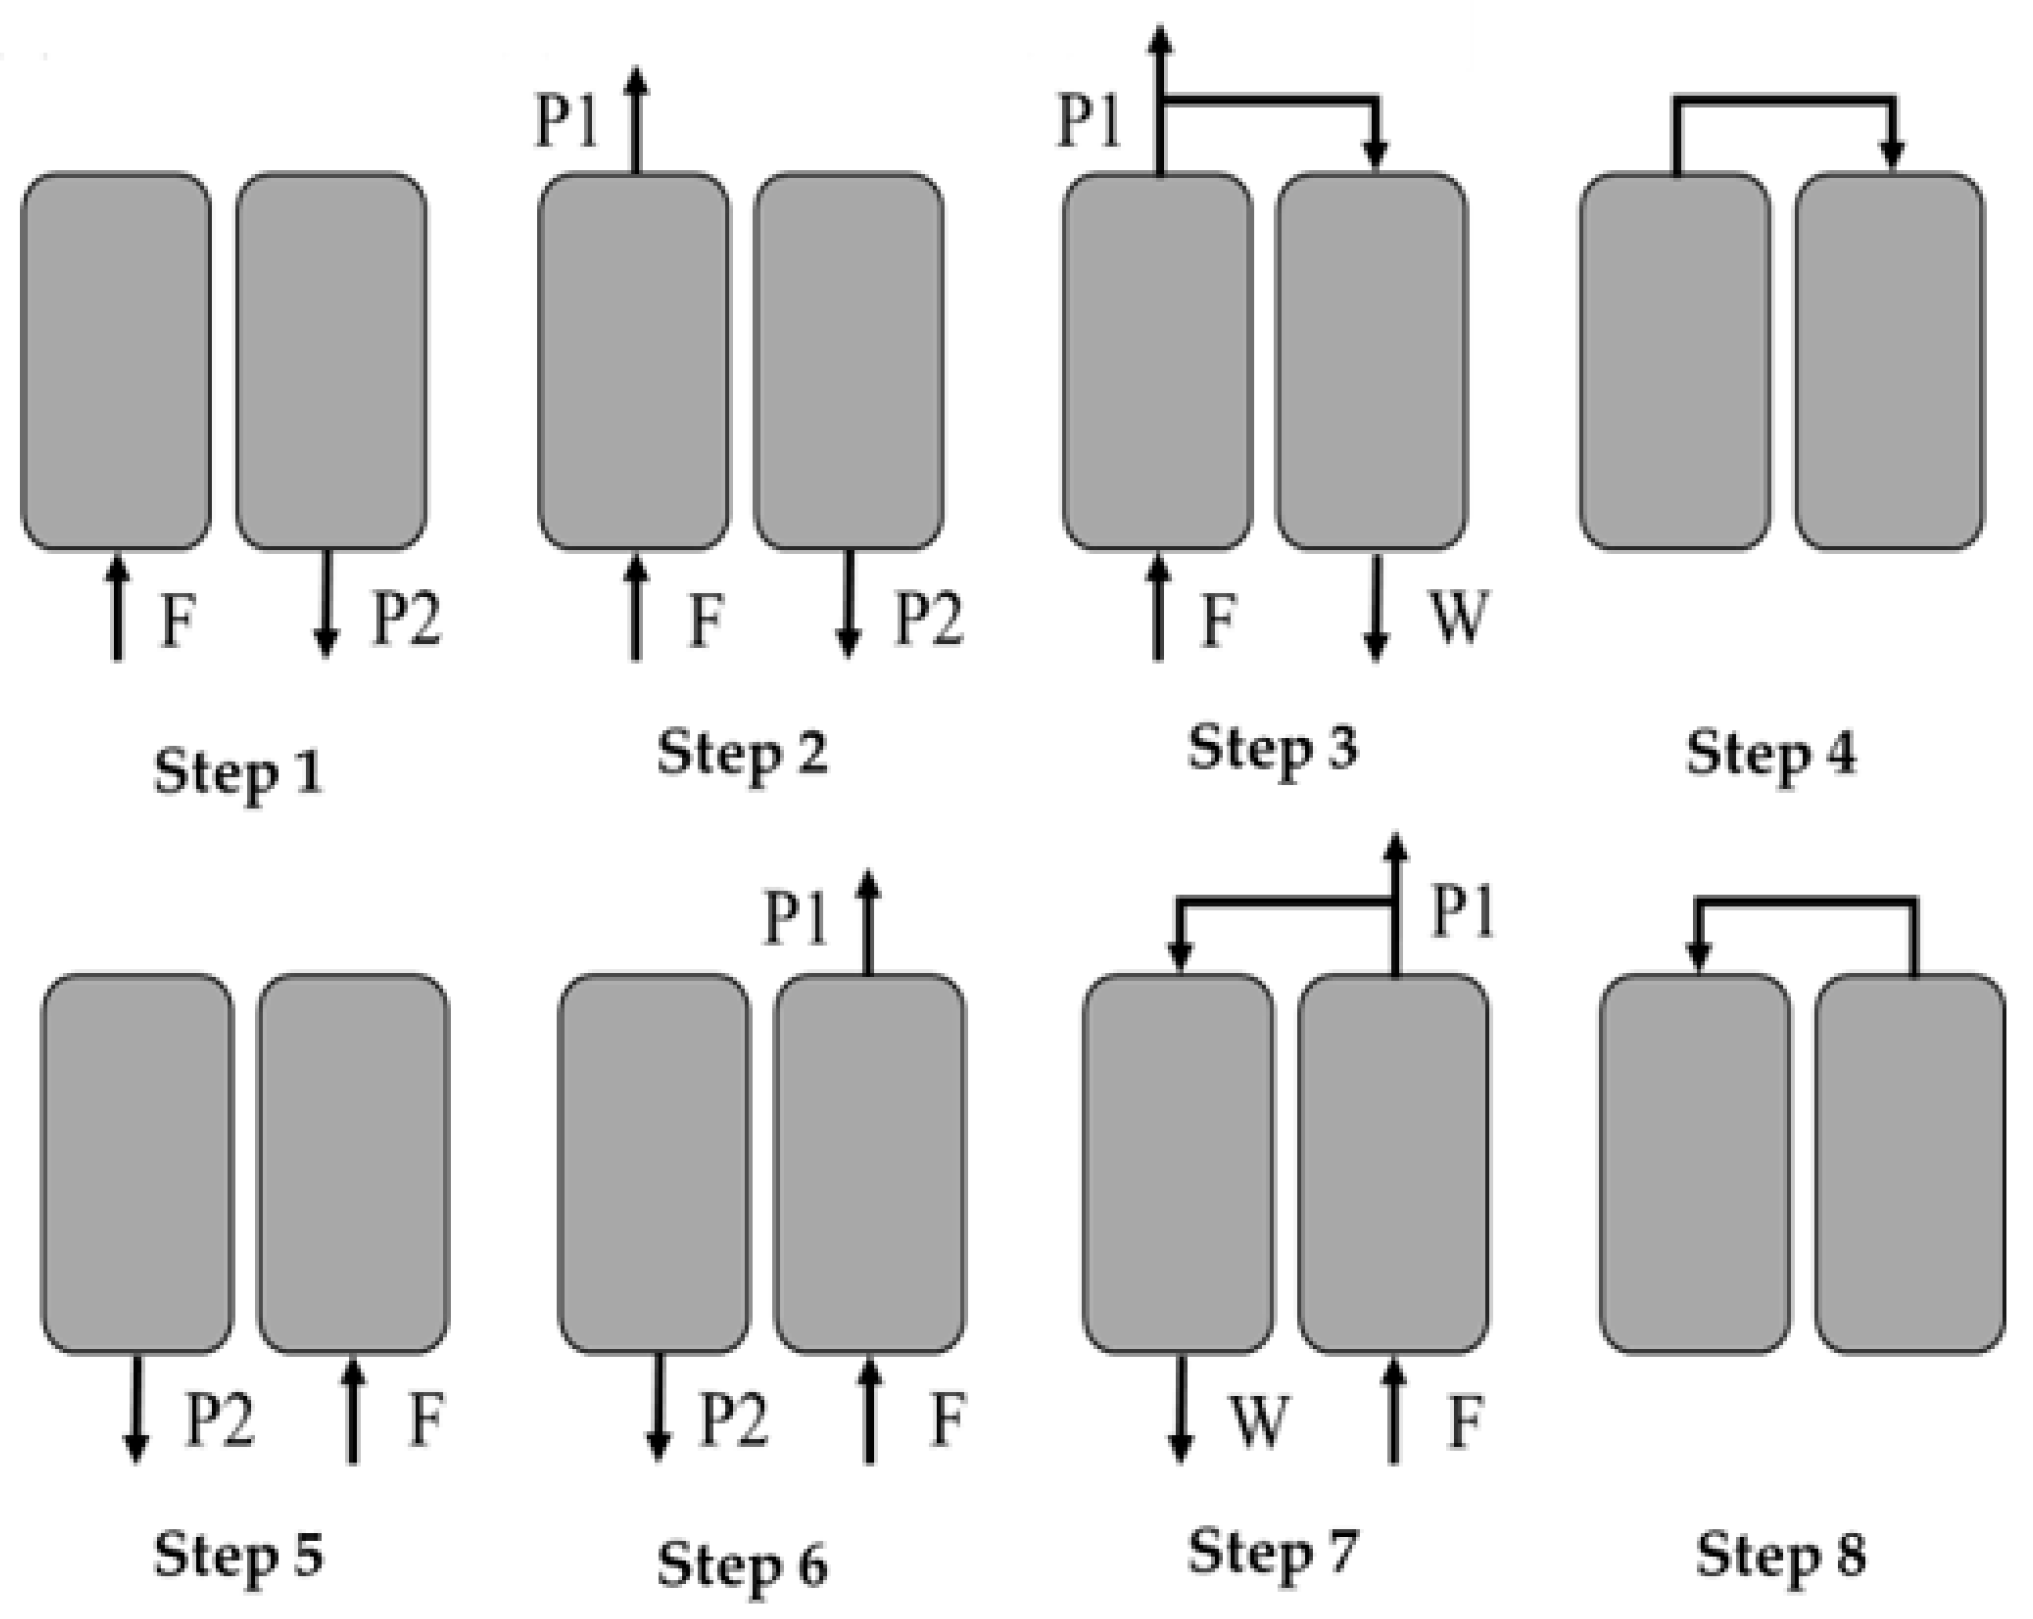
Equilibrium adsorption experiments were performed for three types of commercial adsorbents: zeolite 13X, zeolite 5A, and AC. As a result of its excellent effect on separating CH4 from biogas, the COSMO zeolite 13X was chosen as the adsorbent for the dual-bed eight-step PSA process to upgrade biogas after calculating the three selectivity parameters. The isotherm parameters were obtained for the COSMO zeolite 13X by fitting the CO2, CH4, and H2S adsorption data from the experiments and literature.
After water removal and desulfurization, the feed composition of PSA’s biogas inlet provided by Taiwan’s Institute of Nuclear Energy Research is 64% CH4, 35% CO2, and 100 ppm H2S. The simulation results for the basic case of the laboratory-scale PSA process with 2 m3/d biogas feed showed that the purity and recovery of CH4 in the top product could reach 95.47% and 91.27%, respectively, and the content of H2S was 1.06 ppm, all of which meet the standards of natural gas pipelines in Taiwan, but don’t reach the target (>97% CH4). Therefore, we used DOE’s full factorial design to find the optimal operating conditions. The simulation results showed that the purity and recovery of CH4 could reach 99.28% and 91.44%, respectively, which meet the research target. In addition, the concentration of H2S in the top product was reduced to 0.015 ppm and could greatly reduce the damage of pipeline corrosion. The energy consumption increased relatively to 0.86 GJ/ton-CH4.
In the last part, we used the same feed compositions and dual-bed eight-step process as the laboratory scale to carry out the full scale PSA process design with 500 m3/h biogas feed. The simulation results showed that the purity and recovery of CH4 in the top product could reach 96.1% and 91.39%, respectively, and the content of H2S was 1.14 ppm. Although slightly lower than the target of 97% CH4 purity, it was still higher than the pipeline standard of 95% purity in Taiwan and the process effectively reduced the content of H2S. For the future study, we plan to improve the full scale process in order to have a CH4 product purity of more than 97%, and to study the economic feasibility of the process.

Author Contributions

Formal analysis and investigation, Y.-F.C. and P.-W.L.; supervision, W.-H.C. and C.-T.C.; methodology, F.-Y.Y. and H.-S.Y., software, H.-S.Y.; writing—original draft preparation, Y.-F.C. All authors have read and agreed to the published version of the manuscript.

Funding

This research was funded by the Institute of Nuclear Energy Research in Taiwan under contract no. NL1090570.

Acknowledgments

The authors wish to thank the Institute of Nuclear Energy Research in Taiwan for financial support.

Conflicts of Interest

The authors declare no conflict of interest.

Nomenclature

α equilibrium selectivitydimensionless
ɛbed porositydimensionless
ρ s density of adsorbent(kg/ m 3 )
Across-sectional area( m 2 )
b i isotherm parameter of component i for Equation (4)dimensionless
C ¯ p average heat capacity in gas phase(J/mol · K)
C ^ p s average heat capacity in solid phase(J/mol · K)
D i bed inner diameter(m)
D a x i axial dispersion coefficient of component i ( m 2 / s )
H i adsorption heat of component i(J/mol)
hheat transfer coefficient(J/K · m 2 · s)
k ¯ average thermal conductivity(J/K · m · s)
k L D F linear driving force mass transfer coefficient(1/s)
m i isotherm parameter of component i for Equation (4)dimensionless
n i adsorbed amount of component i(mol/ m 3 )
n i * equilibrium adsorbed amount of component i(mol/ m 3 )
Ppressure(atm)
qmolar flow rate(mol/s)
q i * adsorbed amount of component i(mol/kg)
q m , i saturated adsorbed amount of component i(mol/kg)
Δ q i working capacity of the adsorbent for component i(mol/kg)
Rgas constant( m 3 · Pa/mol · K)
Sselection parameterdimensionless
Ttemperature(K)
ttime(s)
Wworking capacity selectivity ratiodimensionless
x i mole fraction of component i on the adsorbent surfacedimensionless
y i mole fraction of component i in gas phasedimensionless
zaxial position(m)

References

  1. United States Environmental Protection Agency. Greenhouse Gas Emissions: Understanding Global Warming Potentials. Available online: https://www.epa.gov/ghgemissions/understanding-global-warming-potentials (accessed on 15 June 2021).
  2. United States Environmental Protection Agency. Global Ziative: Importance of Methane. Available online: https://www.epa.gov/gmi/importance-methane (accessed on 18 June 2021).
  3. Sun, Q.; Li, H.; Yan, J.; Liu, L.; Yu, Z.; Yu, X. Selection of appropriate biogas upgrading technology-a review of biogas cleaning, upgrading and utilisation. Renew. Sustain. Energy Rev. 2015, 51, 521–532. [Google Scholar] [CrossRef]
  4. Lombardi, L.; Francini, G. Techno-economic and environmental assessment of the main biogas upgrading technologies. Renew. Energy 2020, 156, 440–458. [Google Scholar] [CrossRef]
  5. Khan, I.U.; Othman, M.H.D.; Hashim, H.; Matsuura, T.; Ismail, A.F.; Rezaei-DashtArzhandi, M.; Azelee, I.W. Biogas as a renewable energy fuel—A review of biogas upgrading, utilisation and storage. Energy Convers. Manag. 2017, 150, 277–294. [Google Scholar] [CrossRef]
  6. Zhao, Q.; Leonhardt, E.; MacConnell, C.; Frear, C.; Chen, S. Purification technologies for biogas generated by anaerobic digestion. CSANR Res. Rep. 2010, 24, 21–38. [Google Scholar]
  7. Angelidaki, I.; Treu, L.; Tsapekos, P.; Luo, G.; Campanaro, S.; Wenzel, H.; Kougias, P.G. Biogas upgrading and utilization: Current status and perspectives. Biotechnol. Adv. 2018, 36, 452–466. [Google Scholar] [CrossRef] [Green Version]
  8. Ryckebosch, E.; Drouillon, M.; Vervaeren, H. Techniques for transformation of biogas to biomethane. Biomass Bioenergy 2011, 35, 1633–1645. [Google Scholar] [CrossRef]
  9. Xie, Z.H. Taking Shi-an farm as an example to build a circular economy for agriculture and animal husbandry. City Dev. 2017, 22, 76–87. [Google Scholar]
  10. Grande, C.A.; Rodrigues, A.E. Biogas to Fuel by Vacuum Pressure Swing Adsorption I. Behavior of Equilibrium and Kinetic-Based Adsorbents. Ind. Eng. Chem. Res. 2007, 46, 4595–4605. [Google Scholar] [CrossRef]
  11. Niesner, J.; Jecha, D.; Stehlík, P. Biogas upgrading technologies: State of art review in European region. Chem. Eng. Trans. 2013, 35, 517–522. [Google Scholar]
  12. Augelletti, R.; Conti, M.; Annesini, M.C. Pressure swing adsorption for biogas upgrading. A new process configuration for the separation of biomethane and carbon dioxide. J. Clean. Prod. 2017, 140, 1390–1398. [Google Scholar] [CrossRef]
  13. Sircar, S. Pressure swing adsorption. Ind. Eng. Chem. Res. 2002, 41, 1389–1392. [Google Scholar] [CrossRef]
  14. Heck, H.H.; Hall, M.L.; dos Santos, R.; Tomadakis, M.M. Pressure swing adsorption separation of H2S/CO2/CH4 gas mixtures with molecular sieves 4A, 5A, and 13X. Sep. Sci. Technol. 2018, 53, 1490–1497. [Google Scholar] [CrossRef]
  15. Gholipour, F.; Mofarahi, M. Adsorption equilibrium of methane and carbon dioxide on zeolite 13X: Experimental and thermodynamic modeling. J. Supercrit. Fluids 2016, 111, 47–54. [Google Scholar] [CrossRef]
  16. Liu, Y.; Ritter, J.A. Fractional factorial design study of a pressure swing adsorption-solvent vapor recovery process. Adsorption 1997, 3, 151–163. [Google Scholar] [CrossRef]
  17. Grande, C.A. Biogas Upgrading by Pressure Swing Adsorption. In Biofuel’s Engineering Process Technology; dos Santos Bernardes, M.A., Ed.; IntechOpen: London, UK, 2011; pp. 65–84. [Google Scholar]
  18. Qian, X.; Yang, Y.; Lee, S.W.; Caballes, M.J.L.; Alamu, O.S. Cooling Performance Analysis of the Lab-Scale Hybrid Oyster Refrigeration System. Processes 2020, 8, 899. [Google Scholar] [CrossRef]
  19. Alvarez, R.; Villca, S.; Liden, G. Biogas production from llama and cow manure at high altitude. Biomass Bioenergy 2006, 30, 66–75. [Google Scholar] [CrossRef]
  20. Qian, X.; Chen, G.; Kattel, B.; Lee, S.; Yang, Y. Factorial Analysis of Vertical Ground Reaction Force and Required Coefficient of Friction for Safety of Stair Ascent and Descent. Int. J. Ind. Oper. Res. 2018, 1. [Google Scholar] [CrossRef]
  21. Santos, M.P.; Grande, C.A.; Rodrigues, A.E. Pressure swing adsorption for biogas upgrading. Effect of recycling streams in pressure swing adsorption design. Ind. Eng. Chem. Res. 2011, 50, 974–985. [Google Scholar] [CrossRef]
  22. Park, J.H.; Beum, B.T.; Kim, J.N.; Cho, S.H. Numerical Analysis on the Power Consumption of the PSA Process. Ind. Eng. Chem. Res. 2002, 41, 4122–4131. [Google Scholar] [CrossRef]
  23. Chou, C.T.; Chen, F.H.; Huang, Y.J.; Yang, H.S. Carbon Dioxide Capture and Hydrogen Purification from Synthesis Gas by Pressure Swing Adsorption. Chem. Eng. Trans. 2013, 32, 1855–1860. [Google Scholar]
  24. Rege, S.U.; Yang, R.T. A Simple Parameter for Selecting an Adsorbent for Gas Separation by Pressure Swing Adsorption. Sep. Sci. Technol. 2001, 36, 3355–3365. [Google Scholar] [CrossRef]
  25. Wynnyk, K.G.; Hojjati, B.; Marriott, R.A. High-Pressure Sour Gas and Water Adsorption on Zeolite 13X. Ind. Eng. Chem. Res. 2018, 57, 15357–15365. [Google Scholar] [CrossRef]
  26. Sigot, L.; Obis, M.F.; Benbelkacem, H.; Germain, P.; Ducom, G. Comparing the performance of a 13X zeolite and an impregnated activated carbon for H2S removal from biogas to fuel an SOFC. Int. J. Hydrogen Energy 2016, 41, 18533–18541. [Google Scholar] [CrossRef]
Figure 1. Schematic diagram of flowchart for research design.
Processes 09 01325 g001
Figure 2. Steps of the single-bed three-step PSA process.
Processes 09 01325 g002
Figure 3. Schematic diagram of the dual-bed six-step PSA process.
Processes 09 01325 g003
Figure 4. Schematic diagram of the dual-bed eight-step process: F, feed; P1, top product; P2, bottom product; W, waste.
Processes 09 01325 g004
Figure 5. Micro-balance Thermo D-200.
Processes 09 01325 g005
Figure 6. Equilibrium adsorption of pure CO2 and CH4 at 298 K and 333 K on (a) COSMO zeolite 13X, (b) UOP zeolite 13X, (c) EIKME zeolite 13X, (d) COSMO zeolite 5A, and (e) activated carbon. ■, CO2 at 298 K; ●, CO2 at 333 K; ▼, CH4 at 298 K; ◆, CH4 at 333 K.
Processes 09 01325 g006aProcesses 09 01325 g006b
Figure 7. Adsorption isotherm fitting curve of (a) CO2, (b) CH4, (c) H2S, and (d) N2 on COSMO zeolite 13X. Solid points represent the experimental data; solid lines represent the fitted equilibrium adsorption model.
Processes 09 01325 g007
Figure 8. The breakthrough curve for CO2.
Processes 09 01325 g008
Figure 9. Pressure profile of the single-bed three-step PSA experiment and simulation.
Processes 09 01325 g009
Figure 10. Pressure profile of the dual-bed six-step PSA experiment and simulation.
Processes 09 01325 g010
Figure 11. The optimal response of regression from top product CH4 purity (PUR. CH4), top product CH4 recovery (REC. CH4), and top product H2S purity (PUR. H2S). A, adsorption step time; B, purge step time; C, bed length; D, feed pressure; E, vacuum pressure; F, purge pressure.
Processes 09 01325 g011
Table 1. The breakthrough curve’s operation conditions.
ParameterValue
Bed length (m)1.0
Bed diameter (m)2.32 × 10⁻²
Bed volume (L)0.42
Adsorbent weight (kg/bed)2.52 × 10−1
Feed composition35.03% CO2, 64.97% N2
Feed pressure (atm)3.47
Feed temperature (K)298
Surrounding temperature (K)298
Feed flow rate (m3/s)1.67 × 10−5
Table 2. Step time of the single-bed three-step PSA process.
Single-Bed Three-StepStep 1Step 2Step 3
StepADCDBD
Time (s)15315138
Table 3. Operation conditions for the single-bed three-step PSA process.
ParameterValue
Bed length (m)1
Bed diameter (m)2.32 × 10⁻²
Bed volume (L)0.42
Adsorbent weight (kg/bed)2.52 × 10−1
Feed composition35.03% CO2, 64.97% N2
Feed pressure (atm)3.5
Cocurrent depressurization pressure (atm)0.27
Vacuum pressure (atm)0.05
Table 4. Step time of the dual-bed six-step PSA process.
Dual-Bed Six-StepStep 1Step 2Step 3Step 4Step 5Step 6
StepADADPECDBDPE
Time (s)15138151513815
Table 5. Steps of the dual-bed eight-step process.
Dual-Bed Eight-StepStep 1Step 2Step 3Step 4Step 5Step 6Step 7Step 8
Bed 1PADADPEBDBDPGPE
Bed 2BDBDPGPEPADADPE
Table 6. Adsorption bed parameters and operating conditions for the basic case.
ParameterValue
Feed composition64% CH4, 36% CO2, 0.01% H2S
Feed flow rate (m3/s, STP)2.05 × 10⁻⁵
Bed length (m)0.23
Bed inner diameter (m)0.035
Bed volume (L)0.22
Bed porosity (-)0.37
Fluid viscosity (kg/m·s)1.87 × 10−5
Feed temperature (K)298.15
Surrounding temperature (K)298.15
Feed pressure (atm)4
Vacuum pressure (atm)0.3
Vent pressure (atm)0.3
Step time (s)50, 100, 250, 25, 50, 100, 250, 25
Table 7. The high- and low-level setting values for each factor in DOE.
FactorLow (−)High (+)
A. Adsorption step time (s)80120
B. Purge step time (s)230270
C. Bed length (cm)2125
D. Feed pressure (atm)3.54.5
E. Vacuum pressure (atm)0.10.5
F. Purge pressure (atm)0.10.5
Table 8. Equilibrium selectivity ( α ), working capacities selectivity ratio (W), and selection parameter ( S ) of different adsorbents at 298 K and 333 K.
Adsorbent α W S
Temperature298 K333 K298 K333 K298 K333 K
COSMO zeolite 13X9.1915.542.806.5625.75101.94
UOP zeolite 13X7.819.041.473.3911.4826.33
EIKME zeolite 13X7.739.961.532.9111.8033.77
COSMO zeolite 5A5.929.660.772.374.5722.91
Activate carbon2.883.661.301.813.746.62
Table 9. Properties of COSMO zeolite 13X.
ParameterValue
Radius of the pellet (m)1 × 10⁻³
Pellet density (kg/m3)2156.5 *
Mean macro-pore diameter (m)2.43 × 10⁻⁸ †
Macro-pore porosity (-)0.423
Specific heat capacity (J/g·°C)1.4
* Determined by He pycnometry (Accupyc® II1340). Determined by mercury porosimetry (micromeritics AutoPore® IV 9520). Determined by differential scanning calorimeter.
Table 10. Parameters in Langmuir–Freundlich isotherm for COSMO zeolite 13X.
ParametersCO2CH4H2SN2
ai,1 (mol/kg)14.064.74616.0773.42
ai,2 (mol/kg·K)−3.052 × 102−8.176 × 10⁴−3.245 × 10²−0.15
bi,0 (1/atm)0.1492.278 × 1055.790 × 1021.307 × 103
bi,1 (K)9.394 × 1022.445 × 1031.361 × 1036.561 × 102
mi,1 (-)2.9290.9870.8330.850
mi,2 (K)−6.527 × 10218.79−9.928 × 10⁵−55.24
Goodness of fit
R-square0.98920.99120.98370.9975
Table 11. Results of the single-bed three-step process.
VariableExperimentSimulation
Top product flow rate (m3/s, STP)1.72 × 1051.72 × 105
N2 purity (%)/recovery (%)94.36/71.3595.49/76.16
Bottom product flow rate (m3/s, STP)9.67 × 1069.83 × 106
CO2 purity (%)/recovery (%)98.50/81.8398.98/83.50
CD flow rate (m3/s, STP)6.67 × 1066.17 × 106
CO2 purity (%)/recovery (%)17.66/9.9418.62/9.91
N2 purity (%)/recovery (%)82.34/24.9881.38/23.31
Table 12. Results of the dual-bed six-step PSA process.
VariableExperimentSimulation
Top product flow rate (m3/s, STP)3.47 × 1053.47 × 105
N2 purity (%)/recovery (%)96.69/85.4597.29/85.78
Bottom product flow rate (m3/s, STP)1.70 × 1051.70 × 105
CO2 purity (%)/recovery (%)99.03/79.4999.33/79.78
CD flow rate (m3/s, STP)8.67 × 1068.83 × 106
CO2 purity (%)/recovery (%)36.49/15.0836.87/15.33
N2 purity (%)/recovery (%)63.51/14.1363.13/14.14
Table 13. Simulation results of the basic case PSA process.
VariableResults
Feed flow rate (m3/s, STP)2.11 × 10⁵
Top product flow rate (m3/s, STP)1.29 × 10⁵
CH4 purity/recovery (%)95.47/91.27
CO2 purity/recovery (%)4.53/7.70
H2S purity (ppm)1.06
Bottom product flow rate (m3/s, STP)4.30 × 10⁶
CH4 purity/recovery (%)11.33/3.60
CO2 purity/recovery (%)88.64/50.03
Waste flow rate (m3/s, STP)3.87 × 10⁶
CH4 purity/recovery (%)20.66/5.90
CO2 purity/recovery (%)79.32/40.30
Table 14. The ANOVA table for the top product CH4 purity. * indicate the interaction between two factors.
SourceDFAdj SSAdj MSF-Valuep-Value
Main Effects6
A (adsorption step time)124.1924.19123.68<0.001
B (purge step time)114.4214.4273.72<0.001
C (bed length)143.1143.11220.43<0.001
D (feed pressure)184.5284.52432.2<0.001
E (vacuum pressure)187.0387.03445.04<0.001
F (purge pressure)11590.71590.78134.14<0.001
2-Way Interactions15
A*B1<0.001<0.001<0.0010.966
A*C10.120.120.620.435
A*D11.011.015.160.028
A*E15.265.2626.92<0.001
A*F17.857.8540.14<0.001
B*C10.130.130.670.416
B*D11.171.175.970.019
B*E10.20.210.322
B*F17.627.6238.95<0.001
C*D12.342.3411.99<0.001
C*E10.990.995.090.029
C*F113.2313.2367.68<0.001
D*E10.060.060.280.597
D*F131.5431.54161.26<0.001
E*F156.7656.76290.25<0.001
Residual Error428.210.2
Total63
* indicate the interaction between two factors.
Table 15. The ANOVA table for the top product CH4 recovery.
SourceDFAdj SSAdj MSF-Valuep-Value
Main Effects6
A (adsorption step time)139.72539.725177.47<0.001
B (purge step time)11.8131.8138.10.007
C (bed length)111.93411.93453.31<0.001
D (feed pressure)1133.774133.774597.61<0.001
E (vacuum pressure)11.2841.2845.740.021
F (purge pressure)116.87616.87675.39<0.001
2-Way Interactions15
A*B11.3181.3185.890.02
A*C10.9730.9734.350.043
A*D13.0783.07813.750.001
A*E10.3120.3121.390.244
A*F11.2311.2315.50.024
B*C11.2591.2595.630.022
B*D11.2831.2835.730.021
B*E10.0070.0070.030.859
B*F10.4910.4912.20.146
C*D17.4577.45733.31<0.001
C*E10.1650.1650.740.396
C*F10.2670.2671.190.281
D*E10.7970.7973.560.066
D*F15.9215.92126.45<0.001
E*F17.9437.94335.48<0.001
Residual Error429.4020.224
Total63
* indicate the interaction between two factors.
Table 16. The optimal results for each factor after analyzing from Minitab.
FactorOptimal Result
A. Adsorption step time (s)83
B. Purge step time (s)256
C. Bed length (cm)25
D. Feed pressure (atm)4.5
E. Vacuum pressure (atm)0.1
F. Purge pressure (atm)0.1
Table 17. Parameters of adsorption bed and operating conditions for the DOE optimal case.
ParameterValue
Feed composition64% CH4, 36% CO2, 0.01% H2S
Feed flow rate (m3/s, STP)2.44 × 10⁻⁵
Bed length (m)0.25
Bed inner diameter (m)0.035
Bed volume (L)0.24
Bed porosity (-)0.37
Fluid viscosity (kg/m·s)1.87 × 10−5
Feed temperature (K)298.15
Surrounding temperature (K)298.15
Feed pressure (atm)4.5
Vacuum pressure (atm)0.1
Vent pressure (atm)0.1
Step time (s)50, 83, 256, 25, 50, 83, 256, 25
Table 18. The results of simulation before and after the DOE.
ParameterSimulation for Basic CasePredicted Response from MinitabSimulation after DOE
Top product CH4 purity (%)95.4799.4799.28
Top product CH4 recovery (%)91.2791.6391.44
Top product H2S purity (ppm)1.061.000.015
Energy consumption (GJ/ton-CH4)0.68-0.86
Table 19. Adsorption bed parameters and operating conditions for the full scale process.
ParameterValue
Feed composition64% CH4, 36% CO2, 0.01% H2S
Bed length (m)2.46
Bed inner diameter (m)0.82
Bed volume (L)129.1
Bed porosity (-)0.37
Fluid viscosity (kg/m·s)1.87 × 10−5
Feed temperature (K)298.15
Surrounding temperature (K)298.15
Feed pressure (atm)4.5
Vacuum pressure (atm)0.3
Vent pressure (atm)0.3
Step time (s)50, 100, 250, 25, 50, 100, 250, 25
Table 20. Simulation results of the full scale PSA process.
VariableResults
Feed flow rate (m3/s, STP)1.20 × 101
Top product flow rate (m3/s, STP)7.27 × 10²
CH4 purity/recovery (%)96.1/91.39
CO2 purity/recovery (%)3.91/6.61
H2S purity (ppm)1.14
Bottom product flow rate (m3/s, STP)2.35 × 10⁻²
CH4 purity/recovery (%)11.33/3.60
CO2 purity/recovery (%)88.51/48.41
Waste flow rate (m3/s, STP)2.33 × 10²
CH4 purity/recovery (%)17.42/5.31
CO2 purity/recovery (%)82.55/44.71
Publisher’s Note: MDPI stays neutral with regard to jurisdictional claims in published maps and institutional affiliations.

