
A Mechanistic Model to Assess the Fate of Naphthalene and Benzo(a)pyrene in a Chilean WWTP


Abstract
:1. Introduction

| Location | Inflow and Population Served | Treatment Technology | Naphthalene [ng/L] | Benzo(a)pyrene [ng/L] | ∑LMW PAHs [ng/L] | ∑HMW PAHs [ng/L] | ∑PAHs [ng/L] | Reference | |||||
|---|---|---|---|---|---|---|---|---|---|---|---|---|---|
| Influent | Effluent | Influent | Effluent | Influent | Effluent | Influent | Effluent | Influent | Effluent | ||||
| Belo Horizonte, Brazil | 290,000 m3/d 1,600,000 PE | CAS | 114.3 | 46.1 | 25.8 | 27.6 | 290.7 | 183.9 | 50.3 | 54.4 | 553.5 | 483.7 | [20] |
| 155,000 m3/d 1,100,000 PE | UASB with trickling filters | 217.5 | 102.8 | 26.3 | 25.4 | 483.5 | 270.3 | 50.8 | 50 | 699.6 | 472.4 | ||
| 1600 m3/d 30,000 PE | WSP | 435.8 | 61.4 | 25.1 | 27.4 | 996 | 219.8 | 69.4 | 54.9 | 1210.8 | 431.1 | ||
| Konya, Turkey | 200,000 m3/d 1,300,000 population Unknown content of industrial input | 4 stage Bardenpho | 2282 | 560 | 72 | 46 | 2386 | 594 | 229 | 183 | 2615 | 777 | [21] |
| 16,500 m3/d 110,000 population | WSP | 1429 | 370 | 39 | 43 | 1509 | 436 | 193 | 181 | 1702 | 617 | ||
| 210 m3/d 2000 people | CW | 360 | 103 | 42 | 36 | 444 | 161 | 197 | 173 | 641 | 334 | ||
| Guangzhou, China | 220,000 m3/d Municipal ww | Inverted A2/O | 435.5 | 80.1 | ND | ND | 551.1 | 143.8 | 99.0 | 79.9 | 650.1 | 223.8 | [17] |
| Harbin, China | 650,000 m3/d 80% domestic | A/O and BAF | 882 | 471 | 100 | ND | 1866.3 | 859.6 | 1039.9 | 114.1 | 2906.2 | 973.7 | [12] |
| Hefei, China | 300,000 m3/d 60% municipal ww | A/O | 1437.3 | 924.4 | 1383.5 | 380.4 | 2073 | 1327.6 | 3685.8 | 912.8 | 5758.8 | 2240.4 | [22] |
| Tai’an, China | 50,000 m3/d 60% municipal ww. In autumn | A2/O | 971.1 | 207.9 | ND | ND | 1129.4 | 258 | 27.5 | 3.1 | 1156.9 | 261.1 | [23] |
| 50,000 m3/day 60% municipal ww. In spring | 205.6 | 56.7 | ND | ND | 659.5 | 123.7 | 488.9 | 5.5 | 1148.4 | 129.2 | |||
| Italy | 25,000 m3/d 30% municipal | CAS | 250 | 56 | 16 | ND | 735 | 133 | 215 | 90 | 950 | 223 | [9] |
| 15,000 m3/d 100% municipal | CAS | 96 | 73 | ND | ND | 307 | 127 | 56 | 12 | 363 | 139 | ||
| 19,500 m3/d 100% municipal | CAS | 113 | 43 | ND | ND | 195 | 43 | 8 | 7 | 203 | 50 | ||
| 118,000 m3/d 60% municipal | CAS | 634 | 74 | 14 | ND | 1315 | 131 | 356 | 37 | 1671 | 168 | ||
| 21,000 m3/d 90% municipal | CAS | 103 | 37 | 20 | ND | 324 | 83 | 189 | ND | 513 | 83 | ||
| Norway | 106,750 m3/d Domestic ww | A/O | 315 | 26 | 13 | ND | 558 | 30 | 242 | 1 | 800 | 31 | [24] |
| 35,450 m3/d Domestic ww | Chemical treatment | 325 | 445 | 7 | ND | 721 | 815 | 198 | 40 | 925 | 855 | ||
| 21,050 m3/d Domestic ww | Chemical treatment | 84 | 105 | 16 | ND | 245 | 145 | 225 | 5 | 470 | 150 | ||
| 23,125 m3/d Domestic ww | Chemical treatment | 250 | 170 | 8 | ND | 388 | 215 | 157 | 17 | 545 | 232 | ||
| 10,150 m3/d Domestic ww | Mechanical treatment | 122 | 105 | ND | ND | 175 | 145 | 72 | 55 | 250 | 190 | ||
| Venice, Italy | 100,000 m3/d 90% municipal | Denitrification, oxidation + nitrification | 18 | 5 | 17 | 2 | 90 | 35 | 121 | 41 | 211 | 76 | [8] |
| Thessaloniki, Greece | 40,000 m3/d Municipal ww | CAS | 7300 | 5000 | 22 | 4.8 | 10,490 | 5547 | 1023.7 | 137.8 | 11,513.7 | 5684.8 | [10] |
| Montreal, Canada | 1,300,000 m3/d 85% municipal 1,400,000 population | Coagulation-flocculation | 147 | 88 | 48 | 1 | 582 | 231 | 603 | 60 | 1185 | 291 | [11] |
| Description | Modeled Treatment Stages | Modeled Micropollutants | Processes | Reference |
|---|---|---|---|---|
| Studies using the 2-phase approach to model the fate of micropollutants | ||||
| Fate of organic micropollutants in novel WWTPs | CEPT, HRAS, RBF, PN-AMX | Pharmaceuticals | Sorption, biodegradation (pseudo-first-order reaction) | [25] |
| Modeling of micropollutant removal in full-scale MBRs | MBR | 51 MPs: 24 metals, 10 beta blockers, 8 pharmaceutical products, 2 alkylphenols, 3 PAHs, and 4 pesticides | Biodegradation (dissolved and particulate phase) in oxic and anoxic conditions and sorption/desorption | [26] |
| Mechanistic modeling approach to anaerobic systems | AD | 20 OMPs | Sorption, desorption, biotransformation in the liquid and solid phase | [27] |
| Fate of micropollutants in aeration tank and secondary clarifier | AS + SC | MPs (androstenedione, ibuprofen, triclosan, and caffeine) | Biological degradation (first-order reaction) and sorption | [28] |
| Activated Sludge Model for Xenobiotics (ASM-X) | AS | Pharmaceuticals | Co-metabolic biotransformation, retransformation in oxic and anoxic conditions and sorption/desorption | [29,30] |
| Dynamic transport and fate of micropollutants in integrated urban wastewater and stormwater systems | Sewers; WWTPs (PR, AS, SC, F, ST, AD, SD; river (water, sediment) | MPs | Settling, resuspension, volatilization, filtration/separation, sorption, desorption, hydrolysis, photolysis, biological biodegradation (aerobic, anoxic/anaerobic) | [31] |
| Model for co-metabolic biotransformation of organic micropollutants in NAS reactors | NAS | Pharmaceuticals | Co-metabolic biotransformation, sorption/desorption and volatilization | [32] |
| Mechanistic model for fate of estrogens in inverted A/O reactors | Anoxic/aerobic reactor | Estrogens | Cleavage, adsorption, desorption, aerobic biodegradation, anoxic biodegradation | [33] |
| Micropollutant fate in SBRs during startup and steady state | SBR | Cadmium and lead | Adsorption | [34] |
| Steady-state model for the fate of hydrophobic and volatile compounds in activated sludge | PR, AS | VOCs | Biodegradation, bubble and surface volatilization, sorption to particles | [35] |
| Studies using the 3-phase approach to model the fate of micropollutants | ||||
| Modelling PAHs removal in activated sludge process: effect of disintegration | AS | PAHs | Biodegradation, volatilization, sorption/desorption to particulate matter and sorption/desorption to DCM. | [15] |
| Dynamic model for bioavailability and co-metabolism of micropollutants during anaerobic digestion | AD | PAHs | Co-metabolic biodegradation, volatilization, sorption/desorption to particles and DCM | [36] |
| A three-compartment model for micropollutants sorption in sludge | AD | PAHs | Biodegradation, sorption to particles and DCM | [37] |
2. Materials and Methods
2.1. Model Treatment Plant
2.2. PAH Influent Loads
2.3. Mechanistic Model for the Fate of PAHs in the WWTP
- According to different authors, the removal of micropollutants during preliminary treatment is close to null [40,41]. Moreover, experimental sampling by Manoli et al. (1999) reported negligible removal of PAHs by chlorination [10]. Thus, preliminary treatment and chlorination are not considered in the current model.
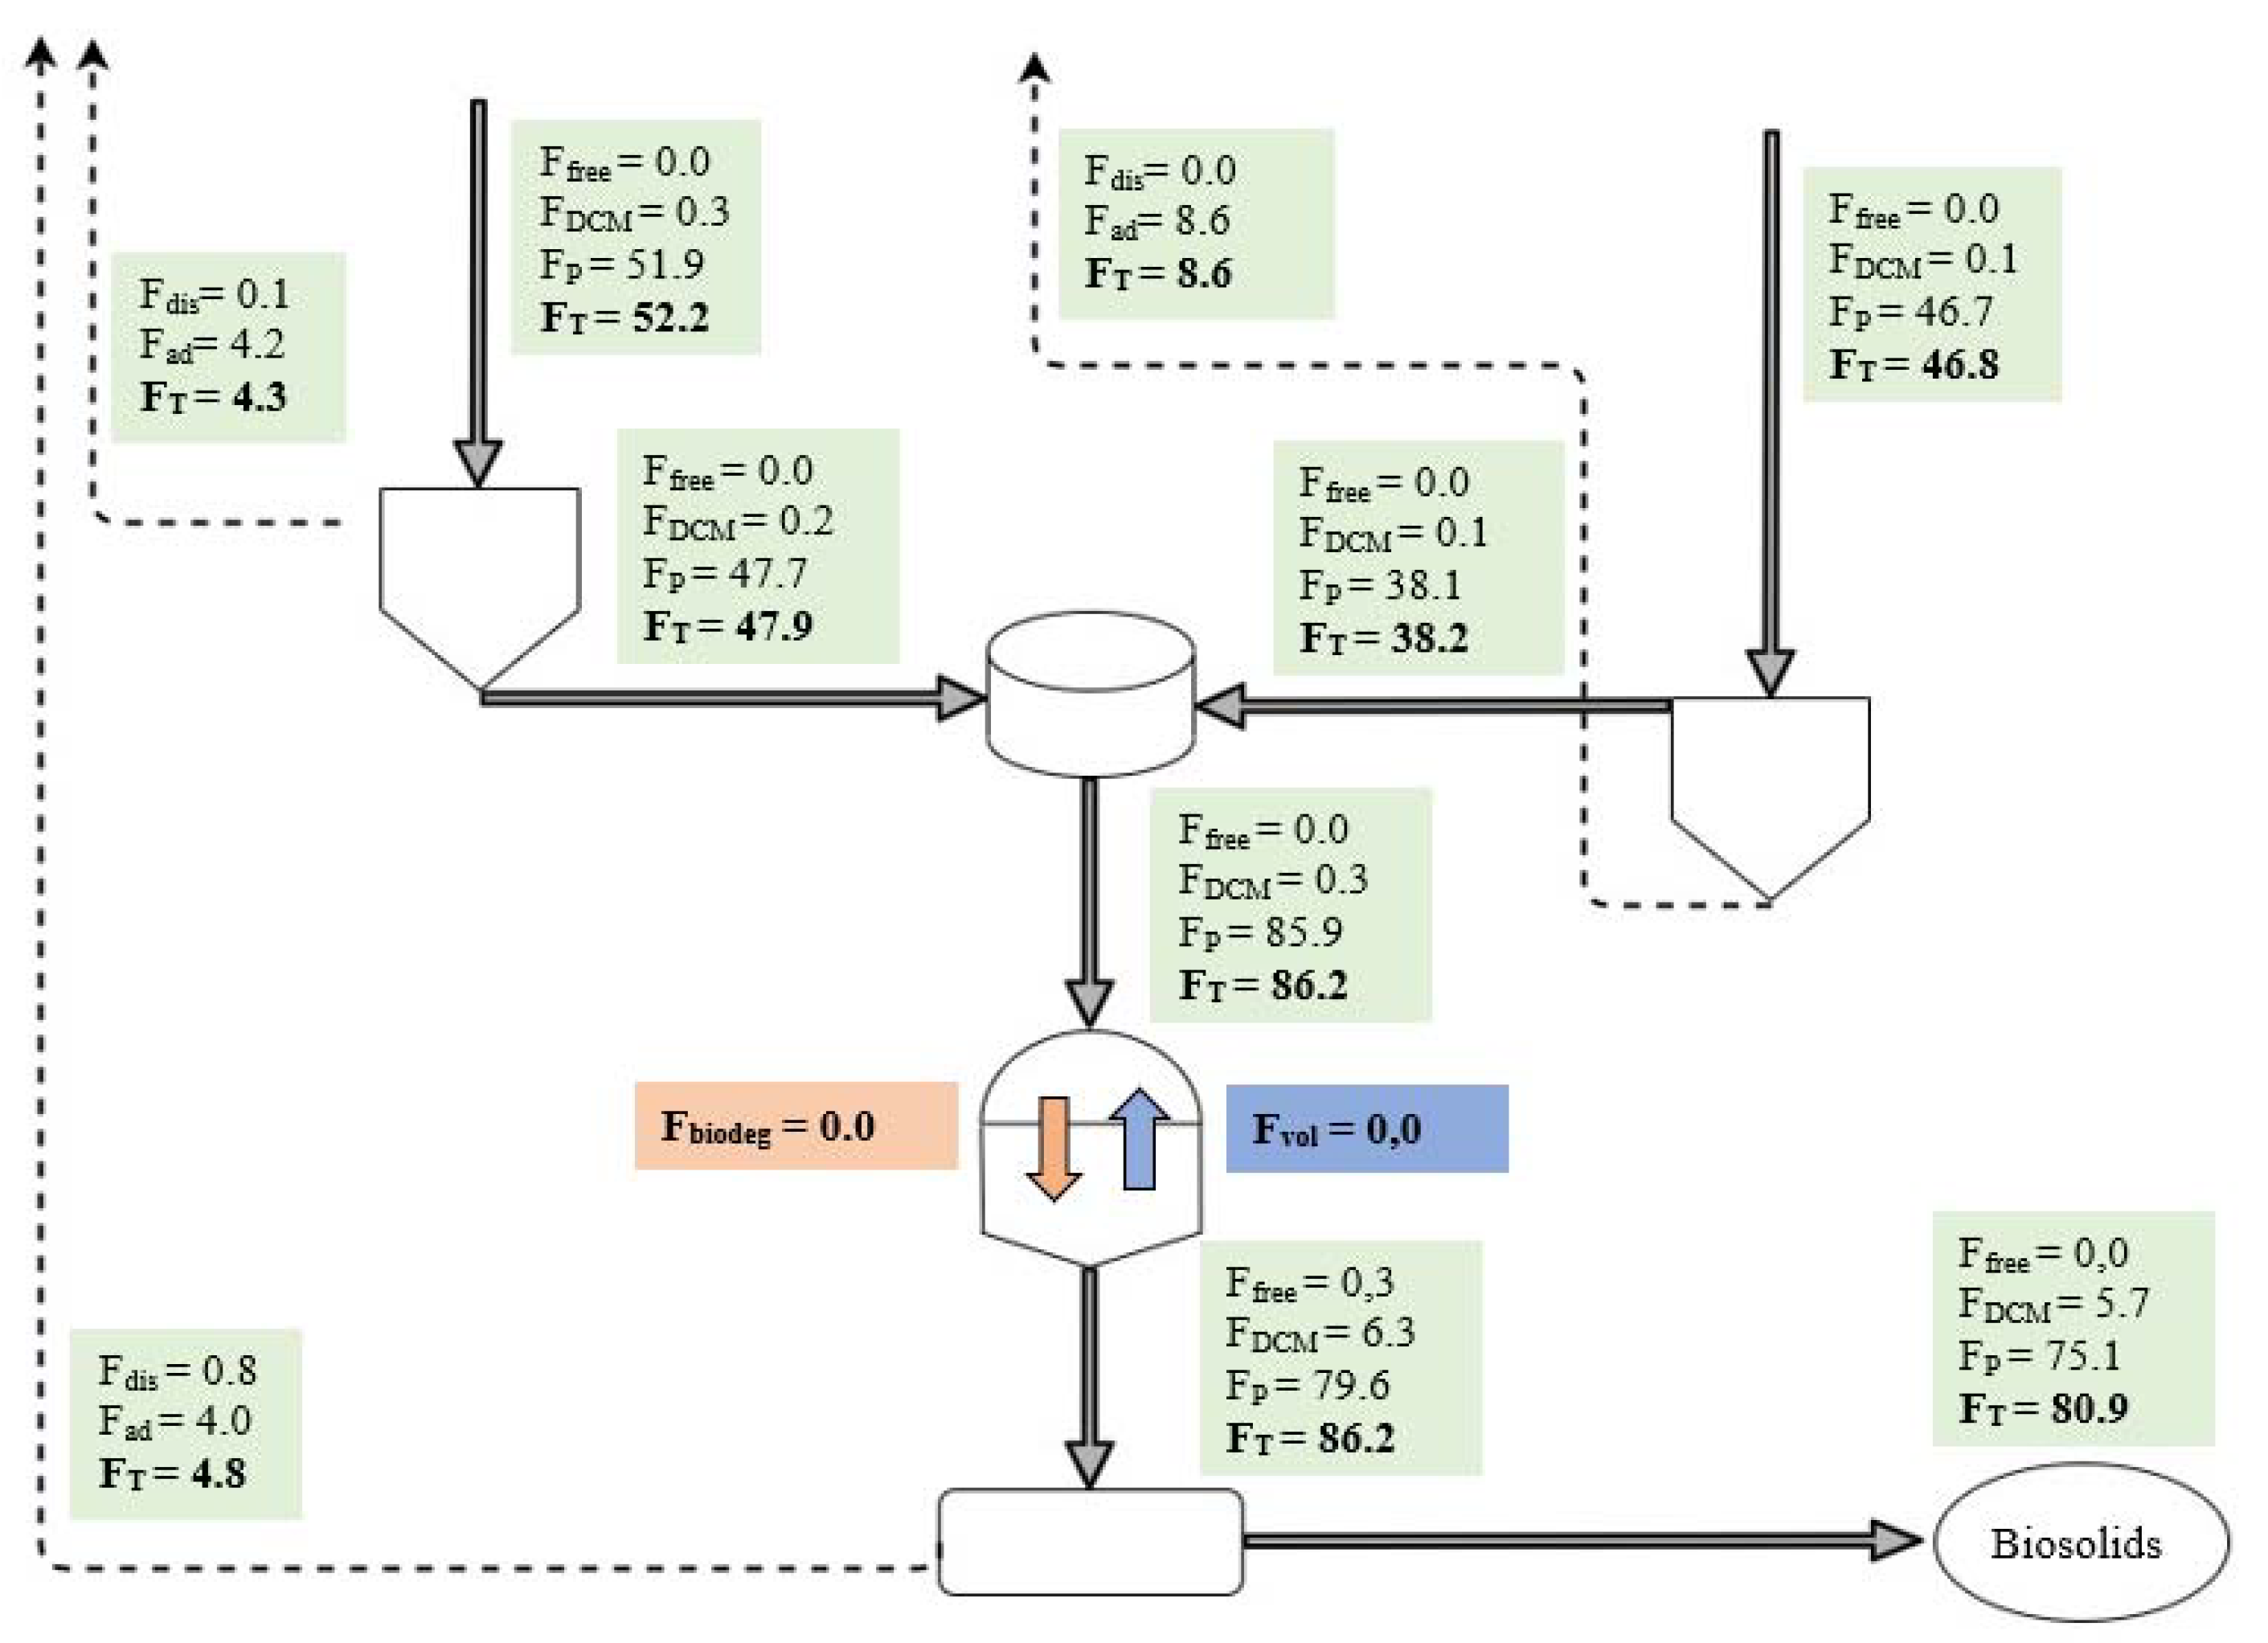
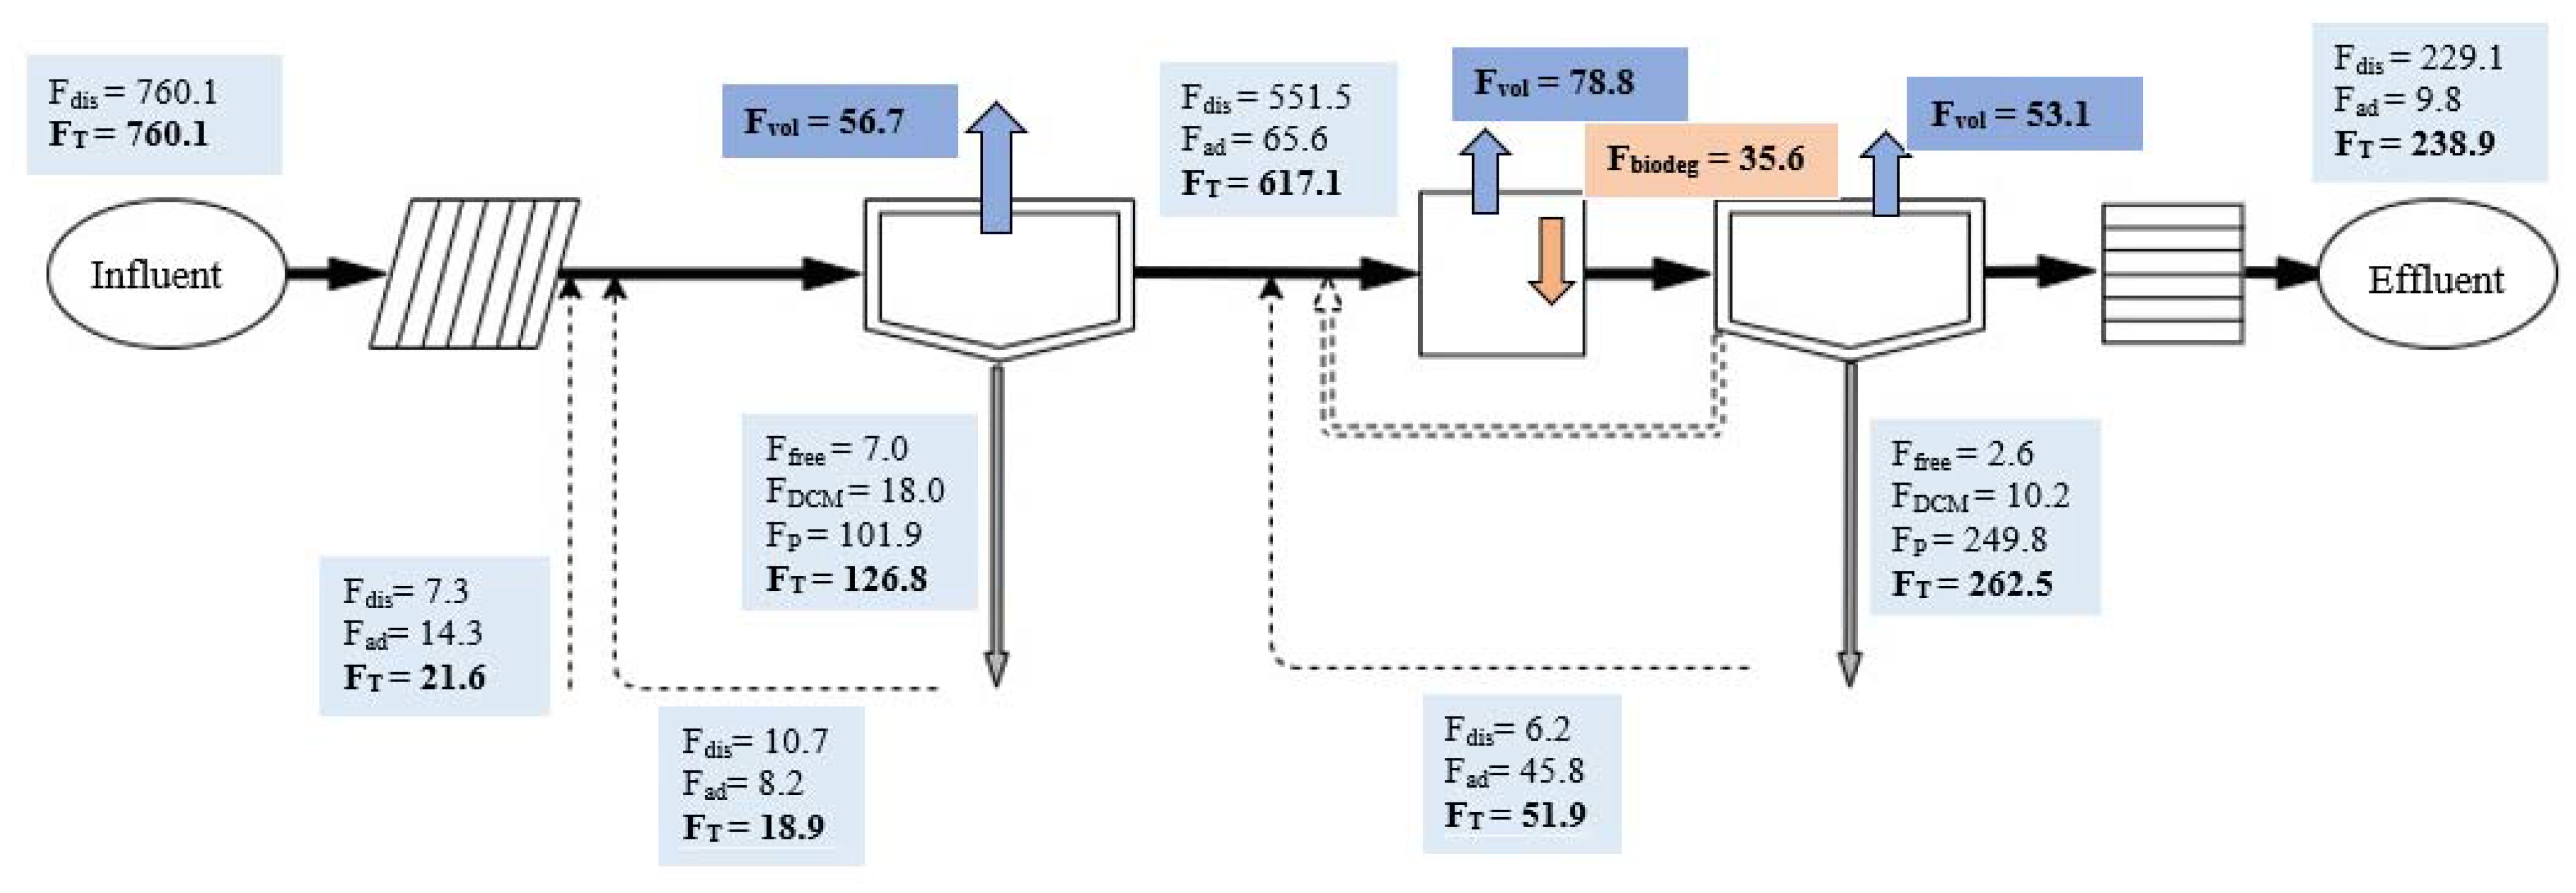
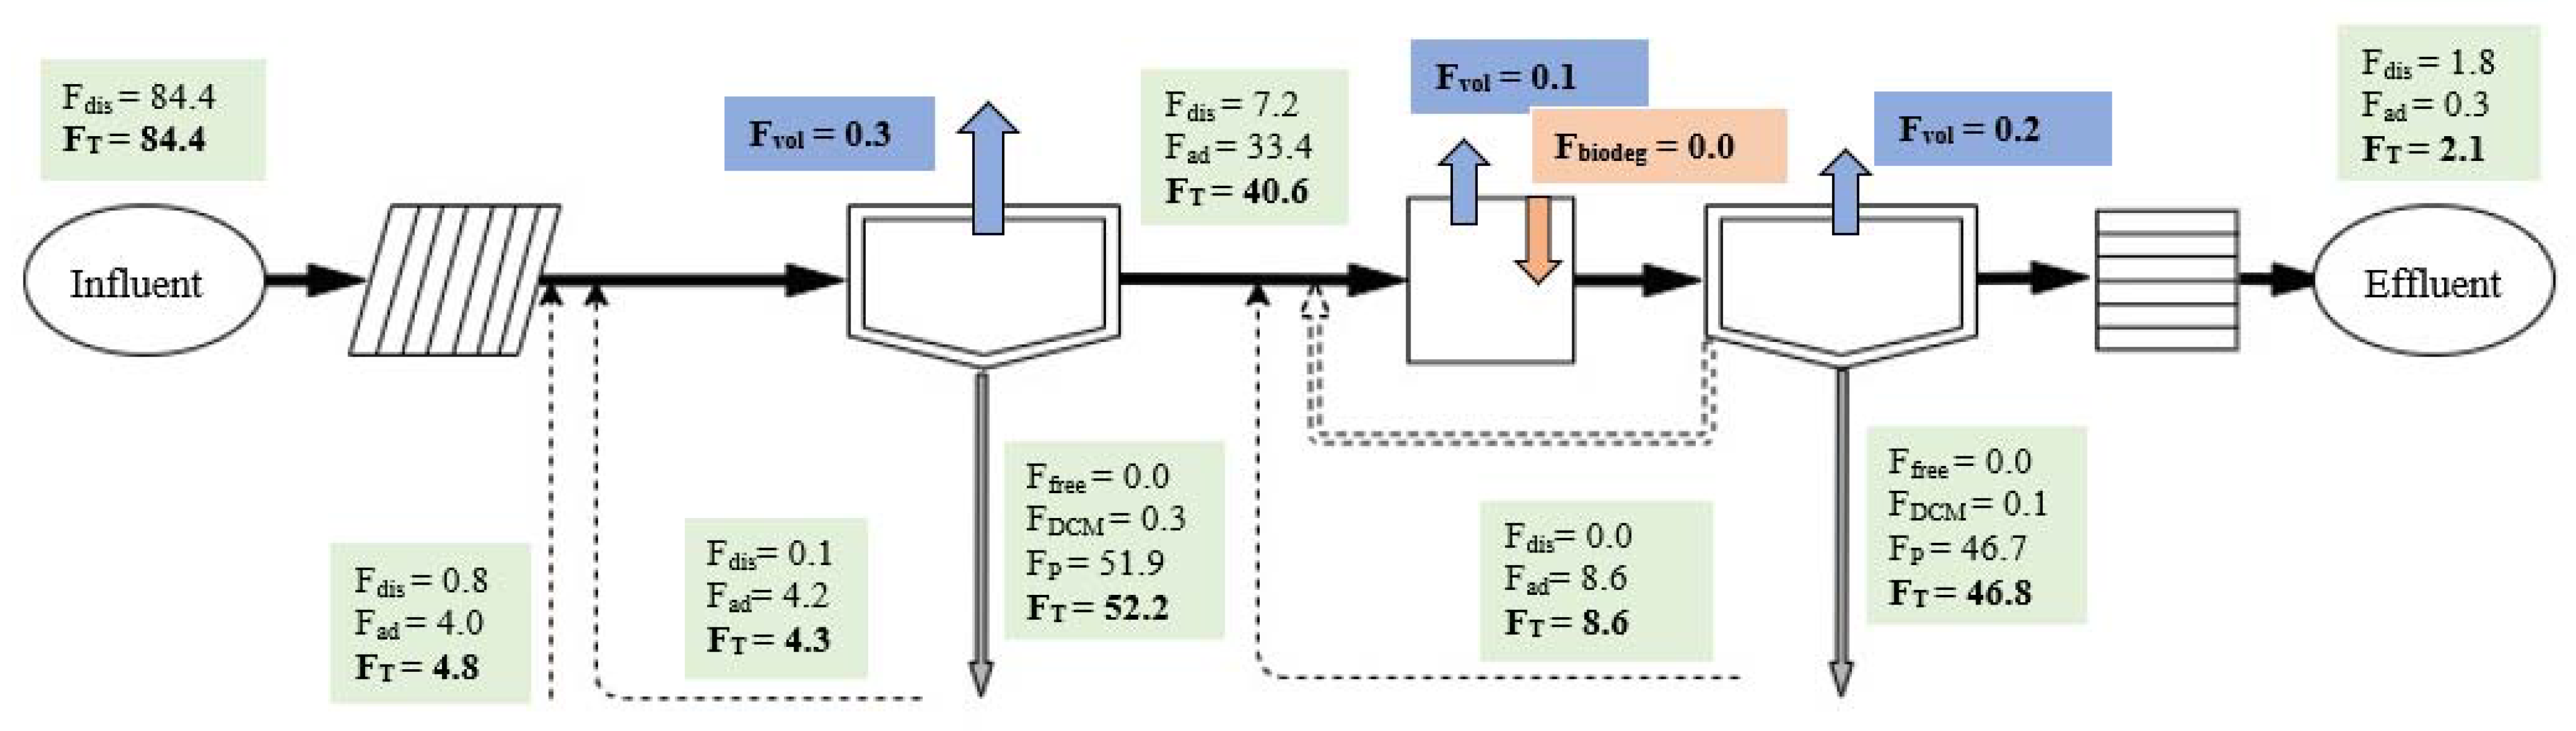
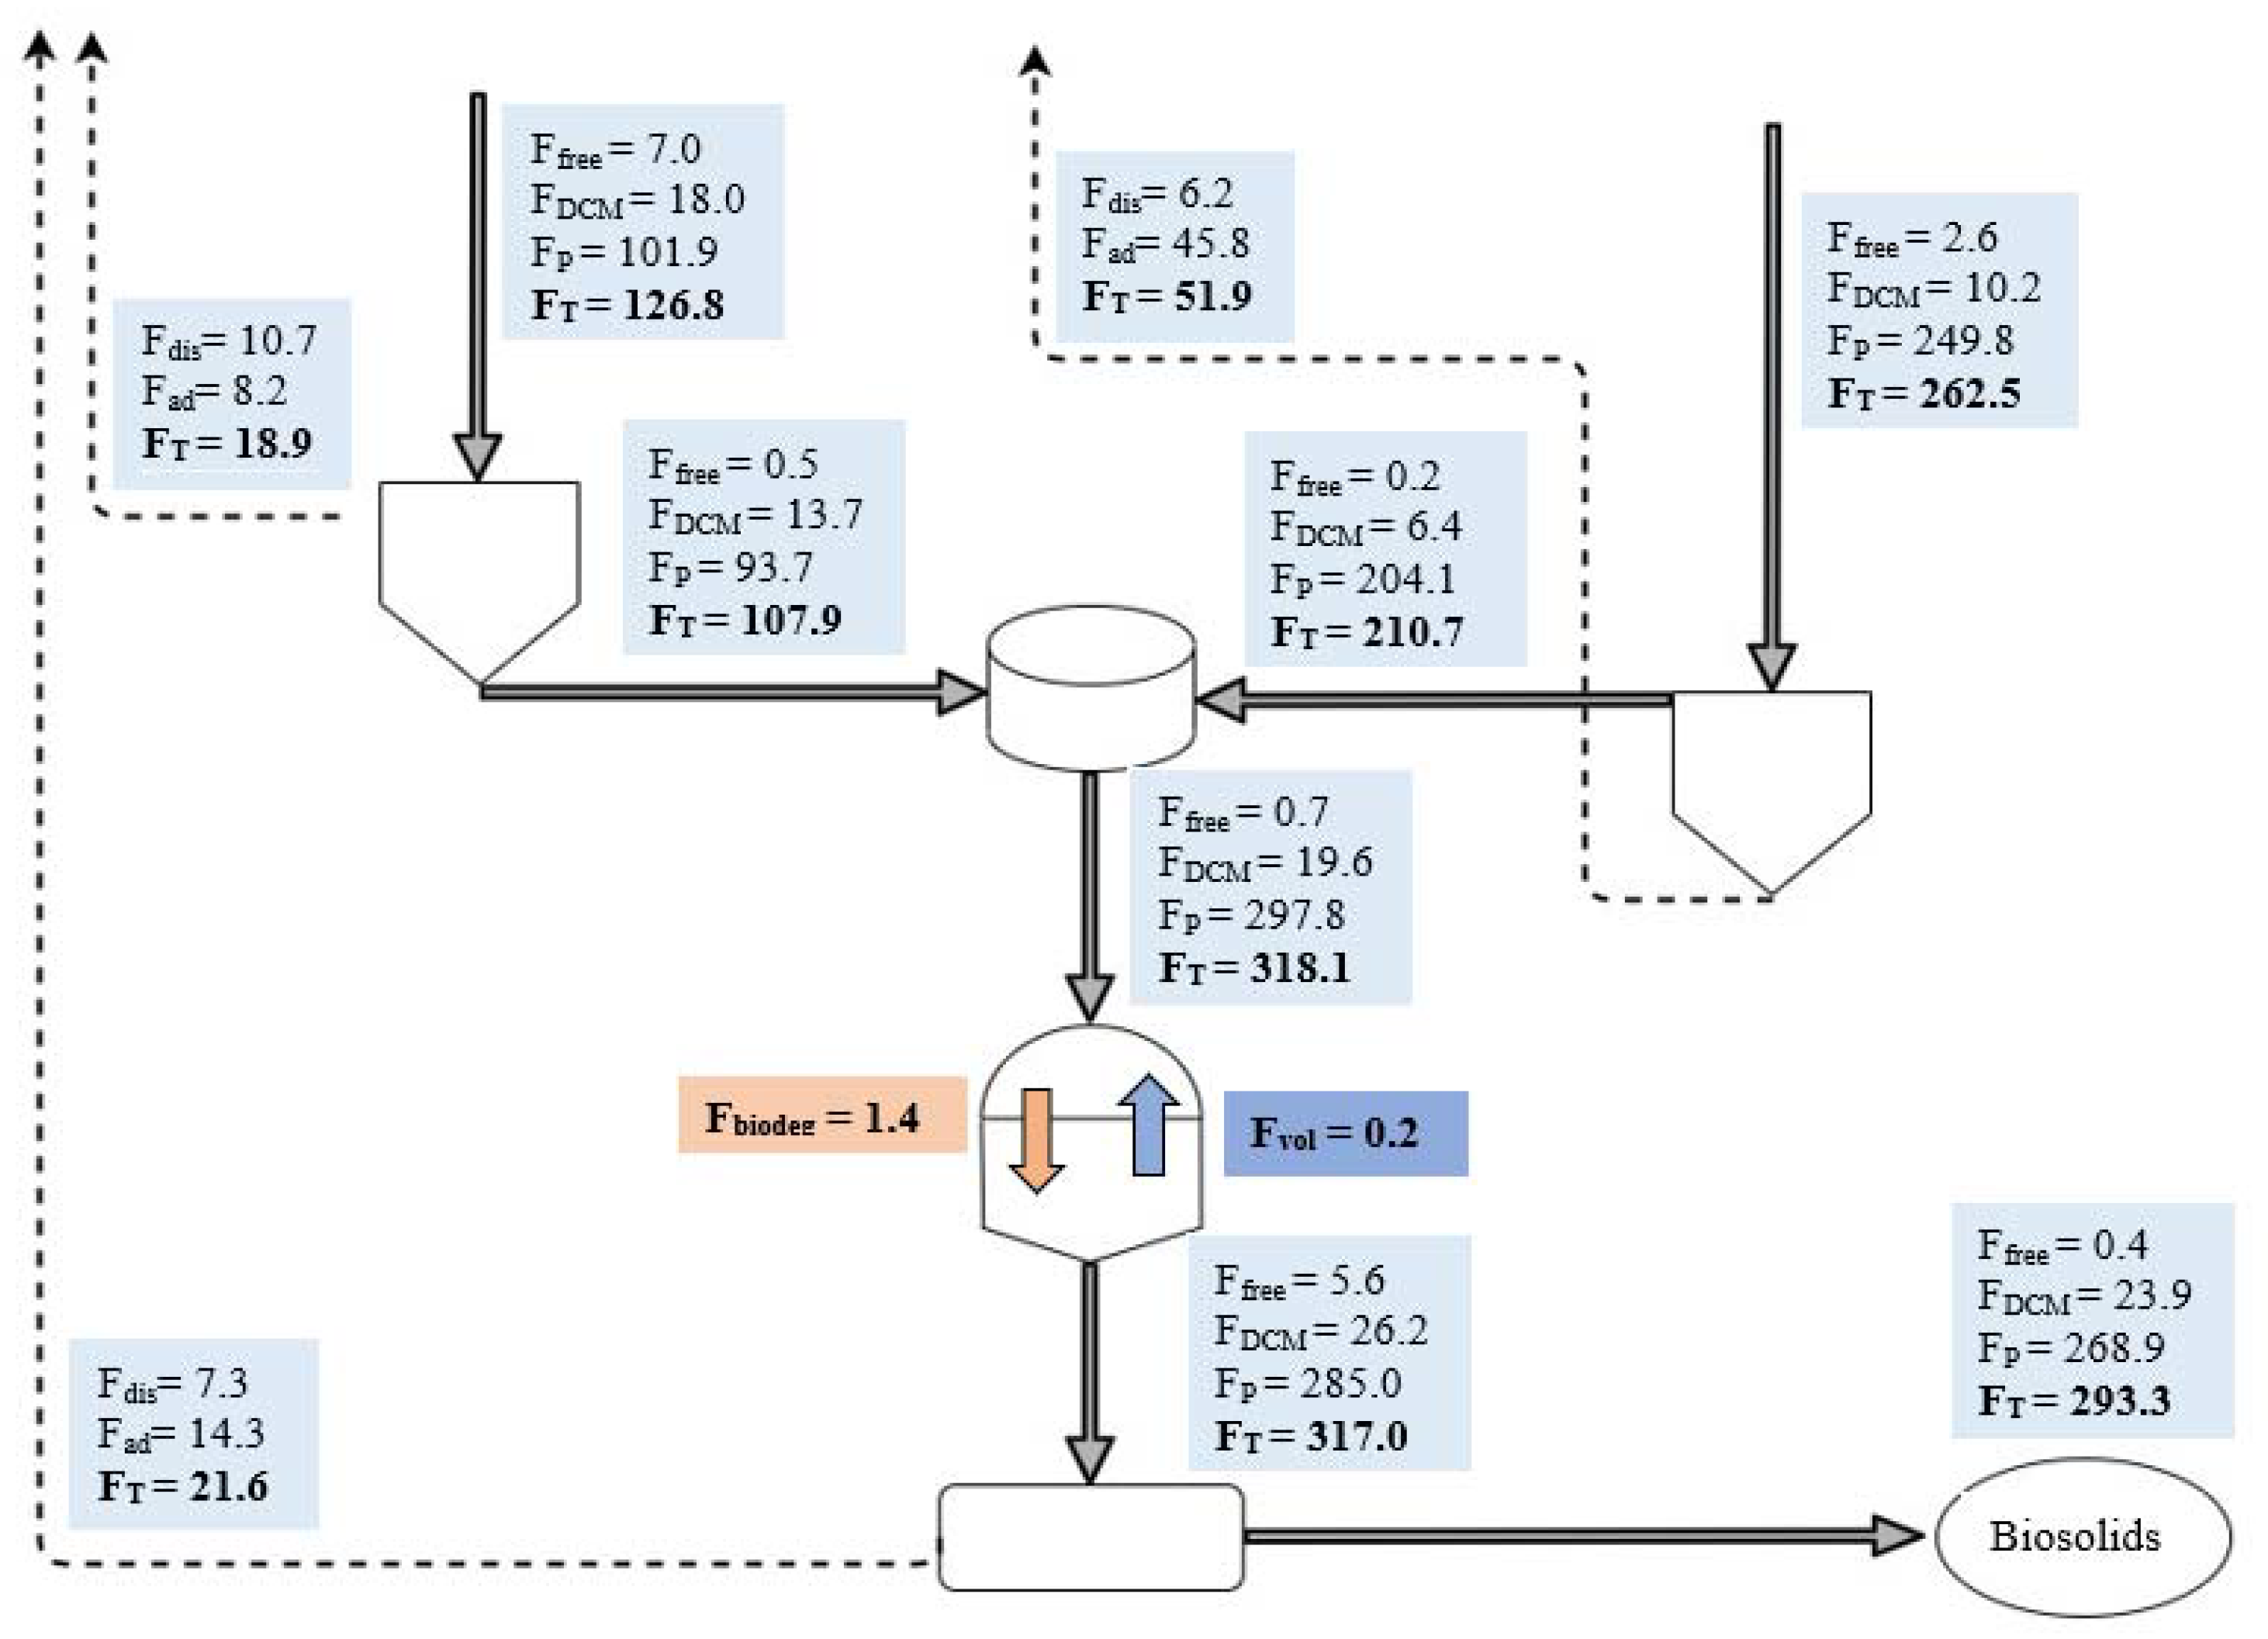
- For the water line (Figure 1), PAHs were assumed to be distributed between the dissolved and sorbed-to-particle phase, and only the dissolved phase was bioavailable [42]. For the sludge line (Figure 1), three phases were considered: freely dissolved, sorbed to DCM, and sorbed to particles. In this case, only the PAHs freely dissolved and sorbed to the DCM were bioavailable [36].
- Throughout all the treatment units, sorption was assumed to occur onto the total suspended solids fraction.
| Treatment Stage | Modeled Processes | Reference | |
|---|---|---|---|
| Water line | Primary treatment: Gravitational sedimentation | Advection, adsorption, surface volatilization, | [35] |
| Secondary treatment: Conventional activated sludge | For PAHs: advection, adsorption, biodegradation as co-metabolism (oxic and anoxic conditions), surface and bubble volatilization For BOD: Activated Sludge Simple Model (ASSM) | [30,35,42,43] | |
| Sludge line | Primary gravitational thickener Secondary thickener (flotation) Mixing chamber | Advection | [37] |
| Anaerobic digestion | Advection, sorption/desorption to particles, sorption/desorption to DCM, volatilization, biodegradation as co-metabolism | [36] | |
| Dewatering with centrifuges | Advection | [37] |
2.4. Sensitivity Analysis
3. Results
3.1. Fate of PAHs in a Chilean WWTP
3.1.1. Distribution in the Water Line
3.1.2. Distribution in the Sludge Line
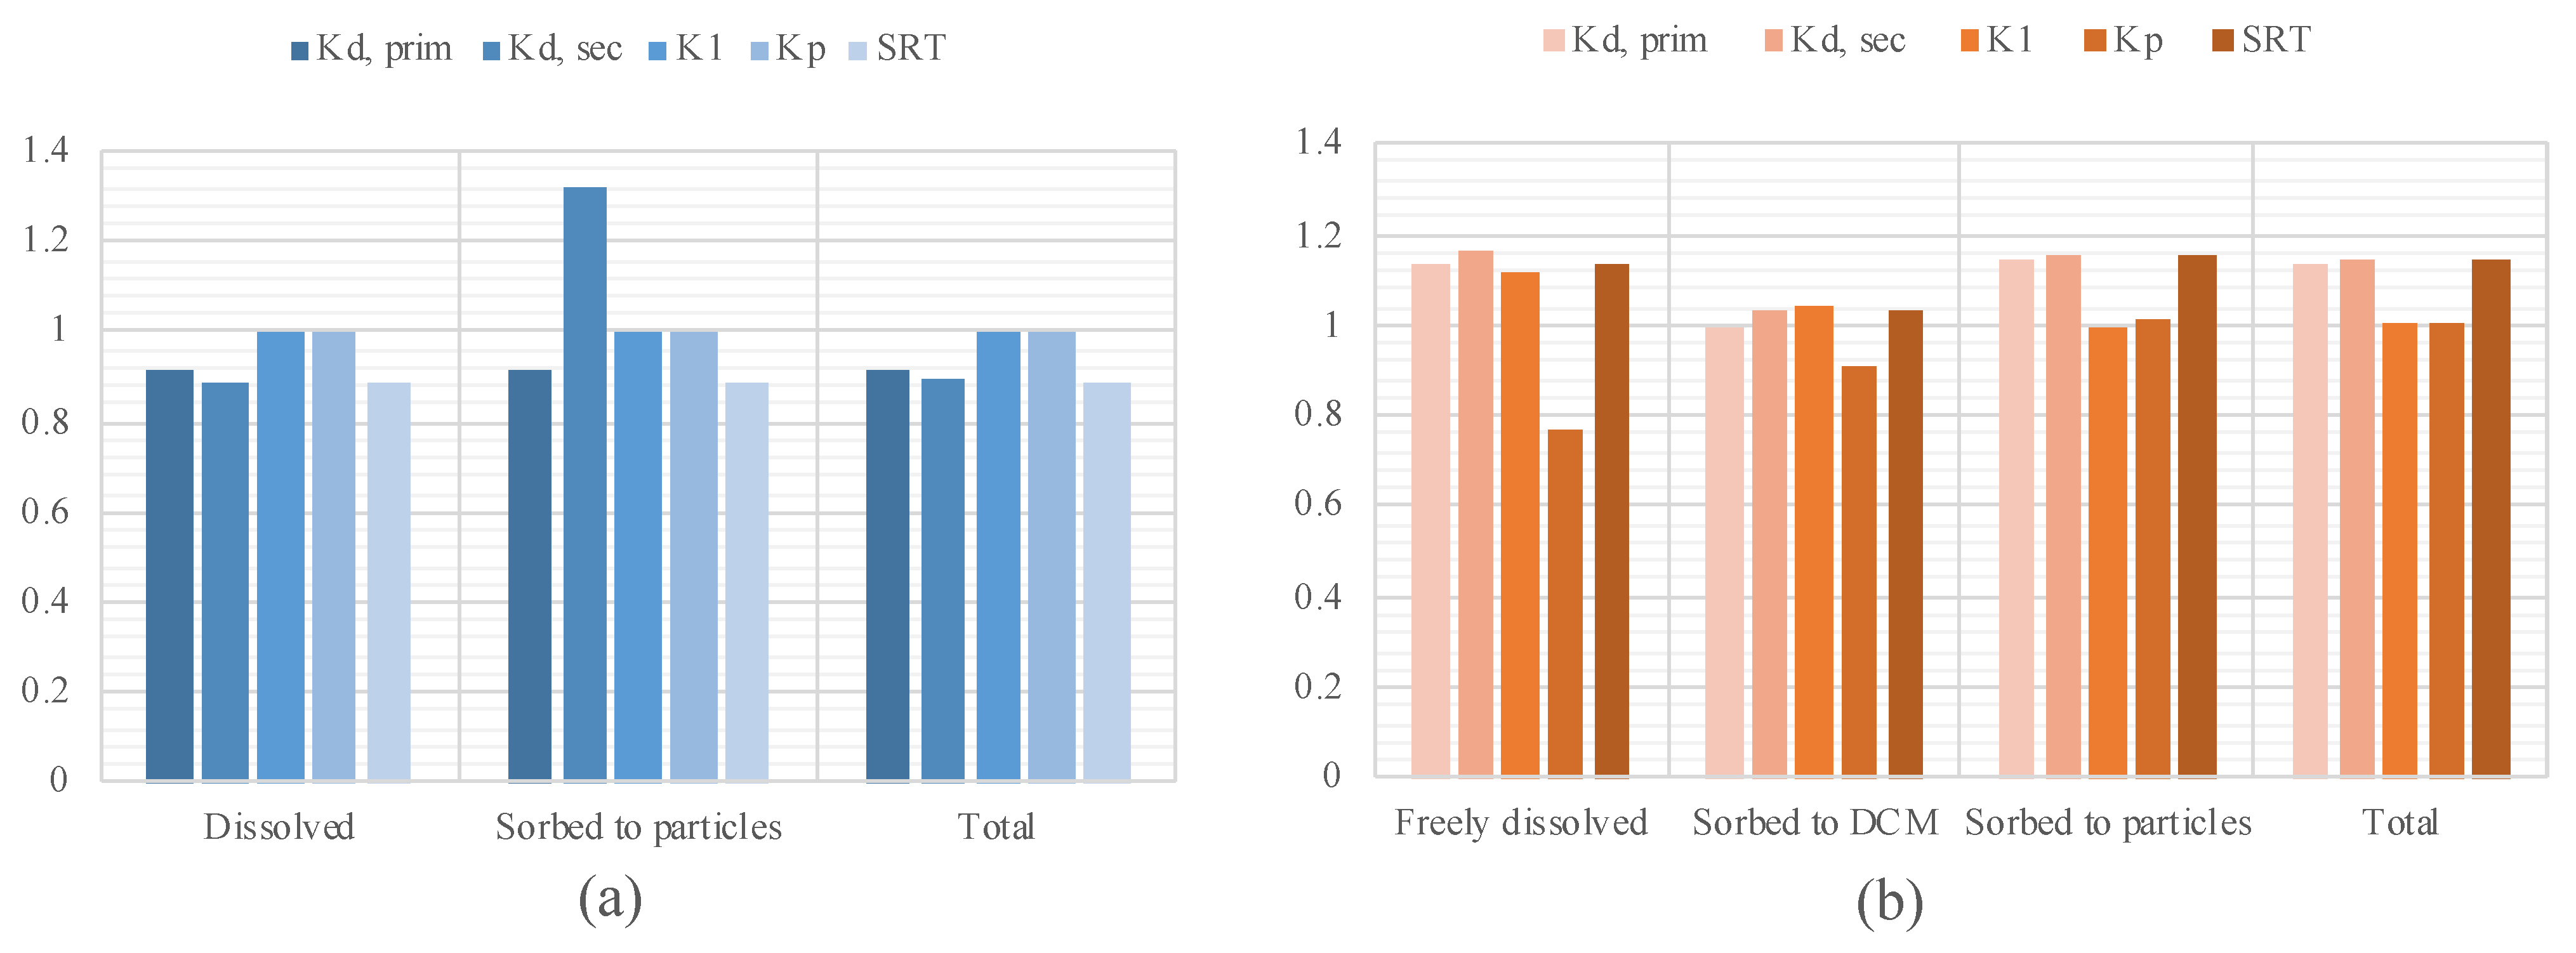
3.2. Sensitivity Analysis
4. Discussion
4.1. Fate of PAHs in a Chilean WWTP
4.2. Impacts on Reuse in Chile
| Location | Sludge Type | Naphthalene [µg/kgDM] | Benzo(a)pyrene [µg/kgDM] | Reference |
|---|---|---|---|---|
| Thessaloniki, Greece | 2ary | 190 | 66 | [10] |
| Mixed (1ary + 2ary) | 900 | 140 | ||
| Thickened | 340 | 140 | ||
| Stabilized | 800 | 240 | ||
| Dehydrated | 1.000 | 240 | ||
| Venice, Italy | 2ary | 31 | 87 | [8] |
| Stabilized | 28 | 86 | ||
| Beijing, China | 2ary | 1.100 | 5.000 | [68] |
| Wuxi, China | 500 | 24 | ||
| Dapu, China | 310 | 7 | ||
| Yuanlang, China | 120 | 480 | ||
| Shatian, China | 240 | 33 | ||
| GBD, China | 2ary | 98 | 395 | [69] |
| BXH, China | 23 | 327 | ||
| Sibao, China | 2ary | 16.320 | 4.540 | [70] |
| Ningbo, China | 140 | 3.700 | ||
| Spain | 2ary | 197 | 34 | [71] |
| Spain | 27 | 522 | ||
| Lombardy, Italy | 1ary | 259 | 56 | [50] |
| 2ary | 277 | 36 | ||
| Thickened | 279 | 44 | ||
| Stabilized | 254 | 62 | ||
| Guadalete, Spain | 1ary | 776 | 115 | [72] |
| 2ary | 707 | 87 | ||
| Stabilized | 539 | 170 | ||
| This study | 1ary | 1.270 | 271 | |
| 2ary | 2.140 | 378 | ||
| Thickened (1ary + 2ary) | 1.646 | 318 | ||
| Stabilized | 2.692 | 503 | ||
| Dehydrated | 2.658 | 498 |
4.3. Limitations
5. Conclusions
Supplementary Materials
Author Contributions
Funding
Acknowledgments
Conflicts of Interest
References
- Manoli, E.; Samara, C. The removal of Polycyclic Aromatic Hydrocarbons in the wastewater treatment process: Experimental calculations and model predictions. Environ. Pollut. 2008, 151, 477–485. [Google Scholar] [CrossRef]
- Haritash, A.; Kaushik, C. Biodegradation aspects of Polycyclic Aromatic Hydrocarbons (PAHs): A review. J. Hazard. Mater. 2009, 169, 1–15. [Google Scholar] [CrossRef]
- Alegbeleye, O.O.; Opeolu, B.O.; Jackson, V.A. Polycyclic Aromatic Hydrocarbons: A Critical Review of Environmental Oc-currence and Bioremediation. Environ. Manag. 2017, 60, 758–783. [Google Scholar] [CrossRef] [PubMed]
- U.S. Environmental Protection Agency. Priority Pollutants. (EPA U.S.). 2011. Available online: http://water.epa.gov/scitech/methods/cwa/pollutants.cfm (accessed on 21 May 2017).
- Directive 2013/39/EU of the European Parliament and of the Council of 12 August 2013 Amending Directives 2000/60/EC and 2008/105/EC as Regards Priority Substances in the Field of Water Policy Text with EEA Relevance. Available online: https://eur-lex.europa.eu/LexUriServ/LexUriServ.do?uri=OJ:L:2013:226:0001:0017:EN:PDF (accessed on 6 June 2020).
- Qiao, M.; Qi, W.; Liu, H.; Qu, J. Occurrence, behavior and removal of typical substituted and parent polycyclic aromatic hydrocarbons in a biological wastewater treatment plant. Water Res. 2014, 52, 11–19. [Google Scholar] [CrossRef]
- Zhang, X.; Yu, T.; Li, X.; Yao, J.; Liu, W.; Chang, S.; Chen, Y. The fate and enhanced removal of polycyclic aromatic hydrocarbons in wastewater and sludge treatment system: A review. Crit. Rev. Environ. Sci. Technol. 2019, 49, 1425–1475. [Google Scholar] [CrossRef]
- Busetti, F.; Heitz, A.; Cuomo, M.; Badoer, S.; Traverso, P. Determination of sixteen polycyclic aromatic hydrocarbons in aqueous and solid samples from an Italian wastewater treatment plant. J. Chromatogr. A 2006, 1102, 104–115. [Google Scholar] [CrossRef] [PubMed] [Green Version]
- Fatone, F.; Di Fabio, S.; Bolzonella, D.; Cecchi, F. Fate of aromatic hydrocarbons in Italian municipal wastewater systems: An overview of wastewater treatment using conventional activated-sludge processes (CASP) and membrane bioreactors (MBRs). Water Res. 2011, 45, 93–104. [Google Scholar] [CrossRef]
- Manoli, E.; Samara, C. Occurrence and Mass Balance of Polycyclic Aromatic Hydrocarbons in the Thessaloniki Sewage Treatment Plant. J. Environ. Qual. 1999, 28, 176–187. [Google Scholar] [CrossRef]
- Pham, T.; Prolux, S. PCBs and PAHs in the Montreal urban community (Quebec, Canada) wastewater treatment plant and in the effluent plume in the St. Lawrence River. Water Res. 1997, 31, 1887–1896. [Google Scholar] [CrossRef]
- Sun, S.; Jia, L.; Li, B.; Yuan, A.; Kong, L.; Qi, H.; Ma, W.; Zhang, A.; Wu, Y. The occurrence and fate of PAHs over multiple years in a wastewater treatment plant of Harbin, Northeast China. Sci. Total Environ. 2018, 624, 491–498. [Google Scholar] [CrossRef]
- Dionisi, D.; Bertin, L.; Bornoroni, L.; Capodicasa, S.; Papini, M.P.; Fava, F. Removal of organic xenobiotics in activated sludges under aerobic conditions and anaerobic digestion of the adsorbed species. J. Chem. Technol. Biotechnol. 2006, 81, 1496–1505. [Google Scholar] [CrossRef]
- Jelic, A.; Katsou, E.; Malamis, S.; Bolzonella, D.; Fatone, F. Occurence, Removal, and Fate of PAHs and VOCs in Municipal Wastewater Treatment Plants: A Literature Review. In Wastewater Treatment: Occurrence and Fate of Polycylic Aromatic Hydro-carbons (PAHs); Forsgren, A., Ed.; CRC Press: Boca Raton, FL, USA, 2015; pp. 91–112. [Google Scholar]
- Mozo, I.; Bounouba, M.; Mengelle, E.; Lesage, N.; Sperandio, M.; Bessiere, Y. Modelling PAHs removal in activated sludge process: Effect of disintegration. Water Sci. Technol. 2019, 80, 794–805. [Google Scholar] [CrossRef] [PubMed]
- Margot, J.; Rossi, L.; Barry, D.; Holliger, C. A review of the fate of micropollutants in wastewater treatment plants. Wiley Interdiscip. Rev. Water 2015, 2, 457–487. [Google Scholar] [CrossRef] [Green Version]
- Liu, Z.; Li, Q.; Wu, Q.; Kuo, D.T.F.; Chen, S.; Hu, X.; Deng, M.; Zhang, H.; Luo, M. Removal Efficiency and Risk Assessment of Polycyclic Aromatic Hydrocarbons in a Typical Municipal Wastewater Treatment Facility in Guangzhou, China. Int. J. Environ. Res. Public Health 2017, 14, 861. [Google Scholar] [CrossRef] [Green Version]
- Clouzot, L.; Choubert, J.-M.; Cloutier, F.; Goel, R.; Love, N.G.; Melcer, H.; Ort, C.; Patureau, D.; Plosz, B.; Pomiès, M.; et al. Perspectives on modelling micropollutants in wastewater treatment plants. Water Sci. Technol. 2013, 68, 448–461. [Google Scholar] [CrossRef] [PubMed] [Green Version]
- Plosz, B.; Benedetti, L.; Daigger, G.T.; Langford, K.H.; Larsen, H.F.; Monteith, H.; Ort, C.; Seth, R.; Steyer, J.-P.; Vanrolleghem, P. Modelling micropollutant fate in wastewater collection and treatment systems: Status and challenges. Water Sci. Technol. 2013, 67, 1–15. [Google Scholar] [CrossRef]
- Komolafe, O.; Mrozik, W.; Dolfing, J.; Acharya, K.; Vassalle, L.; Mota, C.; Davenport, R. Occurrence and removal of micropollu-tants in full-scale aerobic, anaerobic and facultative wastewater treatment plants in Brazil. J. Environ. Manag. 2021, 287, 112286. [Google Scholar] [CrossRef]
- Nas, B.; Argun, M.; Dolu, T.; Ateş, H.; Yel, E.; Koyuncu, S.; Dinç, S.; Kara, M. Occurrence, loadings and removal of EU-priority polycyclic aromatic hydrocarbons (PAHs) in wastewater and sludge by advanced biological treatment, stabilization pond and constructed wetland. J. Environ. Manag. 2020, 268, 110580. [Google Scholar] [CrossRef]
- Wang, X.; Xi, B.; Huo, S.; Sun, W.; Pan, H.; Zhang, J.; Ren, Y.; Liu, H. Characterization, treatment and releases of PBDEs and PAHs in a typical municipal sewage treatment plant situated beside an urban river, East China. J. Environ. Sci. 2013, 25, 1281–1290. [Google Scholar] [CrossRef]
- Tian, W.; Bai, J.; Liu, K.; Sun, H.; Zhao, Y. Occurrence and removal of polycyclic aromatic hydrocarbons in the wastewater treatment process. Ecotoxicol. Environ. Saf. 2012, 82, 1–7. [Google Scholar] [CrossRef]
- Vogelsang, C.; Grung, M.; Jantsch, T.G.; Tollefsen, K.E.; Liltved, H. Occurrence and removal of selected organic micropollu-tants at mechanical, chemical and advanced wastewater treatment plants in Norway. Water Res. 2006, 40, 3559–3570. [Google Scholar] [CrossRef]
- Taboada-Santos, A.; Behera, C.R.; Sin, G.; Gernaey, K.V.; Mauricio-Iglesias, M.; Carballa, M.; Lema, J.M. Assessment of the fate of organic micropollutants in novel wastewater treatment plant configurations through an empirical mechanistic model. Sci. Total Environ. 2020, 716, 137079. [Google Scholar] [CrossRef]
- Lejeune, A.; Choubert, J.-M. Modeling of micropollutant removal in full-scale membrane bioreactors: Calibration and operations to limit the emissions. Bioprocess Biosyst. Eng. 2019, 42, 1879–1892. [Google Scholar] [CrossRef] [PubMed]
- Gonzalez-Gil, L.; Mauricio-Iglesias, M.; Carballa, M.; Lema, J.M. Why are organic micropollutants not fully biotransformed? A mechanistic modelling approach to anaerobic systems. Water Res. 2018, 142, 115–128. [Google Scholar] [CrossRef]
- Baalbaki, Z.; Torfs, E.; Yargeau, V.; Vanrolleghem, P.A. Predicting the fate of micropollutants during wastewater treatment: Calibration and sensitivity analysis. Sci. Total Environ. 2017, 601, 874–885. [Google Scholar] [CrossRef] [PubMed]
- Polesel, F.; Andersen, H.R.; Trapp, S.; Plosz, B. Removal of Antibiotics in Biological Wastewater Treatment Systems—A Critical Assessment Using the Activated Sludge Modeling Framework for Xenobiotics (ASM-X). Environ. Sci. Technol. 2016, 50, 10316–10334. [Google Scholar] [CrossRef] [PubMed] [Green Version]
- Plósz, B.G.; Langford, K.H.; Thomas, K.V. An activated sludge modeling framework for xenobiotic trace chemicals (ASM-X): Assessment of diclofenac and carbamazepine. Biotechnol. Bioeng. 2012, 109, 2757–2769. [Google Scholar] [CrossRef] [PubMed]
- Vezzaro, L.; Benedetti, L.; Gevaert, V.; De Keyser, W.; Verdonck, F.; De Baets, B.; Nopens, I.; Cloutier, F.; Vanrolleghem, P.; Mikkelsen, P.S. A model library for dynamic transport and fate of micropollutants in integrated urban wastewater and stormwater systems. Environ. Model. Softw. 2014, 53, 98–111. [Google Scholar] [CrossRef]
- Fernandez-Fontaina, E.; Carballa, M.; Omil, F.; Lema, J. Modelling cometabolic biotransformation of organic micropollutants in nitrifying reactors. Water Res. 2014, 65, 371–383. [Google Scholar] [CrossRef]
- Lust, M.; Makinia, J.; Stensel, H.D. A mechanistic model for fate and removal of estrogens in biological nutrient removal activated sludge systems. Water Sci. Technol. 2012, 65, 1130–1136. [Google Scholar] [CrossRef]
- Dionisi, D.; Bornoroni, L.; Mainelli, S.; Majone, M.; Pagnanelli, F.; Papini, M.P. Theoretical and Experimental Analysis of the Role of Sludge Age on the Removal of Adsorbed Micropollutants in Activated Sludge Processes. Ind. Eng. Chem. Res. 2008, 47, 6775–6782. [Google Scholar] [CrossRef]
- Lee, K.-C.; Rittmann, B.E.; Shi, J.; McAvoy, D. Advanced steady-state model for the fate of hydrophobic and volatile com-pounds in activated sludge. Water Environ. Res. 1998, 70, 1118–1131. [Google Scholar] [CrossRef]
- Delgadillo-Mirquez, L.; Lardon, L.; Steyer, J.-P.; Patureau, D. A new dynamic model for bioavailability and cometabolism of micropollutants during anaerobic digestion. Water Res. 2011, 45, 4511–4521. [Google Scholar] [CrossRef]
- Barret, M.; Patureau, D.; Latrille, E.; Carrère, H. A three-compartment model for micropollutants sorption in sludge: Methodological approach and insights. Water Res. 2010, 44, 616–624. [Google Scholar] [CrossRef]
- Suez Degremont Water Handbook. Available online: https://www.suezwaterhandbook.com/case-studies/wastewater-treatment/La-Farfana-wastewater-treatment-plant-Chile (accessed on 25 May 2021).
- Superintendencia de Servicios Sanitarios (SISS). Estudio Grandes Plantas de Tratamiento de Aguas Servidas Aguas Andinas Proceso Tarifario 2015–2020. 2014. Available online: https://infota.siss.cl/concesiones/index.php?dir=empresas%2FAguasAndinas%2F09+Estudio+Tarifario+Intercambio+SISS%2F (accessed on 24 May 2020).
- Langford, K.H.; Lester, J.N. Fate and Behavior of Endocrine Disrupters in Wastewater Treatment Processes. In Endocrine Disrupters in Wastewater and Sludge Treatment Processes, 1st ed.; Birkett, J.W., Lester, J.N., Eds.; Lewis Publishers: London, UK, 2003; Volume 1, pp. 103–144. [Google Scholar]
- Meakins, N.; Bubb, J.; Lester, J. The fate and behaviour of organic micropollutants during wastewater treatment processes: A review. Int. J. Environ. Pollut. 1994, 4, 27–58. [Google Scholar]
- Plosz, B.; Leknes, H.; Thomas, K.V. Impacts of Competitive Inhibition, Parent Compound Formation and Partitioning Behavior on the Removal of Antibiotics in Municipal Wastewater Treatment. Environ. Sci. Technol. 2009, 44, 734–742. [Google Scholar] [CrossRef] [PubMed]
- Nanning, J.; Mena, M.P.; Rojas, N. ASSM (Activated Sludge Simple Model). In Proceedings of the XXXI Congreso Interamericano AIDIS, Santiago, Chile, 12–15 October 2015. [Google Scholar]
- Byrns, G. The fate of xenobiotic organic compounds in wastewater treatment plants. Water Res. 2001, 35, 2523–2533. [Google Scholar] [CrossRef]
- Bautista, L.F.; Sanz, R.; Molina, M.C.; González, N.; Sánchez, D. Effect of different non-ionic surfactants on the biodegradation of PAHs by diverse aerobic bacteria. Int. Biodeterior. Biodegrad. 2009, 63, 913–922. [Google Scholar] [CrossRef]
- Sponza, D.T.; Gok, O. Aerobic biodegradation and inhibition kinetics of poly-aromatic hydrocarbons (PAHs) in a petrochemical industry wastewater in the presence of biosurfactants. J. Chem. Technol. Biotechnol. 2012, 87, 658–672. [Google Scholar] [CrossRef]
- Semblante, G.U.; Hai, F.I.; Huang, X.; Ball, A.; Price, W.E.; Nghiem, L. Trace organic contaminants in biosolids: Impact of conventional wastewater and sludge processing technologies and emerging alternatives. J. Hazard. Mater. 2015, 300, 1–17. [Google Scholar] [CrossRef] [PubMed] [Green Version]
- Geyik, A.G.; Kılıç, B.; Çeçen, F. Extracellular polymeric substances (EPS) and surface properties of activated sludges: Effect of organic carbon sources. Environ. Sci. Pollut. Res. 2015, 23, 1653–1663. [Google Scholar] [CrossRef] [PubMed]
- Torretta, V.; Katsoyiannis, A. Occurrence of polycyclic aromatic hydrocarbons in sludges from different stages of a wastewater treatment plant in Italy. Environ. Technol. 2013, 34, 937–943. [Google Scholar] [CrossRef] [PubMed]
- Wlodarczyk-Makula, M. The loads of PAHS in wastewater and sewage sludge of municipal treatment plant. Polycycl. Aromat. Compd. 2005, 25, 183–194. [Google Scholar] [CrossRef]
- Trably, E.; Patureau, D.; Delgenes, J. Enhancement of polycyclic aromatic hydrocarbons removal during anaerobic treatment of urban sludge. Water Sci. Technol. 2003, 48, 53–60. [Google Scholar] [CrossRef] [PubMed]
- Biblioteca del Congreso. Available online: https://www.bcn.cl/leychile/ (accessed on 30 May 2021).
- WHO (2017) World Health Organization. Guidance for Producing Safe Drinking-Water. Available online: http://apps.who.int/iris/bitstream/handle/10665/258715/9789241512770-eng.pdf?sequence=1&isAllowed=y (accessed on 17 July 2020).
- Consolidated Text: Directive 2008/105/EC of the European Parliament and of the Council of 16 December 2008 on Environmental Quality Standards in the Field of Water Policy, Amending and Subsequently Repealing Council Directives 82/176/EEC, 83/513/EEC, 84/156/EEC, 84/491/EEC, 86/280/EEC and Amending Directive 2000/60/EC of the European Parliament and of the Council. Available online: https://eur-lex.europa.eu/eli/dir/2008/105/oj (accessed on 17 July 2020).
- US-EPA. Safe Drinking Water Act. 2020. Available online: https://www.epa.gov/sdwa (accessed on 30 May 2021).
- Ministerio de Salud de Brasil. Ordenanza nº 518: Establece los Procedimientos y Responsabilidades Relativos al Control y la Vigilancia de la Calidad del Agua Para Consumo Humano y su Norma de Potabilidad, y Establece Otras Disposiciones. 2004. Available online: http://189.28.128.100/dab/docs/legislacao/portaria518_25_03_04.pdf (accessed on 18 August 2020).
- Subsecretaria de Recursos Hídricos de Argentina. Niveles Guía Nacionales de Calidad de Agua Ambiente: Ben-zo[a]pireno. 2003. Available online: https://www.argentina.gob.ar/sites/default/files/documento22.pdf (accessed on 18 August 2020).
- Khan, S.; Aijun, L.; Zhang, S.; Hu, Q.; Zhu, Y.-G. Accumulation of polycyclic aromatic hydrocarbons and heavy metals in lettuce grown in the soils contaminated with long-term wastewater irrigation. J. Hazard. Mater. 2008, 152, 506–515. [Google Scholar] [CrossRef] [PubMed]
- Samia, K.; Abdelkarim, C.; Yassin, H.; Teruo, H. The effect of long-term soil irrigation by wastewater on organic matter, polycyclic aromatic hydrocarbons, and heavy metals evolution: Case study of Zaouit Sousse (Tunisia). Arab. J. Geosci. 2012, 6, 4337–4346. [Google Scholar] [CrossRef]
- Forsgren, A.J. PAHs in Sewage Sludge, Soils and Sediments. In Wastewater Treatment: Occurrence and Fate of Polycylic Aromatic Hydrocarbons (PAHs); Forsgren, A., Ed.; CRC Press: Boca Raton, FL, USA, 2015; pp. 212–229. [Google Scholar]
- Collivignarelli, M.; Abbà, A.; Frattarola, A.; Miino, M.C.; Padovani, S.; Katsoyiannis, I.; Torretta, V. Legislation for the Reuse of Biosolids on Agricultural Land in Europe: Overview. Sustainability 2019, 11, 6015. [Google Scholar] [CrossRef] [Green Version]
- Bravo-Linares, C.; Ovando-Fuentealba, L.; Mudge, S.M.; Cerpa, J.; Loyola-Sepulveda, R. Source Allocation of Aliphatic and Polycyclic Aromatic Hydrocarbons in Particulate-Phase (PM10) in the City of Valdivia, Chile. Polycycl. Aromat. Compd. 2012, 32, 390–407. [Google Scholar] [CrossRef]
- Sienra, M.D.R.; Rosazza, N.G.; Préndez, M. Polycyclic aromatic hydrocarbons and their molecular diagnostic ratios in urban atmospheric respirable particulate matter. Atmos. Res. 2005, 75, 267–281. [Google Scholar] [CrossRef]
- Muñoz, C.; Droppelmann, A.; Erazo, M.; Aceituno, P.; Orellana, C.; Parro, J.; Mesias, S.; Marchetti, N.; Navas-Acien, A.; Iglesias, V. Occupational exposure to polycyclic aromatic hydrocarbons: A cross-sectional study in bars and restaurants in Santiago, Chile. Am. J. Ind. Med. 2016, 59, 887–896. [Google Scholar] [CrossRef] [Green Version]
- Pozo, K.; Estellano, V.H.; Harner, T.; Diaz-Robles, L.; Cereceda-Balic, F.; Etcharren, P.; Pozo, K.; Vidal, V.; Guerrero, F.; Vergara-Fernández, A. Assessing Polycyclic Aromatic Hydrocarbons (PAHs) using passive air sampling in the atmosphere of one of the most wood-smoke-polluted cities in Chile: The case study of Temuco. Chemosphere 2015, 134, 475–481. [Google Scholar] [CrossRef]
- Pozo, K.; Harner, T.; Rudolph, A.; Oyola, G.; Estellano, V.H.; Ahumada-Rudolph, R.; Garrido, M.; Pozo, K.; Mabilia, R.; Focardi, S. Survey of persistent organic pollutants (POPs) and polycyclic aromatic hydrocarbons (PAHs) in the atmosphere of rural, urban and industrial areas of Concepción, Chile, using passive air samplers. Atmos. Pollut. Res. 2012, 3, 426–434. [Google Scholar] [CrossRef] [Green Version]
- Bravo-Linares, C.; Ovando-Fuentealba, L.; Orellana-Donoso, S.; Villenas-Fernández, K.; Hernández-Millán, M.; Mudge, S.; Pinaud-Mendoza, J.P.; Loyola-Sepulveda, R. Source Apportionment of PAHs in Airborne Particulates (PM2.5) in Southern Chile. Polycycl. Aromat. Compd. 2016, 37, 189–202. [Google Scholar] [CrossRef]
- Cai, Q.-Y.; Mo, C.-H.; Wu, Q.-T.; Zeng, Q.-Y.; Katsoyiannis, A. Occurrence of organic contaminants in sewage sludges from eleven wastewater treatment plants, China. Chemosphere 2007, 68, 1751–1762. [Google Scholar] [CrossRef]
- Dai, J.; Xu, M.; Chen, J.; Yang, X.; Ke, Z. PCDD/F, PAH and heavy metals in the sewage sludge from six wastewater treatment plants in Beijing, China. Chemosphere 2007, 66, 353–361. [Google Scholar] [CrossRef]
- Hua, L.; Wu, W.-X.; Liu, Y.-X.; Tientchen, C.; Chen, Y.-X. Heavy Metals and PAHs in Sewage Sludge from Twelve Wastewater Treatment Plants in Zhejiang Province. Biomed. Environ. Sci. 2008, 21, 345–352. [Google Scholar] [CrossRef]
- Perez, S.; Guillamón, M.; Barceló, D. Quantitative analysis of polycyclic aromatic hydrocarbons in sewage sludge from wastewater treatment plants. J. Chomatography A 2001, 938, 57–65. [Google Scholar] [CrossRef]
- Villar, P.; Villar, M.; Callejón, M.; Pérez, J.; Jiménez, J.; Alonso, E.; Guiraúm, A. Evolution of polycyclic aromatic hydrocar-bons (PAHs) and heavy metals in sludge samples from conventional activated sludge wastewater treatment plants. Environmetrics 2009, 20, 561–574. [Google Scholar] [CrossRef]


| Flow | 10% | 50% | 95% | ||||||
|---|---|---|---|---|---|---|---|---|---|
| Ffree | FDCM | FP | Ffree | FDCM | FP | Ffree | FDCM | FP | |
| 1 | 170.7–221; 191.4 | --- | 397.9–454; 426.4 | --- | 454–795.4; 760.1 | --- | |||
| 2 | 123.8–160.3; 138.9 | 14.7–19.1; 16.5 | 288.7–329.4; 309.4 | 34.3–39.2; 36.8 | 329.4–577.1; 551.5 | 39.2–68.6; 8.2 | |||
| 3 | 51.5–66.6; 57.7 | 2.2–2.9; 2.5 | 119.9–136.8; 128.5 | 5.1–5.9; 5.5 | 136.8–239.8; 229.1 | 5.9–10.3; 9.8 | |||
| 4 | 1.6–2.0; 1.7 | 4–5.2; 4.5 | 22.9–29.6; 25.6 | 3.7–4.2; 3.9 | 9.4–10.7; 10.1 | 53.3–60.8; 57.1 | 6.6–7.3; 7 | 16.9–18.8; 17.9 | 95.8–106.5; 101.8 |
| 5 | 0.1–0.1; 0.1 | 3.1–4.0; 3.5 | 21–27.2; 23.6 | 0.3–0.3; 0.3 | 7.2–8.2; 7.7 | 49–55.9; 52.5 | 0.5–0.5; 0.5 | 12.9–14.4; 13.7 | 88.1–97.9; 93.6 |
| 6 | 2.4–3.1; 2.7 | 1.8–2.4; 2 | 5.6–6.4; 6 | 4.3–4.9; 4.6 | 10.1–11.2; 10.7 | 7.7–8.6; 8.2 | |||
| 7 | 0.6–0.8; 0.7 | 2.3–3.0; 2.6 | 56.1–72.6; 62.9 | 1.4–1.5; 1.5 | 5.3–6.1; 5.7 | 130.7–149.2; 140.1 | 2.4–2.7; 2.6 | 9.6–10.7; 10.2 | 235–261.4; 249.8 |
| 8 | --- | 1.4–1.9; 1.6 | 45.8–59.3; 51.4 | --- | 3.4–3.8; 3.6 | 106.8–121.9 114.4 | --- | 6.1–6.7; 6.4 | 192–213.5; 204 |
| 9 | 1.4–1.8; 1.6 | 10.3–13.3; 11.5 | 3.2–3.7; 3.5 | 23.9–27.3; 25.7 | 5.8–6.5; 6.2 | 43.1–47.9; 45.8 | |||
| 10 | 0.2–0.2; 0.2 | 4.4–5.6; 4.9 | 66.3–85.8; 74.9 | 0.4–0.4; 0.4 | 10.1–11.6; 10.9 | 154.4–176.2; 165.6 | 0.7–0.7; 0.7 | 18.2–20.3; 19.4 | 277.6–308.7; 295 |
| 11 | 1.2–1.6; 1.4 | 5.8–7.5; 6.5 | 63.4–82.1; 71.1 | 2.9–3.3; 3.1 | 13.6–15.5; 14.5 | 147.7–168.6; 158.3 | 5.2–5.8; 5.5 | 24.4–27.1; 25.9 | 265.6–295.3; 282.2 |
| 12 | 0.1–0.1; 0.1 | 5.3–6.9; 5.9 | 59.8–77.4; 67 | 0.2–0.3; 0.2 | 12.4–14.1; 13.3 | 139.4–159.1; 149.4 | 0.4–0.5; 0.4 | 22.2–24.7; 23.6 | 250.6–278.7; 266.3 |
| 13 | 1.6–2.1; 1.8 | 3.2–4.1; 3.6 | 3.8–4.3; 4.1 | 7.4–8.4; 7.9 | 6.8–7.6; 7.2 | 13.3–14.8; 14.1 | |||
| Flow | 10% | 50% | 95% | ||||||
|---|---|---|---|---|---|---|---|---|---|
| Ffree | FDCM | FP | Ffree | FDCM | FP | Ffree | FDCM | FP | |
| 1 | 4.4–10.2; 6.2 | --- | 24.9–33.9; 28.4 | --- | 82.9–86.2; 84.4 | --- | |||
| 2 | 0.4–0.9; 0.5 | 0–4; 2.5 | 2.1–2.9; 2.4 | 9.9–13.4; 11.2 | 7.1–7.4; 7.2 | 32.8–34.1; 33.4 | |||
| 3 | 1.7–0.2; 0.1 | --- | 0.5–0.7; 0.6 | 0.1–0.1; 0.1 | 1.7–1.8; 1.8 | 0.3–0.3; 0.3 | |||
| 4 | --- | 2.7–6.3; 3.8 | --- | 15.3–20.8; 17.4 | --- | 50.9–53; 51.9 | --- | --- | 2.7–6.3; 4.2 |
| 5 | --- | 2.5–5.8; 3.5 | --- | 14.1–19.2; 16.1 | 0–0.1; 0.1 | 46.9–48.7; 47.7 | --- | --- | 2.5–5.8; 3.5 |
| 6 | --- | 0.2–0.5; 0.3 | 0–0.1; 0.1 | 1.2–1.7; 1.4 | 0.1–0.1; 0 | 4.1–4.3; 4.2 | |||
| 7 | --- | 2.4–5.6; 3.4 | --- | 13.8–18.9; 12.8 | --- | 45.9–47.7; 46.7 | --- | --- | 2.4–5.6; 3.4 |
| 8 | --- | 2–4.6; 2.8 | --- | 11.3–15.3; 12.8 | --- | 37.5–39; 38.1 | --- | --- | 2–4.6; 2.8 |
| 9 | --- | 0.4–1; 0.6 | 0–0.1; 0.1 | 2.5–3.4; 2.9 | --- | 8.4–8.7; 8.6 | |||
| 10 | --- | 4.4–10.3; 6.2 | --- | 25–34.1; 28.6 | --- | 83.4–86.7; 85.9 | --- | --- | 4.4–10.3; 6.2 |
| 11 | --- | 4.1–9.5; 5.8 | 0.1–0.1; 0 | 23.2–31.6; 26.4 | 0.3–0.3; 0.3 | 77.2–80.3; 79.6 | --- | 0.3–0.8; 0.5 | 4.1–9.5; 5.8 |
| 12 | --- | 3.9–9; 5.5 | --- | 21.9–29.8; 25 | --- | 72.9–75.8; 75.1 | --- | 0.3–0.7; 0.4 | 3.9–9; 5.5 |
| 13 | 0–0.1; 0 | 0.2–0.5; 0.3 | 0.3–0.3; 0.3 | 1.2–1.6; 1.3 | 0.8–0.8; 0.8 | 3.9–4; 4 | |||
Publisher’s Note: MDPI stays neutral with regard to jurisdictional claims in published maps and institutional affiliations. |
© 2021 by the authors. Licensee MDPI, Basel, Switzerland. This article is an open access article distributed under the terms and conditions of the Creative Commons Attribution (CC BY) license (https://creativecommons.org/licenses/by/4.0/).
Share and Cite
Arroyo, A.; Provoste, F.; Rodríguez, M.; Prieto, A.L. A Mechanistic Model to Assess the Fate of Naphthalene and Benzo(a)pyrene in a Chilean WWTP. Processes 2021, 9, 1313. https://doi.org/10.3390/pr9081313
Arroyo A, Provoste F, Rodríguez M, Prieto AL. A Mechanistic Model to Assess the Fate of Naphthalene and Benzo(a)pyrene in a Chilean WWTP. Processes. 2021; 9(8):1313. https://doi.org/10.3390/pr9081313
Chicago/Turabian StyleArroyo, Antonia, Fabián Provoste, Montserrat Rodríguez, and Ana L. Prieto. 2021. "A Mechanistic Model to Assess the Fate of Naphthalene and Benzo(a)pyrene in a Chilean WWTP" Processes 9, no. 8: 1313. https://doi.org/10.3390/pr9081313
APA StyleArroyo, A., Provoste, F., Rodríguez, M., & Prieto, A. L. (2021). A Mechanistic Model to Assess the Fate of Naphthalene and Benzo(a)pyrene in a Chilean WWTP. Processes, 9(8), 1313. https://doi.org/10.3390/pr9081313