1. Introduction
Ultrasonic motors have the advantages of large torque and power density, compact structure, high positioning accuracy, and fast response speed. They have a broad application prospect in the fields of robots [
1], medical instruments [
2,
3,
4], micro-actuators [
5,
6,
7,
8], and precision driving platforms [
9,
10]. Preload is one of the key factors affecting motor performance. At present, research on ultrasonic motor preload is mostly focused on its design stage. The designers usually set the preload to a fixed value according to the structural parameters of the motor. The adaptability to different applications and working conditions is poor. Therefore, an optimization method for the preload of ultrasonic motors urgently needs to be determined.
Mashimo [
11] designed a miniature preloading device using a miniature spiral spring and pointed out that the preloading device was the key to output performance. He made a comparison between the axial and radial preloading methods and found that the radial preloading could bring higher speed, torque, and efficiency. Tanoue [
12] carried out selective excitation for the vibration modes of different orders of linear motor, eliminating the need for preloading mechanisms with different performances. Jian [
13] explored the stiffness and speed characteristics of the preloading mechanism under the change of preloading. The results showed that the stiffness of the preloading mechanism was also a factor affecting the output performance of the motor. Since loading the preload will occupy a relatively large part of the motor space, Kazumi [
14] inserted the preload loading device into the slider of the linear ultrasonic motor to achieve the miniaturization of the motor. All of the above studies have analyzed the effect of the preloading device on the performance of the motor but have neglected the selectivity of the preload for the application of the motor. The need to simulate the corresponding preload for actual application of the motor is most urgent.
From the perspective of regulation, Ren [
15] used the finite element software ADINA to select an appropriate preload for the hollow traveling-wave ultrasonic motor, thus improving the speed, torque, and efficiency of the motor. The finite element analysis offers a very accurate result for output performance simulations, but the complex model may limit the motor’s dynamic ability. In order to track and control the optimal efficiency of the TRUM (Traveling-wave Rotary Ultrasonic Motor), Mustafa [
16] used the preload dynamic loading mechanism to achieve efficient and stable tracking. Another of Mustafa’s papers [
17] analyzed the influence of preload on the driving characteristics and showed that the preload would affect the driving efficiency, resonant frequency, and output power range. Based on the frequency control of the ultrasonic motor, he used the dynamic preloading mechanism as the auxiliary controller, which improved the driving efficiency and expanded the range of output power. These two designs have a better dynamic responsibility, but the additional linear actuator makes the whole system quite complicated. Wang [
18] analyzed the influence of preload on mechanical characteristics by establishing a dynamic model of ultrasonic motor and proposed that the appropriate preload should be selected according to the load condition during motor assembly to improve output efficiency. Although the law of preload and load torque was obtained, the performance of the motor was not constrained to the load condition. The above studies illustrate the importance of the prestressing for the TRUM. Chen [
19] tested the mechanical characteristics and rotational speed stability and concluded that a good preload range was 260 N to 320 N. This literature only provides a domain for optimization, which still forces the designer to select a certain preload value depending on his or her experiences. From the analysis of the above studies, it can be seen that the preload optimization method should concern both the structure simplification and the uniqueness of the solution from four dynamic outputs.
As for the optimizing methods, the analytic hierarchy process is used to measure the weight coefficient of different performances of the evaluation function of ultrasonic motors. The Analytic Hierarchy Process has been widely used in multi-attribute decisions. Solangi [
20] used AHP to analyze Pakistan’s renewable-energy-planning decisions, providing important insights into the prioritization of renewable energy power generation resources. Lee [
21] used a fuzzy analytic hierarchy process to evaluate and select suppliers in the oil and gas industry. In order to select the best supplier, Uslu [
22] used AHP to determine the importance of the standard when studying the multi-standard decision of IoT enterprises. All these articles proved the advantages of the analytic hierarchy process in dealing with multi-attribute decision-making problems. However, traditional AHP layouts are not suited for ultrasonic motors; thus, we have to simplify the layer structure for higher response speed.
Aiming at a unique solution value, a preload optimization method for ultrasonic motors is proposed in this paper. A novel mapping model between preload and motor core performance indexes is established. Based on the theory of linear regression and a simplified analytic hierarchy process, the comprehensive performance of the motor is optimized, and the optimal preload is finally calculated. Lastly, simulation and test results are compared with other methods for validation.
The rest of this paper is as follows:
Section 2 introduces the theoretical basis of the preload optimization method.
Section 3 presents the ultrasonic motor test device and experimental results.
Section 4 introduces the verification of the optimization method, and
Section 5 gives the conclusion of this study.
3. Experimental Test
The new preload optimization method requires linear regression according to the measured performance curve. Drive characteristics measure the phase difference of two-phase driving voltage; mechanical characteristics measure the stalling torque, no-load speed, and maximum efficiency; and speed stability measures the standard deviation of speed.
As described in this section, the preload test platform was built to obtain the performance curves of phase difference, stalling torque, no-load speed, maximum efficiency, and standard deviation of speed of the motor under different preload, and the drive characteristics, mechanical characteristics, and speed stability of the motor were analyzed and studied. The experimental device is shown in
Figure 2a.
The digital oscilloscope was used to measure the electrical signal of the ultrasonic motor in
Figure 2b. The servo electric cylinder driver was used to provide the driving energy and signal control for the servo electric cylinder. The data acquisition module was used to collect the speed signal, torque signal, and the power output of the torque sensor. The digital display unit was used to display the force signal from the pressure sensor. The loading of the ultrasonic motor preload was achieved by the micro-stepping motion of the servo electric cylinder. The magnetic powder brake was used to provide the simulated load for the ultrasonic motor.
The experimental device includes an ultrasonic motor (TRUM-60), servo electric cylinder (DDA-40, Dingying Intelligent Equipment Co., Ltd., Shenzhen, China), pressure sensor (TSC-1000, Toledo Corporation, Shanghai, China), torque sensor (CYT-303, Tianyu Hengchuang Sensor Technology Co., Ltd., Beijing, China), magnetic powder brake (FKG-10, Lanling Mechanical & Electrical Technology Co., Ltd., Jiangsu, China), tension controller (SC-1K, Lanling Mechanical & Electrical Technology Co., Ltd., Jiangsu, China), data acquisition card (PXI-1031, NI, TX, USA), PC, etc.
3.1. Drive Characteristics
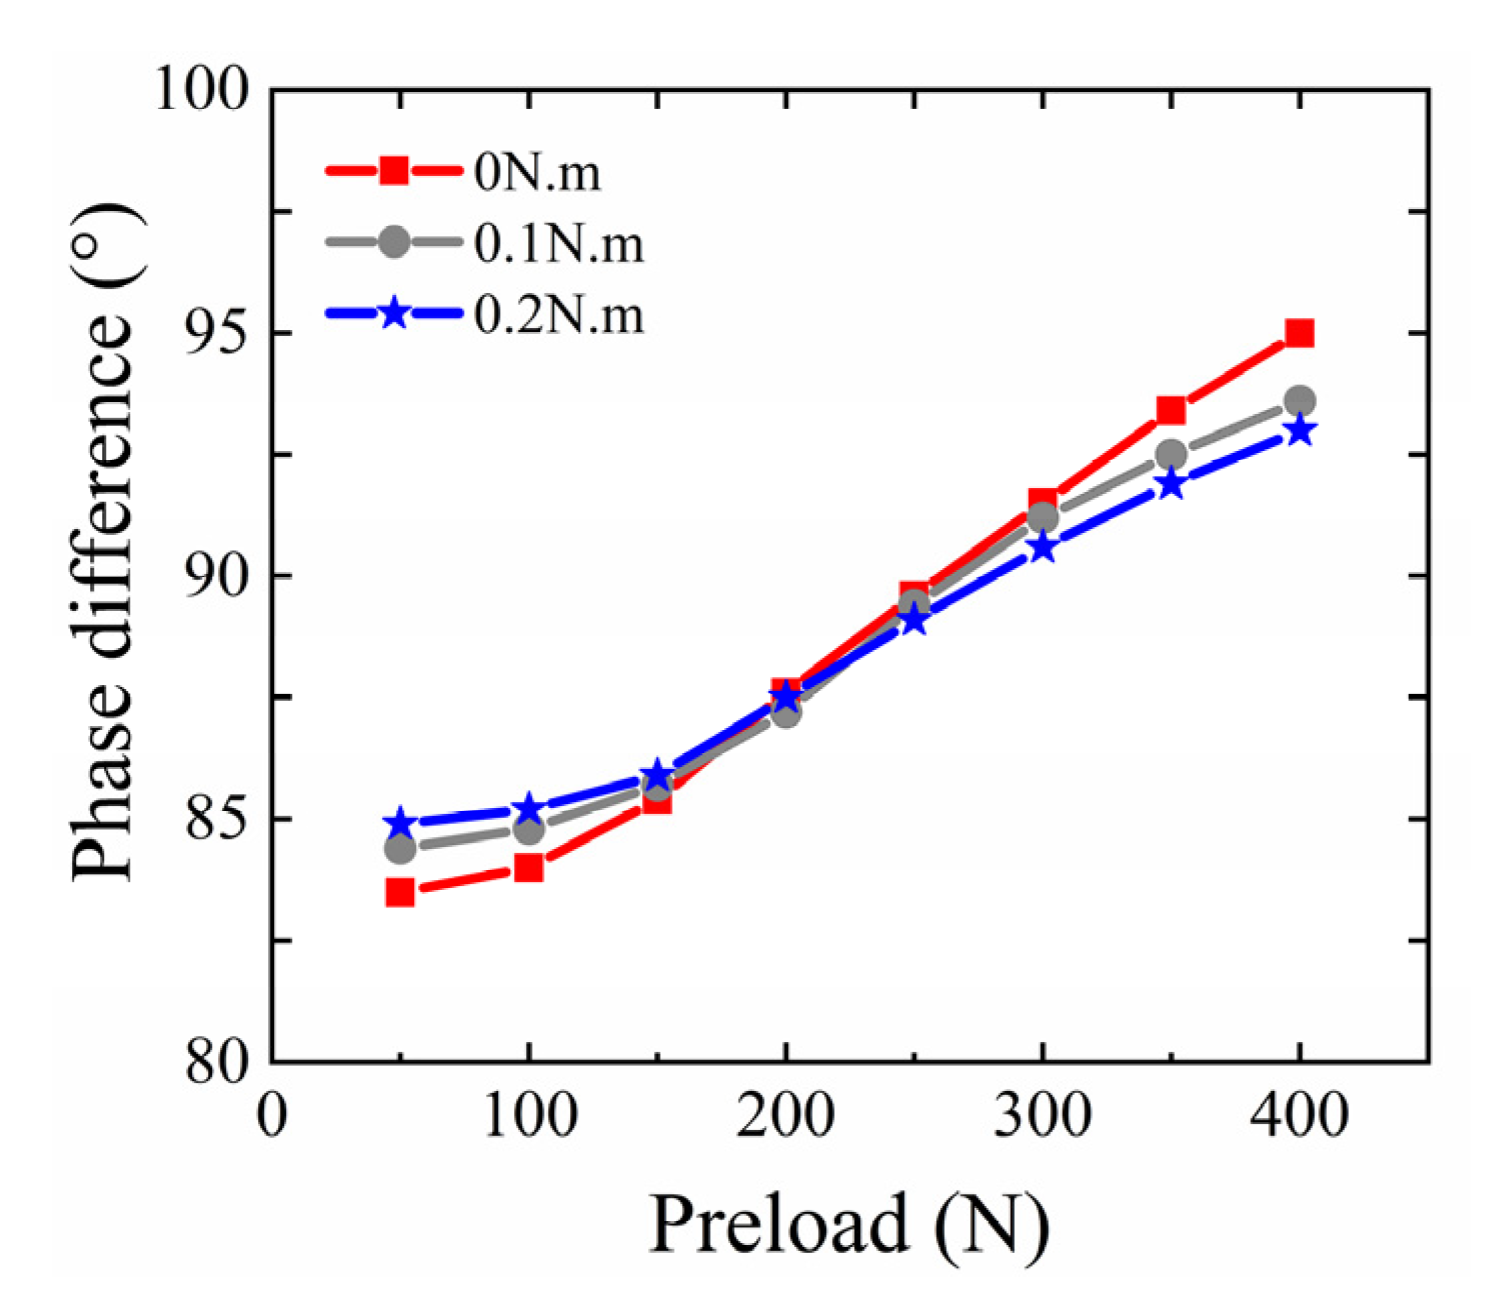
When the phase difference of the driving voltage of the ultrasonic motor is 90°, the contact interface is in good condition. The movement trajectory of the particles on the stator surface is a standard ellipse. Therefore, when the preload is optimized in this section, the orthogonality of the driving voltage phase difference could be taken as the criterion to determine the preload optimization range.
It can be seen from
Figure 3 that in the no-load state, the phase difference of the two-phase driving voltage gradually increases with the increase in preload, and the range of change is within 12°. When the preload is within the range of 150 N–400 N and the phase difference is within 85° to 95°, the motor is in good working condition. When the preload is 250 N and the phase difference is 90°, the motor is in the best running state.
During the preload optimization, in order to make the motor reach a good working state, the range of its change is 150 N–400 N. As the motor load increases, the range of phase difference decreases. When the load is 0.2 N·m, the range decreases to less than 7°, and the phase difference is about 90° when the preload is 250 N. Therefore, the load change is not sensitive to the preload adjustment range. We can limit the preload constraint range to 150 N–400 N during the optimization calculation.
3.2. Mechanical Characteristics
The mechanical characteristics include the power characteristics, efficiency characteristics, and output characteristics.
3.2.1. Power Characteristics
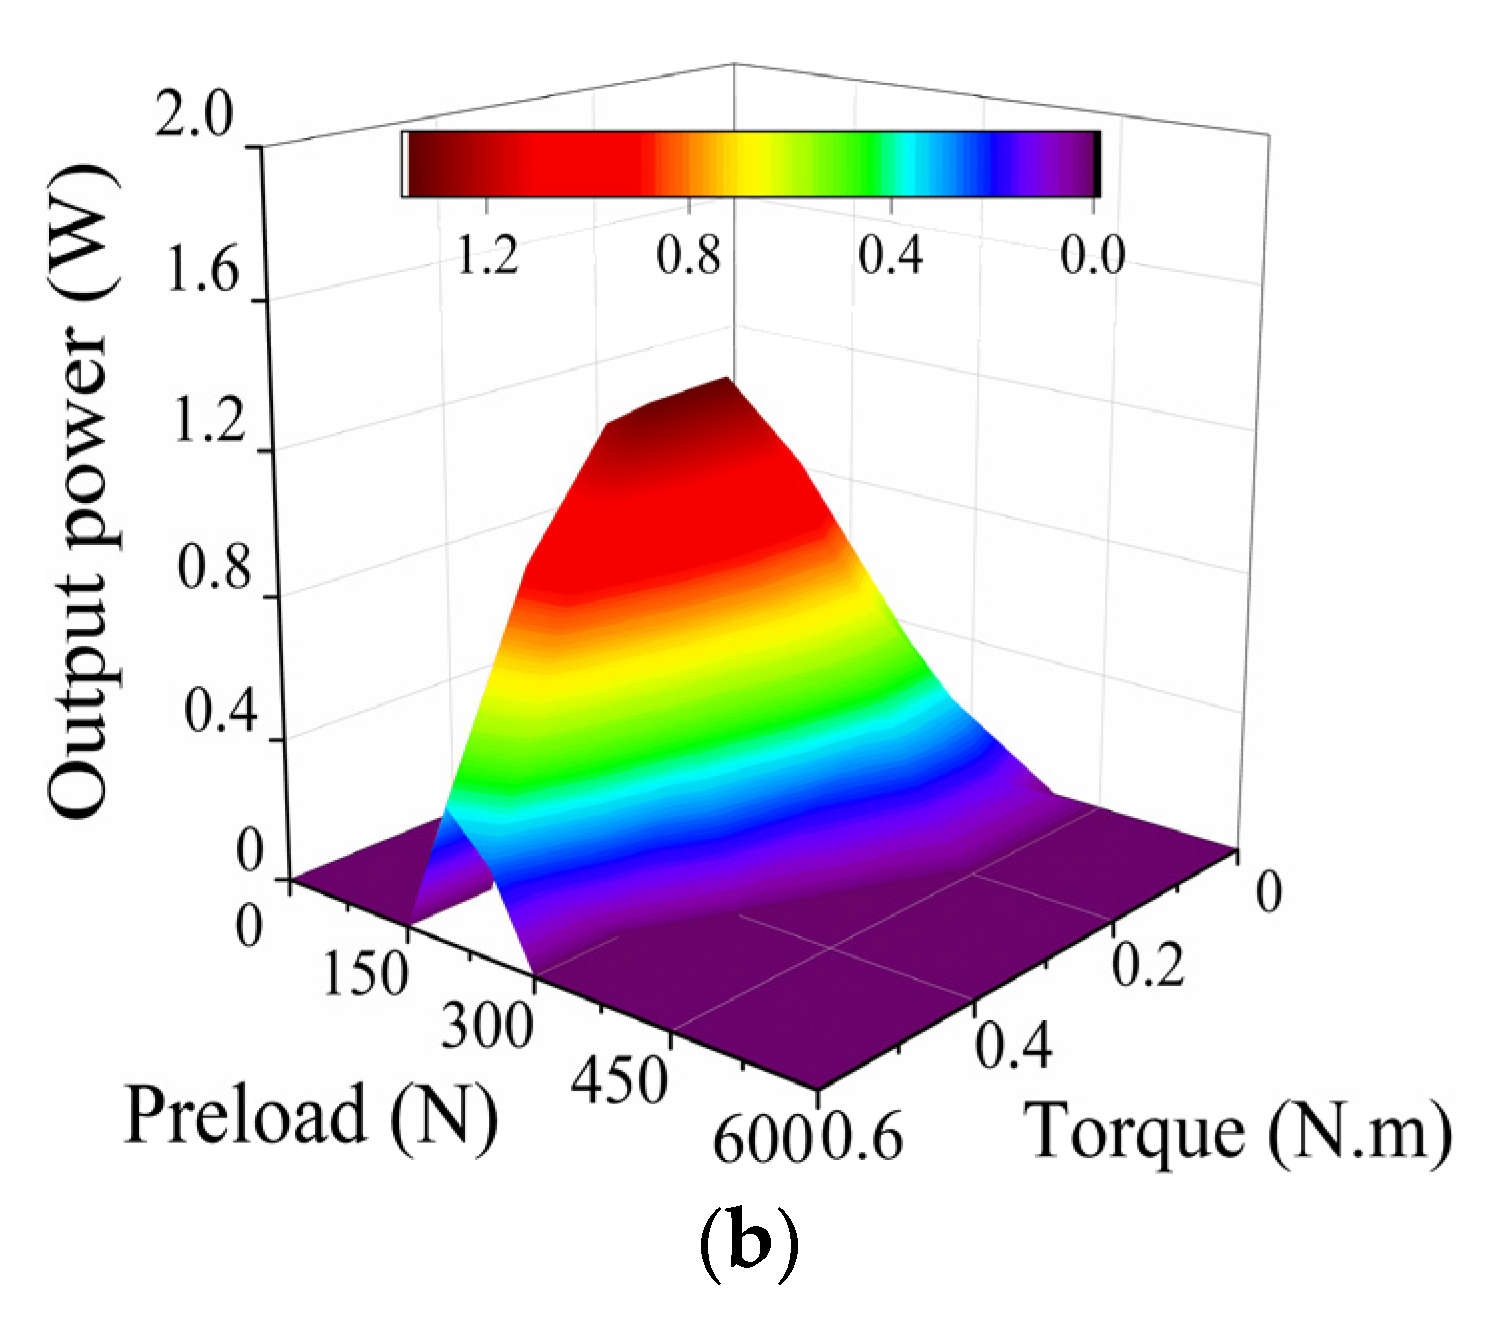
As shown in
Figure 4, the driving frequency is 42 kHz, the preload is 250 N–350 N, the load torque is within the range of 0.3 N·m–0.5 N·m, the motor is in the high-power working area, and the maximum power is 4.39 W. The driving frequency is 43 kHz, the preload is 200 N–250 N, the load torque is in the range of 0.3 N·m–0.4 N·m, the motor is in the high-power working area, and the maximum power is 1.35 W. In the optimization of the preload, the high-power area is taken as one of the optimization objectives.
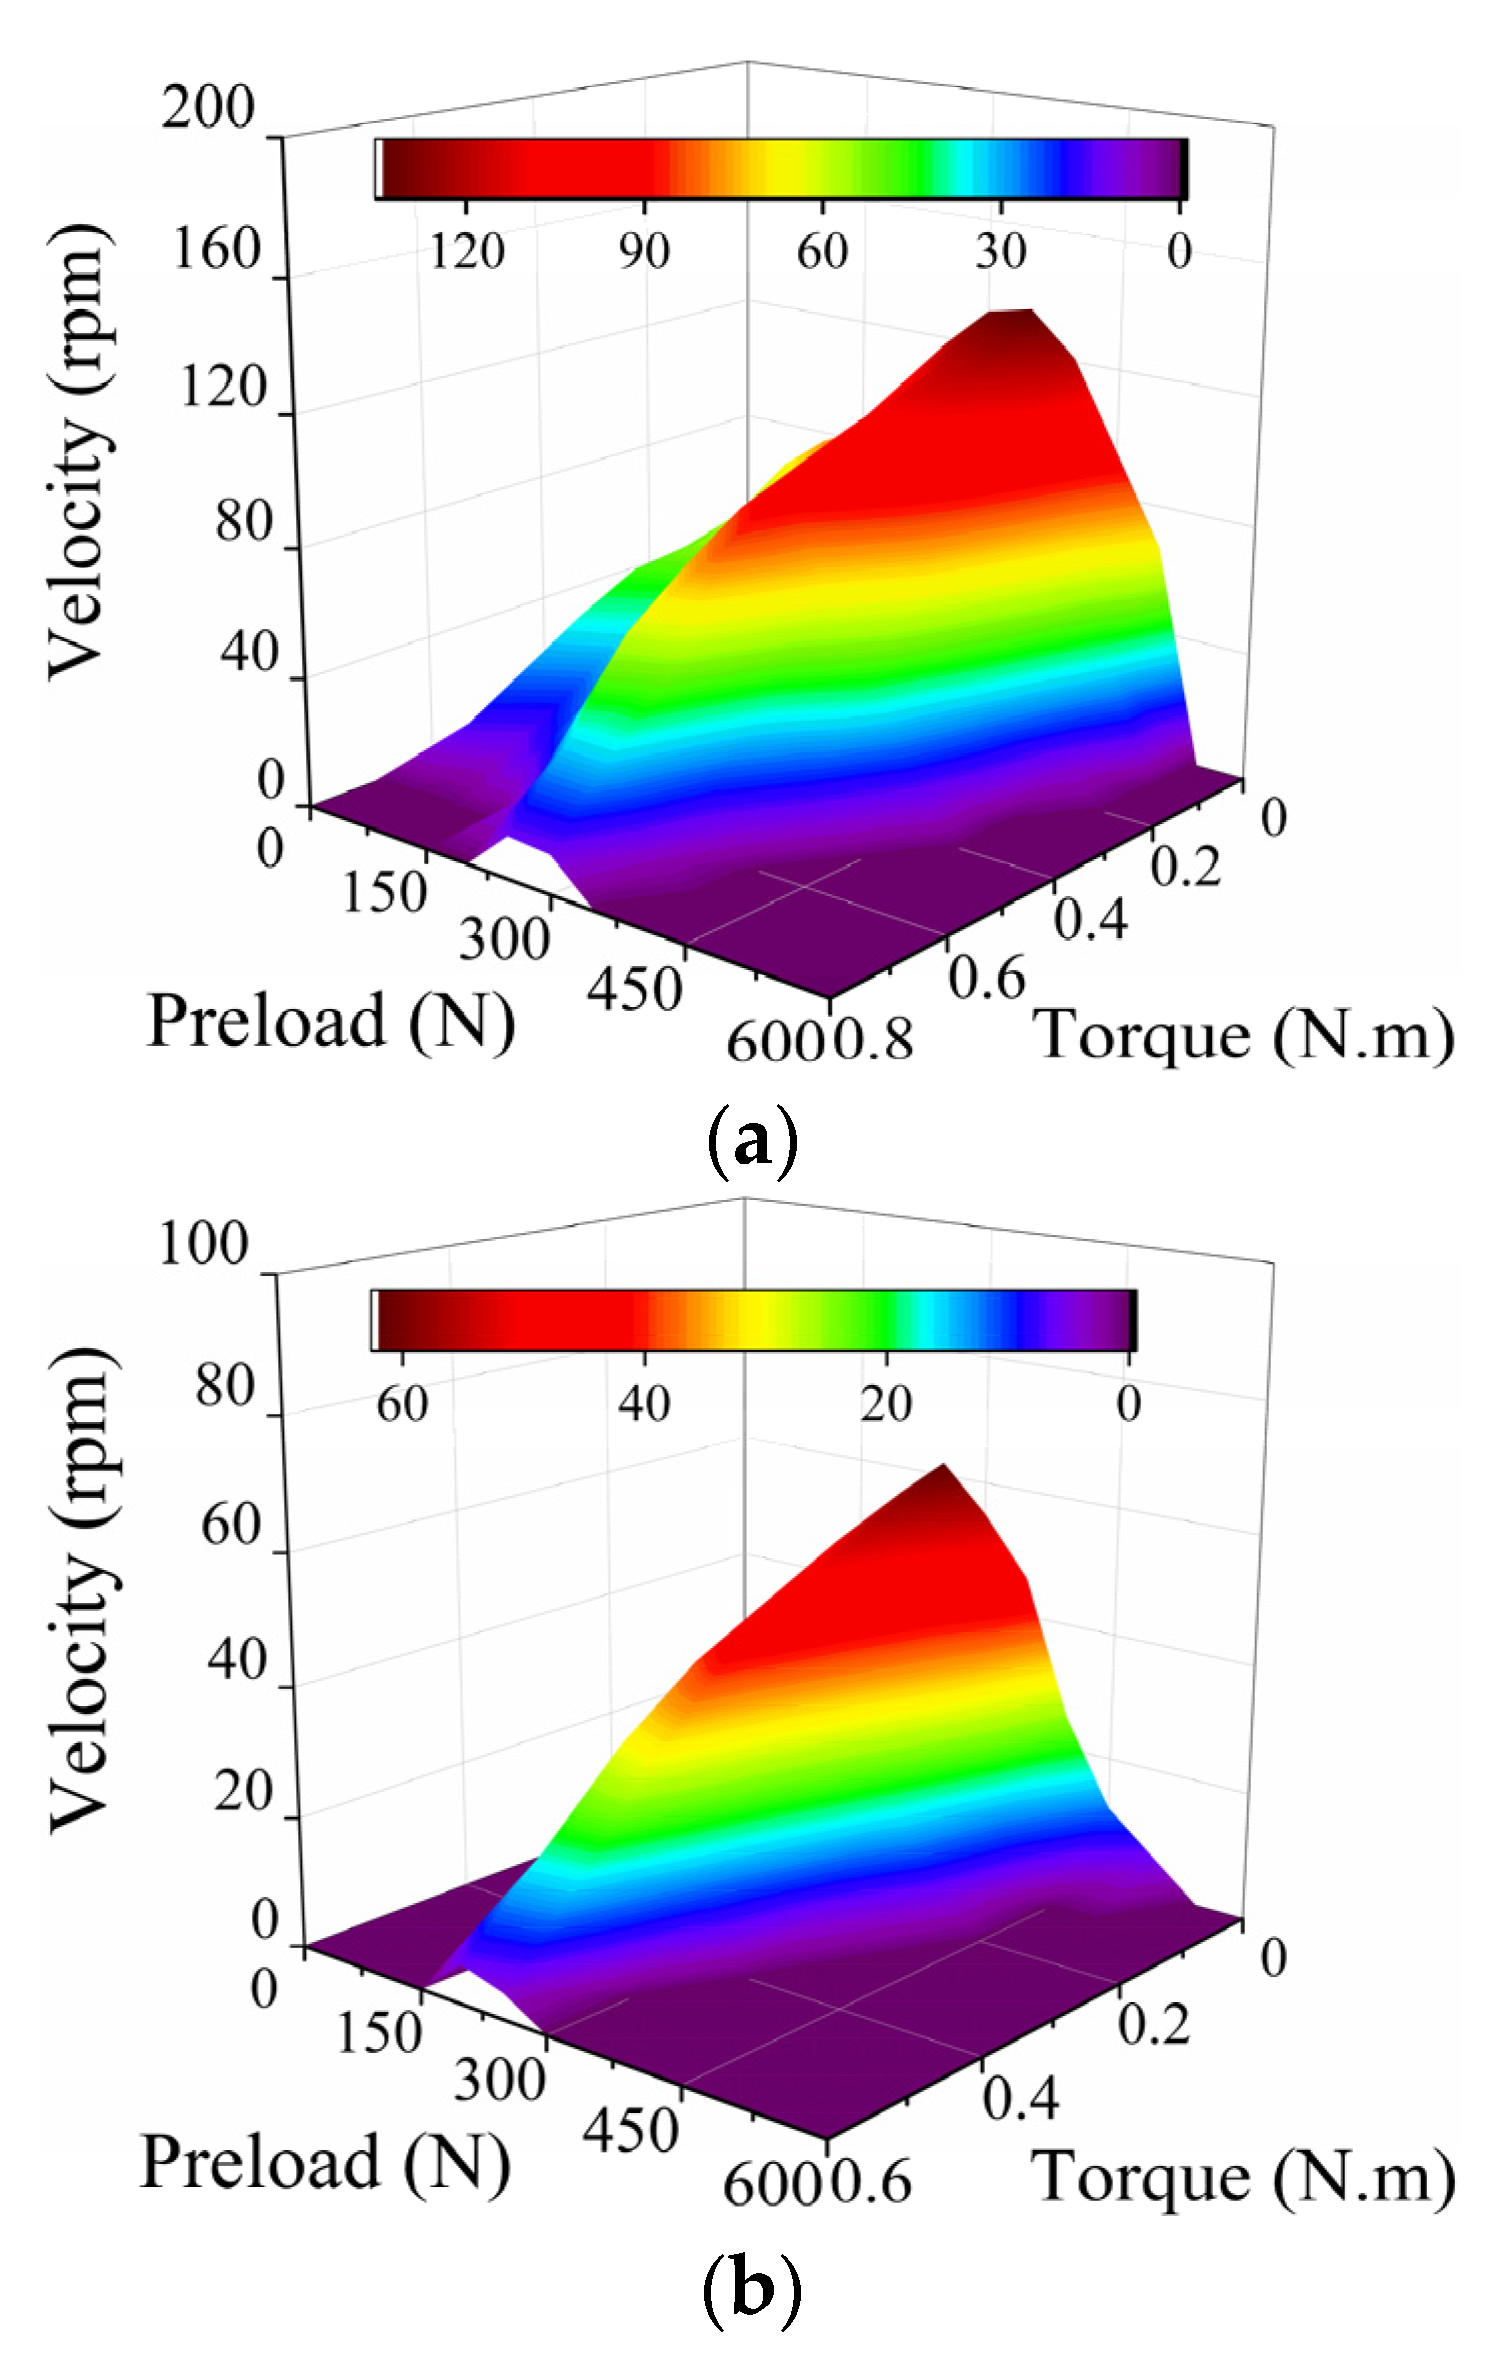
Figure 5 is a 3D curved surface diagram of preload, torque, and speed when driving frequency is 42 kHz–43 kHz. It can be seen that when the preload increases, the speed increases first and then decreases; when the load torque increases, the speed increases first and then decreases. As can be seen from
Figure 5a,b, no matter how the driving frequency of the excitation signal changes, under different load torques, the speed increases first and then decreases with the increase in the preload, with basically similar changing trends. It should be pointed out that the problem of order should be considered in the linear regression of the speed curve, and the overfitting of Equation (1) must be prevented.
3.2.2. Efficiency Characteristics
Output efficiency is an important motor parameter, and the motor should be in high efficiency when working. In the process of preload optimization, it is necessary to analyze the output efficiency of the motor and obtain the maximum efficiency curve.
As can be seen from
Figure 6a, when the preload or load torque increases, the output efficiency first increases and then decreases. When the preload is 150 N–350 N and the load torque is 0.3 N·m–0.5 N·m, the motor is in the high-efficiency working area, and the maximum efficiency can reach 32%. In the construction of the optimization method, the curve of maximum output efficiency (motor load torque of 0.4 N·m) was used as the input parameter of the optimization method after linear regression. The curve with the maximum output efficiency is shown in
Figure 6b.
3.2.3. Output Characteristics
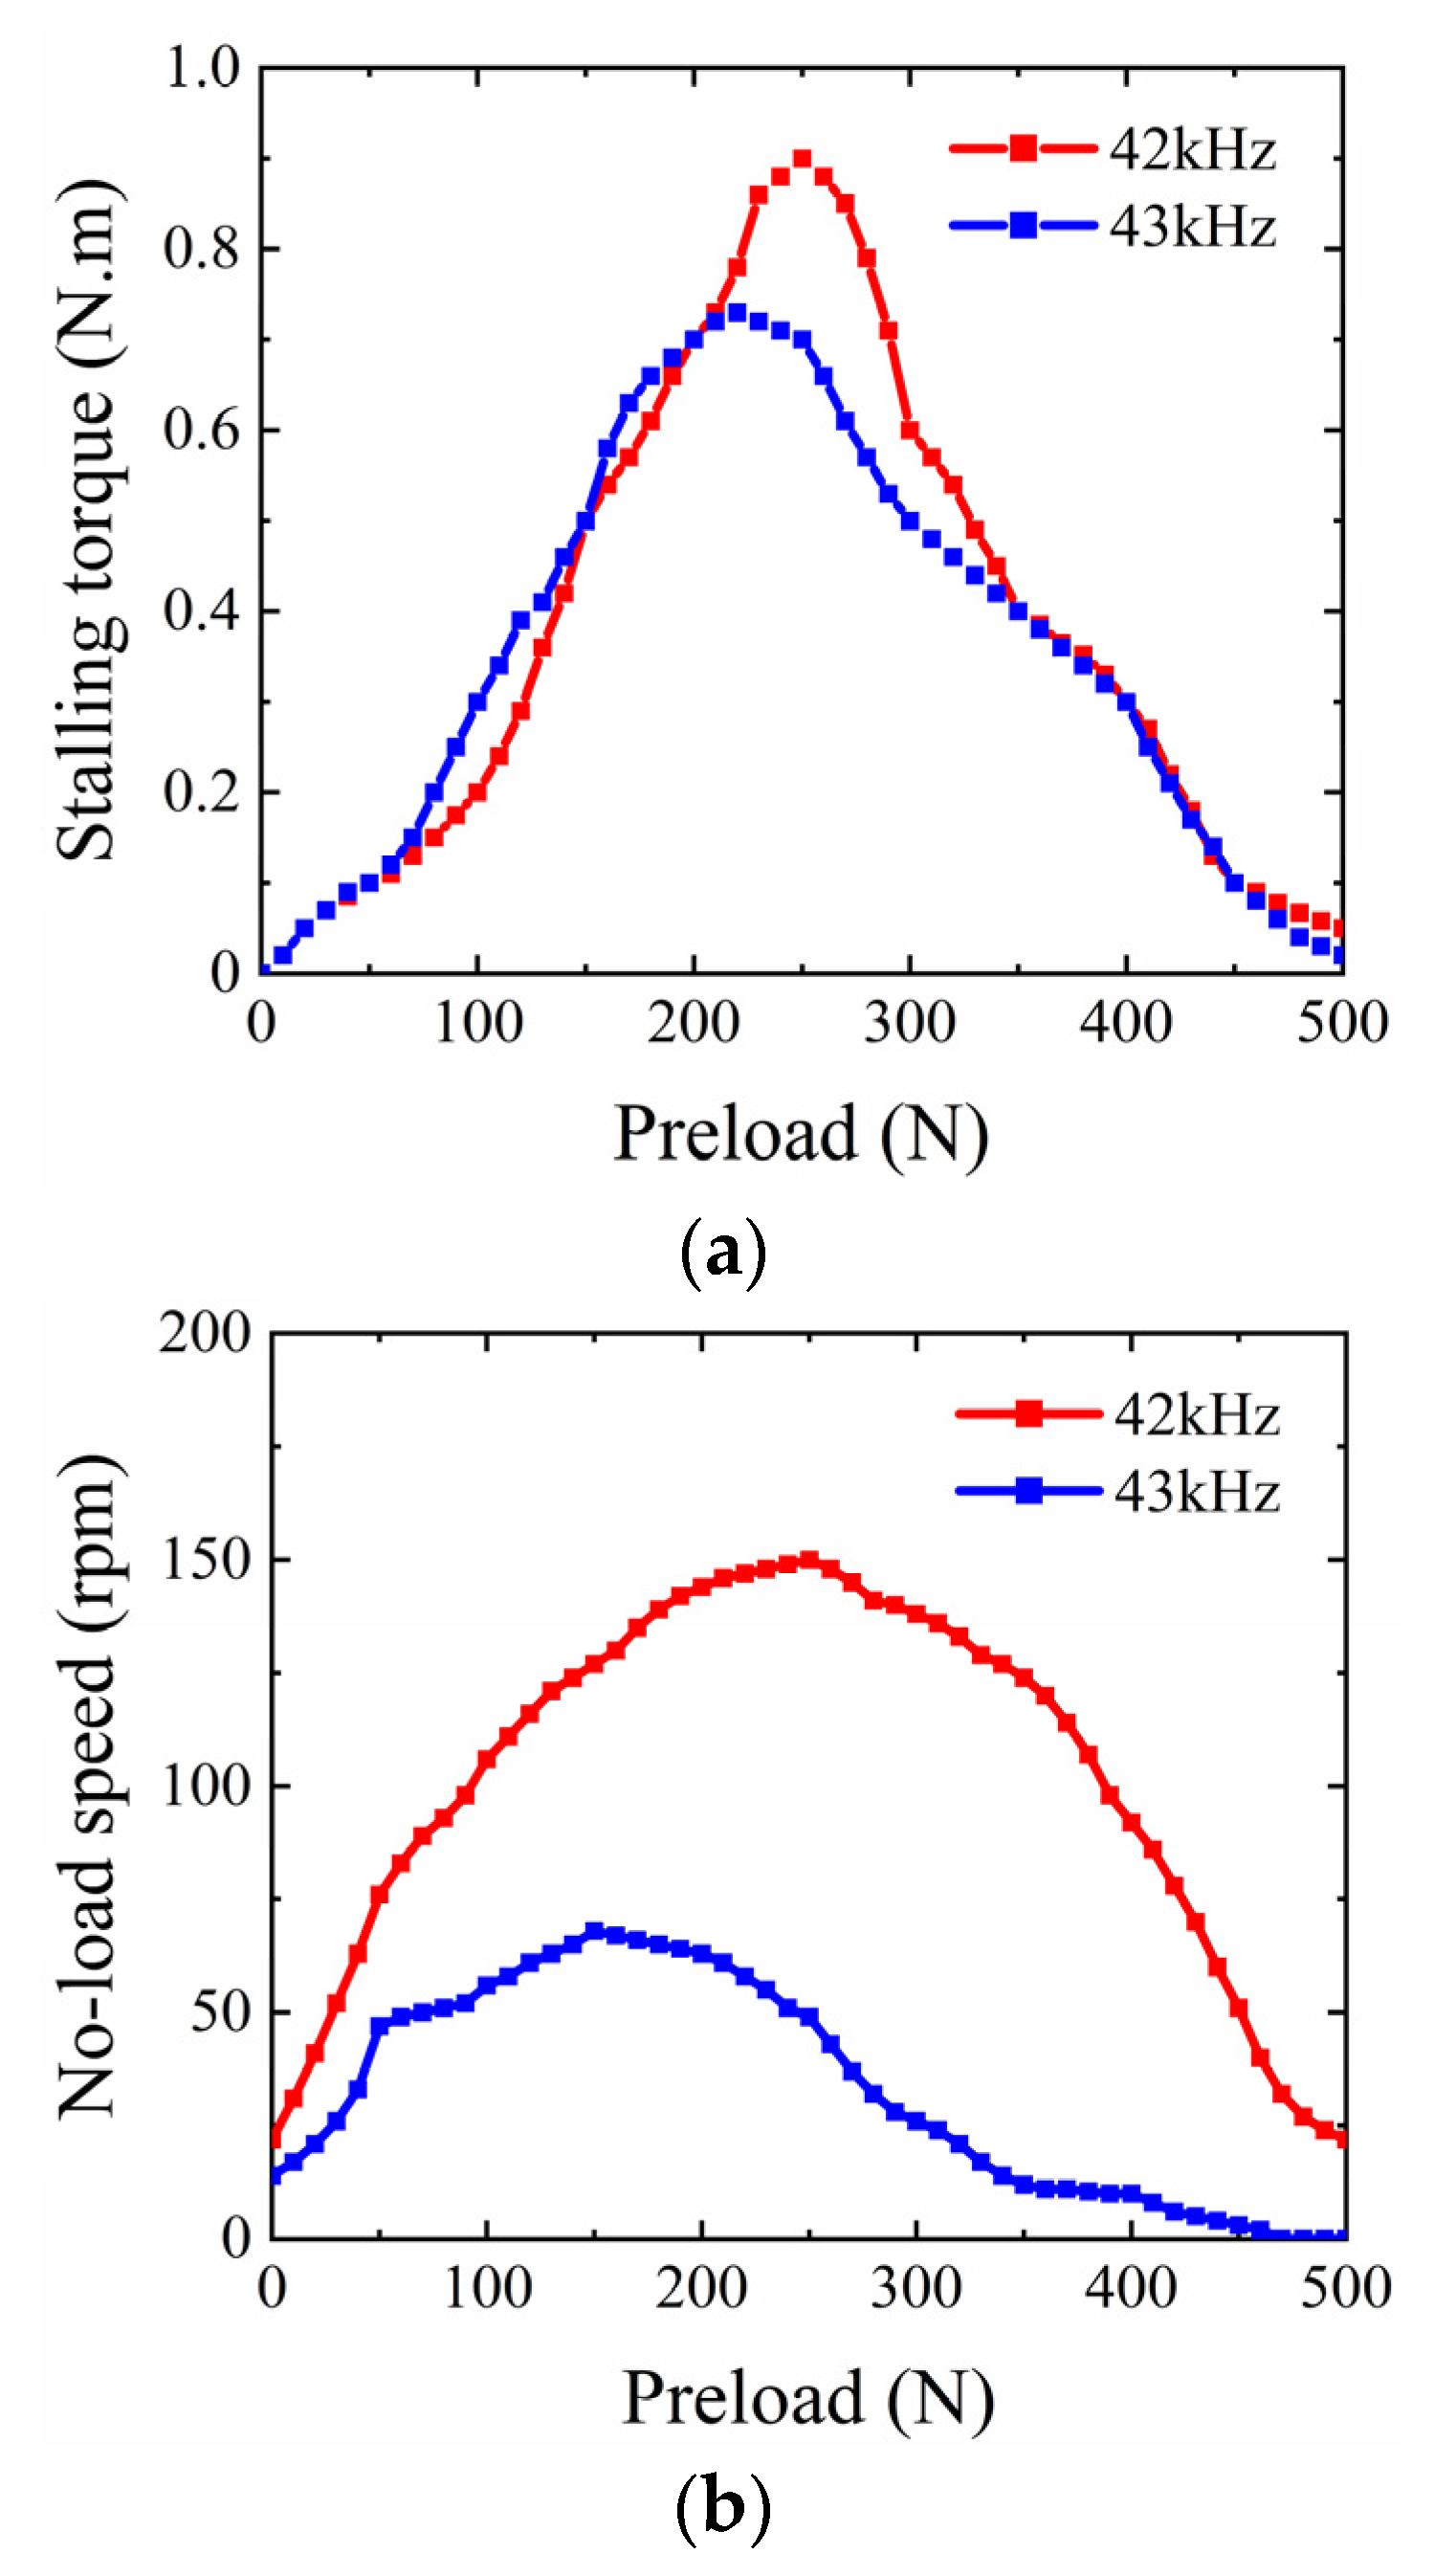
The output characteristics of a motor include the stalling torque and no-load speed, which are important parameters to measure the performance of a motor. During the experiments, the data of stalling torque and no-load speed were measured.
As can be seen from
Figure 7, when the driving frequency is 42 kHz and the preload increases, both the stalling torque and the no-load speed increase at first and then decrease. The maximum stalling torque reaches 0.9 N·m, and the maximum no-load speed reaches 148 rpm. When the frequency is 43 kHz, both the stalling torque and no-load speed decrease, but the changing trends are similar to those in 42 kHz.
3.3. Speed Stability
Speed stability is one of the bases of the preload optimization method, which represents the speed fluctuation when the motor is running steadily. In this paper, the standard deviation of speed is used as the evaluation index of the speed stability. Therefore, we used it as one of the input curves for the optimization method. Test results of motor speed stability under different working conditions are shown in
Figure 8.
As can be seen from
Figure 8a, when the frequency is 42 kHz, the preload is in the range of 200 N–300 N and the speed fluctuation is relatively small. When the driving frequency is increased to 43 kHz, the standard deviation of the speed decreases overall compared with 42 kHz. When the preload is between 200 N and 300 N, the standard deviations of the two driving frequencies are very similar. Therefore, when the preload is in the range of 200 N–300 N, the increase in driving frequency has little influence on the stability of the speed, and the preload can be set in this range during the optimization. In
Figure 8b, when the motor is in the no-load state and the preload is 200 N–300 N, the speed fluctuation is relatively small. When the load torque increases, the standard deviation of the speed decreases as a whole compared with the no-load state. Therefore, when the preload is in the range of 200 N–300 N, the increase in the load torque has little influence on the stability of the speed. In the optimization method, it is feasible to optimize the preload between 200 N and 300 N when only the stability of rotational speed is considered.
4. Example Verification
Through the above analysis, it can be concluded that, for the drive characteristics, when the phase difference is close to 90°, the range of preload change is 150 N–400 N and the motor is in the best running state; under the mechanical characteristics, when the preload is between 250 N and 350 N, the motor is in a state of high power; when the preload is between 150 N and 350 N, the motor efficiency is the highest; and when the preload is 200 N–300 N, the motor has good stability of speed.
As for the motor preload optimization method, different performance indexes need to be focused on a certain application. Therefore, the union of the above interval is taken as the value range of preload of the optimization method, namely 150 N–400 N.
According to the preload test platform built in this paper, the test data of stalling torque, maximum efficiency, no-load speed, and standard deviation of speed within the preload range were measured and are shown in
Figure 9.
The fitting qualities of these curves with their linear regression are shown in
Table 2. It can be seen that the fitting degree of each performance curve is close to 1. The linear regression data can be used for the preload optimization method.
In this paper, a case is given to verify the preload optimization method. A direct-drive cooperative manipulator driven by an ultrasonic motor is taken as an application example. The physical prototype of the manipulator is shown in
Figure 10a. The direct-drive cooperative manipulator consists of three traveling-wave rotary ultrasonic motors as joint actuators of the manipulator.
A direct-drive collaborative robotic arm based on ultrasound motors as a power source is shown in
Figure 10b, which includes three traveling wave-type rotating ultrasound motors, the robotic arm, the driver and controller, and the operator interface. The joint parts of the robotic arm are all driven directly by the ultrasound motors. The driver provides the drive signal for the ultrasound motors. The controller provides the control signal for the robotic arm. The operator interface can be used to input the operating commands of the robotic arm.
According to the application requirements of the direct-drive cooperative manipulator [
23], the manipulator needs to improve the stalling torque and kinematic stability. Therefore, the performance indicators are taken as the optimization method’s stalling torque, the standard deviation of speed, no-load speed, and maximum efficiency. The sorting order of the comparison matrix is obtained as follows:
According to Equations (9)–(13), the weight coefficients corresponding to different performance indicators can be obtained, as shown in
Table 3.
According to Equations (14)–(16), the consistency index of the comparison matrix is 0.057, and the consistency ratio is 0.064. The consistency ratio is less than 0.1, so the comparison matrix is acceptable.
By substituting the weight coefficient in
Table 3 into Equation (7), the preload of the ultrasonic motor in this case is 310 N. As can be seen from
Figure 2, the phase difference of the two-phase driving voltage is 91.4°, which is close to orthogonal, and the trajectory of the particle on the stator surface is close to an ellipse.
The original preload of the ultrasonic motor was 200 N, and the preload was set to 310 N after optimization. As can be seen from
Table 4. For comparison, the stalling torque of the ultrasonic motor is increased by 0.12 N·m, which was increased by 20.7% compared with the original state. The maximum efficiency increased by 3.6%, compared to the original maximum efficiency, which was increased by 15.3%; the no-load speed was reduced by 8 rpm, which is 5.5% lower than the original no-load speed. The standard deviation of the speed was reduced by 0.7, which was 53.8% lower than the standard deviation of the original speed.
It can be seen that the preload optimization method based on the analytic hierarchy process obtained the optimal preload through testing and calculation in the example of the direct-drive cooperative manipulator. The stalling torque and maximum efficiency are greatly improved, the no-load speed is slightly reduced, and the output influence on the motor performance can be ignored. The standard deviation of the speed was greatly reduced, and the stability of the speed was better, which met the application requirements of the direct-drive cooperative manipulator. Therefore, the preload optimization method proposed in this paper is effective and meets the requirements for the best preload and performance improvement.
Table 5 shows the results of the preload optimization method in this paper compared to other optimization methods.
The following conclusions can be drawn from
Table 5: the stalling torque using the new method is less than the mean value 0.96 N·m of the optimization range in the literature [
19]; the standard deviation of speed using the new method is less than the mean value 4.25; the no-load speed using the new method is larger than the mean value 76 rpm; the maximum efficiency using the new method is less than the mean value 33.7%; the stalling torque using the new method is larger than the value 0.65 N·m in the literature [
24]; the standard deviation of speed using the new method is less than the value 2; the no-load speed using the new method is larger than the value 115 rpm; and the maximum efficiency using the new method is larger than the value 24%.
Traditional preload optimization methods are usually based on experience in determining the preload. The most important contribution is that the new approach offers a unique solution, instead of an optimization domain. The unique preload value makes the preload control simpler for TRUM design and fault monitoring.


