Article

Effects of Different Diesel-Ethanol Dual Fuel Ratio on Performance and Emission Characteristics of Diesel Engine

1
School of Mechanical and Transportation, Guangxi University of Science and Technology, Liuzhou 545006, China
2
Institute of the New Energy and Energy-Saving & Emission-Reduction, Guangxi University of Science and Technology, Liuzhou 545006, China
3
Research Center of Guangxi Industry High-Quality Development, Guangxi University of Science and Technology, Liuzhou 545006, China
4
School of Science, Guangxi University of Science and Technology, Liuzhou 545006, China
*
Author to whom correspondence should be addressed.
Processes 2021, 9(7), 1135; https://doi.org/10.3390/pr9071135
Submission received: 9 June 2021 / Revised: 24 June 2021 / Accepted: 27 June 2021 / Published: 29 June 2021
(This article belongs to the Special Issue Clean Combustion and Emission in Vehicle Power System)

Abstract

:
In this paper, a four-stroke engine diesel was employed to investigate the effects of different fuel mixture ratios of diesel and ethanol on engine performance and emission characteristics in terms of cylinder temperature, heat release rate, brake power, brake thermal efficiency, brake specific fuel consumption, and cylinder pressure. The corresponding simulation model of diesel engine was developed by AVL-Fire coupled CHEMKIN code, and an improved chemical kinetics mechanism containing 34 reactions and 19 species was employed to simulate the fuel spray process and combustion process. The simulation model was validated by experimental results under 100% and 50% load conditions and used to simulate the combustion process of diesel engine fueled with pure diesel and diesel–ethanol blends with 10%, 20%, and 30% ethanol by volume, respectively. The results showed that the increase of ethanol content in the blended fuel had a certain negative impact on the performance characteristic of diesel engine and significantly improved the emission characteristic of the engine. With the ethanol proportion in the blended fuel increased to 10%, 20%, and 30%, the brake thermal efficiency of the engine increased by 2.24%, 4.33%, and 6.37% respectively. However, the brake-specific fuel consumption increased by 1.56%, 3.49%, and 5.74% and the power decreased by 1.58%, 3.46%, and 5.54% respectively. In addition, with the ethanol proportion in the blended fuel increased to 10%, 20%, and 30%, the carbon monoxide emission decreased by 34.69%, 47.60%, and 56.58%, and the soot emission decreased by 7.83%, 15.24%, and 22.52% respectively. Finally, based on the combining fuzzy and grey correlation theory, nitrogen oxide emission has the highest correlation with engine power and brake-specific fuel consumption. The values reach 0.9103 and 0.8945 respectively. It shows that nitrogen oxide emission and cylinder pressure have a significant relationship on engine power and brake-specific fuel consumption.

1. Introduction

Diesel engine has been widely used in automobile, transportation, industrial application, and agriculture due to its good fuel economy and durability [1]. Thus, it has become the main power source of ships, trucks, and other large mechanical equipment [2]. Diesel engine is the most widely used, accounting for more than 80% of the global transportation industry, making an irreplaceable contribution to the development of society [3]. However, due to a lot of particulate matter (PM), hydrocarbon (HC), nitrogen oxides (NOx), sulfur oxides (SOx), and other toxic or harmful substances produced by the diesel engine [4], people’s health and atmospheric environment have been seriously threatened [5]. In addition, the NOx emission of diesel engine accounts for 70% of the total vehicle emission [6], which is the main pollution source leading to the formations of acid rain and chemical smog. With the continuous deterioration of the environment and the continuous improvement of emission regulations, the improvements of engine emission, economy, and performance characteristics [7] have become a major challenge for the development of diesel engine [8].
There are two main ways to reduce pollution gas emissions: engine pre-treatment and engine post-treatment [9]. The engine post-treatment system mainly uses diesel particulate filters (DPF), diesel oxidation catalysts (DOC), selective catalytic reduction (SCR), and other devices to treat exhaust gas. A large number of studies have shown that the use of post-processing systems can achieve the excellent goal of emission reduction [10]. For example, Di Sarli et al. [11] found that the DPF post-treatment system could achieve a carbon dioxide (CO2) selectivity higher than 99% in a wide temperature range, which greatly reduced the soot emission. They also found that the DPF could also be regenerated [12], which could greatly improve work efficiency. Moreover, the engine pre-treatment is mainly to find alternative fuels for diesel, such as H2, ethanol, biodiesel, etc. so as to achieve the goal of emission reduction. In recent years, due to the strict emission regulations and emission requirements [13], people have been very interested in finding alternative fuels [14]. Among the various alternate fuels, biodiesel is considered as one of the alternative fuels for diesel engine [15]. The use of biodiesel as an alternative fuel can significantly reduce pollutant emission, but also increases the NOx emission. Therefore, only by combining fuel purification technology with exhaust gas treatment technology, can the increasingly stringent emission regulations be met [16].
In addition, the combustion process of diesel engine is a complex process, which is not only time-consuming and laborious, but also costly. Therefore, the numerical simulation software has been widely used in the development of diesel engine [17]. Considering the efficiency and cost of the experiment, many researchers established mathematical models by simulation software and studied the combustion process of diesel engine [18]. Modeling and simulation can effectively make up for the lack of diesel engine test. The common simulation software mainly includes AVL-BOOST, AVL-Fire, etc. At present, due to the availability of high-performance computer and the development of more efficient algorithms, numerical simulation methods are favored by many researchers. For example, Jimenez et al. [19] developed a complete engine simulation model by AVL-BOOST software and studied the injection process of diesel–ethanol and ethanol–biodiesel mixture. The results showed that the experimental results were in good agreement with the simulation results. Tang et al. [20] established the model by AVL-BOOST software and used an optimization algorithm to predict the generation of nitric oxide (NO) in diesel engine cylinder. The results showed that the simulation model could better predict the engine emission characteristic. Similarly, Zoldy et al. [21] established a 3-D model of the nozzle by the AVL-Fire software and studied the influence of different nozzle diameters on the pyrolysis oil–diesel mixture. The result showed that the simulation was in good agreement with the experiment. Karami et al. [22] established an artificial neural network model and analyzed the combustion characteristic of diesel engine fueled with diesel-tomato seed oil and biodiesel blended fuel. The results showed that the artificial neural network model and the AVL-Fire model were in good agreement with the experimental values. Asadi et al. [23] studied the application of biodiesel and ethanol in multi-cylinder diesel engine by a validated model in the AVL-Fire environment. The comparison of the simulated value and the experimental value showed that the use of numerical software could well predict the combustion process and emission characteristic of the engine.
At present, the additions of biodiesel, ethanol, and other oxygen-containing additives to diesel have attracted the attention of the researcher [24]. Adding oxygen-containing additives to diesel could achieve the reduction in emission, which has been recognized by many researchers. Ethanol is a kind of renewable energy, which can be produced from sugarcane, molasses, cassava, waste biomass raw materials, sorghum, corn, barley, beet, and other raw materials by using the improved and demonstrated technology [25]. The addition of ethanol can improve the fuel characteristic and reduce the harmful emission. Shirneshan et al. [26] used a genetic optimization algorithm to study the effect of diesel–ethanol blended fuel on diesel engine performance and emission characteristics. The results showed that with the increase of ethanol content in the blended fuel, the emissions of carbon monoxide (CO) and smoke were reduced by 44% and 38% respectively. This showed that the addition of ethanol could improve the emission characteristic of the engine. Sayin et al. [27] studied the effects of methanol and diesel–ethanol blends on engine performance and emission characteristics. The results showed that adding methanol or ethanol to diesel could reduce the smoke, CO, and total hydrocarbon emissions. Aydın et al. [28] studied the effect of diesel–ethanol–biodiesel on engine performance and emission characteristics of a single-cylinder diesel engine. The results showed that adding ethanol to diesel or biodiesel could significantly reduce the exhaust pollutant emissions. Kim et al. [29] studied the effects of diesel–ethanol blend fuel on idle combustion and emission characteristics of diesel engine. The results showed that the incorporation of ethanol could improve the emission characteristic of diesel engine. For example, as the ethanol content in the blended fuel increased from 0 to 10%, the average diameter of soot particles decreased from 33.9 nm to 24.8 nm and the soot emission was decreased by 26.7%. Tutak et al. [30] had found that the use of diesel–ethanol blended fuel could significantly reduce CO2 emission in exhaust gas. Li et al. [31] studied the effect of diesel–ethanol blended fuel on performance and emission characteristics. The results showed that the addition of ethanol could improve the emission characteristic of diesel engine. With the increase of ethanol content in the blended fuel, the emissions of CO, NOx, and soot in the exhaust gas were reduced.
As mentioned above, the use of diesel–ethanol blended fuel can significantly improve the emission characteristic and effectively reduce the pollutant emission. In this paper, the AVL-Fire software coupled with CHEMKIN code was used to develop the diesel engine model and investigate the effect of different ethanol ratios in blended fuel on the performance and emission characteristics of diesel engine. Firstly, the model was developed according to the diesel engine, and then validated by the test results under different conditions. Finally, the combustion processes of different proportion of diesel–ethanol fuel (DE10, DE20, and DE30) were simulated and compared. The pollutant emission of the engine can be significantly reduced due to the use of diesel–ethanol blended fuel. Thus, this research is very meaningful.

2. Models and Methods

The AVL-Fire is an engine process simulation software that complies with engine industry standard. The models can accurately simulate the combustion processes of gasoline, diesel, and dual fuel engines. In the paper, some AVL-Fire sub-models were employed to predict the emissions. For example, the Extended Zeldovich model is employed to predict the emissions of NOx and CO. The Frolov Kinetic model is employed to predict the soot emission. In addition, the multi-component model is used to predict the fuel evaporation process.

2.1. Mathematical Model

2.1.1. Intake and Exhaust Pipe Model

In engine simulation, the flows in intake and exhaust pipes are unstable, so the model of the intake and exhaust pipes can be calculated by the finite volume method. The specific calculation process can be expressed as follows [32]:
d m d t = f r o n t m ˙
d m e d t = p d V d t + f r o n t m ˙ H h g A T g a s T w a l l
d m H d t = f r o n t m ˙ H + V d p d t h g A T g a s T w a l l
d m ˙ d t = A d p + f r o n t m ˙ u 4 f ρ u 2 A d x 2 D C p 1 2 ρ u 2 A d x
where m ˙ is the mass flow through the boundary, g/h; m is the mass of the volume considered, g; V is the volume, m3; p is the pressure, Pa; ρ is the density, g/m3; A is the cross-flow area, m2; e is the total internal energy (internal energy plus kinetic energy), J; H is the total enthalpy (H = e + p/ρ), J; hg is the convective heat transfer coefficient, J/(m2·s·°C); u is the velocity at the boundary of the volume, m/s; f is the surface friction coefficient, Cp is the head loss coefficient, D is the equivalent diameter, m; dx is the thickness of the element in the direction of the flow near the boundary, m; and dp is the pressure difference acting across dx, Pa; Tgas is the gas temperature, K; Twall is the wall temperature, K; and f r o n t means to sum on the boundary.

2.1.2. Cylinder Model

The combustion and heat transfer processes of the cylinder follow certain rules. The basic equations of the working process of the cylinder are as follows:
(1) Energy conservation equation:
d U = d W + d Q i + j h j · d m j
where U is the internal energy of the system, J; W is the mechanical work acting on the piston, J; Qi is the heat exchanged through the boundary of the system, J; hj is the specific enthalpy, J; and hj·dmj is the energy that mass dmj brings into or brings out of the system, J.
(2) Mass conservation equation:
d m d φ = d m A d φ + d m B d φ + d m C d φ
where m is the mass of fuel in the cylinder, g; mA is the mass of air flowing into the cylinder, g; mB is the mass of exhaust gas leaving the cylinder, g; and mC is the instantaneous mass of fuel injected into the cylinder, g.
In addition, if the cycle injection quantity of diesel engine is gh, the fuel percentage in cylinder is X = mc/gh. Thus, Equation (6) can be transformed as follows:
d m d φ = d m A d φ + d m B d φ + g h · d X d φ
(3) Equation of state of ideal gas:
p V = M R T
where p is the pressure of gas in the cylinder, Pa; V is the volume of gas in the cylinder, m3; T is the temperature of gas in the cylinder, K; and R is the gas constant.

2.1.3. Combustion Model

The Extended Coherent Flame Model (ECFM) was used to predict the in-cylinder combustion in the AVL-Fire environment. The ECFM combustion model was mainly developed to describe the combustion of the direct injection internal combustion engine. The combustion of diesel engine has both premixed combustion and diffusion combustion. This model is fully coupled with the spray model and can be modeled for stratified combustion. The model relies on a conditional unburned or burned description of the thermo-chemical properties of the gas, which can improve the stability of combustion [33]. The ECFM model has clear and accurate physical meaning, and good calculation accuracy and convergence, which is a widely used combustion model. The mathematical calculation methods of ECFM model are as follows:
For the flame surface density S, it is solved by the following equations:
Σ t = x j ( u j ¯ ) x j ( V t σ Σ Σ x j ) = S Σ = S g S a + S L A M
S g = α K e f f Σ
S a = β ρ f u , f r S L ρ f u Σ 2
S L A M = p + C + S
where S is the turbulent flame surface density (flame area per unit volume); S is the Schmidt number of the turbulent flow; Vt is the turbulent kinematics viscosity, m2/s; Sg is the flame surface area generated by the turbulent strain rate, m2; and Sa is the disappearance of the flame surface due to the consumption of reactants, m2; Keff is the average stretching speed of the flame, m/s; SLAM is the contribution of laminar combustion to the generation of flame surface density; P, C, and S show the contribution of propagation, crooked, and strain to flame propagation, respectively; and σ is the surface tension, N/m.
The laminar flame velocity can be calculated by the following equation:
S L = S L 0 ( 1 2 Y E G R ) ( T f r T r e f ) a 1 ( p p r e f ) a 2
where Tref and pref are the reference values of the standard state; a1 and a2 are fuel-dependent parameters; SL is the laminar burning velocity; SL0 is the initial velocity of laminar burning; and YEGR is the exhaust gas mass fraction. To account for the effect of exhaust gas rates, the laminar burning velocity SL in the above relation is decreased by the factor (1.0~2.1 YEGR). It is evident that this formulation fails for YEGR values larger than 0.5, since the laminar flame speed becomes negative.
The thickness of the laminar flame can be calculated by the following equation:
δ L = ( T max T min ) ( d T / d X ) max
where T is the temperature, K.
The average turbulent reaction rate is calculated as follows:
ρ r · f u ¯ = ρ f u , f r S L Σ = ρ f r Y f u , f r Σ
The isentropic transformation can be calculated by the following equations:
T f r = T 0 ( p 0 p ) 1 K K
ρ f r = P R 0 T f r
where ρfu,fr is the partial fuel density of the fresh gas, g/m3; ρfr is the density of the fresh gas, g/m3; and Yfu,fr is the fuel mass fraction in the fresh gas.

2.1.4. Spray Model

The spray simulation involves multiphase flow phenomena, so the conservation equations of gas and liquid phases need to be solved numerically. Spray atomization involves a series of processes, such as droplet gas momentum exchange, turbulent dispersion, droplet evaporation, secondary crushing, droplet collision, and droplet wall interaction. In this paper, a discrete droplet method is used to calculate spray droplets, which is achieved by solving ordinary differential equations of trajectories, momentum, heat, and mass transfer of a single droplet. The equations involved are as follows:
The liquid particle acceleration can be expressed as:
d u i d d t = 3 4 C D ρ g ρ d 1 D d u g u d u i g u i d + 1 ρ g ρ d g i
They can be integrated to get the velocity of the liquid particle, thus the instantaneous particle position vector can be determined by integration:
d x i d d t = u i d
where CD is the drag coefficient; ρg is the fuel density, kg/m3; ρd is the particle density, kg/m3; Dd is the droplet diffusion coefficient; uig is the domain fluid velocity, m/s; uid is the liquid particle velocity vector, m/s; and xid is the liquid particle position vector, m.
The mass transfer rate can be expressed by the Sherwood. It can be predicted by the following equations:
m ˙ = i = 1 N π ρ g β g i D d s h * ln 1 + B Y i
B Y i = Y i s Y i 1 Y i s
where N is the number of components; m is the particle mass, g; ρg is the gas density, g/cm3; βgi is the gas binary diffusion coefficient, m2/s; Dd is the droplet diffusion coefficient, m2/s; Sh* is the modified Sherwood number; BYi is the mass transfer number; Yis is the mass fraction of liquid particle surface; and Yi∞ is the mass fraction of liquid particle far-field conditions.
The mass transfer rate can be calculated according to the energy balance in the thermal boundary layer and the subsequent integration. It can be predicted by the following equation:
m ˙ = i = 1 N π k g c p , F D d N u * ln 1 + B T
where BT is the heat transfer number; Nu* is the modified Nusselt number; kg is the gas reaction rate; and cp,F is the specific heat of liquid droplet.
The modified Sh * and Nu * can be predicted by the following equations:
S h * = 2 + S h 0 2 F M = 2 + 0.552 Re 1 / 2 S c 1 / 3 F M
N u * = 2 + N u 0 2 F T = 2 + 0.552 Re 1 / 2 Pr 1 / 3 F T
where Re is the Reynolds number; Sc is the Schmidt number; FM and FT are also the corresponding correction factors; and Pr is the Prandt number.
The drag force Fidr is calculated by the following equations:
F i d r = D p · u i r e l
D p = 1 2 ρ g A d C D u r e l
where Dp is the drag function; CD is the drag coefficient; urel is the relative velocity vector, m/s; ρg is the fuel density, kg/m3; and Ad is the cross-sectional area of the liquid particle, m3.
The drag coefficient can be expressed as follows:
C D = 24 R e d C p 1 + 0.15 R e d 0.687 , R e d < 10 3 0.44 / C p , R e d 10 3
where Cp is the Cunningham correction factor based on Knudsen number.
The liquid particle Reynolds Number is shown in the following equation:
Re d = ρ g u r e l D d μ g
where ug is the domain fluid viscosity, Pa·s.

2.1.5. Heat and Mass Transfer Model

Under the assumption that the droplet temperature is uniform, the rate of change of the droplet temperature is determined by the energy balance equation, which indicates that the energy conducted to the droplet either heats the droplet or provides heat for evaporation [33]. It can be calculated by the following equations:
m d c p d d T d d t = L d m d d t + Q ˙
Q ˙ = α A s ( T T s )
where md is the particle mass, kg; cpd is specific heat of liquid droplet, J/(Kg K); Q ˙ is the convective heat flux from the gas supply to the droplet surface, W; α is the heat transfer coefficient, W/(m2 K); As is the particle surface area, m2; and L is the latent heat of evaporation, J/kg.
It is an assumption that the surface condition of the droplet is uniform. In addition, the local surface heat flux q ˙ s and steam mass flux f ˙ v s are introduced, and the mass flux governing equation can be written as:
d m d d t = Q ˙ f ˙ v s q ˙ s
The droplet energy equation can be expressed as:
m d c p d d T d d t = Q ˙ ( 1 + L f ˙ v s q ˙ s )
where f ˙ v s is the spray vapor mass flux at the particle surface, kg/(m2s); q ˙ s is the heat flux at particle surface, W/m2.

2.1.6. Three-Dimensional CFD Simulation Model

According to the actual shape of the diesel engine, the ESE Diesel module in AVL-Fire was used as a platform to establish a three-dimensional model. The fuel nozzle of the engine has six identical nozzle holes. In order to simplify the calculation model and reduce the calculation time, one-sixth of the entire combustion chamber was taken as the calculation domain due to the symmetry of the combustion chamber. The 3-D CFD simulation model of cylinder is shown in Figure 1. In addition, the main parameters of diesel engine are shown in Table 1.

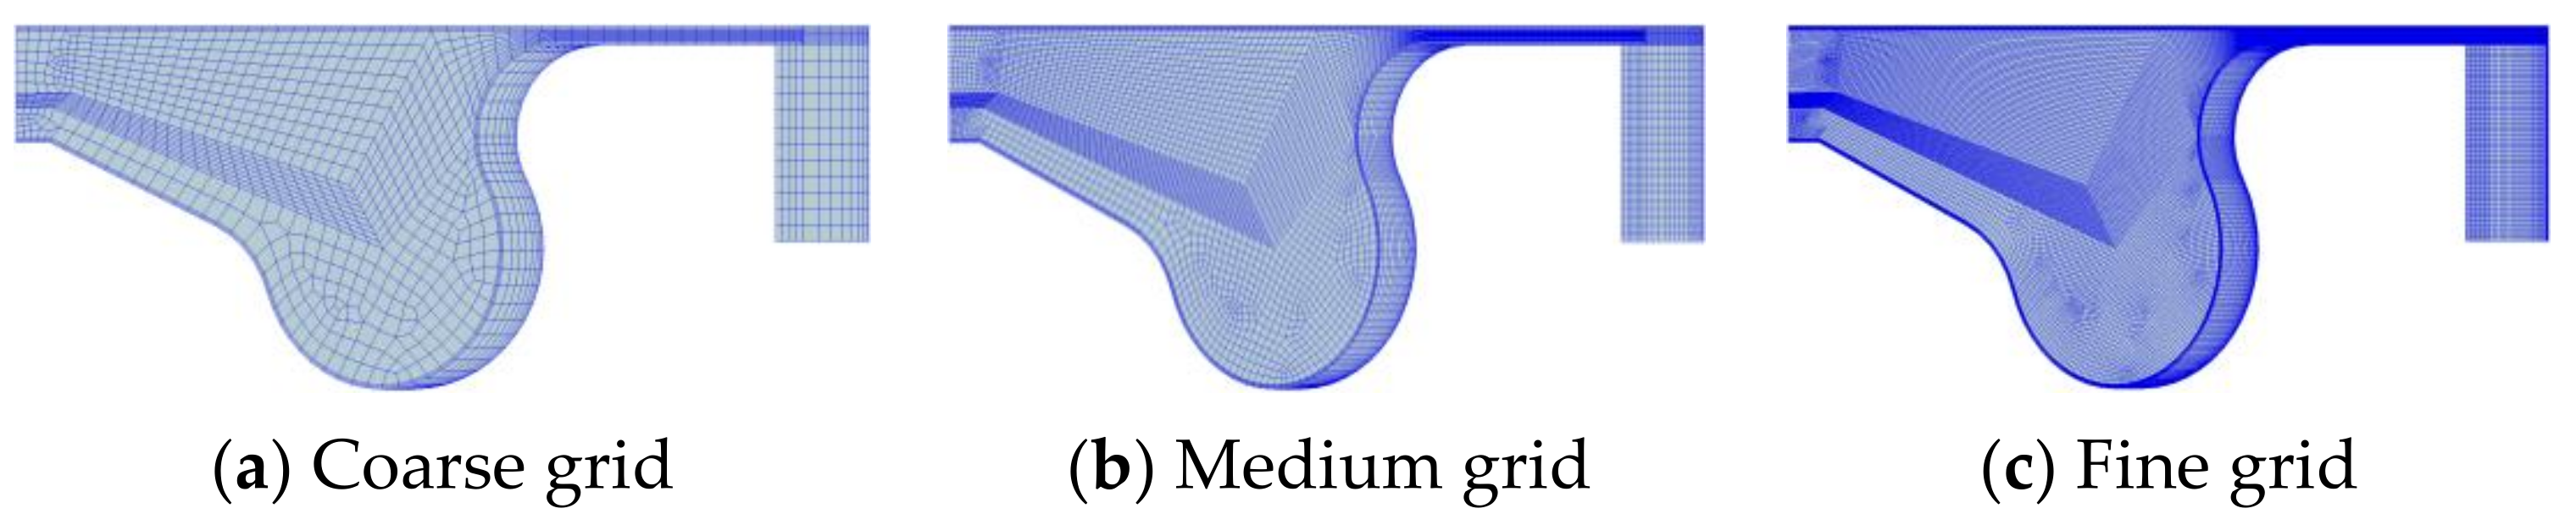
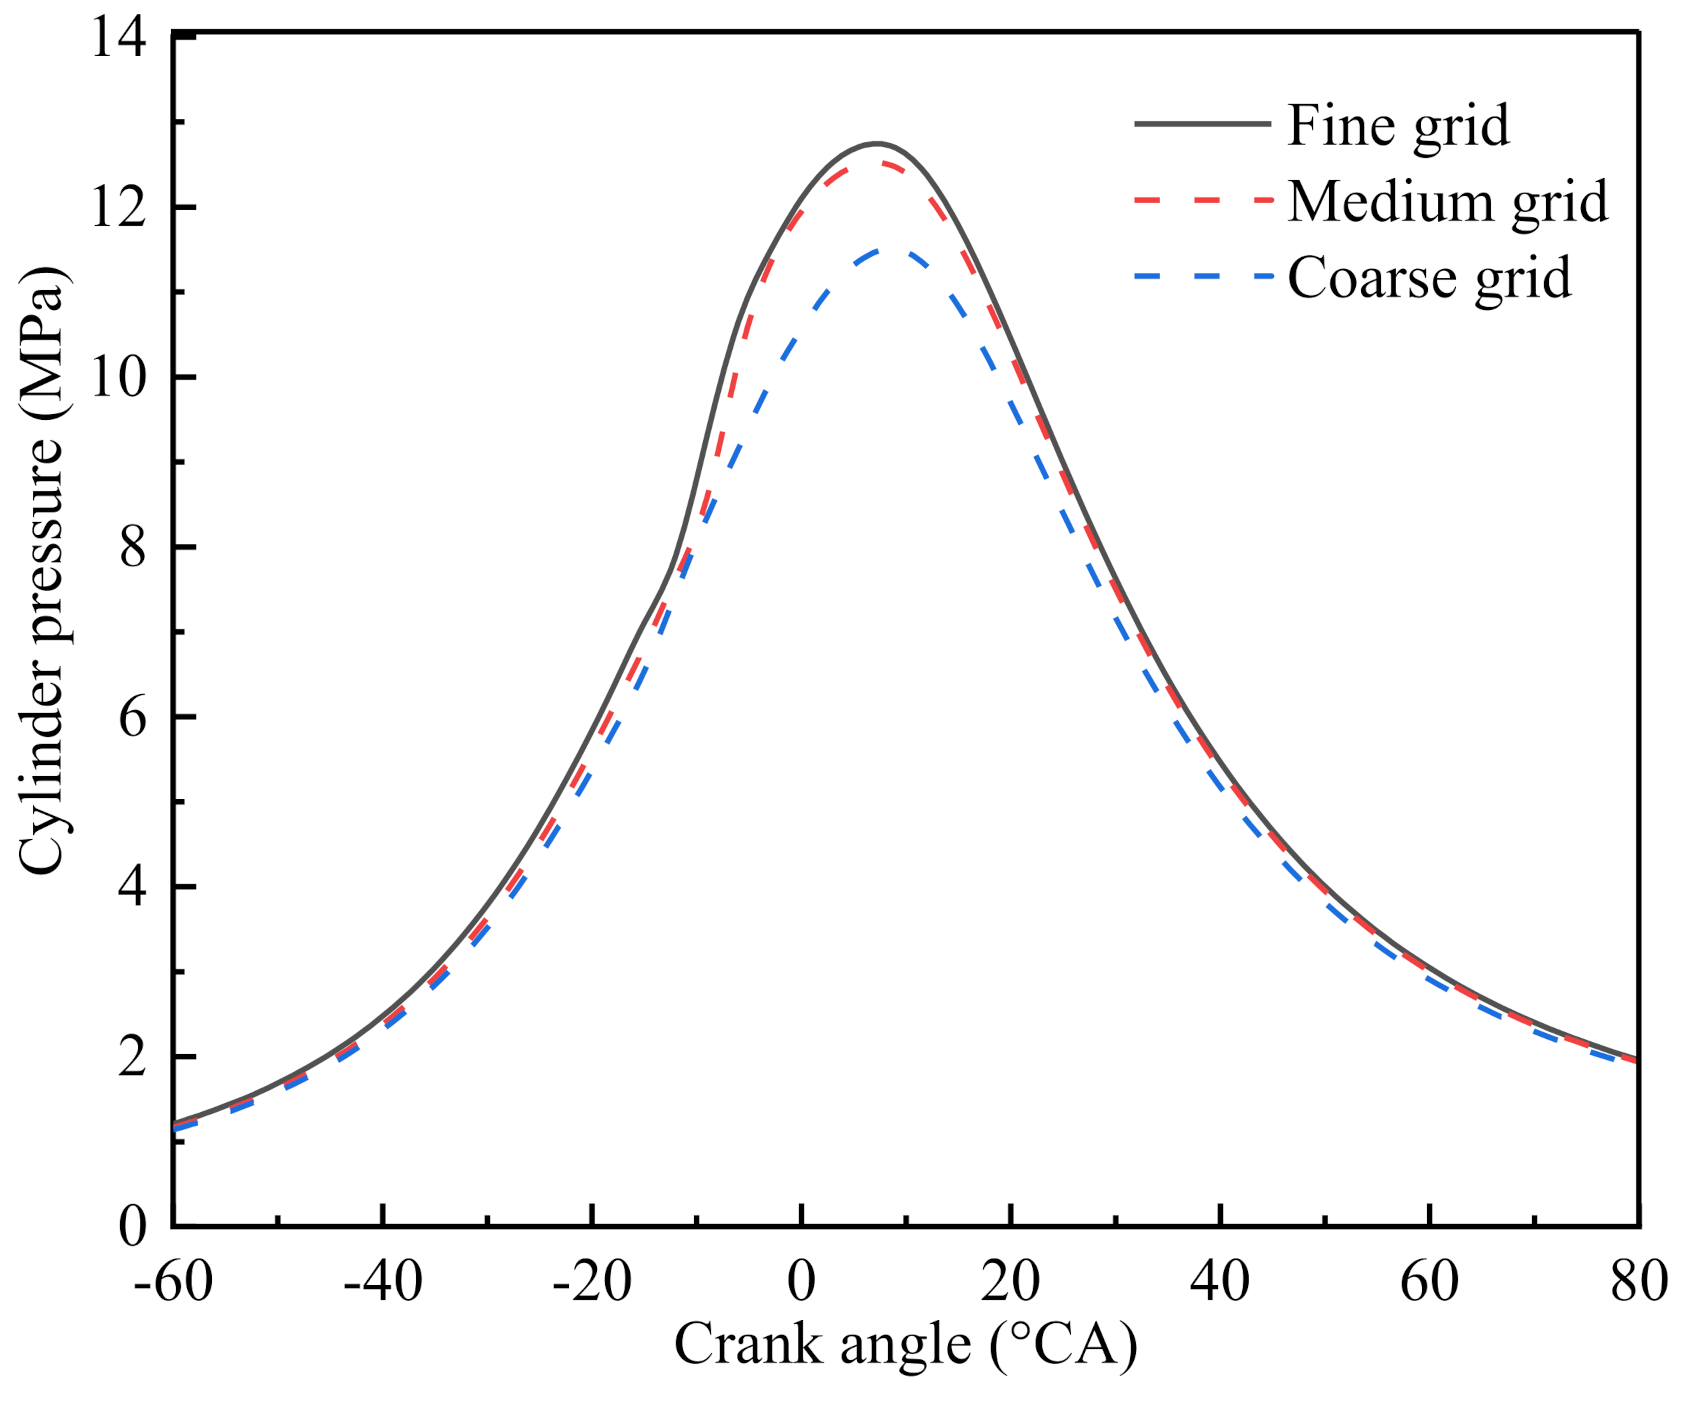
2.2. Computational Mesh

The dynamic grids are produced based on the bowl geometry of a four-cylinder four-stroke diesel engine by taking advantage of the symmetric distribution of six nozzle holes. The 60° sector dynamic meshes were considered for one injector nozzle hole and are shown in Figure 2. Figure 2 shows three types of grids: coarse grid, medium grid, and fine grid in this paper. When the piston is at the top dead center, the numbers of the three grid units are 23,834; 190,672; and 1,525,376, respectively. All grids have very fine grids near the fuel injection path, injector nozzle, and piston gap area to ensure that the model can accurately predict the breaking and evaporation of droplets. Figure 3 shows the cylinder pressure generated by the three grids. There is no obvious difference in cylinder pressure between the fine grid and the medium grid, and the calculation result is not affected by the grid. Since the medium grid can not only ensure the accuracy but also save the calculation time, so the medium grid is selected for the research in this paper.

2.3. Feasibility Test

In this paper, the diesel engine model was employed to investigate the effects of different ethanol mixture ratios on engine performance and emission characteristics of diesel engine. Figure 4 shows a schematic diagram of diesel engine test equipment. The Horiba MEXA-1600 was used to measure the generated NOx with an error of 1%. The AVL Dismoke-4000 was used to measure the soot produced. The FCMM-2 was used to measure BFSC. The DEWE-2010CA was used to monitor the combustion of diesel engine. The EFS-IFR600 was used to measure fuel injection rate with a measurement error of 0.5%. Hydraulic dynamometer was used to measure diesel engine load. In addition, an Electronic Control Unit control system was employed for controlling the electronically-controlled diesel engine. Besides, temperature, flow, and pressure were measured by suitable sensors. The measurement range of each instrument and its allowable error range are shown in Table 2.

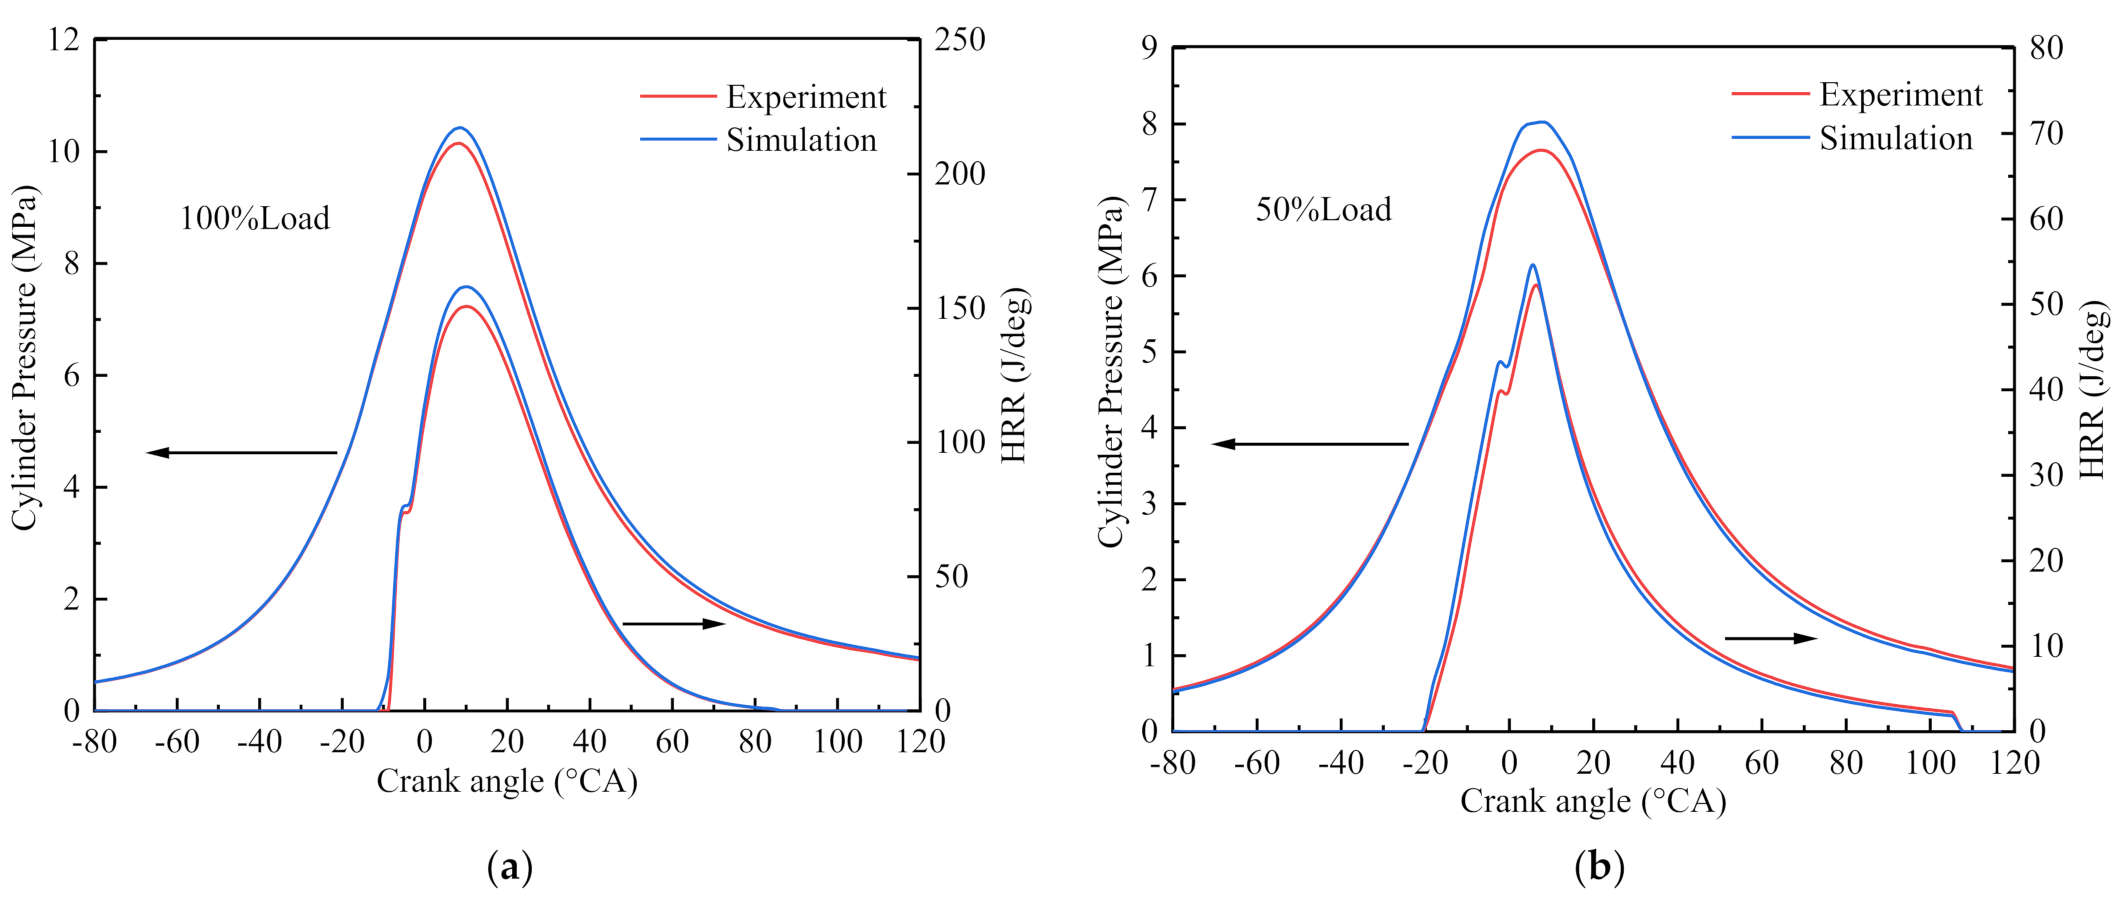
2.4. Model Validation

In order to verify the accuracy of the model, the simulation results are compared with the experimental results. At the speed of 1000 rpm, the experiments were carried out by a four-strokes diesel engine fueled with diesel–ethanol blended fuel (20% ethanol addition blends with 80% diesel by volume) under 100% and 50% loads. The comparisons of experimental and simulated results are shown in Figure 5. The result shows that there is a small error between the simulated value and the experimental value, which are in good agreement with one other. Therefore, the established model can accurately predict the engine performance and combustion characteristic.

3. Results and Discussion

The simulation experiment was carried out at the speed of 1000–4000 rpm. The influences of different fuel ratios on engine performance and emission characteristics were studied in terms of brake power, brake-specific fuel consumption (BSFC), brake thermal efficiency (BTE), cylinder temperature, NOx emission, CO emission, soot emission, HC emission, and so on.
In this section, the influence of diesel–ethanol blended fuel on engine performance characteristics was studied. The chemical and physical characteristics of diesel and ethanol are shown in Table 3. In the paper, DE10 is the 10% ethanol addition blends with 90% diesel by volume, DE20 is the 20% ethanol addition blends with 80% diesel by volume, and DE30 is the 30% ethanol addition blends with 70% diesel by volume.

3.1. Engine Performance Characteristic

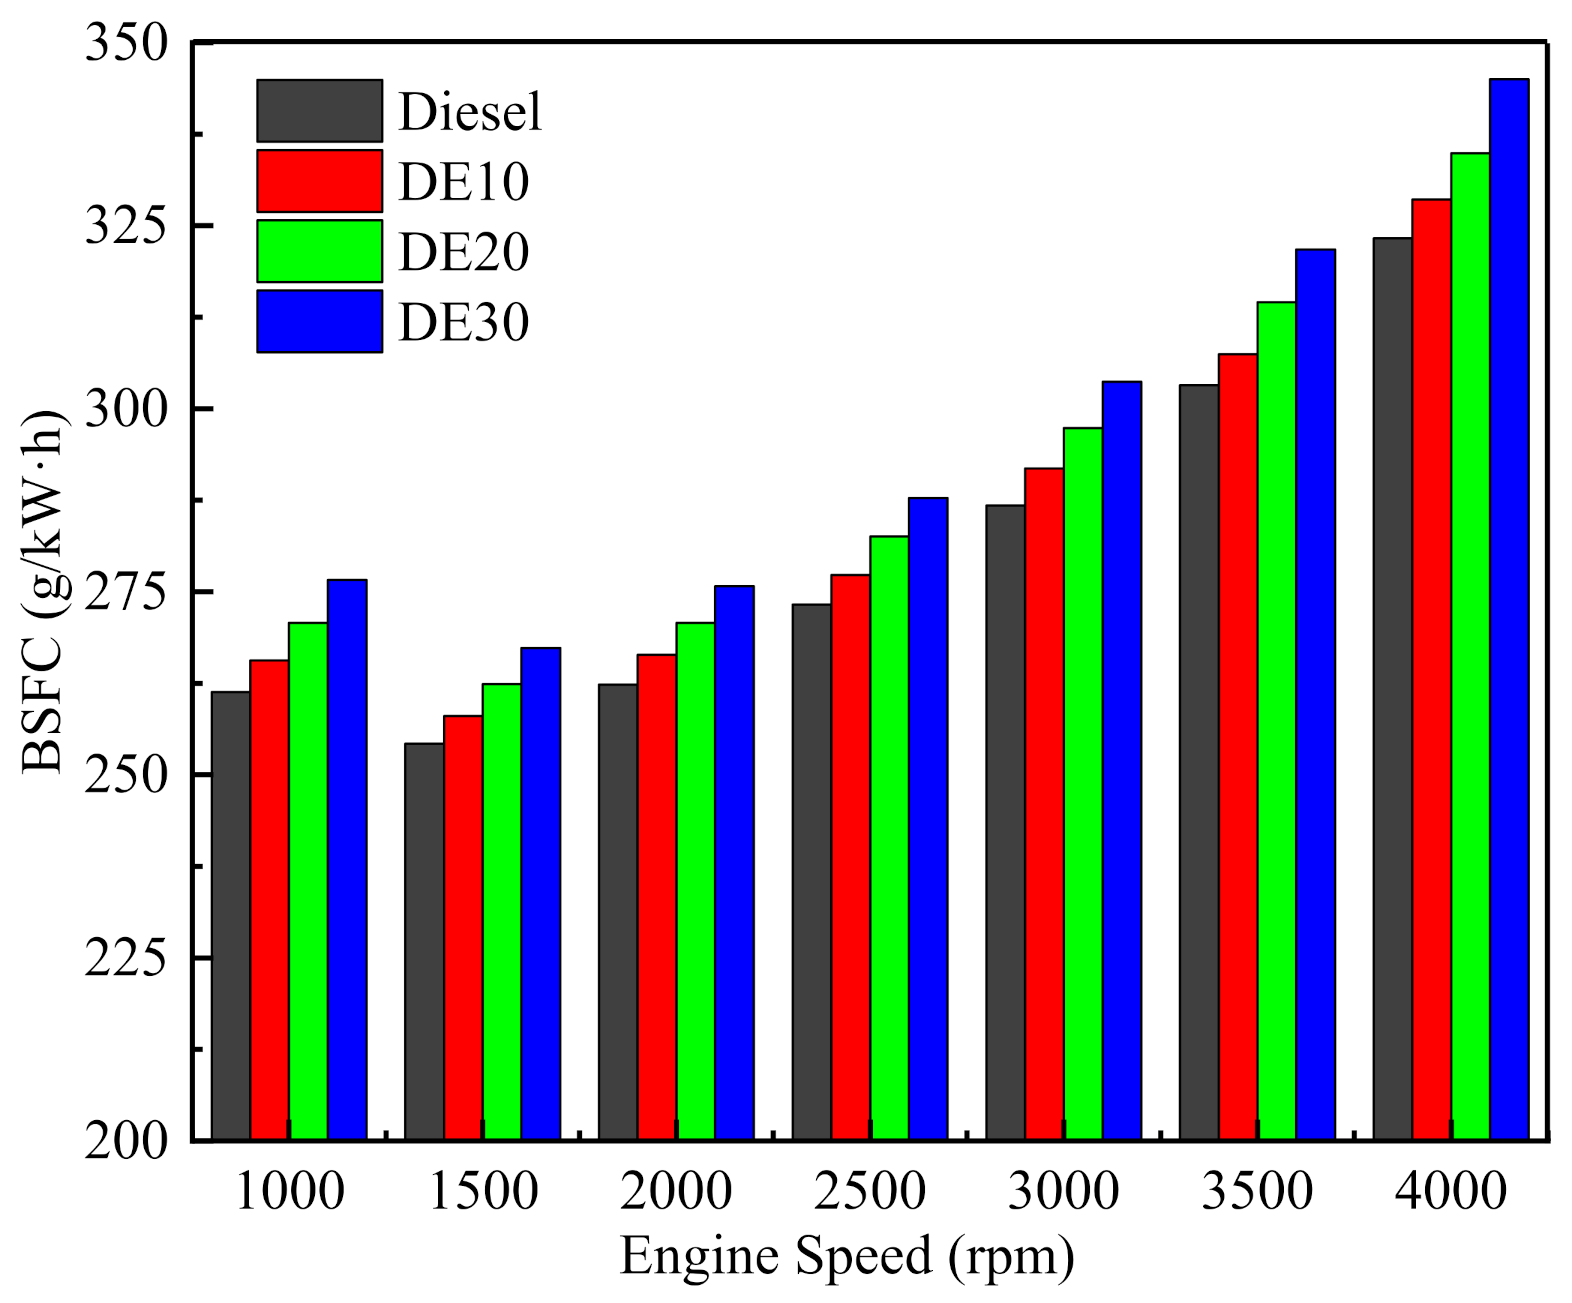
3.1.1. Brake Specific Fuel Consumption

The brake-specific fuel consumption (BSFC) is an important parameter to evaluate the performance characteristics of diesel engine [34], which reflects the actual power generation value of diesel in a certain period.
In this study, Figure 6 shows the comparisons of BSFC at different engine speeds with different ethanol ratios. It can be found that the BSFC firstly decreases and then increases with the increase of engine speed when the engine fuels with DE10, DE20, and DE30, respectively. For example, when the diesel engine fuels with diesel, the BSFC of the engine decreases from 261.283 g/(kW·h) to 254.139 g/(kW·h) and then gradually increases to 320.857 g/(kW·h) in the range of 1000–4000 rpm. The BSFC is the lowest at the speed of 1500 rpm. However, with the increase of speed, the combustion in the cylinder deteriorates due to insufficient oxygen, resulting in higher BSFC. In addition, it is obvious that the BSFC of the engine fueled with diesel–ethanol blends increases. The maximum increase of BSFC reaches 6.726%. It is due to the fact that the calorific value of ethanol (26.8 MJ·kg−1) is much lower than that of diesel (42.6 MJ·kg−1). When the proportion of ethanol in the fuel increases, the overall calorific value of the fuel will decrease, resulting in higher fuel consumption under the same working conditions. Moreover, compared with diesel, the maximum increase ratio of DE30 decreases from 6.7% to 5.4% when the engine speed changes from 1500 rpm to 4000 rpm. It may be due to the improved combustion by the ethanol in the diesel–ethanol blends, especially at high speed.

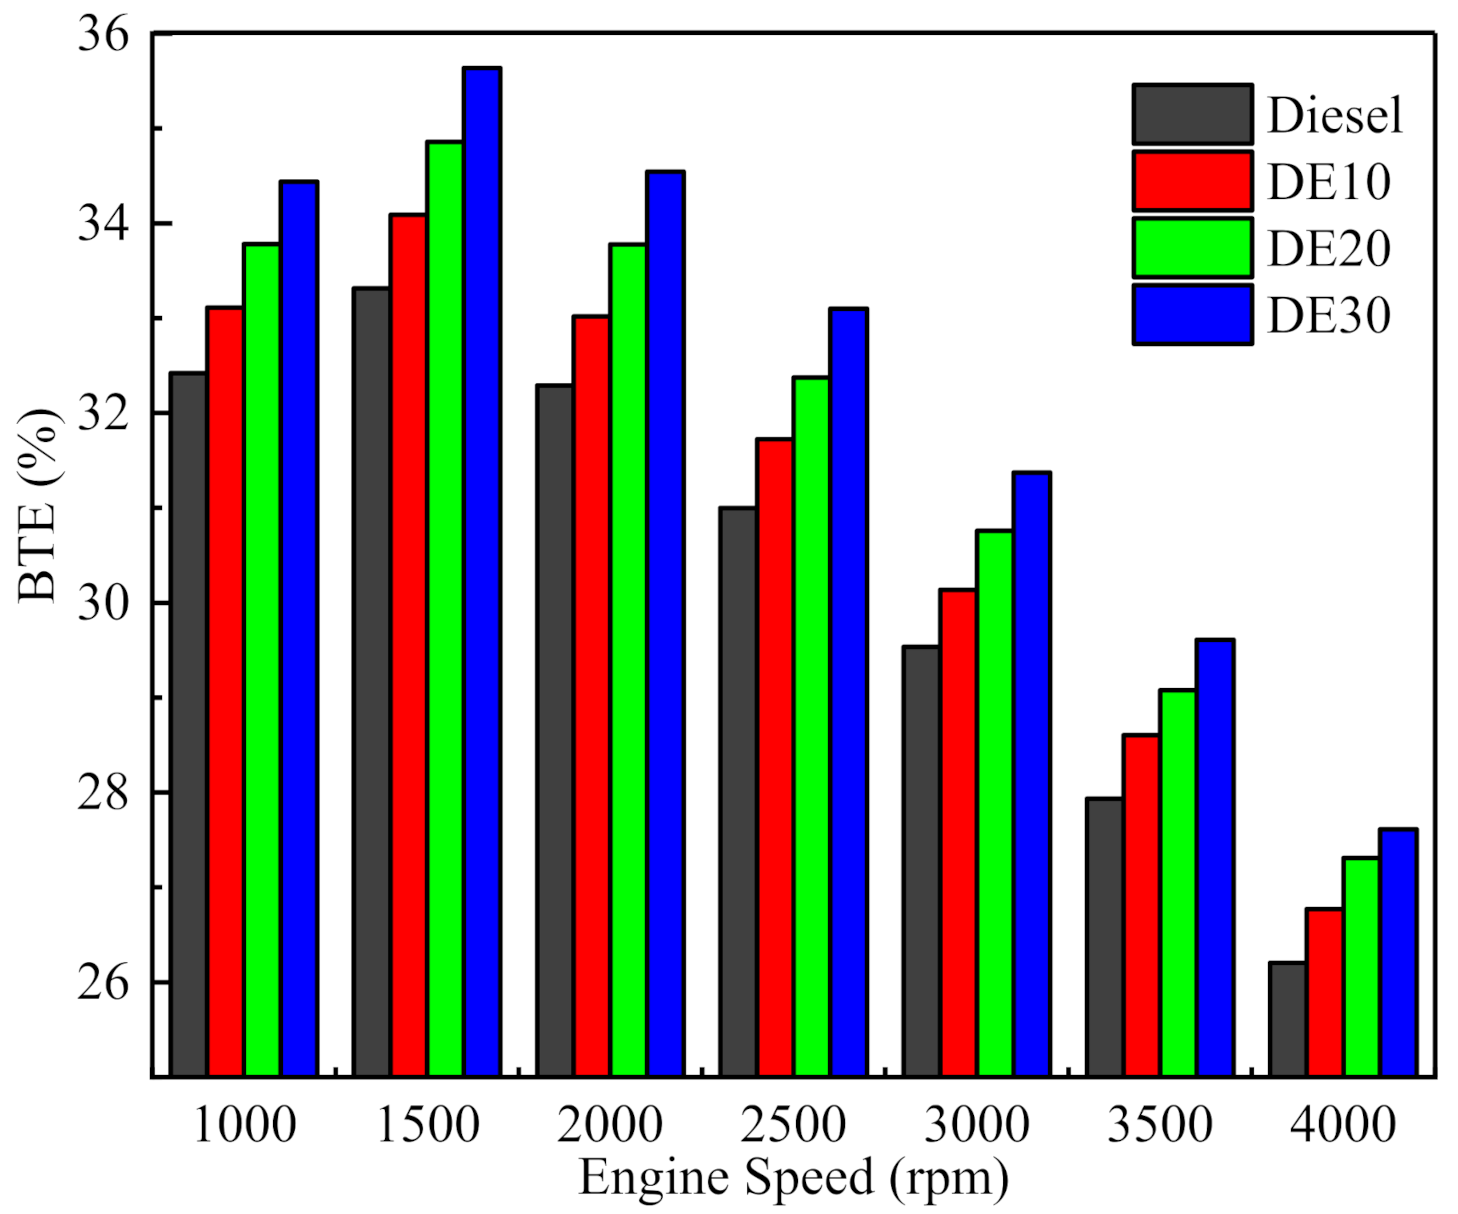
3.1.2. Brake Thermal Efficiency
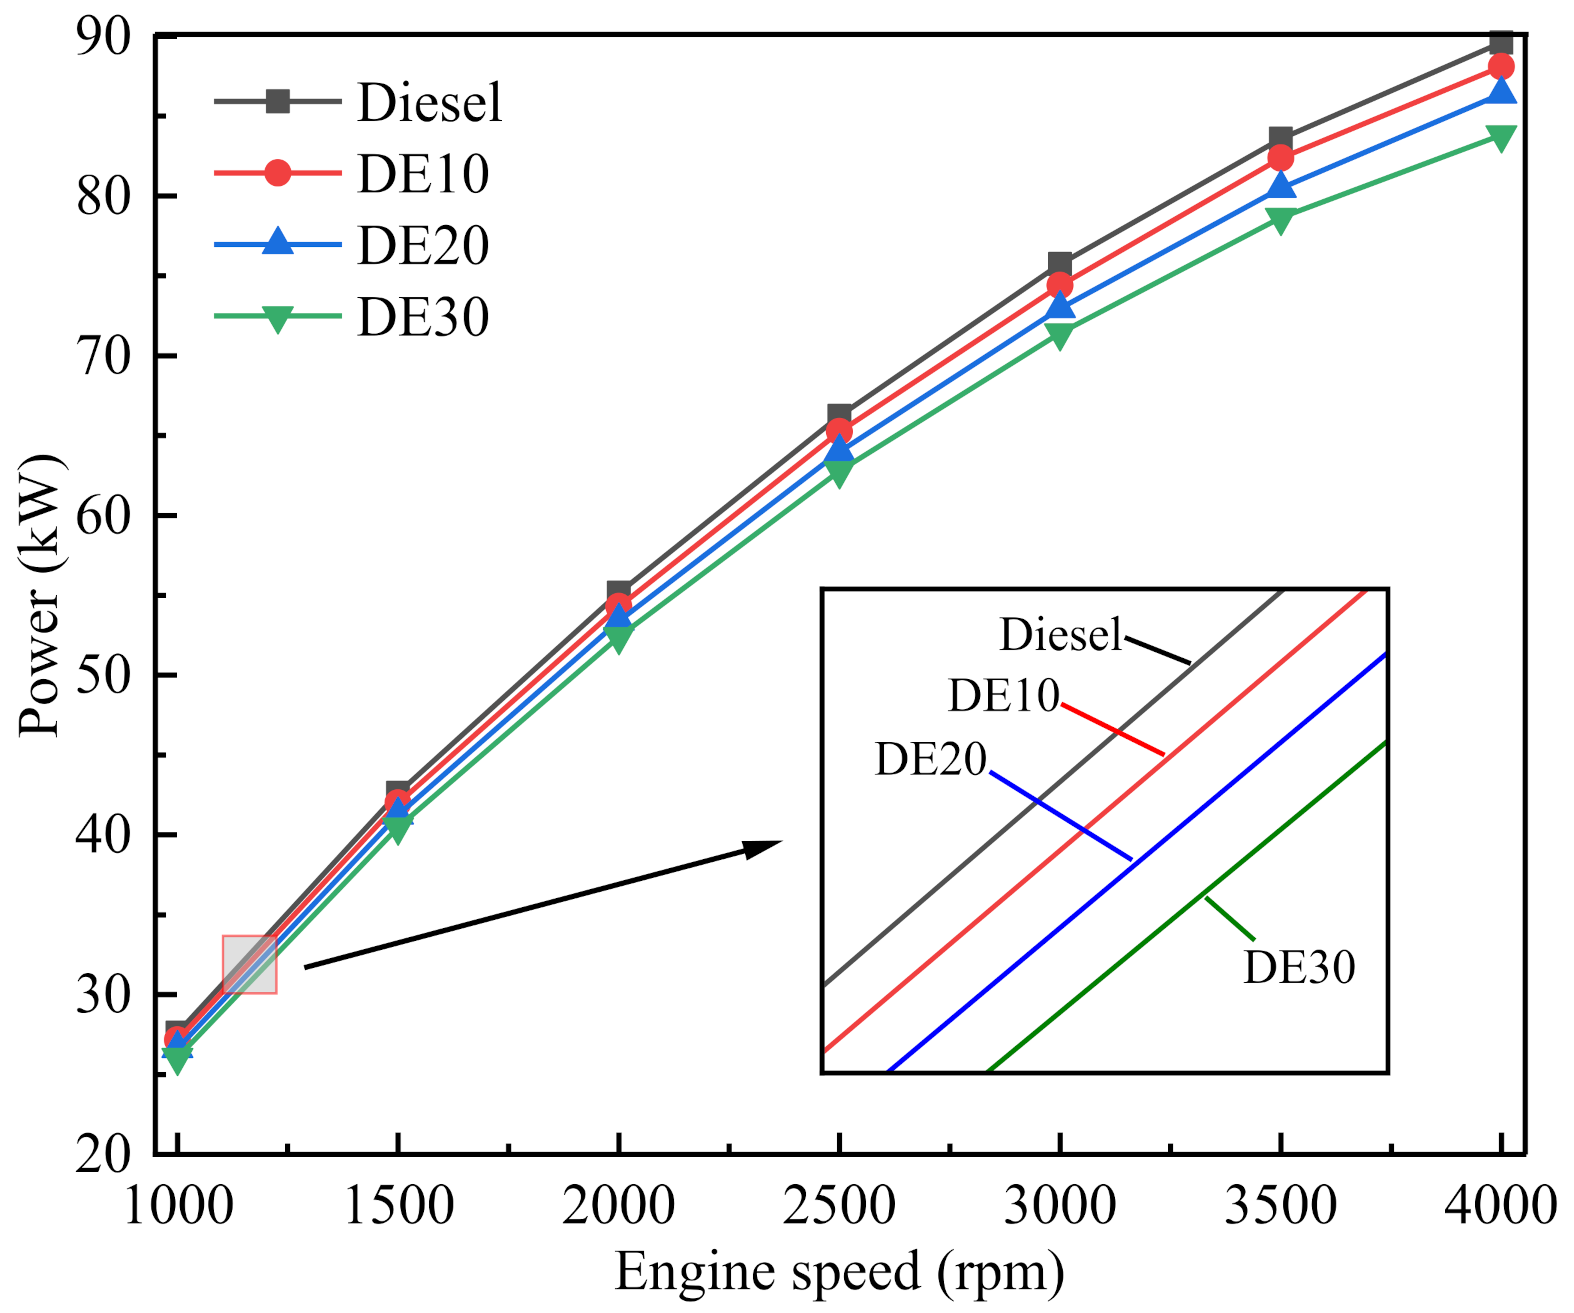
The Brake thermal efficiency is the ratio of the energy generated when the fuel is burned in the engine converted into useful work. The BTE can be calculated by the following equation:
B T E = 3600 B S F C · L C V
where LCV is the fuel lower calorific value, MJ·kg−1.
The change trend of BTE with engine speed is shown in Figure 7. It can be seen that the BTE of the engine firstly increases and then decreases with the increase of the engine speed, and reaches a maximum value at 1500 rpm. It can be seen that the BTE and BSFC of the engine are inversely proportional when the calorific value of the fuel is constant. In addition, it can be seen that the engine BTE increases with the increase of the ethanol content in the blended fuel. This is due to the fact that the energy utilization rate of the blended fuel is improved when ethanol is added to diesel. For example, compared with diesel, the highest BTE of DE30 reaches 35.64% at the engine speed of 1500 rpm. The oxygen content in the blended fuel can effectively improve the combustion, especially in the spray core and the surrounding high-concentration fuel area. Besides, the presence of ethanol improves the atomization level of the blended fuel, which can make the fuel and air mix better and burn more fully, thereby increasing the BTE of the engine.

3.1.3. Brake Power

The effects of diesel–ethanol on power under different conditions are shown in Figure 8. It can be seen that the brake power increases with the increase of engine speed. This is due to the increase of fuel atomization and intake flow at high engine speed. In addition, the brake power of the engine decreases with the increase of ethanol content in the blended fuel. Compared with diesel, the engine power of DE30 decreases by 6.44% at the engine speed of 4000 rpm. This is due to the fact that the calorific value of ethanol is lower than that of diesel.

3.1.4. Cylinder Pressure

The effects of diesel–ethanol on cylinder pressure under different conditions are shown in Figure 9. It can be seen that the cylinder pressure fluctuates with the proportion of ethanol in the fuel. The cylinder pressure of pure diesel is the highest, followed by DE10, DE20, and DE30. The cylinder pressure gradually decreases with the increase of ethanol content in the fuel. For example, the cylinder pressure of DM30 decreases about 2.05% compared with diesel. It is due to the lower calorific value of ethanol. Therefore, the cylinder pressure decreases with the increase of ethanol content in the blended fuel (see Figure 9a–d). More specifically, the more ethanol content in the blended fuel, the lower the fuel heat value. Thus, the cylinder pressure is reduced. In addition, the lower cetane number and high latent heat of vaporization of ethanol increase the ignition delay, thereby increasing the maximum combustion pressure [35]. Therefore, at high speed, the pressure in the cylinder increases with the increase of ethanol content in the fuel mixture.

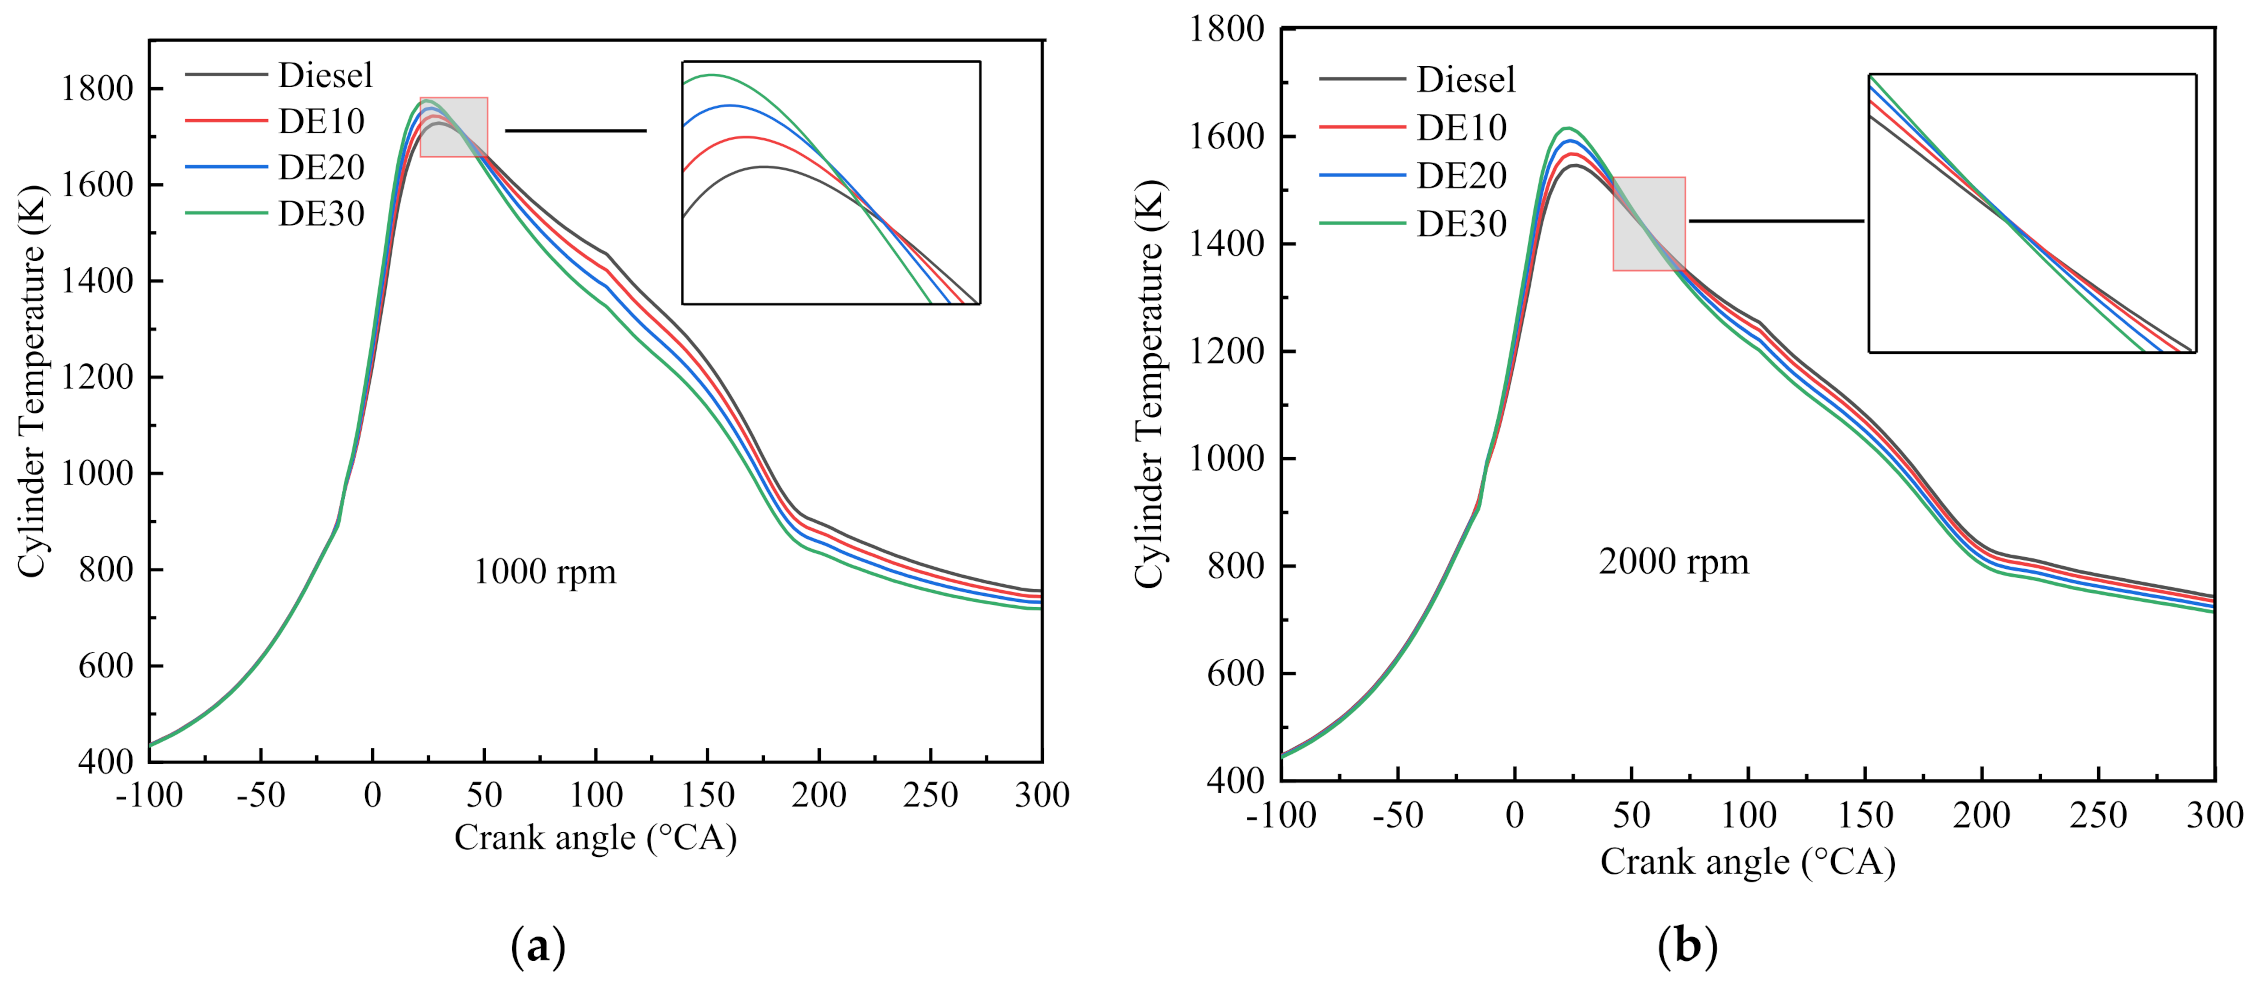
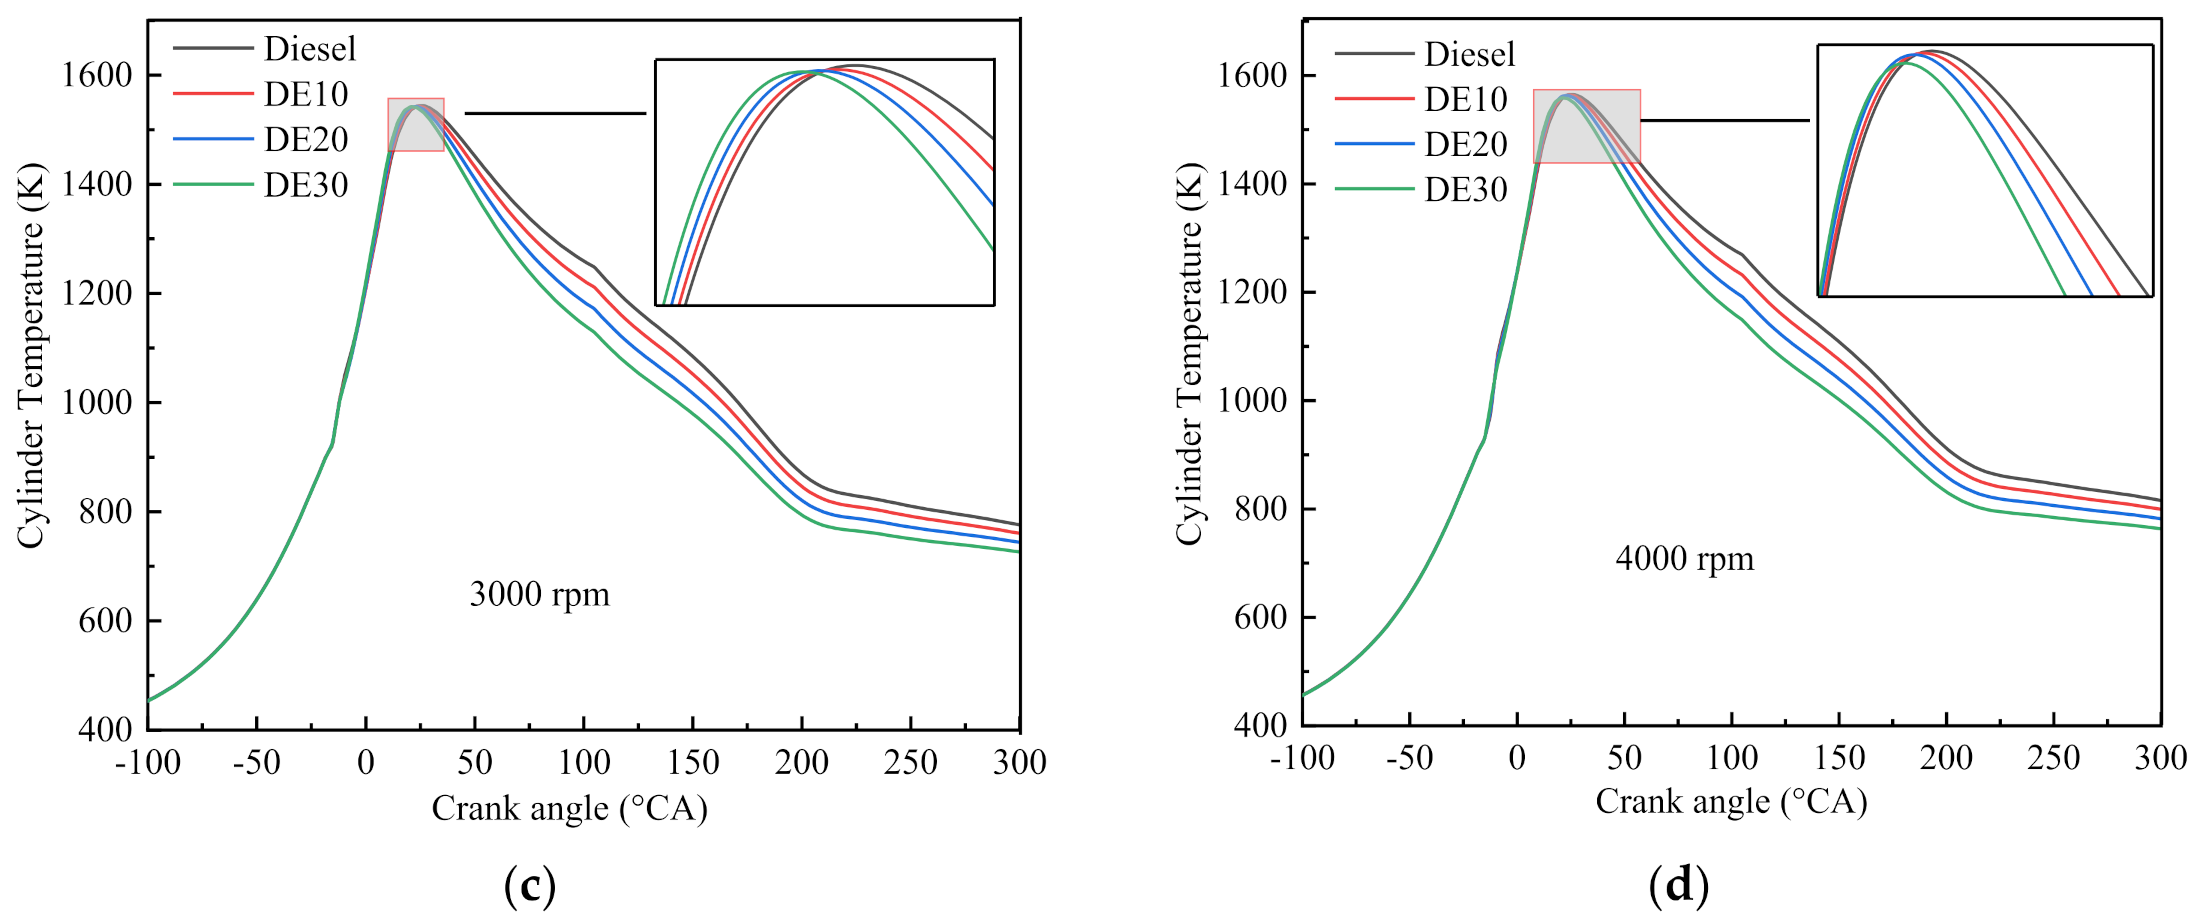
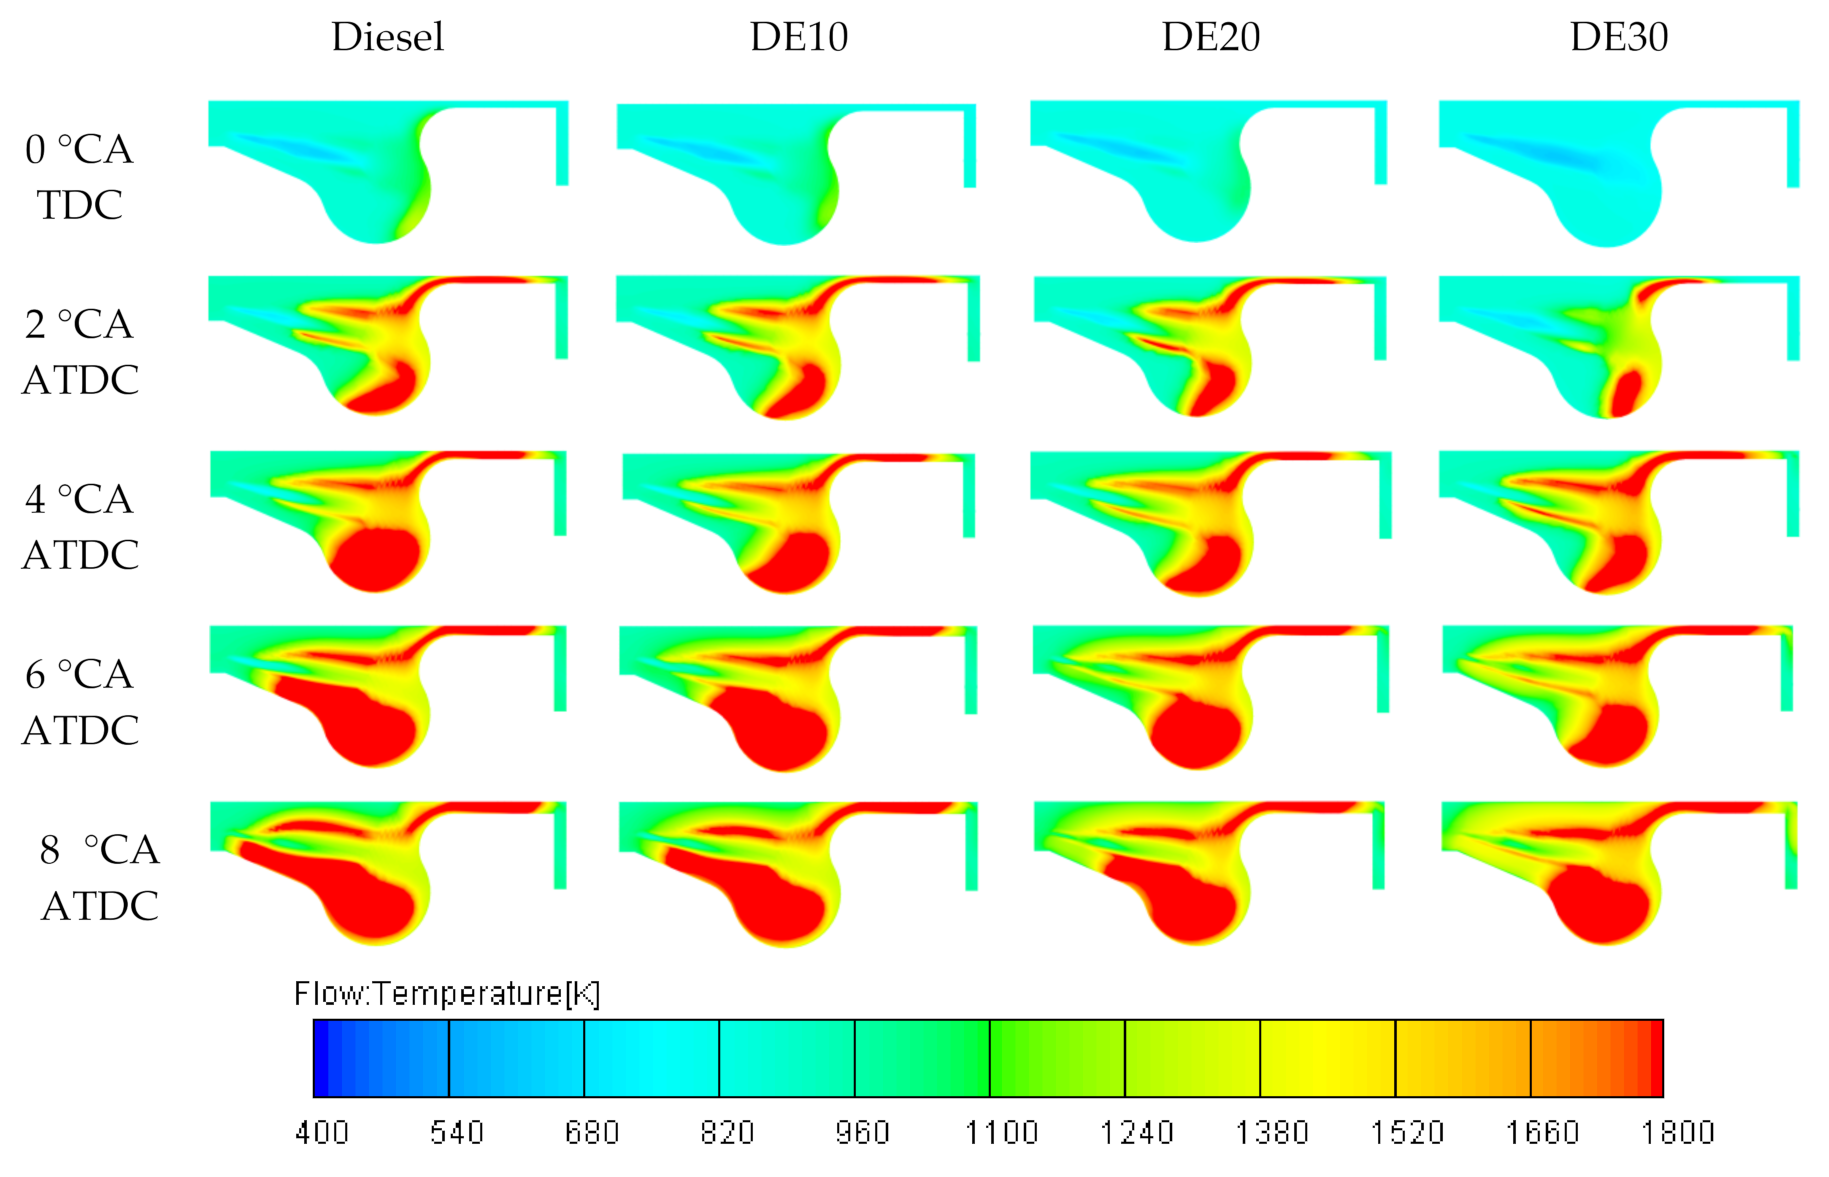
3.1.5. Cylinder Temperature

Figure 10 shows the in-cylinder temperatures of diesel engine fueled with different ratios of diesel–ethanol. It can be found that the ethanol content in the fuel has a certain effect on the cylinder temperature. The highest cylinder temperature increases with the increase of ethanol content in the fuel. More specifically, the highest cylinder temperatures of D30, D20, D10, and diesel are 1614.7, 1591.8, 1567.4, and 1545.8, respectively (see Figure 10a–d). This is due to the improved combustion caused by the ethanol in the diesel–ethanol blend fuel. The high oxygen content of ethanol promotes the combustion of fuel in the cylinder at the early stage of combustion. In addition, the low cetane number of ethanol also leads to the increase of combustion temperature in premixed mode. However, the cylinder temperature of diesel is the highest in the late combustion phase, followed by DE10, DE20, and DE30. This is due to the fact that the calorific value of ethanol is lower than that of diesel.
Figure 11 shows the temperature distribution field in the cylinder at the engine speed of 3000 rpm. It can be seen that compared with diesel–ethanol blended fuel, more local high temperature zone is produced by the pure diesel. This is due to the fact that the addition of ethanol reduces the density and surface tension of the fuel, and promotes the atomization of the injected fuel, thereby reducing the local high temperature zone. In addition, the higher latent heat of ethanol reduces the cylinder temperature.

3.2. Engine Emission Characteristic

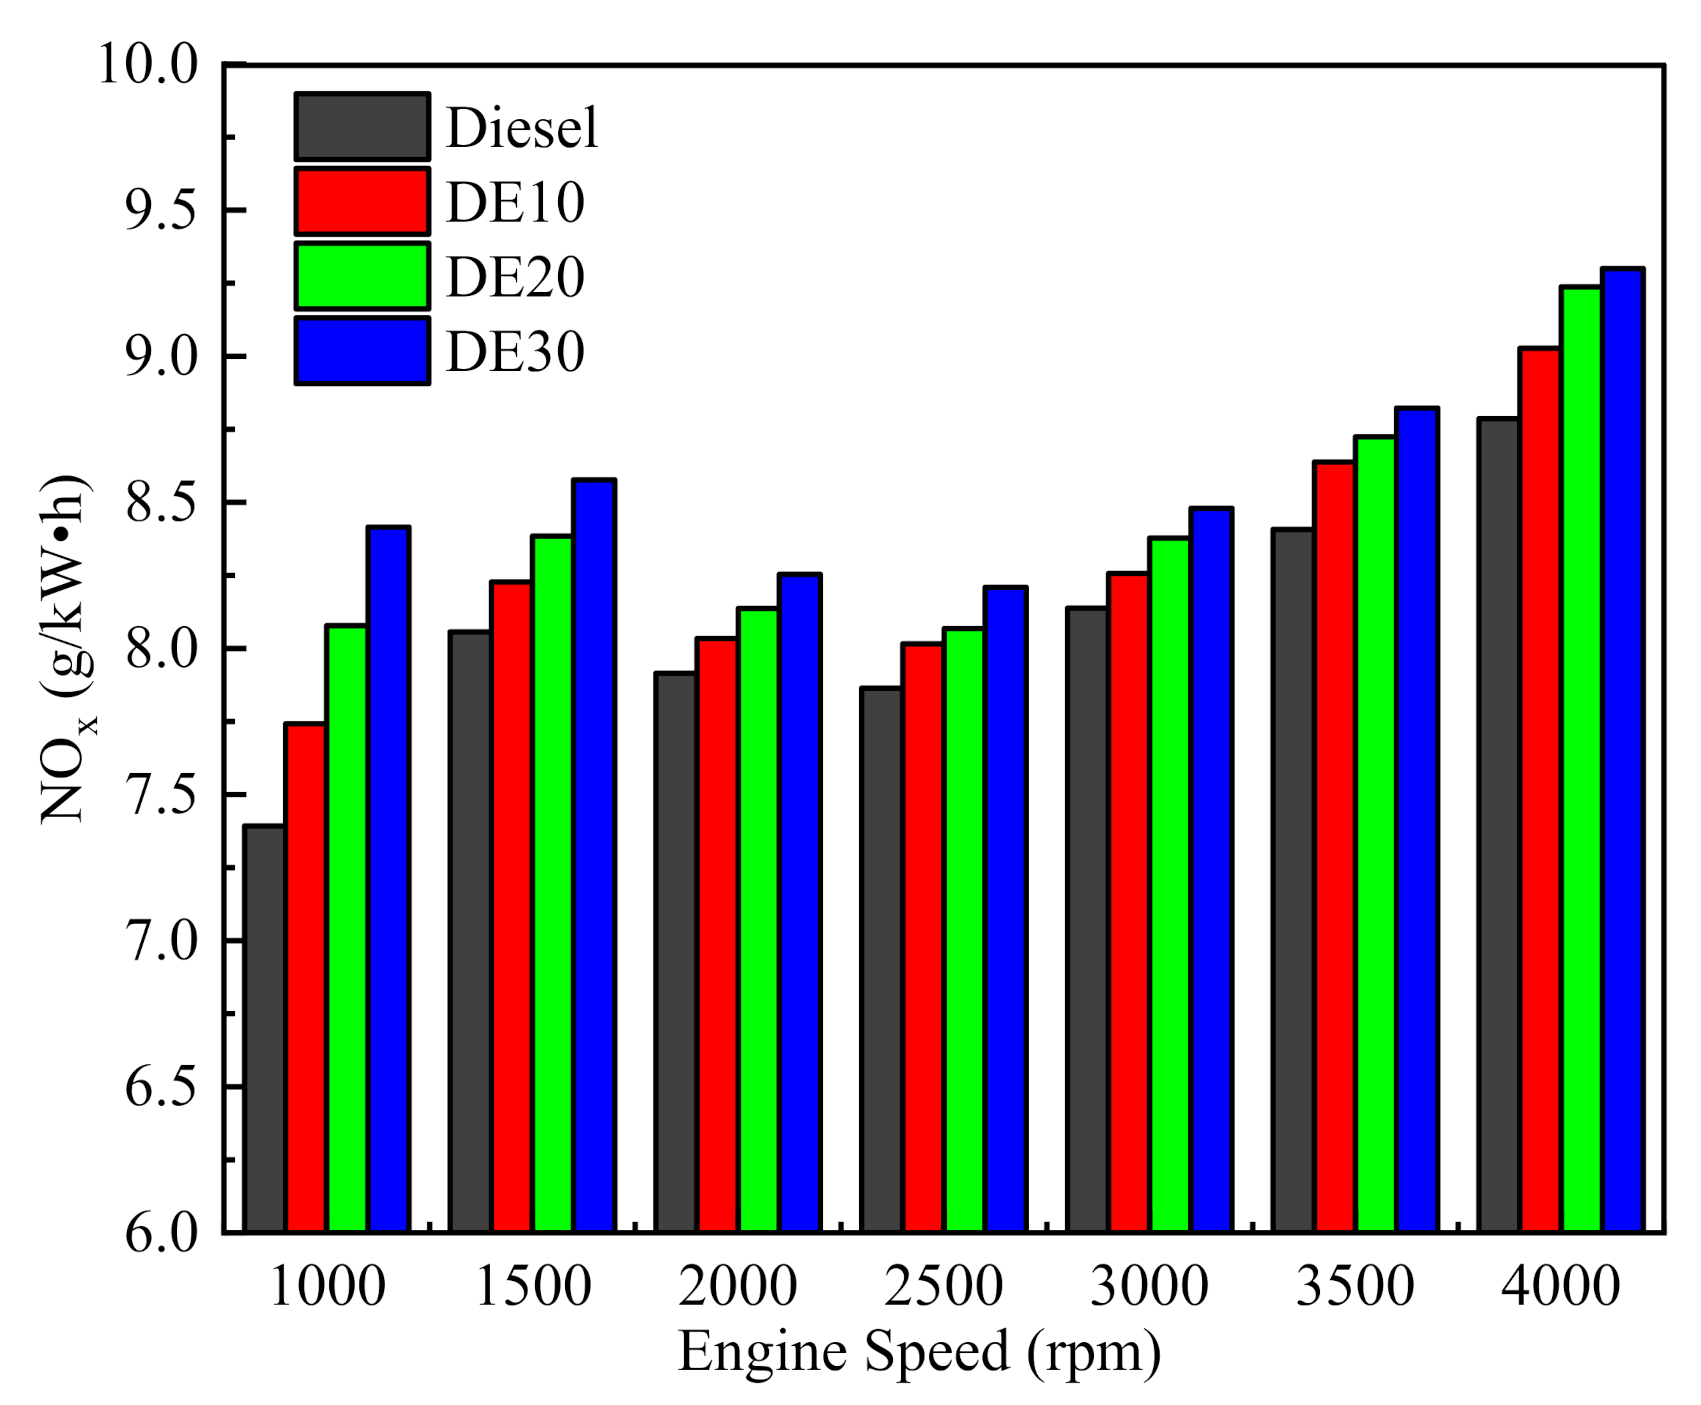
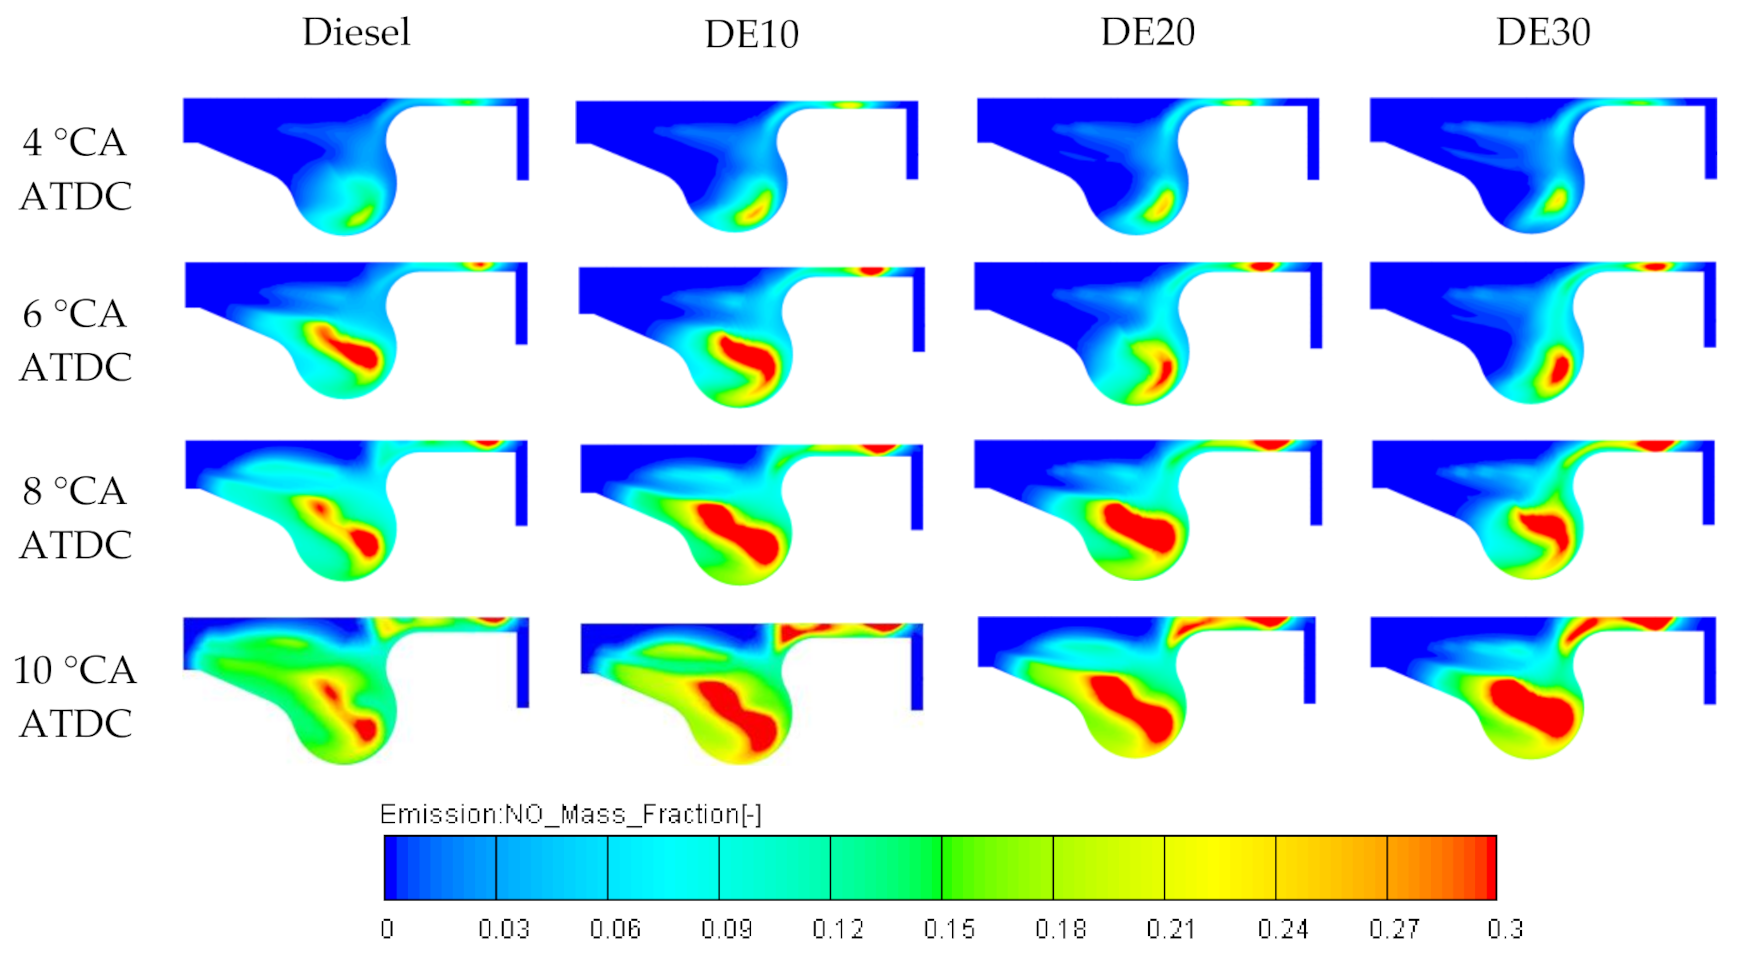
3.2.1. Nitrogen Oxide Emission

The main nitrogen oxide emitted by diesel engine is nitric oxide [36]. The formation of NOx is affected by the cylinder temperature, the combustion time, and the oxygen content. Figure 12 shows the NOx emissions of a diesel engine fueled with different ratios of diesel–ethanol. It can be found that compared with pure diesel, the diesel–ethanol blended fuel increases the NOx emission. This is due to the improved combustion caused by the ethanol and the oxygen content in the blended fuel. Figure 13 shows the NOx distribution field. Similarly, it can be found that more NOx is produced by the diesel–ethanol. Through the comparative analysis of the cylinder temperature field in Figure 11, it can be found that the generation of NOx is affected by the temperature distribution in the cylinder, and there is more NOx generation in the temperature concentration area. Similarly, the result is consistent with the results of Sayin et al. [27] and Alptekin et al. [37]. In addition, due to the low cetane number of the blended fuel, the ignition delay increases, so that the amount of fuel injected into the cylinder increases during the ignition delay period [38,39], the premixed combustion increases, and the NOx emission increases.

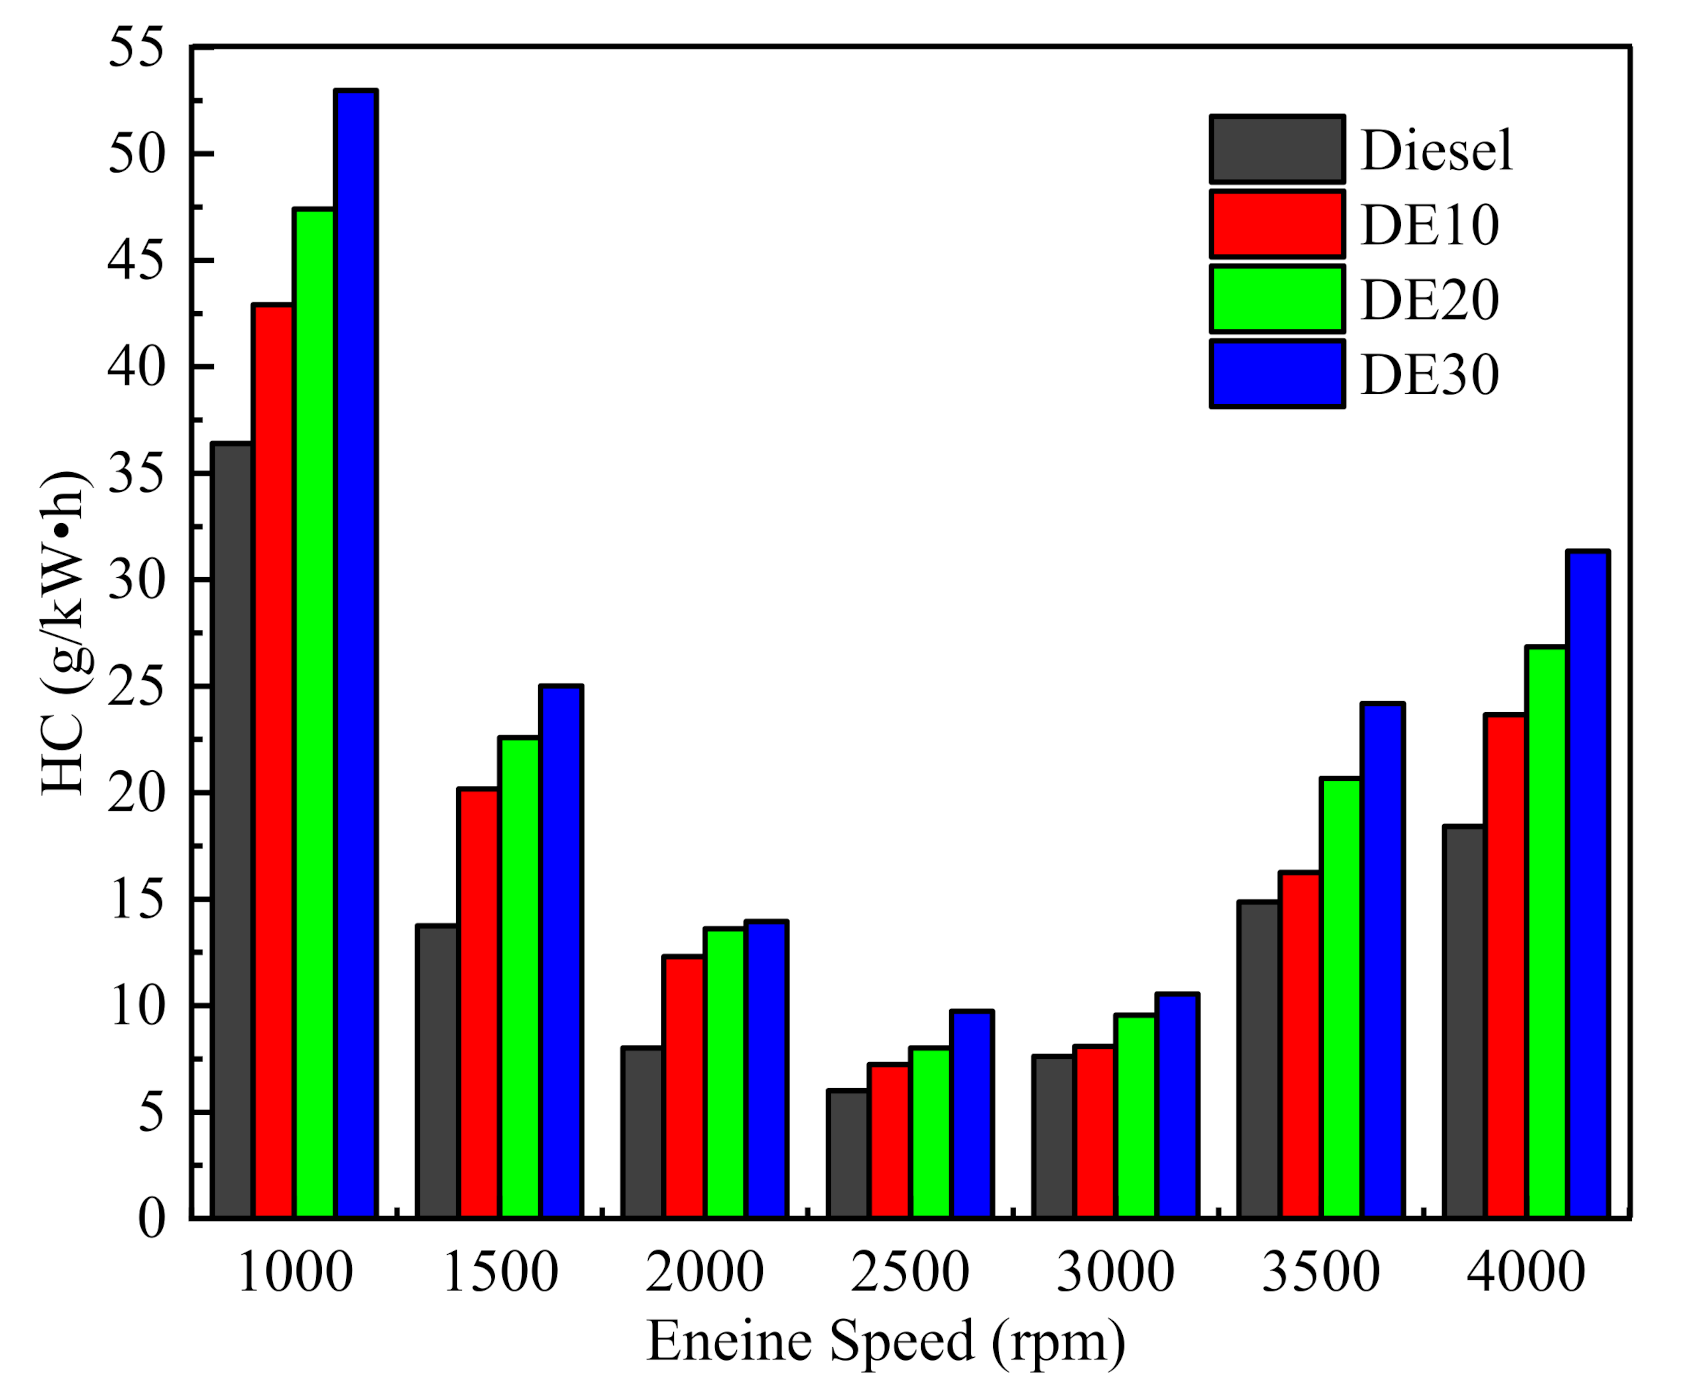
3.2.2. Hydrocarbon Emission

HC is mainly produced due to the incomplete combustion of fuel in the cylinder [40]. Figure 14 shows the HC emission of diesel engine under different conditions. It can be seen that the HC emission of diesel engine firstly decreases and then increases with the increase of engine speed. The cylinder temperature and fuel/air ratio were very low at the low speed. Specifically, the oxidation rate of HC was very low due to the low turbulence intensity and cylinder temperature. Thus, the HC emission increases at low speed. With the increase of engine speed, the temperature in the cylinder increases, more HC is oxidized, and the emission of HC in the exhaust gas is reduced. However, when the engine speed is higher than 3000 rpm, more HC is produced. This is due to the insufficient oxygen when fuel mass increases. The oxygen content in ethanol could improve the combustion, but the effect would be dominated by the impact of the lower calorific value of ethanol. Thus, the HC emission per unite power of diesel–ethanol blended fuel increases. Similarly, Armas et al. [41], Balamurugan et al. [42], and Padala et al. [43] also reached the same conclusion through research.

3.2.3. Carbon Monoxide Emission

Figure 15 shows the variation trends of CO emissions with different ethanol ratios. It can be seen that CO emission firstly decreases and then increases with the increase of engine speed. This is consistent with the findings of others. At the low speed, the low turbulence intensity and cylinder temperature are unfavorable to the oxidation of CO. Thus, the CO emission is high at low speed. With the increase of engine speed, the CO emission is improved. However, when the engine speed is higher than 2500 rpm, more CO is produced. This is due to the insufficient oxygen when fuel mass increases. However, the oxygen content in ethanol could improve the combustion, resulting in the reduction in CO emissions. For example, when the ethanol content in the blended fuel is 10%, the CO emission is the lowest at the speed of 1500 rpm.

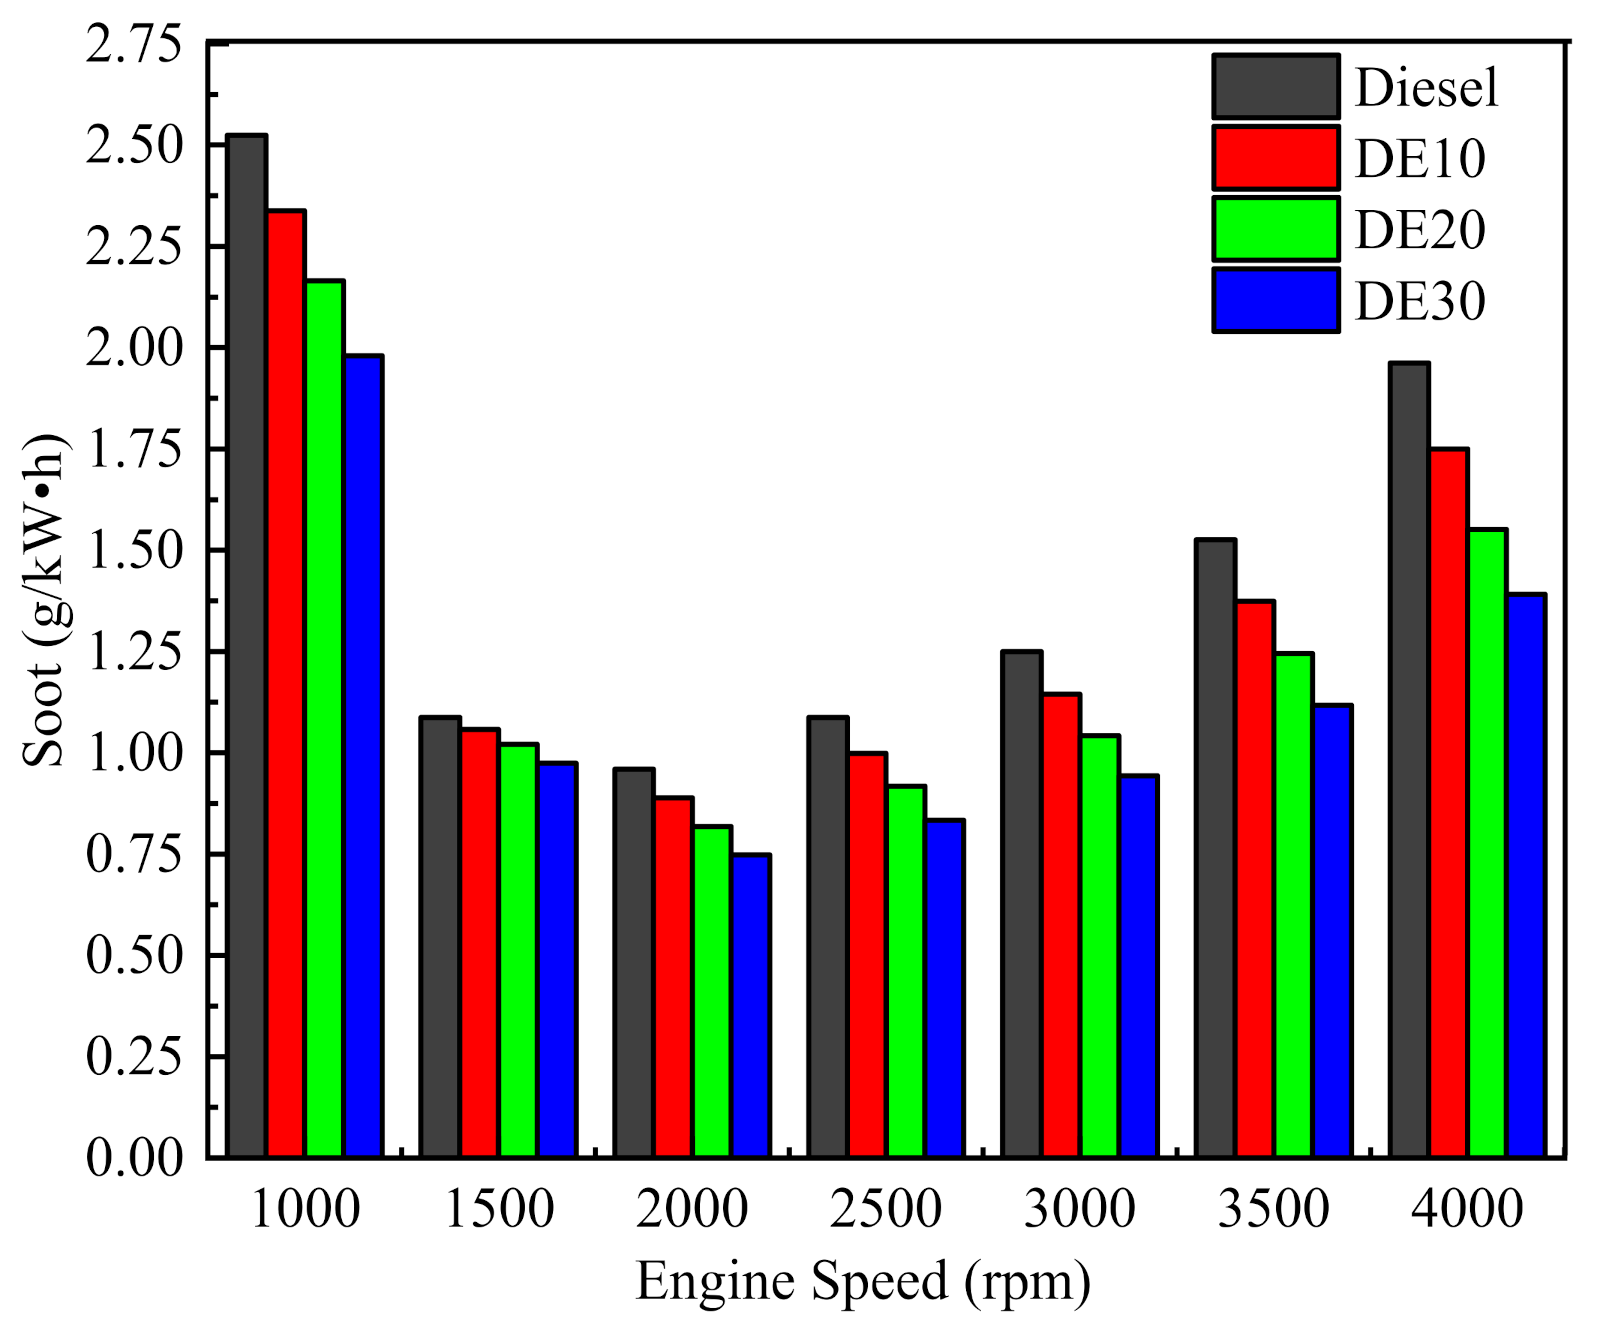
3.2.4. Soot Emission

Figure 16 shows the variation trends of soot generation with different ethanol ratios of blended fuel. It can be seen that the soot emission firstly decreases and then increases with the increase of engine speed. At low speed, the oxidation rate of soot is very low due to the low turbulence intensity and cylinder temperature. Thus, the soot emission is high at low speed. With the increase of engine speed, the temperature in the cylinder increases, more soot is oxidized, and the emission of soot in the exhaust gas is reduced. However, when the engine speed is higher than 2500 rpm, more soot is produced. This is due to the insufficient oxygen when fuel mass increases; lots of soot formed in the high-temperature and poor oxygen region. However, the oxygen content in ethanol could improve the combustion, resulting in the reduction in soot emission. For example, when the ethanol content in the blended fuel is 30%, the soot emission is the lowest at the speed of 2000 rpm.

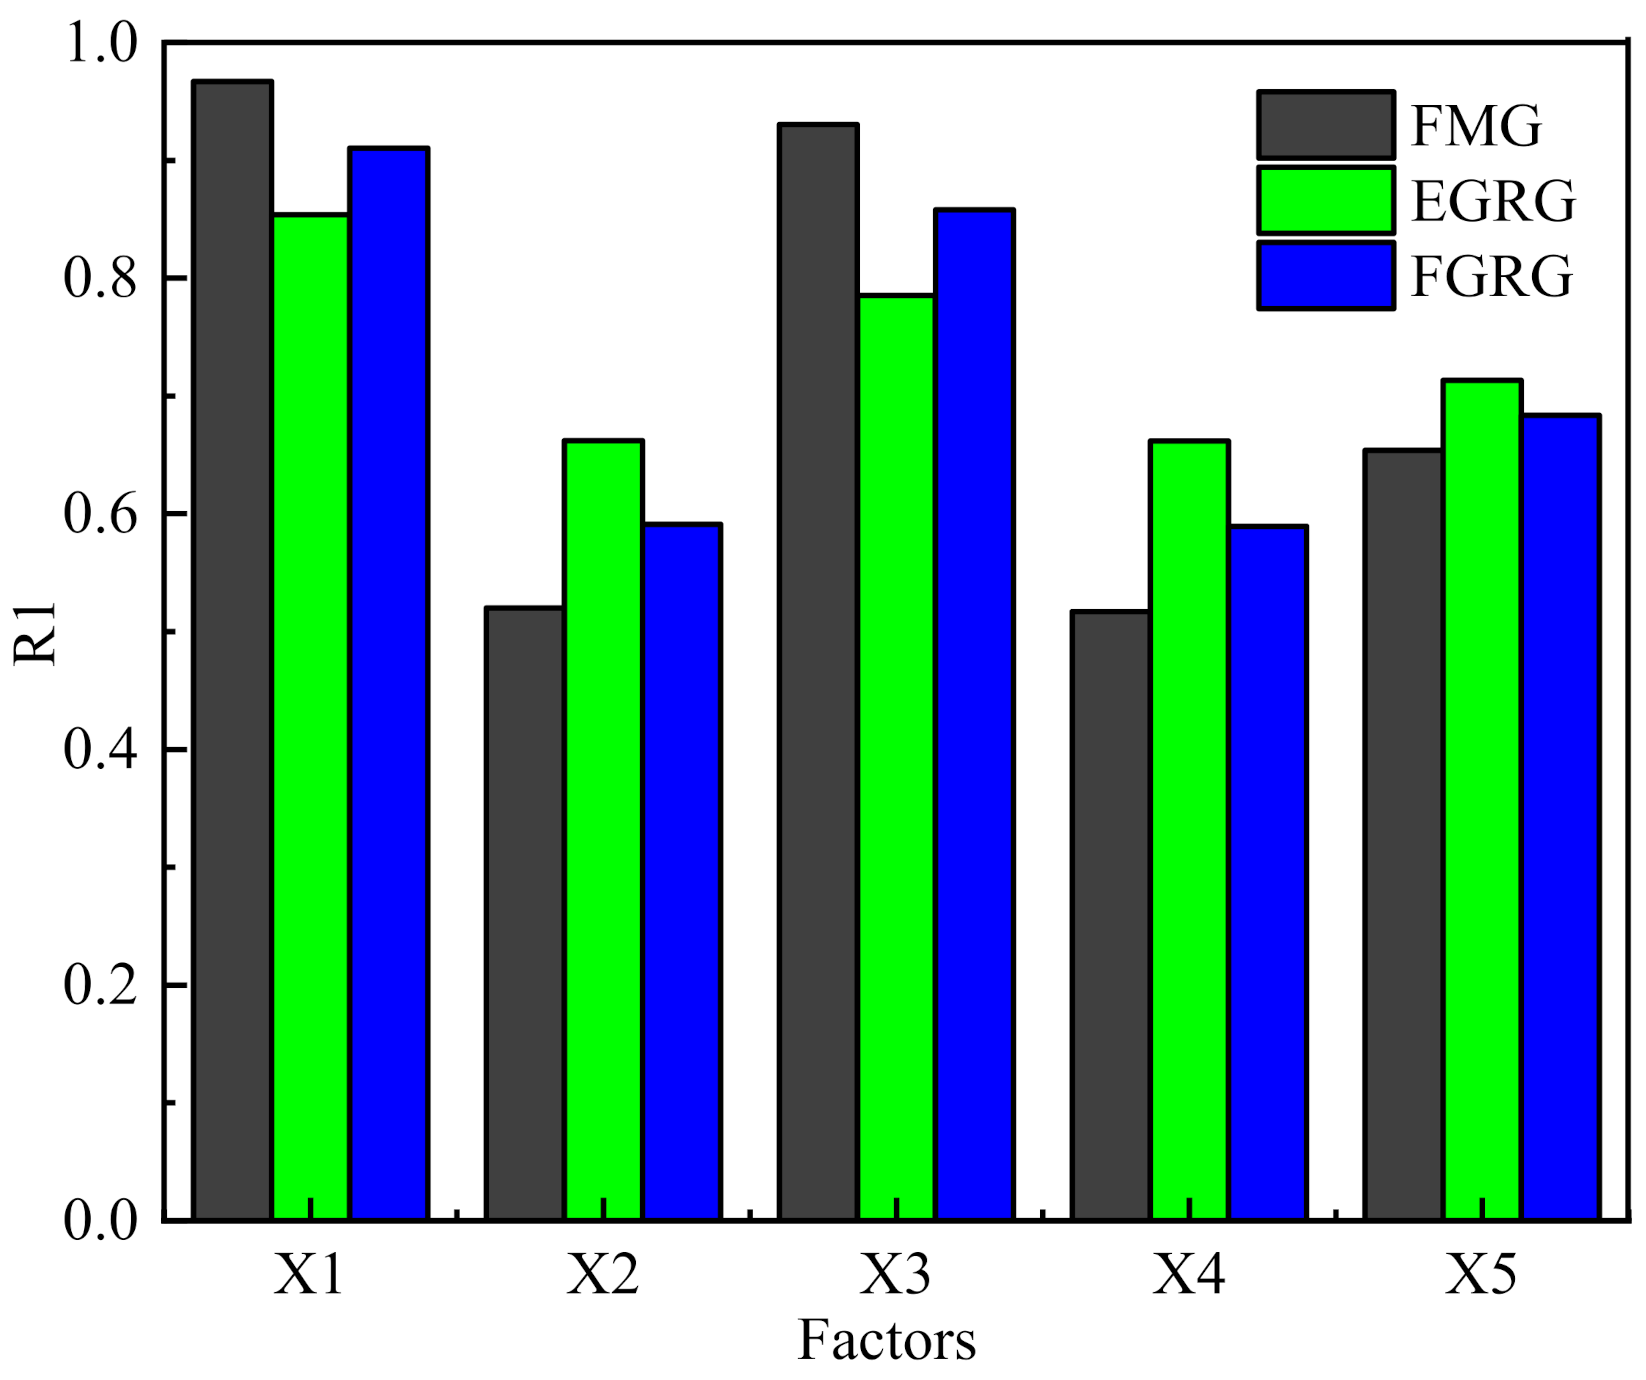
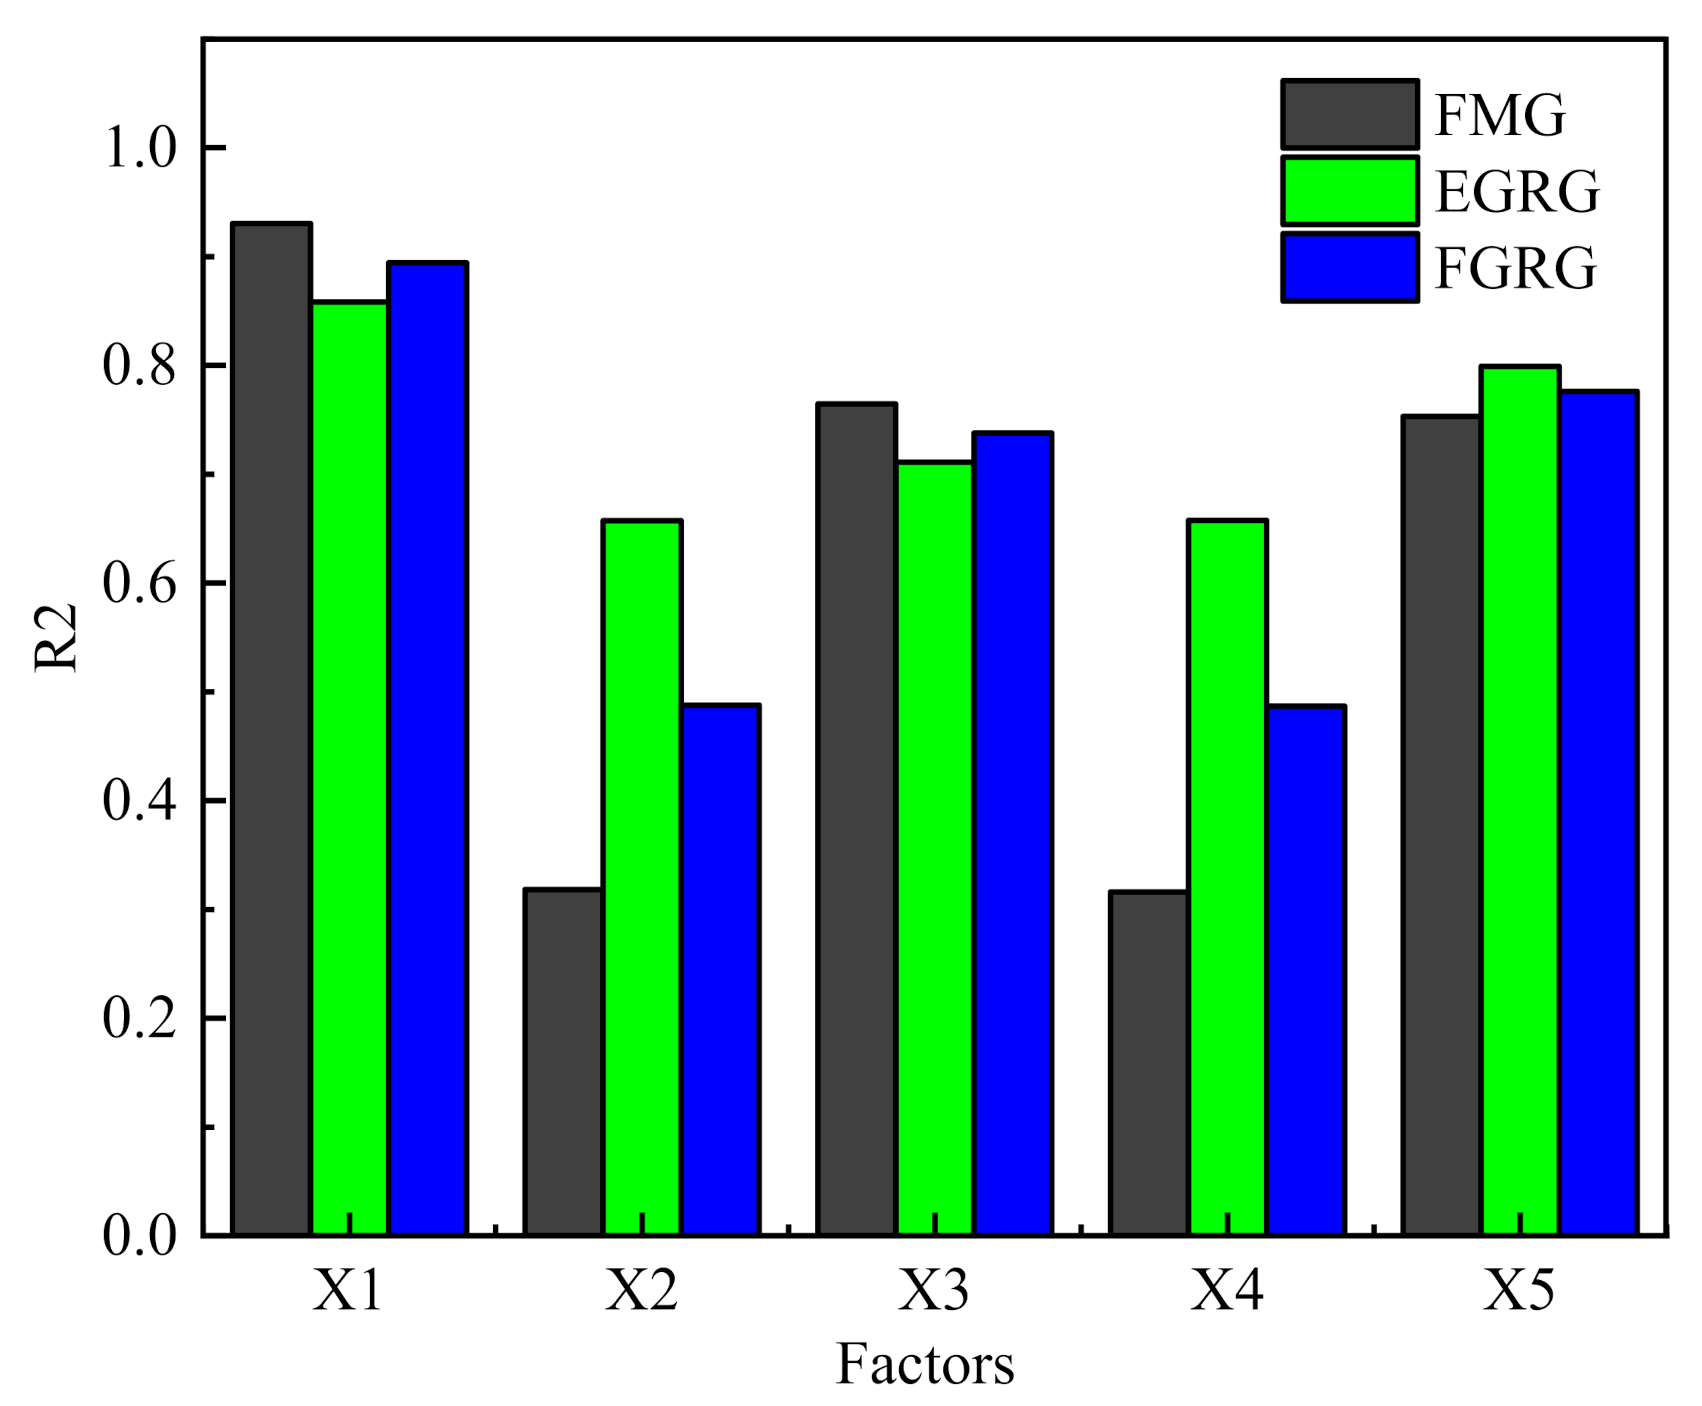
4. Gray Correlation Analysis

Fuzzy cluster analysis (FCA) is mainly a multivariate analysis method in statistics, which mainly uses mathematical methods to analyze the correlation degree of uncertain or fuzzy things, and objectively classifies the research objects [44]. The grey relational analysis (GRA) belongs to a research method in the category of comparative research information, which is used to calculate the degree of influence between various factors. In the paper, an improved model was proposed based on the GRA theory and was employed to analyze the correlation of various factors on diesel engine power and fuel consumption. The main steps are as follows:
(1)
Determination of sequence
The grey correlation sequence includes reference sequence Y and comparison sequence X. The reference sequence is composed of one or more sequences that reflect the characteristic of the system’s behavior, which are composed of statistical data of different groups. The variation reflects the development trend or the system. The representation of the reference sequence is as follows:
Y t = y t ( 1 ) y t ( 2 ) y t ( 3 ) y t ( n )
where Yt represents the t-th reference sequence; (t = 1, 2,..., n), [yt(1), yt(2),..., yt(n)] is the data of the reference sequence in group Yt. These data reflect the concrete manifestation of change law of Yt.
If there are factors m in the system and n kinds of working conditions, the eigenvector matrix corresponding to the influencing factors can be obtained as follows:
X t = [ x t 1 x t 2 x t n ] = [ x t 1 ( 1 ) x t 1 ( 2 ) x t 1 ( n ) x t 2 ( 1 ) x t 2 ( 2 ) x t 2 ( n ) x t m ( 1 ) x t m ( 1 ) x t m ( n ) ]
where Xt is the comparison sequence corresponding to reference sequence Yt. In this comparison sequence, there are m influencing factor vectors and the j-th one is xtj, (j = 1, 2,..., m).
In this study, the reference sequence Y1 represents power and Y2 represents BSFC. Comparison sequence X1X5 represents NOx emission, torque, cylinder pressure, BTE, and cylinder temperature respectively. The sequence matrix of each factor measured in this experiment is as follows:
[ Y 1 Y 2 X 1 X 2 X 3 X 4 X 5 ] = [ 27.6091 42.6121 55.1554 66.2267 75.7290 83.5726 89.5975 261.283 254.277 262.336 273.265 286.807 303.230 323.275 7.39306 8.05621 7.91502 7.86379 8.13757 7.40698 8.78657 263.647 271.277 263.348 252.967 241.053 228.017 213.898 10.2706 12.4322 13.3672 13.2824 13.2574 13.0089 12.7125 32.4192 33.3124 32.2891 30.9977 29.5341 27.9345 26.2039 1727.96 1576.28 1543.77 1567.66 1600.15 1641.65 1692.45 ]
(2)
Dimensionless original sequence
In the analysis process, many research factors represent different dimensions and physical meanings. Therefore, the parameter characteristics of different dimensions should be dimensionless in order to reduce the error caused by the calculation. The interval dimensionless was adopted to transform the sequence:
x k = x k minx k m a x x k m i n x k ; k = 1 , 2 , 3 , n
(3)
Fuzzy Membership Grades
The fuzzy similarity matrix can be obtained by the following equation:
r t j = k = 1 n y t k x j k k = 1 n y t k 2 k = 1 n x j k 2
(4)
Grey correlation coefficient
The grey correlation coefficient of each factor is calculated by the following equation:
ξ t j k = Δ m i n + l Δ m a x Δ t j k + l Δ m a x
where ξtj is the correlation coefficient (j = 1, 2,..., m; k = 1, 2, 3,..., n); Δmin is the minimum absolute value between the reference sequence and the comparison sequence value; Δmax is the maximum absolute value between the two sequences; Δtj(k) is the absolute difference of k points in the two sequences; and l is the resolution coefficient.
The minimum absolute value Δmin and the maximum absolute value Δmax of the two sequences can be obtained by the following equations:
Δ min = min 1 j m min 1 k n y t ( k ) x t j ( k )
Δ max = max 1 j m max 1 k n y t ( k ) x t j ( k )
The expression of the absolute difference Δtj between the reference sequence and the comparison sequence at point k is as follows:
Δ t j = y t ( k ) x t j ( k )
The resolution coefficient l is a very critical parameter of the maximum absolute difference weight, which should be selected under the premise of fully considering the correlation and anti-interference as a whole. Neither too large nor too small can accurately reflect the relevance of the researched matter. Generally, it is necessary to screen and confirm through the following steps [45].
Step 1: Calculate the mean of the absolute difference.
Δ ¯ = 1 n · m j = 1 m k = 1 n y t ( k ) x t j ( k )
Step 2: Determine the value range according to the ratio EΔ of the mean value Δ ¯ and the maximum absolute difference Δmax. The range of resolution coefficient l is between EΔ and 2EΔ, and the following conditions must be met:
E Δ l 1.5 E Δ , Δ max 3 Δ ¯
1.5 E Δ l 2.0 E Δ , Δ max 3 Δ ¯
(5)
Calculate the Euclidean Grey Relational Grade
The Euclidean grey relational grade (EGRG) analysis reflects the quantitative comparative analysis of the data during the dynamic development of various factors. The Euclidean grey relational grade of each data can be calculated by Equation (46).
R t j = 1 n ω j k = 1 n ξ t j k
(6)
Calculate the Fuzzy Grey Relational Grades
In order to get the comprehensive indexes reflecting the correlation degree of various factors, the grey correlation coefficient and fuzzy membership degree should be combined. Thus, the fuzzy grey relational grades (FGRG) can be calculated by Equation (47):
R = r t j + R t j 2 = k = 1 n y t k x j k k = k = 1 n x t k 2 + 1 n ω j k = 1 n ξ i j k 2
In order to save the calculation time and improve the accuracy of calculation, the calculation is carried out by MATLAB software. Figure 17 shows the fuzzy membership grade, Euclidean grey relational grade, and fuzzy grey relational grade of the five structural factors on power. The fuzzy membership grade, Euclidean grey relational grade, and fuzzy grey relational grade of NOx emissions are the highest. The higher the fuzzy membership grade is, the better the similarity between the factors studied. The fuzzy grey relational grades of NOx emission, cylinder peak pressure, cylinder peak temperature, torque, and BTE on power are 0.9103, 0.8579, 0.6835, 0.5911, and 0.5894, respectively. Therefore, the greatest relationship on power is NOx emission, followed by cylinder peak pressure, cylinder peak temperature, torque, and BTE.
Figure 18 shows the fuzzy membership grade, Euclidean grey relational grade, and fuzzy grey relational grade of the five structural factors on BSFC. Similarly, the NOx emission has the greatest relationship with BSFC. The fuzzy grey relational grades of NOx emission, cylinder peak temperature, cylinder peak pressure, torque, and BTE on BSFC are 0.8945, 0.7761, 0.7378, 0.4877, and 0.4869 respectively. Therefore, the greatest relationship with BSFC is NOx emission, followed by cylinder peak temperature, cylinder peak pressure, torque, and BTE.

5. Conclusions

With the increasing energy crisis [46,47,48,49,50] and environmental pollution [51,52,53,54,55,56], the development of a diesel engine is also facing challenges. Nowadays, looking for clean energy and improving the engine to reduce the harm exhaust have become the research focus [57,58,59,60]. In this work, a CFD model was developed and verified in AVL-Fire environment. In addition, the effects of different ethanol ratios on the combustion and emission characteristics of the diesel engine were studied in term of power, brake-specific fuel consumption, brake thermal efficiency, cylinder pressure, NOx, HC, CO, and soot. Based on the above analysis, the DE20 is the optimal diesel–ethanol blend fuel. The main conclusions are as follows:
(1)
The proportion of ethanol in diesel ethanol blend fuel has a great influence on engine performance characteristics. Compared with pure diesel, the diesel–ethanol blend fuel improves the brake thermal efficiency. Due to the high oxygen content of ethanol, the brake thermal efficiency of the engine increases with the increase of ethanol content. Compared with pure diesel, the brake thermal efficiencies of DE10, DE20, and DE30 increase by 2.24%, 4.33%, and 6.37% respectively. In addition, compared with pure diesel, the engine power of DE30 is reduced by about 5.54%. It is due to the higher oxygen content and lower calorific value of ethanol.
(2)
The proportion of ethanol in the blended fuel also plays an important role in improving the emission characteristics of the engine. The use of diesel–ethanol blended fuel can significantly reduce CO and soot emissions. Compared with pure diesel, the carbon monoxide and soot emissions of DE10 were reduced by 34.69% and 7.8%. However, with the increase of ethanol content in the blended fuel, NOx and HC emissions increased.
(3)
The fuzzy grey relational grades of NOx emission, cylinder peak pressure, cylinder peak temperature, torque, and BTE on power are 0.9103, 0.8579, 0.6835, 0.5911, and 0.5894, respectively. The greatest relationship with power is NOx emission. In addition, the fuzzy grey relational grades on BSFC are 0.8945, 0.7761, 0.7378, 0.4877, and 0.4869 respectively. The greatest relationship with BSFC is NOx emission, followed by cylinder peak temperature, cylinder peak pressure, torque and BTE.
In general, diesel–ethanol mixture plays an important role in reducing engine emissions, but it has a certain negative impact on the combustion characteristic of diesel engine. Thus, it needs to be further improved in future work.

Author Contributions

Z.Z.: Conceptualization, methodology, resources, project administration, writing—original draft preparation; J.L.: software, formal analysis, investigation; J.T.: writing—review and editing; G.X.: writing—review and editing; D.T.: project administration, writing—review and editing; B.Q.: writing—review and editing; Y.H.: methodology, project administration, writing—review and editing; S.C.: writing—review and editing. All authors have read and agreed to the published version of the manuscript.

Funding

This work is supported by the Natural Science Foundation of Guangxi under the research grant 2018GXNSFAA281267, 2018GXNSFAA294072 and 2018GXNSFAA294122.

Data Availability Statement

All data used to support the findings of this study are included within the article.

Conflicts of Interests

The authors declare that they have no conflict of interests regarding the publication of this paper.

References

  1. Jiaqiang, E.; Liu, G.; Zhang, Z.; Han, D.; Chen, J.; Wei, K.; Gong, J.; Yin, Z. Effect analysis on cold starting performance enhancement of a diesel engine fueled with biodiesel fuel based on an improved thermodynamic model. Appl. Energy 2019, 243, 321–335. [Google Scholar]
  2. Yu, W.; Zhang, Z.; Liu, B. Investigation on the Performance Enhancement and Emission Reduction of a Biodiesel Fueled Diesel Engine Based on an Improved Entire Diesel Engine Simulation Model. Processes 2021, 9, 104. [Google Scholar] [CrossRef]
  3. Cai, T.; Zhao, D.; Li, X.; Shi, B.; Li, J. Mitigating NOx Emissions from an Ammonia-fueled Micro-power System with a Perforated Plate Implemented. J. Hazard. Mater. 2021, 401, 123848. [Google Scholar] [CrossRef] [PubMed]
  4. Jiaqiang, E.; Pham, M.; Zhao, D.; Deng, Y.; Le, D.; Zuo, W.; Zhu, H.; Liu, T.; Peng, Q.; Zhang, Z. Effect of different technologies on combustion and emissions of the diesel engine fueled with biodiesel: A review. Renew. Sustain. Energy Rev. 2017, 80, 620–647. [Google Scholar]
  5. Santana, J.; Miranda, A.; Yamamura, C.; Filho, S.; Tambourgi, E.; Ho, L.; Berssaneti, F. Effects of Air Pollution on Human Health and Costs: Current Situation in São Paulo, Brazil. Sustainability 2020, 12, 4875. [Google Scholar] [CrossRef]
  6. Zhang, Z.; Ye, J.; Tan, D.; Feng, Z.; Luo, J.; Tan, Y.; Huang, Y. The effects of Fe2O3 based DOC and SCR catalyst on the combustion and emission characteristics of a diesel engine fueled with biodiesel. Fuel 2021, 290, 120039. [Google Scholar] [CrossRef]
  7. Ni, P.; Wang, X.; Li, H. A review on regulations, current status, effects and reduction strategies of emissions for marine diesel engines. Fuel 2020, 279, 118477. [Google Scholar] [CrossRef]
  8. Jiaqiang, E.; Zhao, X.; Qiu, L.; Wei, K.; Zhang, Z.; Deng, Y.; Han, D.; Liu, G. Experimental investigation on performance and economy characteristics of a diesel engine with variable nozzle turbocharger and its application in urban bus. Energy Convers. Manag. 2019, 193, 149–161. [Google Scholar]
  9. Li, J.; Yang, W.; An, H.; Zhao, D. Effects of fuel ratio and injection timing on gasoline/biodiesel fueled RCCI engine: A modeling study. Appl. Energy 2015, 155, 59–67. [Google Scholar] [CrossRef]
  10. Skalska, K.; Miller, J.; Ledakowicz, S. Trends in NOx abatement: A review. Sci. Total Environ. 2010, 408, 3976–3989. [Google Scholar] [CrossRef]
  11. Sarli, V.; Landi, L.; Lisi, L.; Benedetto, A. Ceria-Coated Diesel Particulate Filters for Continuous Regeneration. AIChE J. 2017, 63, 3442–3449. [Google Scholar] [CrossRef]
  12. Sarli, V.; Benedetto, A. Combined effects of soot load and catalyst activity on the regeneration dynamics of catalytic diesel particulate filters. AIChE J. 2018, 64, 1714–1722. [Google Scholar] [CrossRef]
  13. Tadano, Y.; Borillo, G.; Godoi, A.; Cichon, A.; Silva, T.; Valebona, F.; Errera, M.; Neto, R.; Rempel, D.; Martin, L.; et al. Gaseous emissions from a heavy-duty engine equipped with SCR aftertreatment system and fuelled with diesel and biodiesel: Assessment of pollutant dispersion and health risk. Sci. Total Environ. 2014, 500, 64–71. [Google Scholar] [CrossRef]
  14. Cai, T.; Zhao, D.; Wang, B.; Li, J.; Guan, Y. NO emission and thermal performances studies on premixed ammonia-oxygen combustion in a CO2-free micro-planar combustor. Fuel 2020, 280, 118554. [Google Scholar] [CrossRef]
  15. Tamilselvan, P.; Nallusamy, N.; Rajkumar, S. A comprehensive review on performance, combustion and emission characteristics of biodiesel fuelled diesel engines. Renew. Sustain. Energy Rev. 2017, 79, 1134–1159. [Google Scholar] [CrossRef]
  16. Jiaqiang, E.; Zhang, Z.; Chen, J.; Pham, M.; Zhao, X.; Peng, Q.; Zhang, B.; Yin, Z. Performance and emission evaluation of a marine diesel engine fueled by water biodiesel-diesel emulsion blends with a fuel additive of a cerium oxide nanoparticle. Energy Convers. Manag. 2018, 169, 194–205. [Google Scholar]
  17. Sun, J.; Caton, J.; Jacobs, T. Oxides of nitrogen emissions from biodiesel-fuelled diesel engines. Prog. Energy Combust. Sci. 2010, 36, 677–695. [Google Scholar] [CrossRef]
  18. Karthickeyan, V.; Thiyagarajan, S.; Geo, V.; Ashok, B.; Nanthagopal, K.; Chyuan, O.; Vignesh, R. Simultaneous reduction of NOx and smoke emissions with low viscous biofuel in low heat rejection engine using selective catalytic reduction technique. Fuel 2019, 255, 115854. [Google Scholar] [CrossRef]
  19. Jimenez, E.; Dorado, R.; Kegl, B.; Kegl, M. One-dimensional modeling and simulation of injection processes of bioethanol-biodiesel and bioethanol-diesel fuel blends. Fuel 2018, 227, 334–344. [Google Scholar] [CrossRef]
  20. Tang, Y.; Zhang, J.; Jia, B.; He, Z.; Xia, Y. Investigation on the solution of nitric oxide emission model for diesel engine using optimization algorithms. Fuel 2018, 228, 81–91. [Google Scholar] [CrossRef]
  21. Zöldy, M.; Kondor, I. Simulation and Injector Bench Test Validation of Different Nozzle Hole Effect on Pyrolysis Oil-Diesel Oil Mixtures. Energies 2021, 14, 2396. [Google Scholar] [CrossRef]
  22. Karami, R.; Rasul, M.; Khan, M.; Salahi, M.; Anwar, M. Experimental and computational analysis of combustion characteristics of a diesel engine fueled with diesel-tomato seed oil biodiesel blends. Fuel 2021, 285, 119243. [Google Scholar] [CrossRef]
  23. Asadi, A.; Kadijani, O.; Doranehgard, M.; Bozorg, M.; Xiong, Q.; Shadloo, M.; Li, L. Numerical study on the application of biodiesel and bioethanol in a multiple injection diesel engine. Renew. Energy 2020, 150, 1019–1029. [Google Scholar] [CrossRef]
  24. Zhao, X.; Jiaqiang, E.; Liao, G.; Zhang, F.; Chen, J.; Deng, Y. Numerical simulation study on soot continuous regeneration combustion model of diesel particulate filter under exhaust gas heavy load. Fuel 2021, 287, 119795. [Google Scholar] [CrossRef]
  25. Nour, M.; Kosaka, H.; Bady, M.; Sato, S.; Abdel-Rahman, A. Combustion and emission characteristics of DI diesel engine fuelled by ethanol injected into the exhaust manifold. Fuel Process. Technol. 2017, 164, 33–50. [Google Scholar] [CrossRef]
  26. Shirneshan, A.; Bagherzadeh, S.; Najafi, G.; Mamat, R.; Mazlan, M. Optimization and investigation the effects of using biodiesel-ethanol blends on the performance and emission characteristics of a diesel engine by genetic algorithm. Fuel 2021, 289, 119753. [Google Scholar] [CrossRef]
  27. Sayin, C. Engine performance and exhaust gas emissions of methanol and ethanol–diesel blends. Fuel 2010, 89, 3410–3415. [Google Scholar] [CrossRef]
  28. Aydın, F.; Öğüt, H. Effects of using ethanol-biodiesel-diesel fuel in single cylinder diesel engine to engine performance and emissions. Renew. Energy 2017, 103, 688–694. [Google Scholar] [CrossRef]
  29. Kim, H.; Ge, J.; Choi, N. Effects of Ethanol–Diesel on the Combustion and Emissions from a Diesel Engine at a Low Idle Speed. Appl. Sci. 2020, 10, 4153. [Google Scholar] [CrossRef]
  30. Tutak, W.; Jamrozik, A.; Pyrc, M.; Sobiepański, M. A comparative study of co-combustion process of diesel-ethanol and biodiesel-ethanol blends in the direct injection diesel engine. Appl. Therm. Eng. 2017, 117, 155–163. [Google Scholar] [CrossRef]
  31. Li, D.; Huang, Z.; Lu, X.; Zhang, W.; Yang, J. Physico-chemical properties of ethanol–diesel blend fuel and its effect on performance and emissions of diesel engines. Renew. Energy 2005, 30, 967–976. [Google Scholar] [CrossRef]
  32. Souza, G.; Pellegrini, C.; Ferreira, S.; Soto, P.; Armas, O. Study of intake manifolds of an internal combustion engine: A new geometry based on experimental results and numerical simulations. Therm. Sci. Eng. Prog. 2019, 9, 248–258. [Google Scholar] [CrossRef]
  33. Zhao, D.; Guan, Y.; Reinecke, A. Characterizing hydrogen-fuelled pulsating combustion on thermodynamic properties of a combustor. Commun. Phys. 2019, 2, 44. [Google Scholar] [CrossRef] [Green Version]
  34. Yu, W.; Zhang, Z.; Liu, B. Effect Analysis on the Performance Enhancement and Emission Reduction of Diesel Engine Fueled with Biodiesel Fuel Based on an Improved Model. Int. J. Aerosp. Eng. 2020, 2020, 8831376. [Google Scholar] [CrossRef]
  35. Zhang, Z.; Jiaqiang, E.; Chen, J.; Zhu, H.; Zhao, X.; Han, D.; Zuo, W.; Peng, Q.; Gong, J.; Yin, Z. Effects of low-level water addition on spray, combustion and emission characteristics of a medium speed diesel engine fueled with biodiesel fuel. Fuel 2019, 239, 245–262. [Google Scholar] [CrossRef]
  36. Tan, D.; Chen, Z.; Li, J.; Luo, J.; Yang, D.; Cui, S.; Zhang, Z. Effects of Swirl and Boiling Heat Transfer on the Performance Enhancement and Emission Reduction for a Medium Diesel Engine Fueled with Biodiesel. Processes 2021, 9, 568. [Google Scholar] [CrossRef]
  37. Alptekin, E. Evaluation of ethanol and isopropanol as additives with diesel fuel in a CRDI diesel engine. Fuel 2017, 205, 161–172. [Google Scholar] [CrossRef]
  38. Han, D.; Jiaqiang, E.; Deng, Y.; Chen, J.; Leng, E.; Liao, G.; Zhao, X.; Feng, C.; Zhang, F. A review of studies using hydrocarbon adsorption material for reducing hydrocarbon emissions from cold start of gasoline engine. Renew. Sustain. Energy Rev. 2021, 135, 110079. [Google Scholar] [CrossRef]
  39. Zhang, Z.; Jiaqiang, E.; Deng, Y.; Pham, M.; Zuo, W.; Peng, Q.; Yin, Z. Effects of fatty acid methyl esters proportion on combustion and emission characteristics of a biodiesel fueled marine diesel engine. Energy Convers. Manag. 2018, 159, 244–253. [Google Scholar] [CrossRef]
  40. Gao, Z.; Lin, S.; Ji, J.; Li, M. An experimental study on combustion performance and flame spread characteristics over liquid diesel and ethanol-diesel blended fuel. Energy 2019, 170, 349–355. [Google Scholar] [CrossRef]
  41. Armas, O.; García-Contreras, R.; Ramos, Á. Pollutant emissions from New European Driving Cycle with ethanol and butanol diesel blends. Fuel Process. Technol. 2014, 122, 64–71. [Google Scholar] [CrossRef]
  42. Balamurugan, T.; Nalini, R. Experimental investigation on performance, combustion and emission characteristics of four stroke diesel engine using diesel blended with alcohol as fuel. Energy 2014, 78, 356–363. [Google Scholar] [CrossRef]
  43. Padala, S.; Woo, C.; Kook, S.; Hawkes, E. Ethanol utilisation in a diesel engine using dual-fuelling technology. Fuel 2013, 109, 597–607. [Google Scholar] [CrossRef]
  44. Zhang, X.; Jin, F.; Liu, P. A grey relational projection method for multi-attribute decision making based on intuitionistic trapezoidal fuzzy number. Appl. Math. Model. 2013, 37, 3467–3477. [Google Scholar] [CrossRef]
  45. Zuo, Q.; Zhang, D.; Jiaqiang, E.; Gong, J. Comprehensive analysis on influencing factors of composite regeneration performance of a diesel particulate filter. Environ. Prog. Sustain. Energy 2016, 35, 882–890. [Google Scholar] [CrossRef]
  46. Zuo, H.; Tan, J.; Wei, K.; Huang, Z.; Zhong, D.; Xie, F. Effects of different poses and wind speeds on wind-induced vibration characteristics of a dish solar concentrator system. Renew. Energy 2021, 168, 1308–1326. [Google Scholar] [CrossRef]
  47. Zuo, H.; Liu, G.; Jiaqiang, E.; Zuo, W.; Wei, K.; Hu, W.; Tan, J.; Zhong, D. Catastrophic analysis on the stability of a large dish solar thermal power generation system with wind-induced vibration. Sol. Energy 2019, 183, 40–49. [Google Scholar] [CrossRef]
  48. Zhang, F.; Liao, G.; Jiaqiang, E.; Chen, J.; Leng, E. Comparative study on the thermodynamic and economic performance of novel absorption power cycles driven by the waste heat from a supercritical CO2 cycle. Energy Convers. Manag. 2021, 228, 113671. [Google Scholar] [CrossRef]
  49. Peng, Q.; Yang, W.; Jiaqiang, E.; Li, Z.; Xu, H.; Fu, G.; Li, S. Investigation on H2/air combustion with C3H8 addition in the combustor with part/full porous medium. Energy Convers. Manag. 2020, 228, 113652. [Google Scholar] [CrossRef]
  50. Hu, L.; Hu, X.; Che, Y.; Feng, F.; Lin, X.; Zhang, Z. Reliable state of charge estimation of battery packs using fuzzy adaptive federated filtering. Appl. Energy 2020, 262, 114569. [Google Scholar] [CrossRef]
  51. Wu, G.; Wu, D.; Li, Y.; Meng, L. Effect of Acetone-n-Butanol-Ethanol (ABE) as an Oxygenate on Combustion, Performance, and Emission Characteristics of a Spark Ignition Engine. J. Chem. 2020, 2020, 1–11. [Google Scholar] [CrossRef] [Green Version]
  52. Jiaqiang, E.; Zhao, M.; Zuo, Q.; Zhang, B.; Zhang, Z.; Peng, Q.; Han, D.; Zhao, X.; Deng, Y. Effects analysis on diesel soot continuous regeneration performance of a rotary microwave-assisted regeneration diesel particulate filter. Fuel 2020, 260, 116353. [Google Scholar] [CrossRef]
  53. Zhang, B.; Zuo, H.; Huang, Z.; Tan, J.; Zuo, Q. Endpoint forecast of different diesel-biodiesel soot filtration process in diesel particulate filters considering ash deposition. Fuel 2020, 272, 117678. [Google Scholar] [CrossRef]
  54. Wu, G.; Wang, X.; Abubakar, S.; Li, Y.; Liu, Z. A realistic skeletal mechanism for the oxidation of biodiesel surrogate composed of long carbon chain and polyunsaturated compounds. Fuel 2021, 289, 119934. [Google Scholar] [CrossRef]
  55. Xie, Y.; Zuo, Q.; Wang, M.; Wei, K.; Zhang, B.; Chen, W.; Tang, Y.; Wang, Z.; Zhu, G. Effects analysis on soot combustion performance enhancement of an improved catalytic gasoline particulate filter regeneration system with electric heating. Fuel 2021, 290, 119975. [Google Scholar] [CrossRef]
  56. Xie, Y.; Zuo, Q.; Zhu, G.; Guan, Q.; Wei, K.; Zhang, B.; Tang, Y.; Shen, Z. Investigations on the soot combustion performance enhancement of an improved catalytic gasoline particulate filter regeneration system under different electric heating powers. Fuel 2021, 283, 119301. [Google Scholar] [CrossRef]
  57. Li, W.; Ji, J.; Huang, L.; Guo, Z. Global dynamics of a controlled discontinuous diffusive SIR epidemic system. Appl. Math. Lett. 2021, 121, 107420. [Google Scholar] [CrossRef]
  58. Cai, T.; Zhao, D.; Sun, Y.; Ni, S.; Li, W. Evaluation of NOx Emissions Characteristics in a CO2-Free Micro-Power System by Implementing a Perforated Plate. Renew. Sustain. Energy Rev. 2021, 145, 111150. [Google Scholar] [CrossRef]
  59. Cai, T.; Zhao, D. Effects of fuel composition and wall thermal conductivity on thermal and NOx emission performances of an ammonia/hydrogen-oxygen micro-power system. Fuel Process. Technol. 2020, 209, 106527. [Google Scholar] [CrossRef]
  60. Zuo, Q.; Xie, Y.; Jiaqiang, E.; Zhu, X.; Zhang, B.; Tang, Y.; Zhu, G.; Wang, Z.; Zhang, J. Effect of different exhaust parameters on NO conversion efficiency enhancement of a dual-carrier catalytic converter in the gasoline engine. Energy 2020, 191, 116521. [Google Scholar] [CrossRef]
Figure 1. The 3-D CFD simulation model of cylinder.
Processes 09 01135 g001
Figure 2. The 45° sector grid shown at top dead center.
Processes 09 01135 g002
Figure 3. The comparison of cylinder pressure for grid independence test.
Processes 09 01135 g003
Figure 4. Schematic diagram of experimental equipment.
Processes 09 01135 g004
Figure 5. Engine validation results for cylinder pressure and HRR: (a) Cylinder pressure and heat release curve at 100% load; (b) Cylinder pressure and heat release curve at 50% load.
Processes 09 01135 g005
Figure 6. The effects of DE ratios on BSFC under different conditions.
Processes 09 01135 g006
Figure 7. The effects of DE ratios on BTE under different conditions.
Processes 09 01135 g007
Figure 8. The effects of DE ratios on power under different conditions.
Processes 09 01135 g008
Figure 9. (ad) The effects of DE ratios on cylinder pressure under different conditions.
Processes 09 01135 g009aProcesses 09 01135 g009b
Figure 10. (ad) The effects of DE ratios on cylinder temperature under different conditions.
Processes 09 01135 g010aProcesses 09 01135 g010b
Figure 11. The temperature distribution field of the cylinder.
Processes 09 01135 g011
Figure 12. The effects of DE ratios on NOx emissions under different conditions.
Processes 09 01135 g012
Figure 13. The NOx distribution field of a cylinder.
Processes 09 01135 g013
Figure 14. The effects of DE ratios on HC emission under different conditions.
Processes 09 01135 g014
Figure 15. The effects of DE ratios on CO emissions under different conditions.
Processes 09 01135 g015
Figure 16. The effects of DE ratios on soot emissions under different conditions.
Processes 09 01135 g016
Figure 17. The influence of five structural factors on power.
Processes 09 01135 g017
Figure 18. The influence of five structural factors on BSFC.
Processes 09 01135 g018
Table 1. The main parameters of diesel engine.
TypeValue
Number of cylinder4
Bore × stroke (mm)96 × 110
Connecting rod (mm)176
Effective power (kW)90
Compression ratio14:1
Torque (N·m)270
Engine displacement (L)2.5
Fuel injection typeDirect injection system of electronic unit pump
Method of chargingExhaust-gas turbocharger
Table 2. List of measurements, the measuring range, and accuracy.
MeasurementsMeasuring RangAccuracyUncertainty (%)
Cylinder pressure1–25 MPa±10 kPa±0.5
Exhaust gas temperature0–1000 °C±1 °C±0.25
Brake power-0.03 kW±0.03
HC emission0–20,000 ppm±10 ppm±0.11
NOx emission0–5000 ppm±10 ppm±0.53
Soot emission0–9 FSN±0.1 FSN±2.8
BSFC-±5 g/kW h±1.5
CO emission0–10%vol±0.03%±0.32
Air flow mass0–33.3 kg/min±1%±0.5
Fuel flow measurement0.5–100 L/h±0.04 L/h±0.5
Engine speed1–2000 rpm±0.2%±0.24
Table 3. The physical properties of fuel.
FuelDieselEthanol
Chemical formula-C2H5OH
Boiling temperature (°C)190–28064.7
Oxygen volume fraction (%)0.034.7
Density (g/m3, at 20 °C)0.82–0.860.79
Viscosity (MPa·s, at 20 °C)3.0–8.01.2
Flash point (°C)65–8813–14
Cetane number (CN)45–658
Low calorific value (MJ·kg−1)42.5–42.826.8
Publisher’s Note: MDPI stays neutral with regard to jurisdictional claims in published maps and institutional affiliations.

