
Heat Transfer Enhancement of Indirect Heat Transfer Reactors for Ca(OH)2/CaO Thermochemical Energy Storage System


Abstract
:1. Introduction
2. Mathematical Model
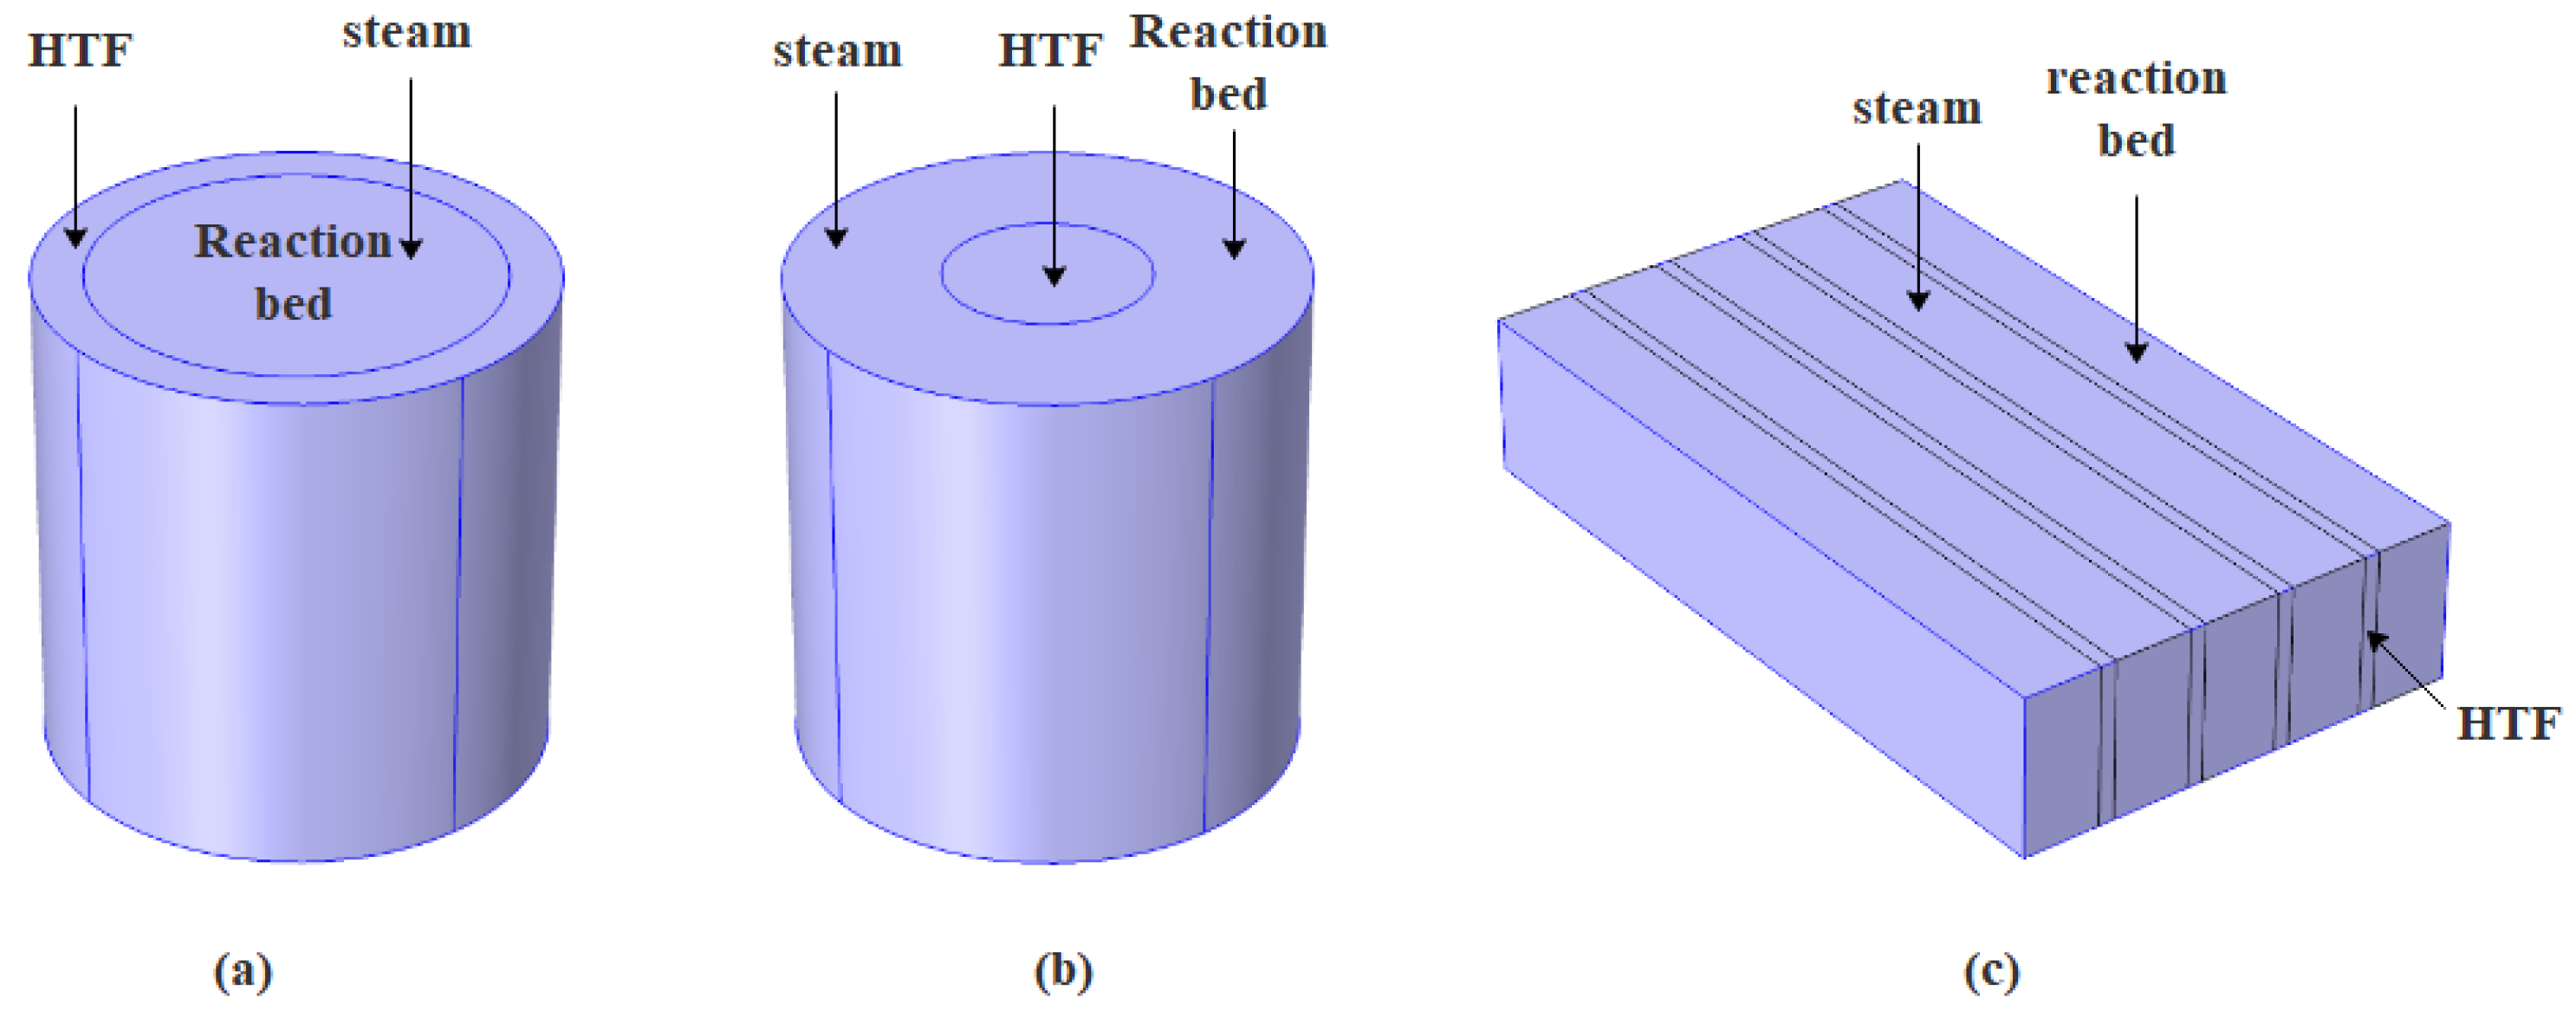
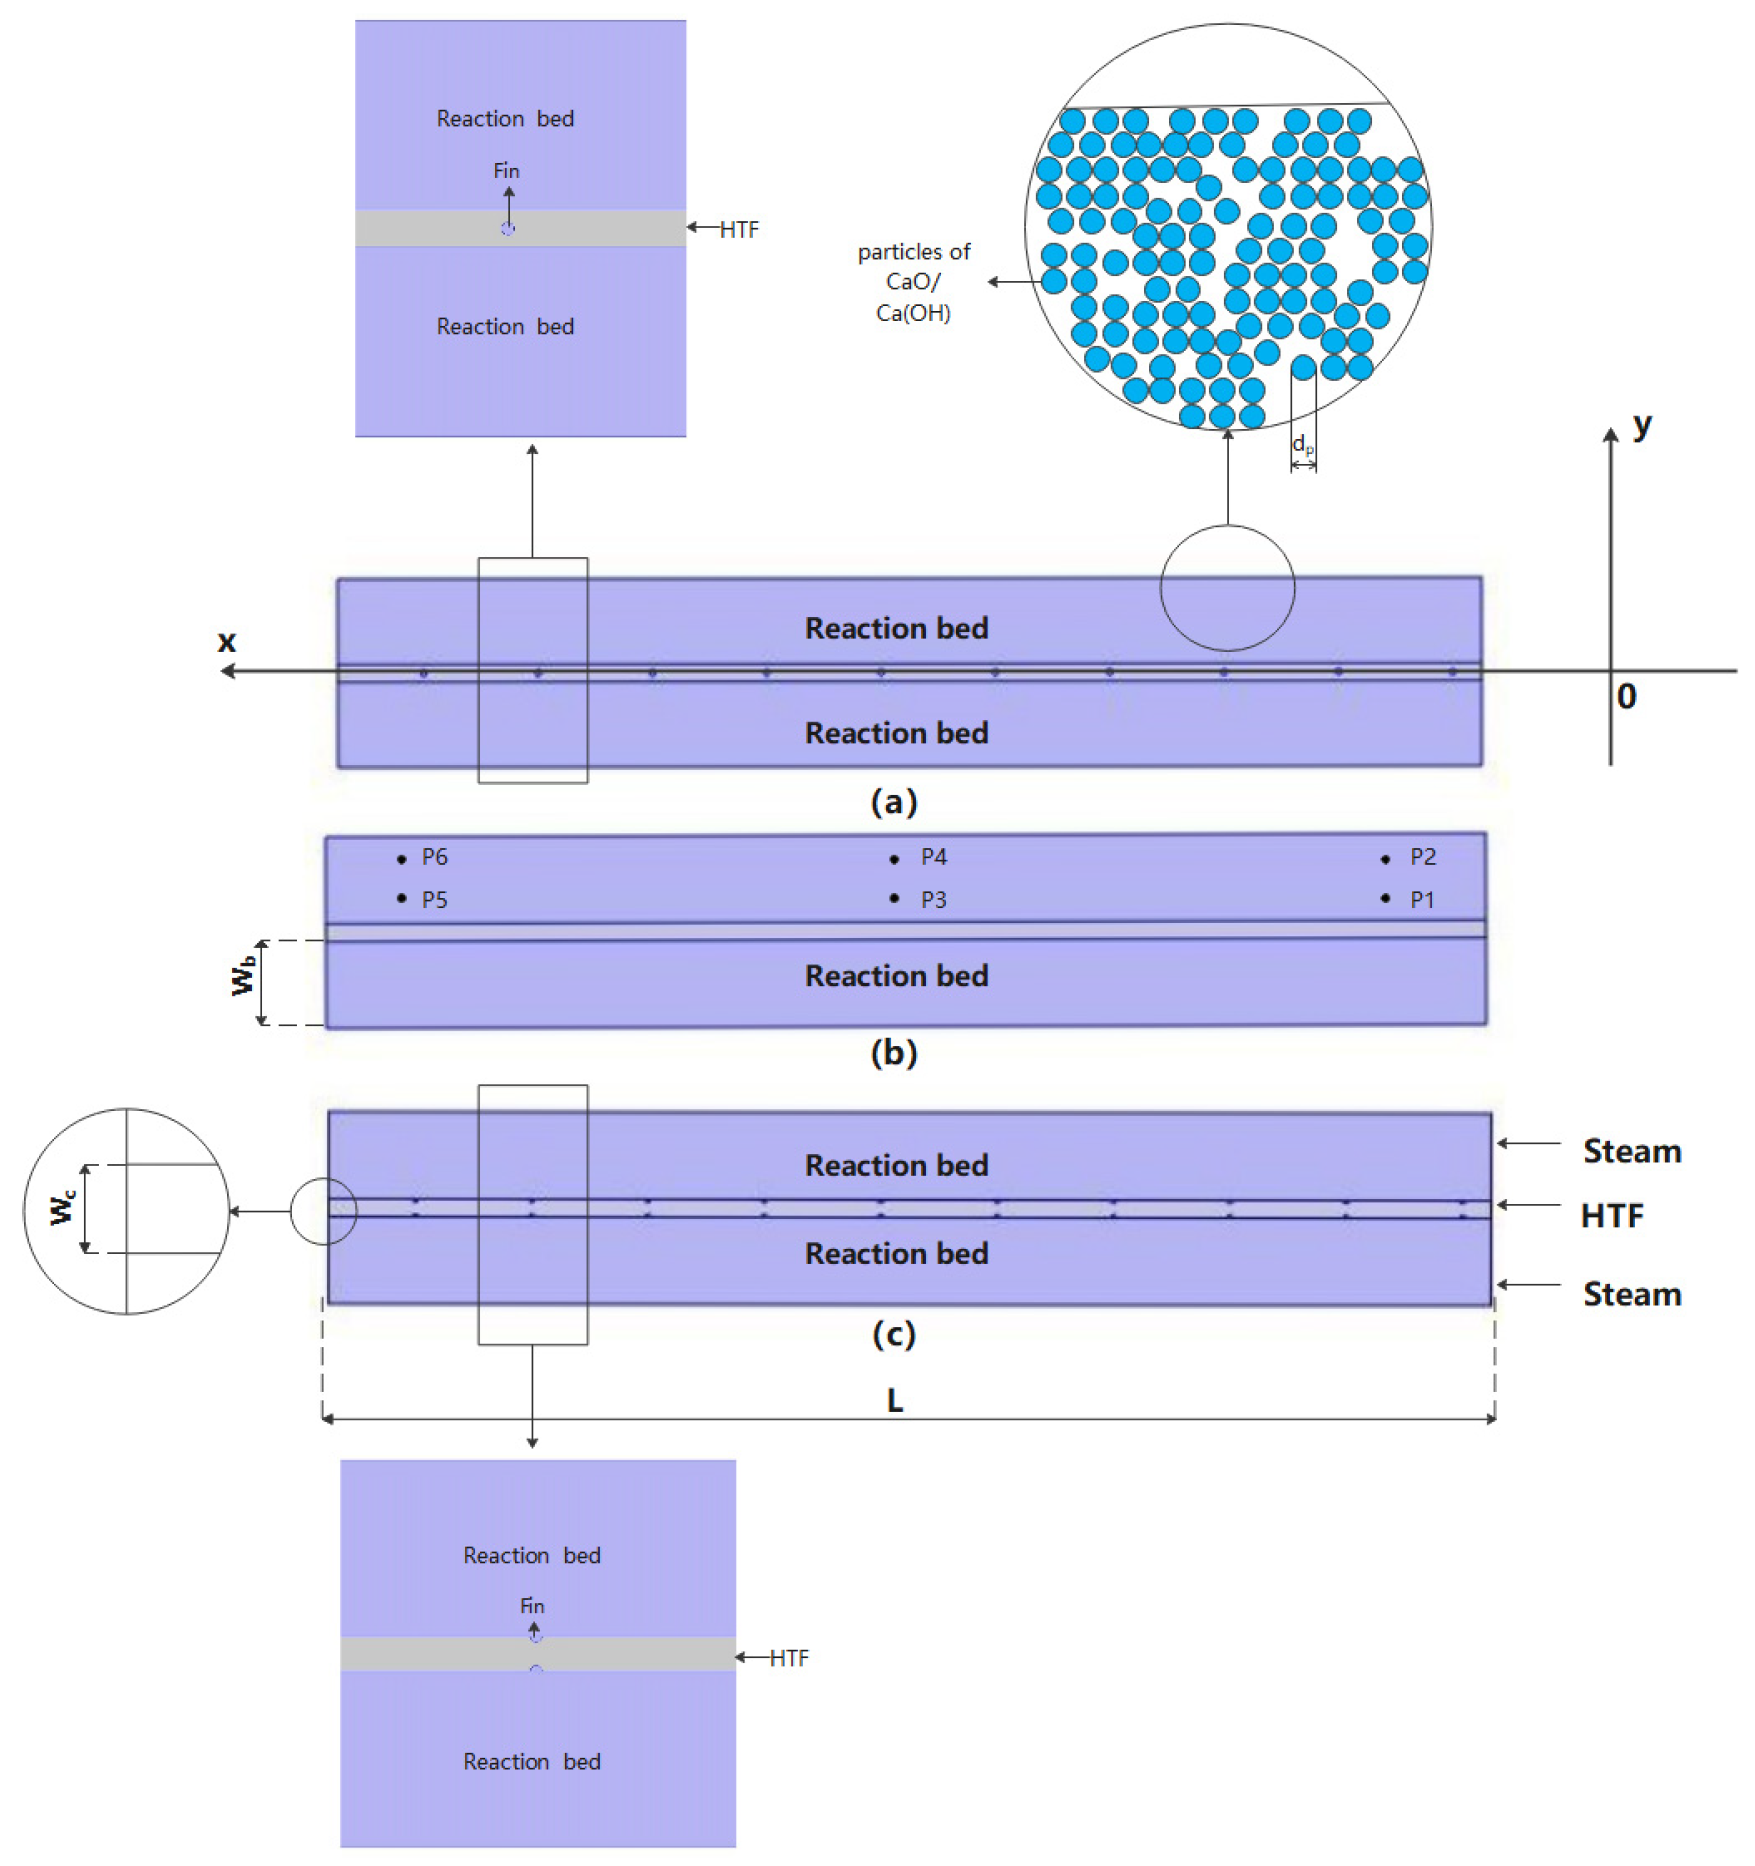
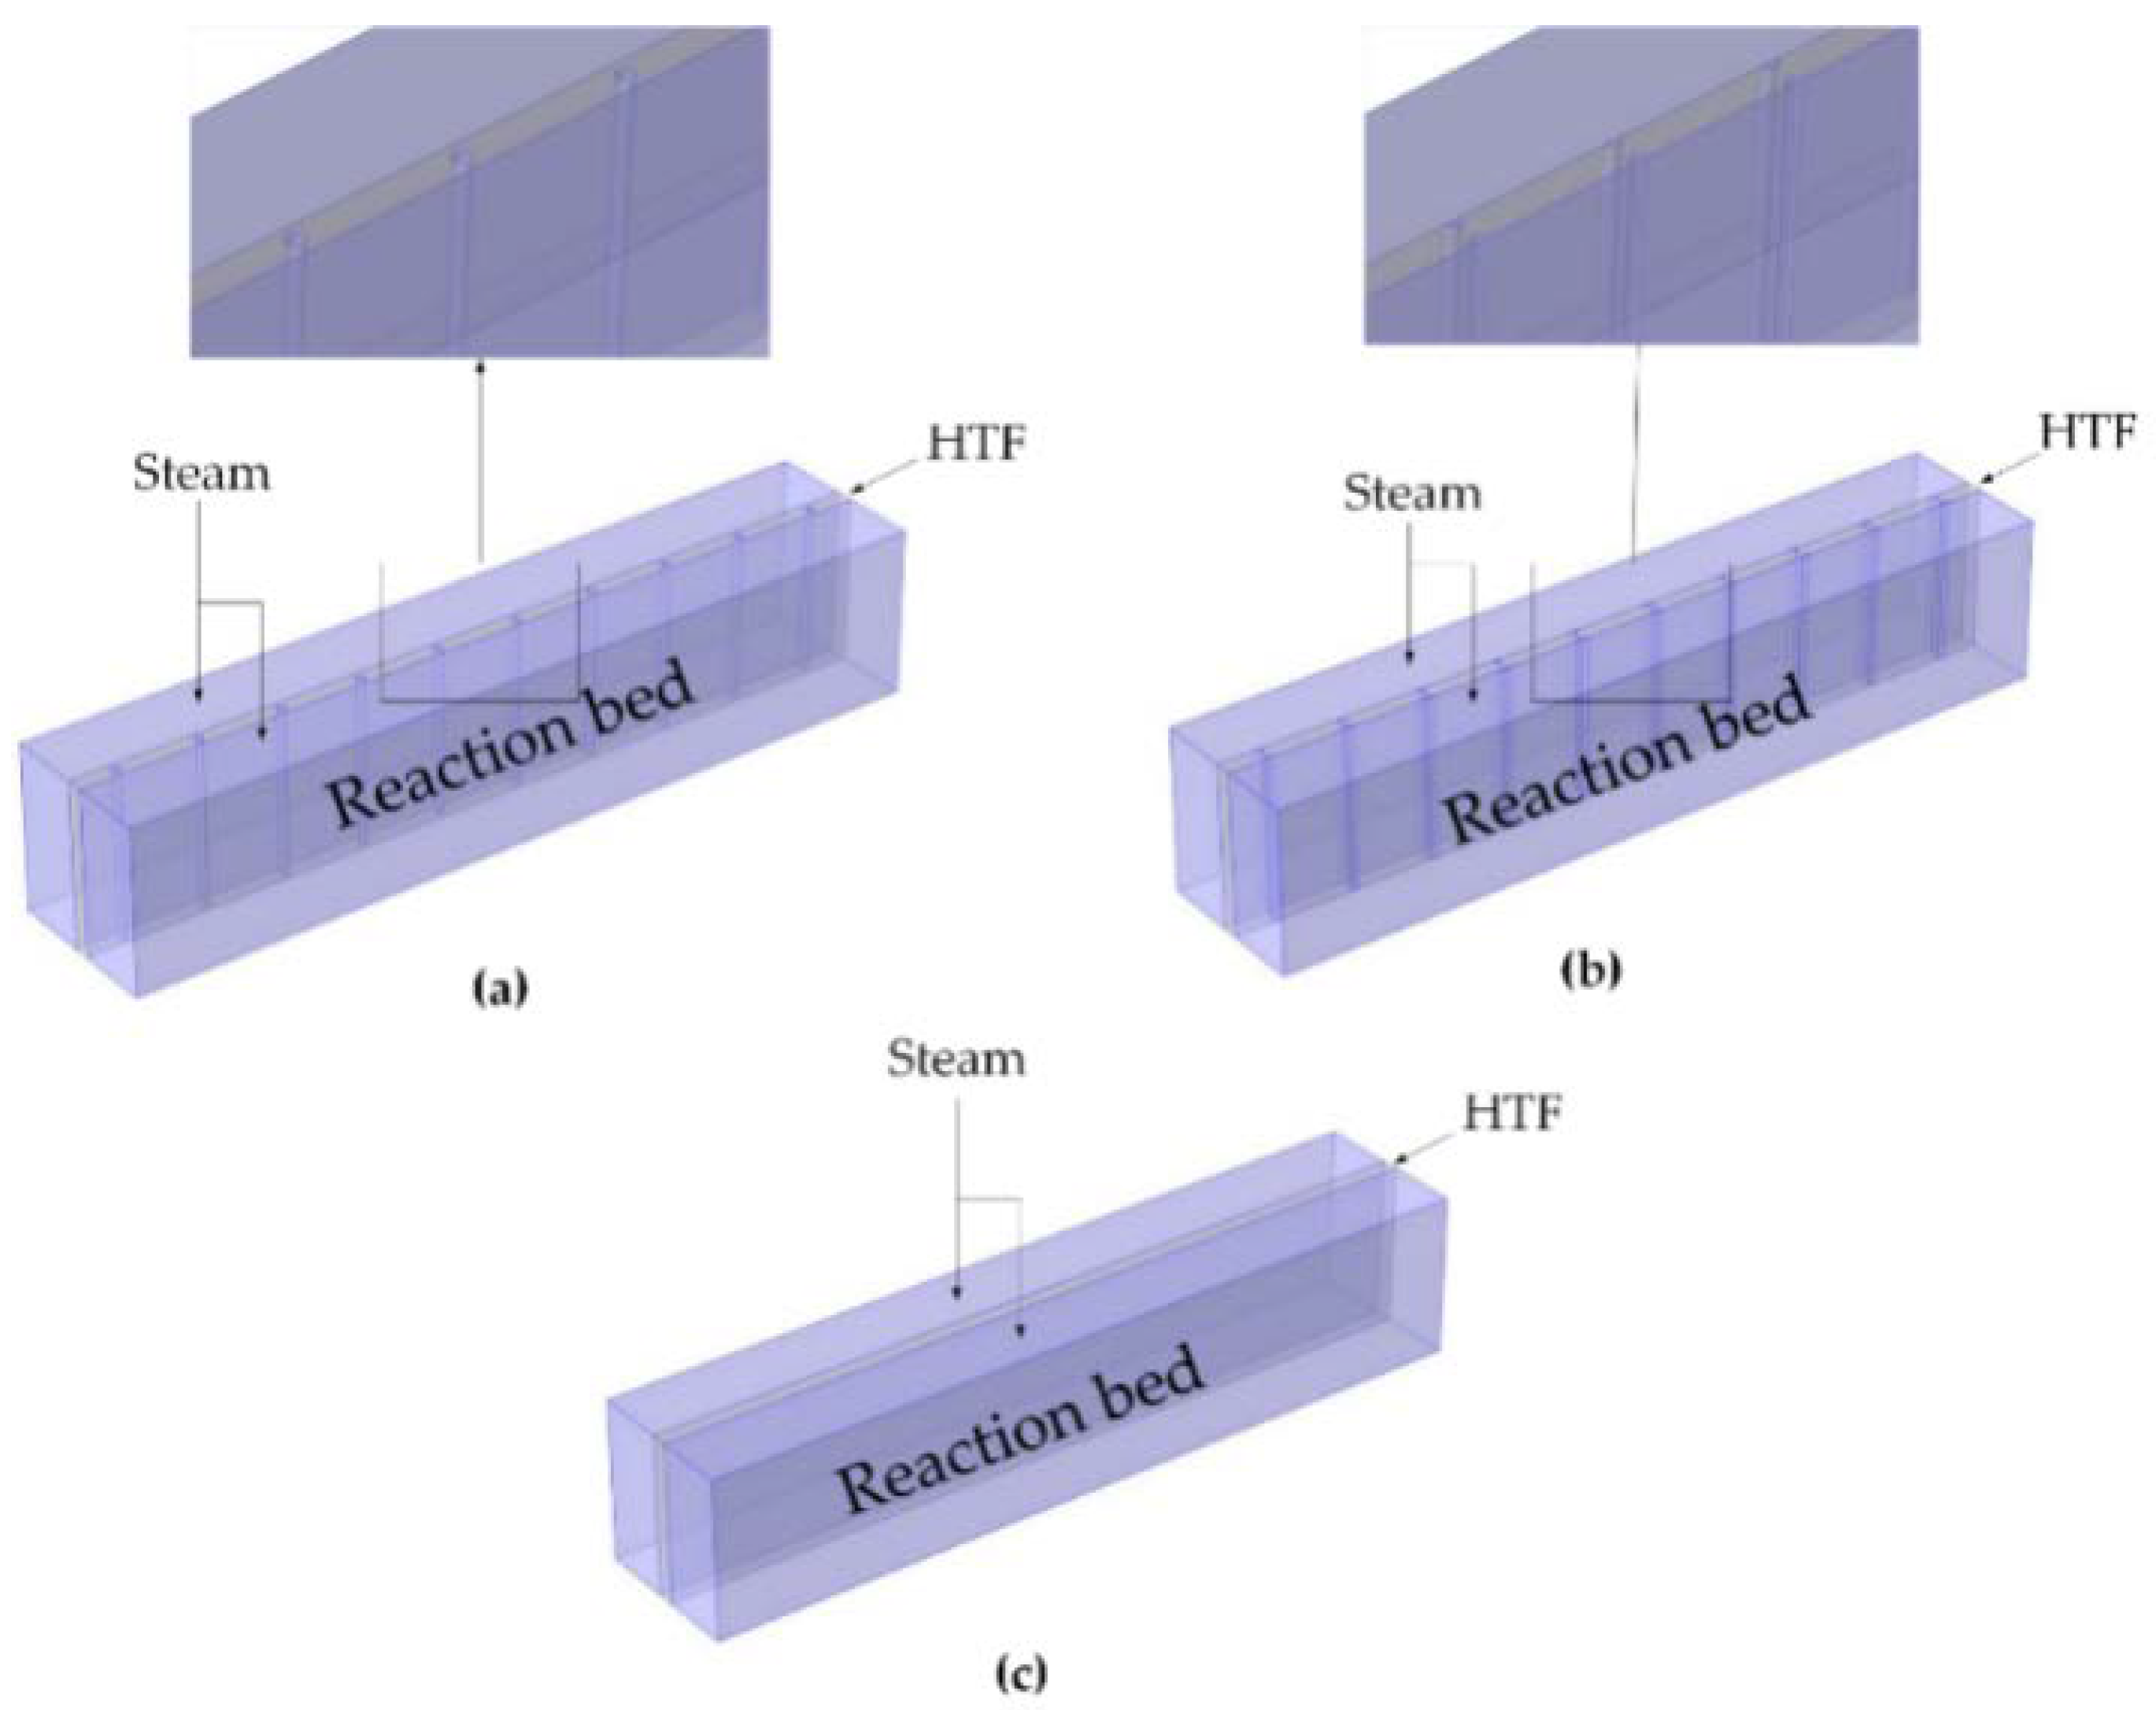
2.1. Reactor Geometry and Hypothesis
- The porous bed was treated as a continuum, and the reaction bed porosity remained constant in the dehydration/hydration process;
- The effective thermal conductivity was constant;
- The density of the reactant solid changed with the conversion of the reactant;
- The specific heat at constant pressure changed with temperature;
- The fluid flow of HTF was the two-dimensional steady state flow at different temperature and pressures.
2.2. Mathematical Model
3. Results and Discussion
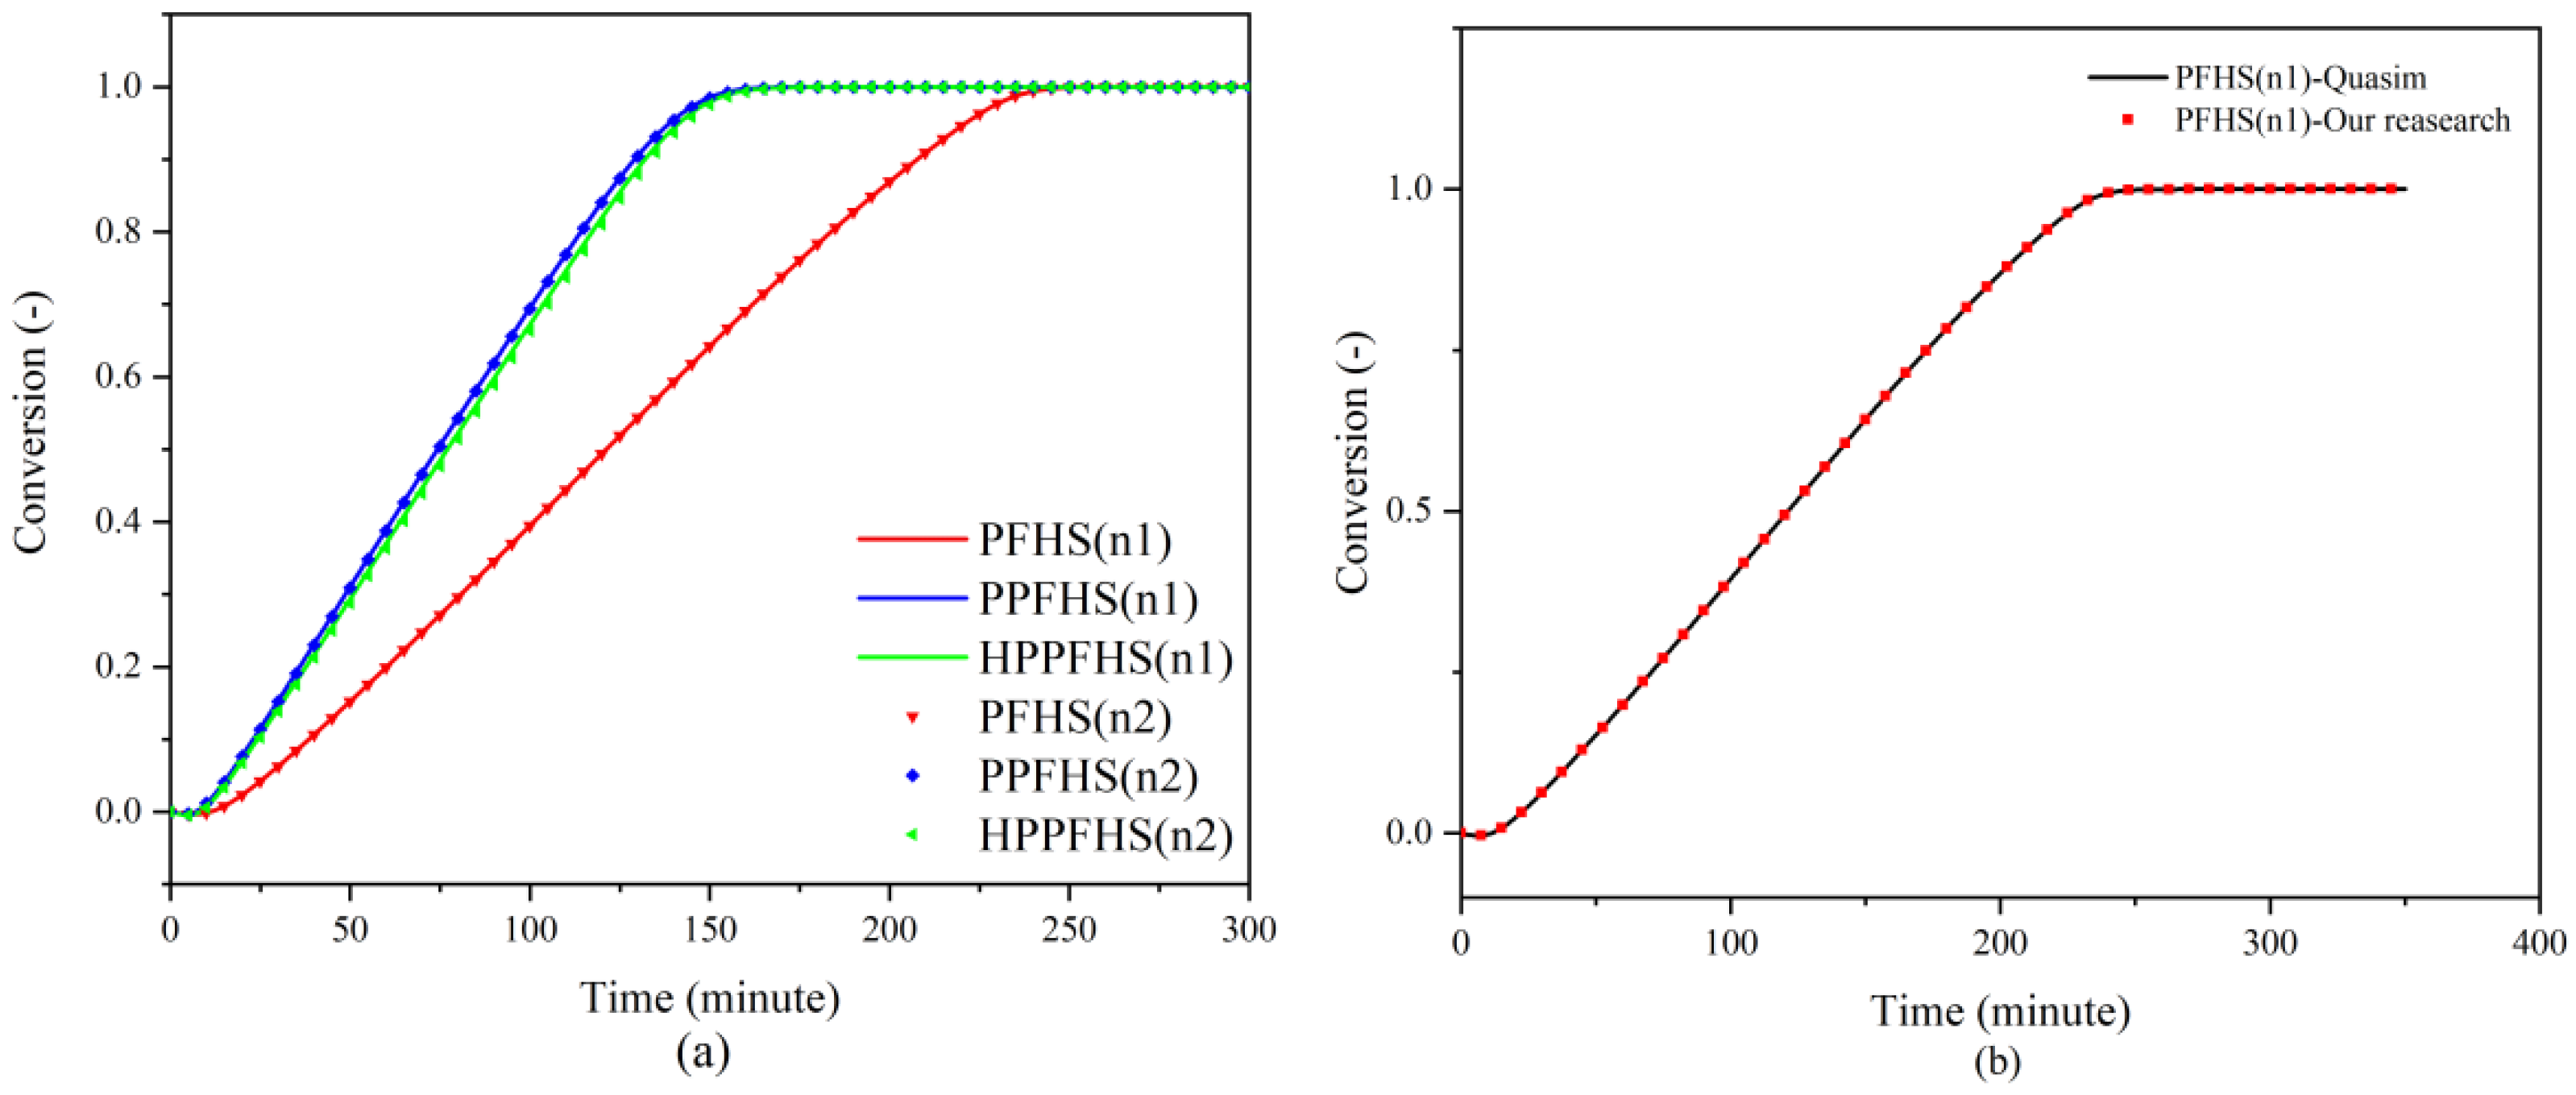
3.1. Mesh and Numerical Model Analysis
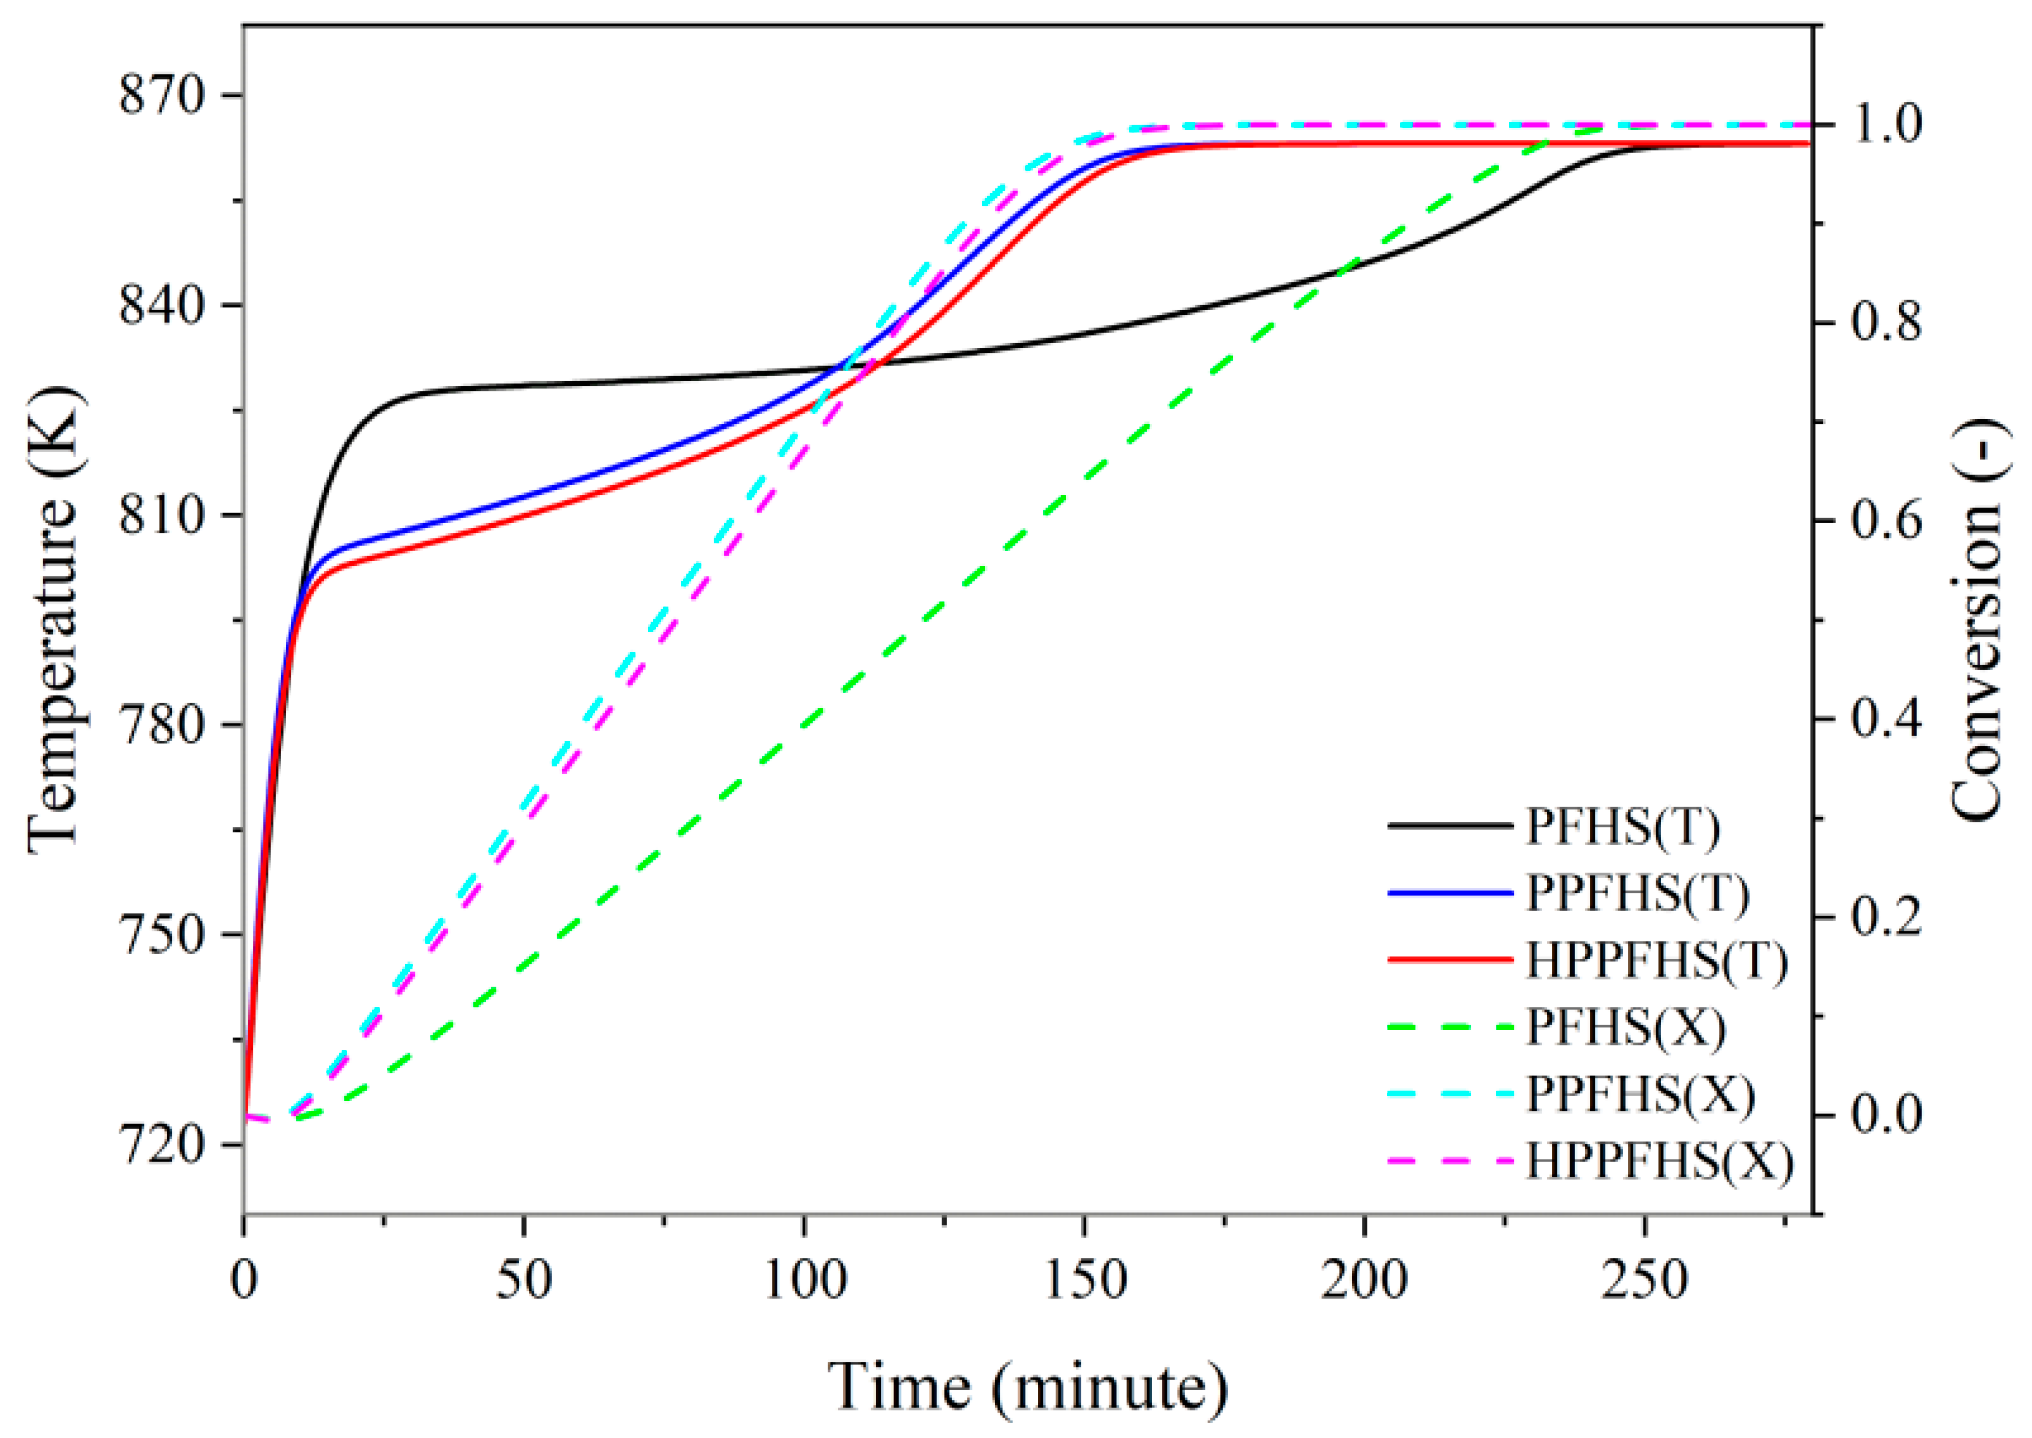
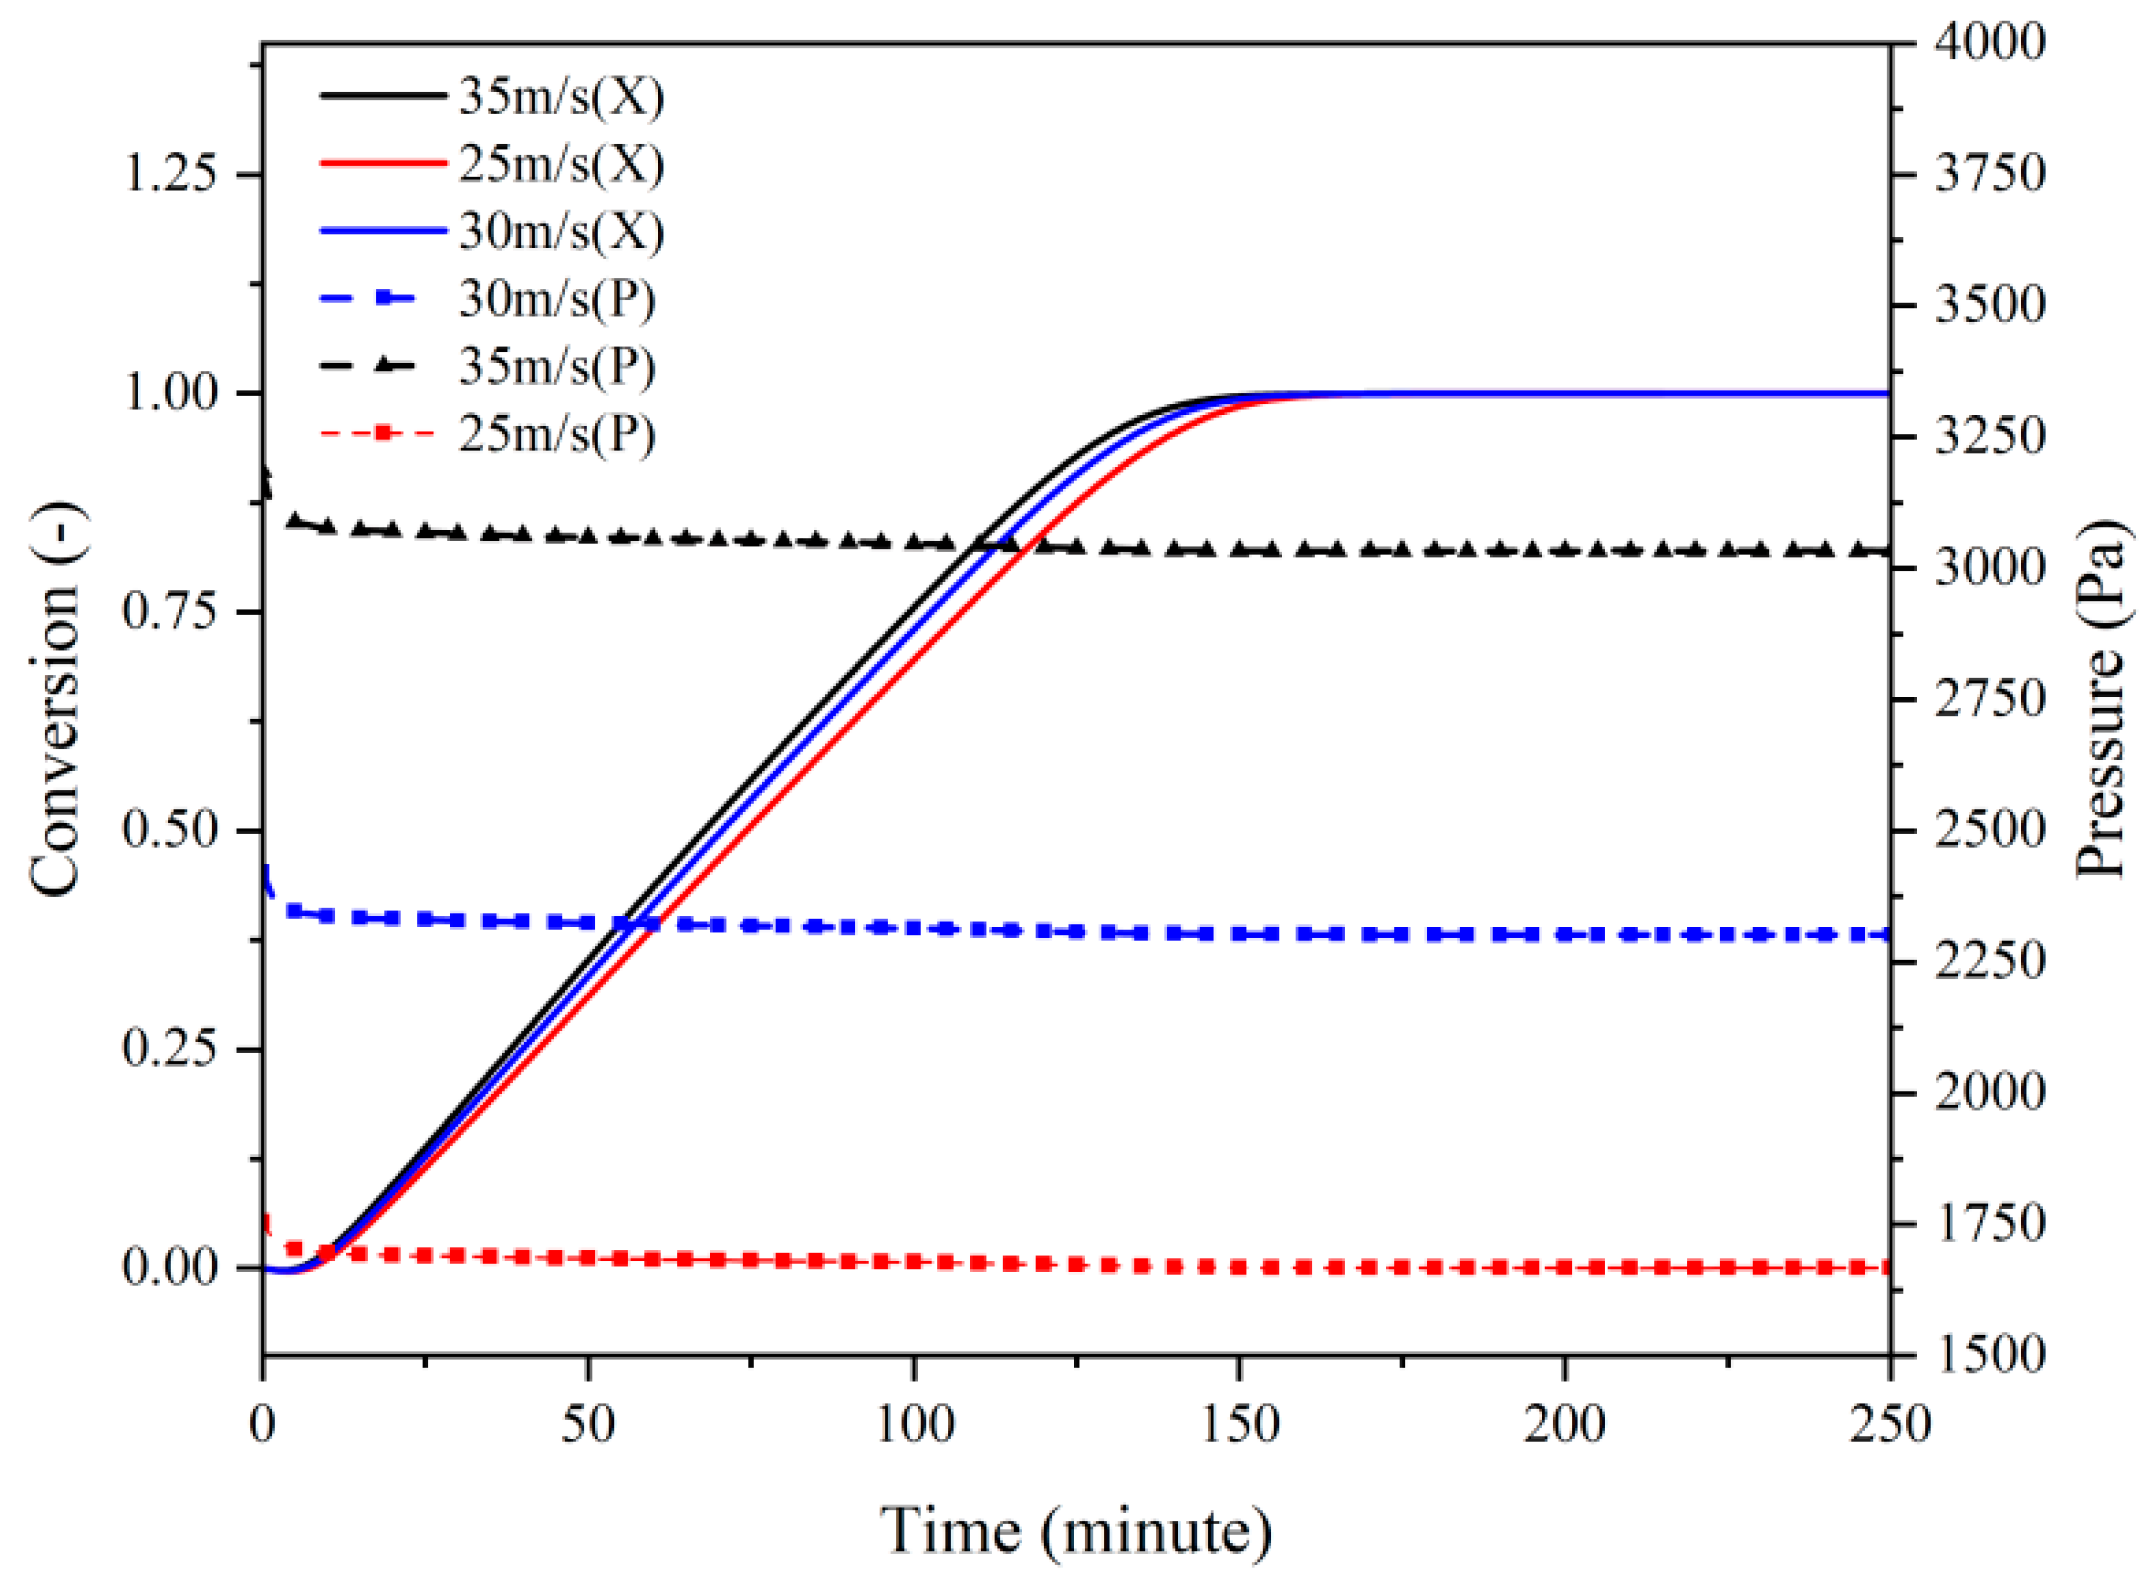
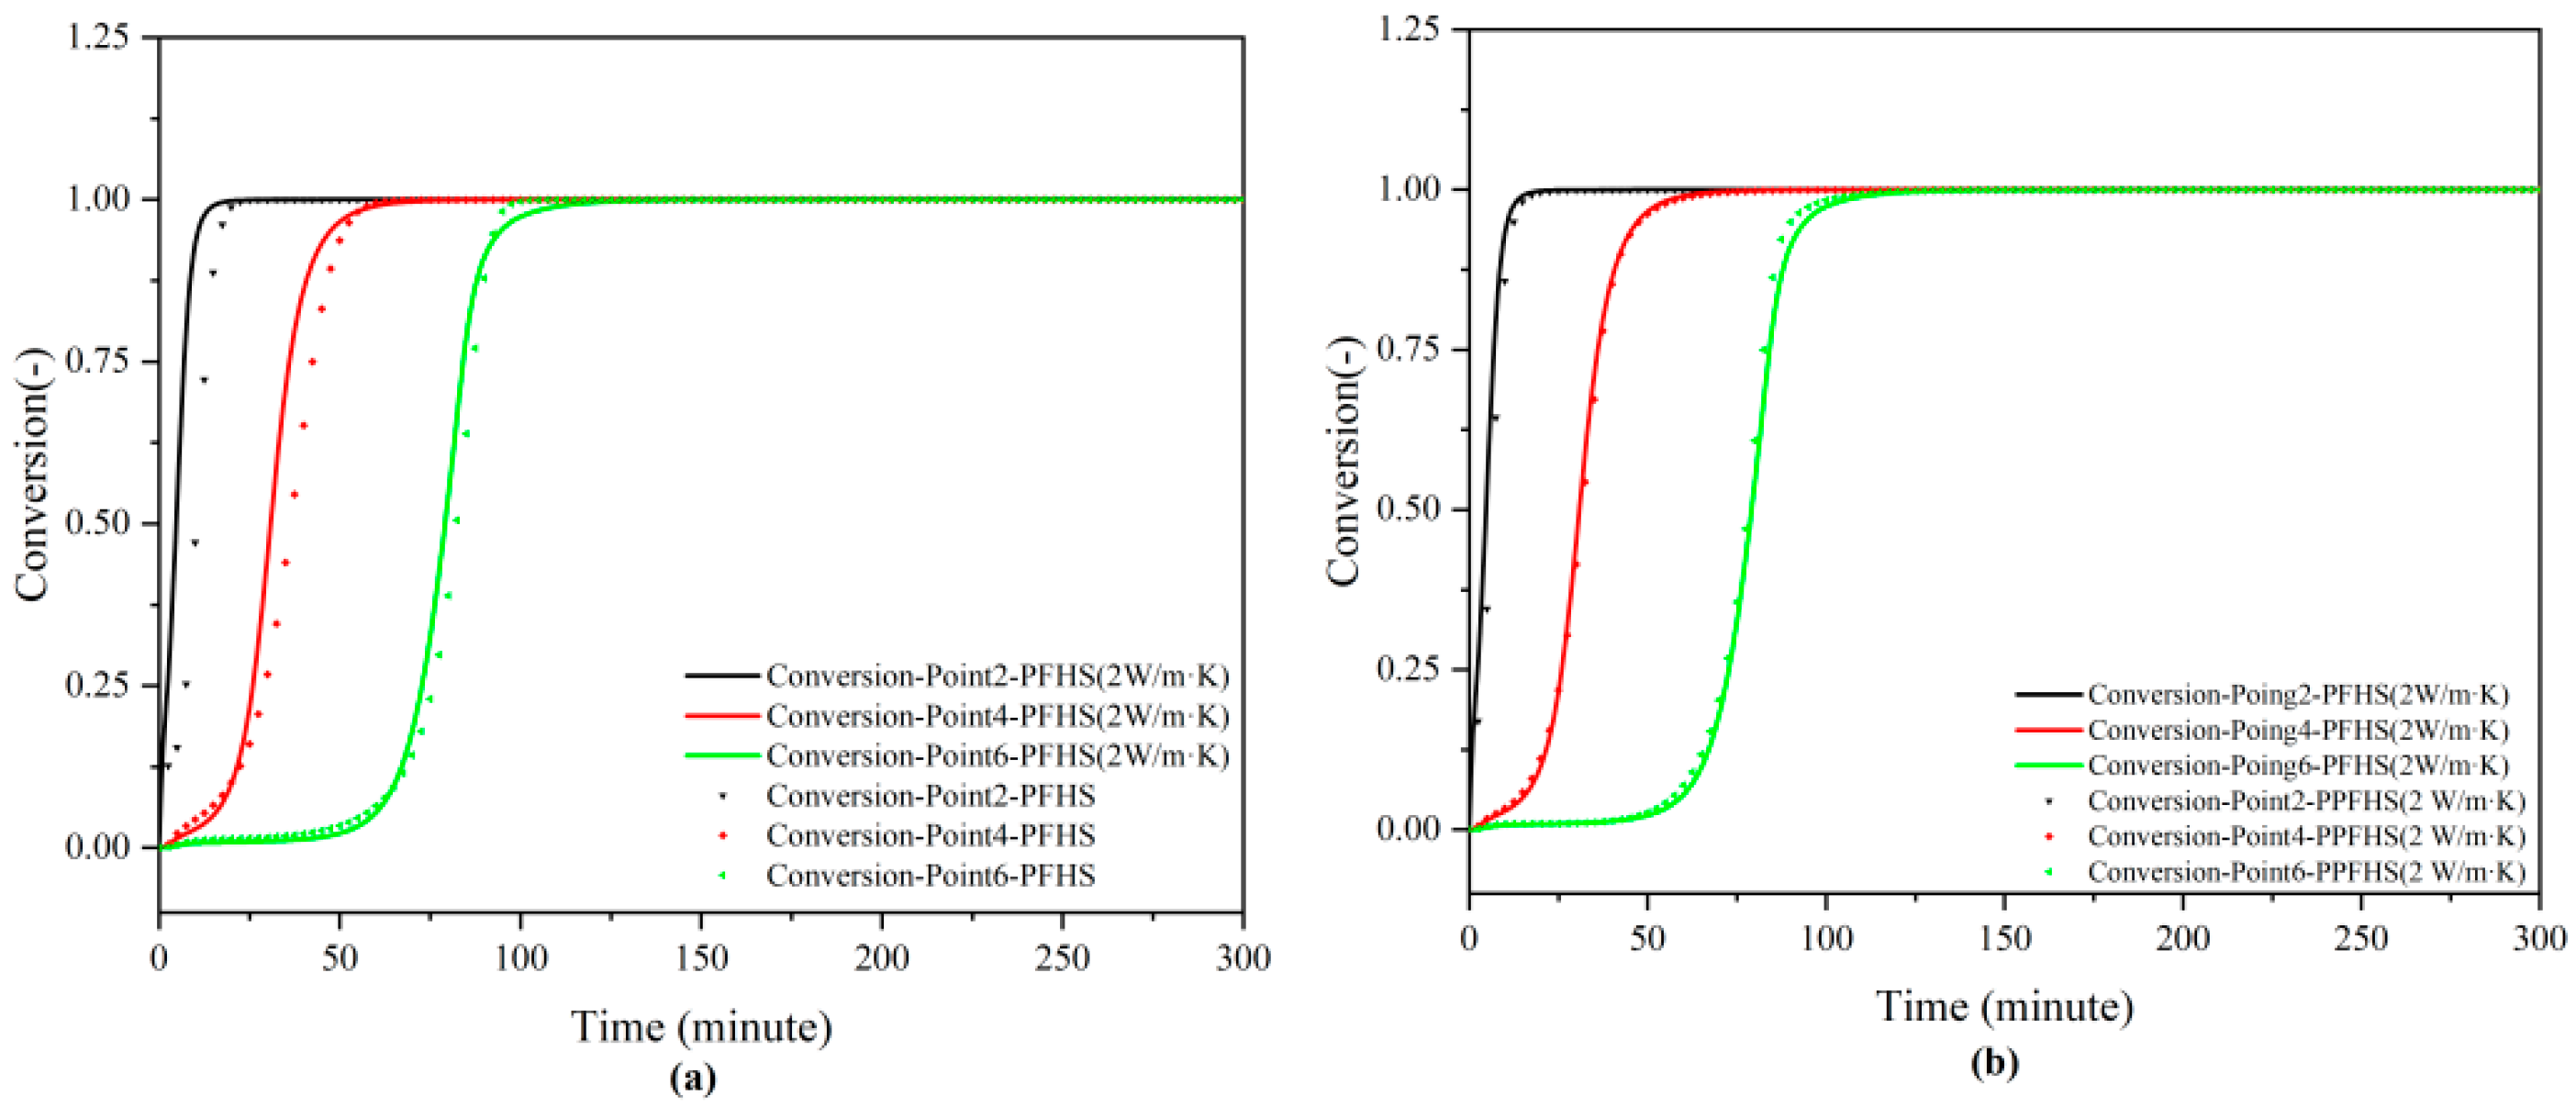
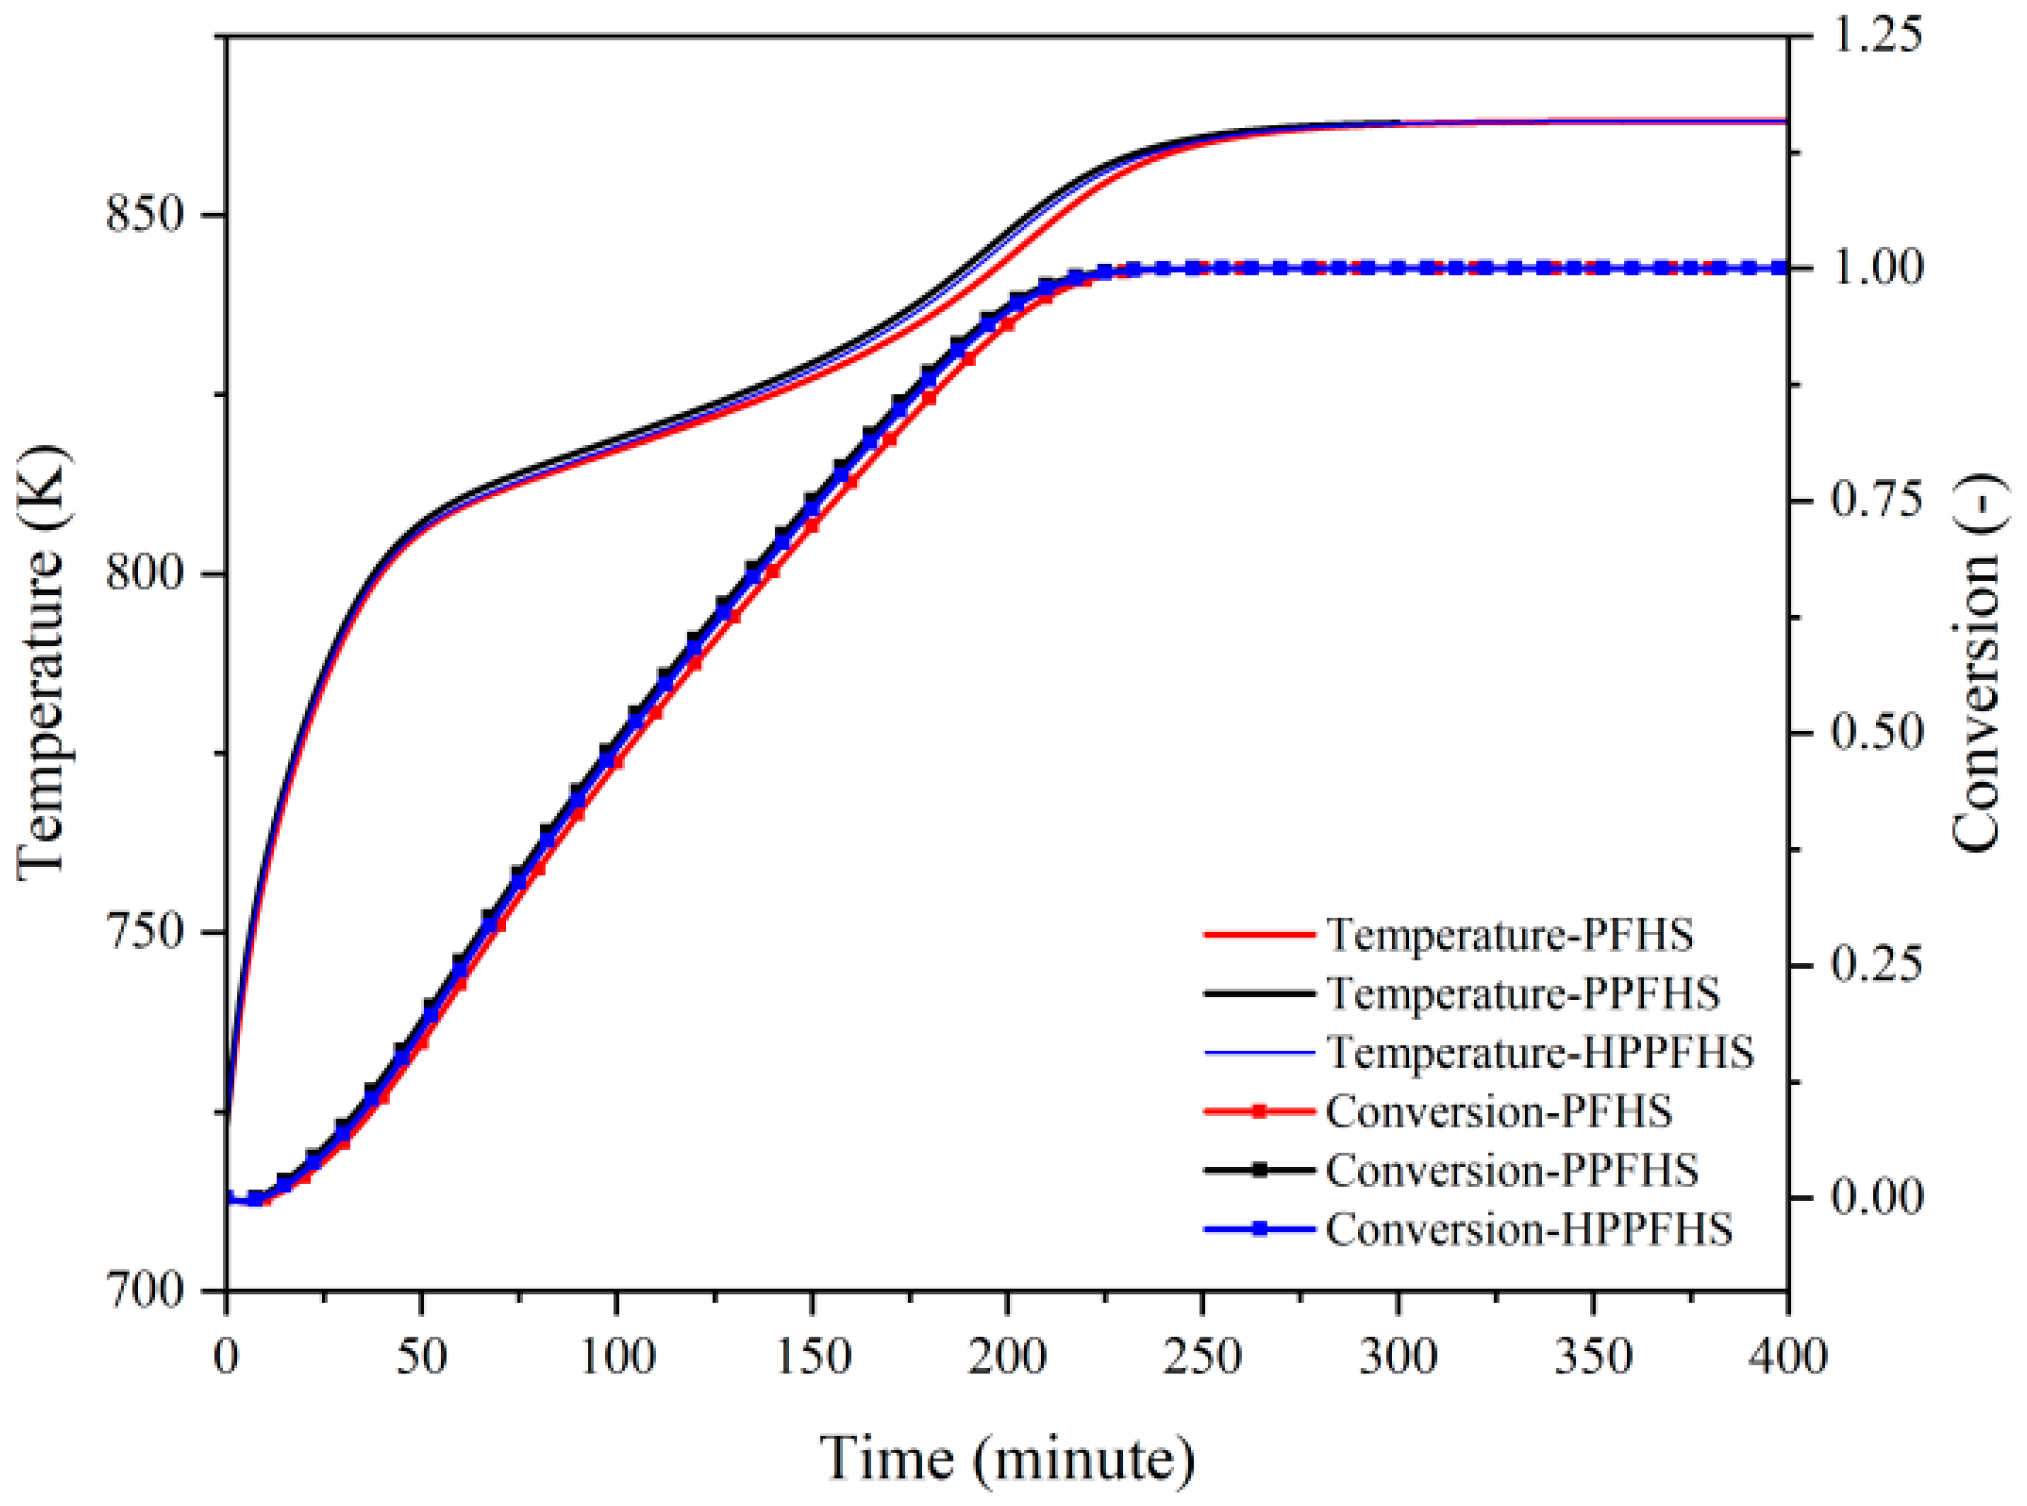
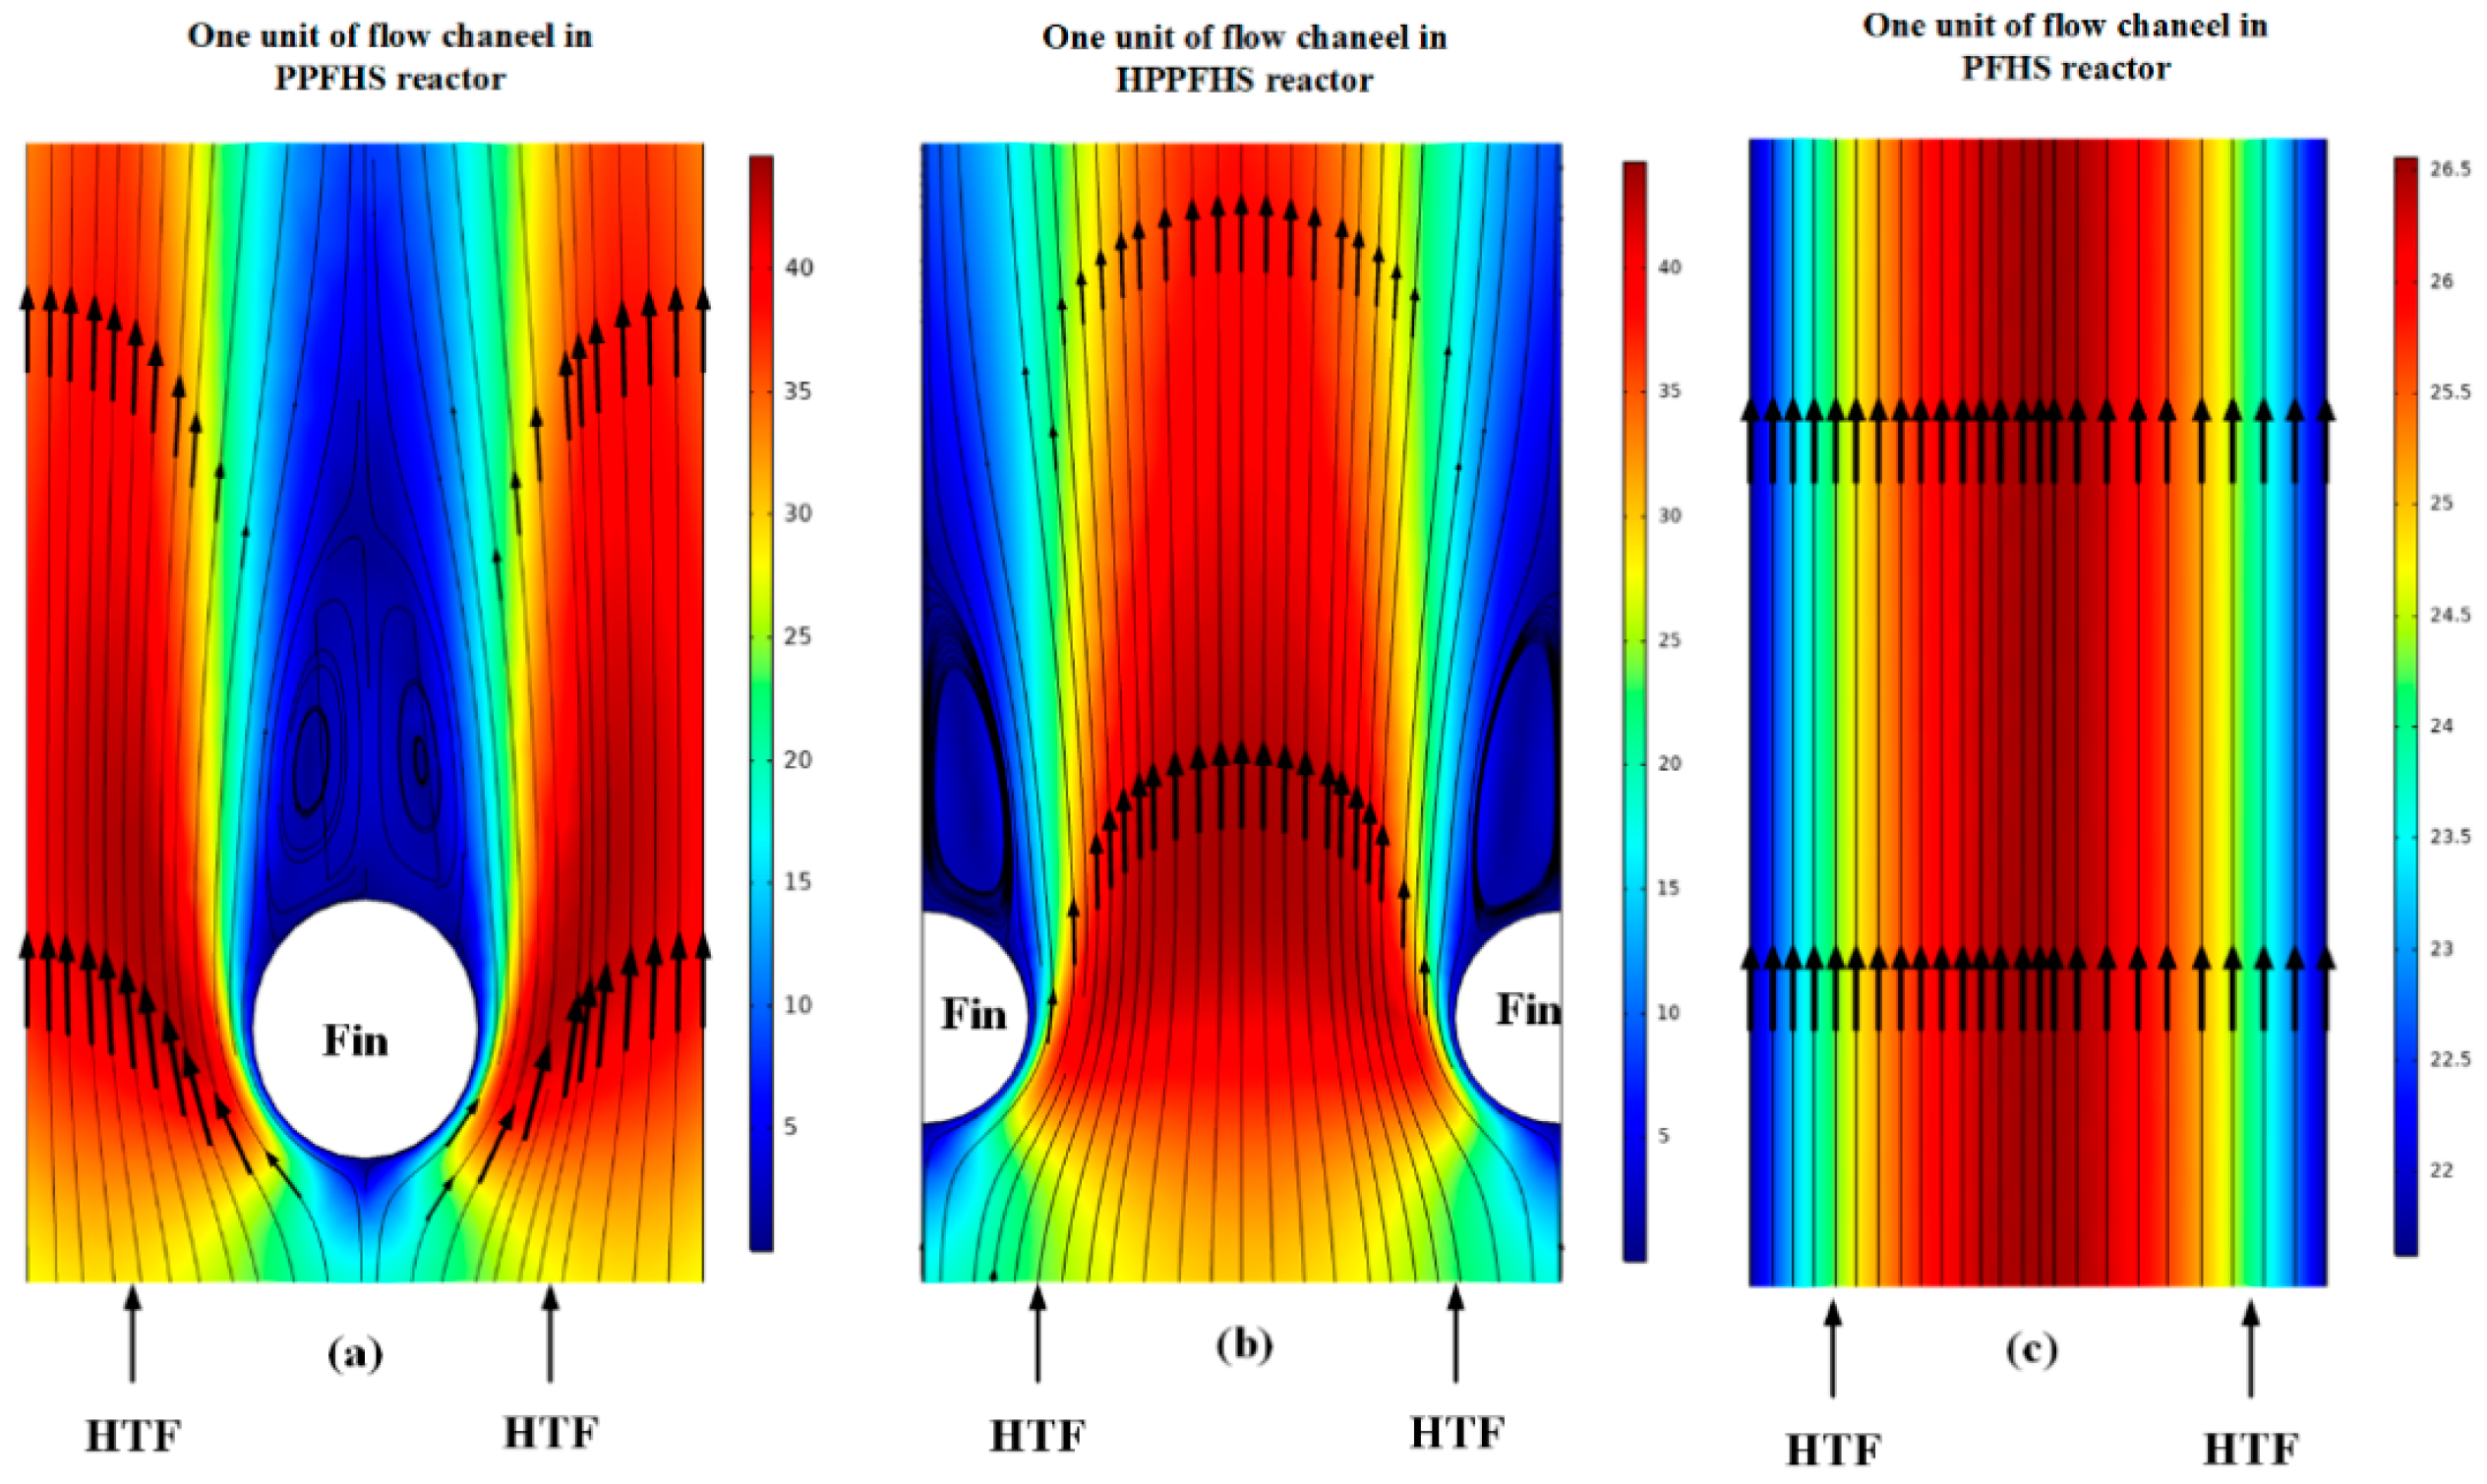
3.2. Heat Transfer and Hydrodynamics Analysis
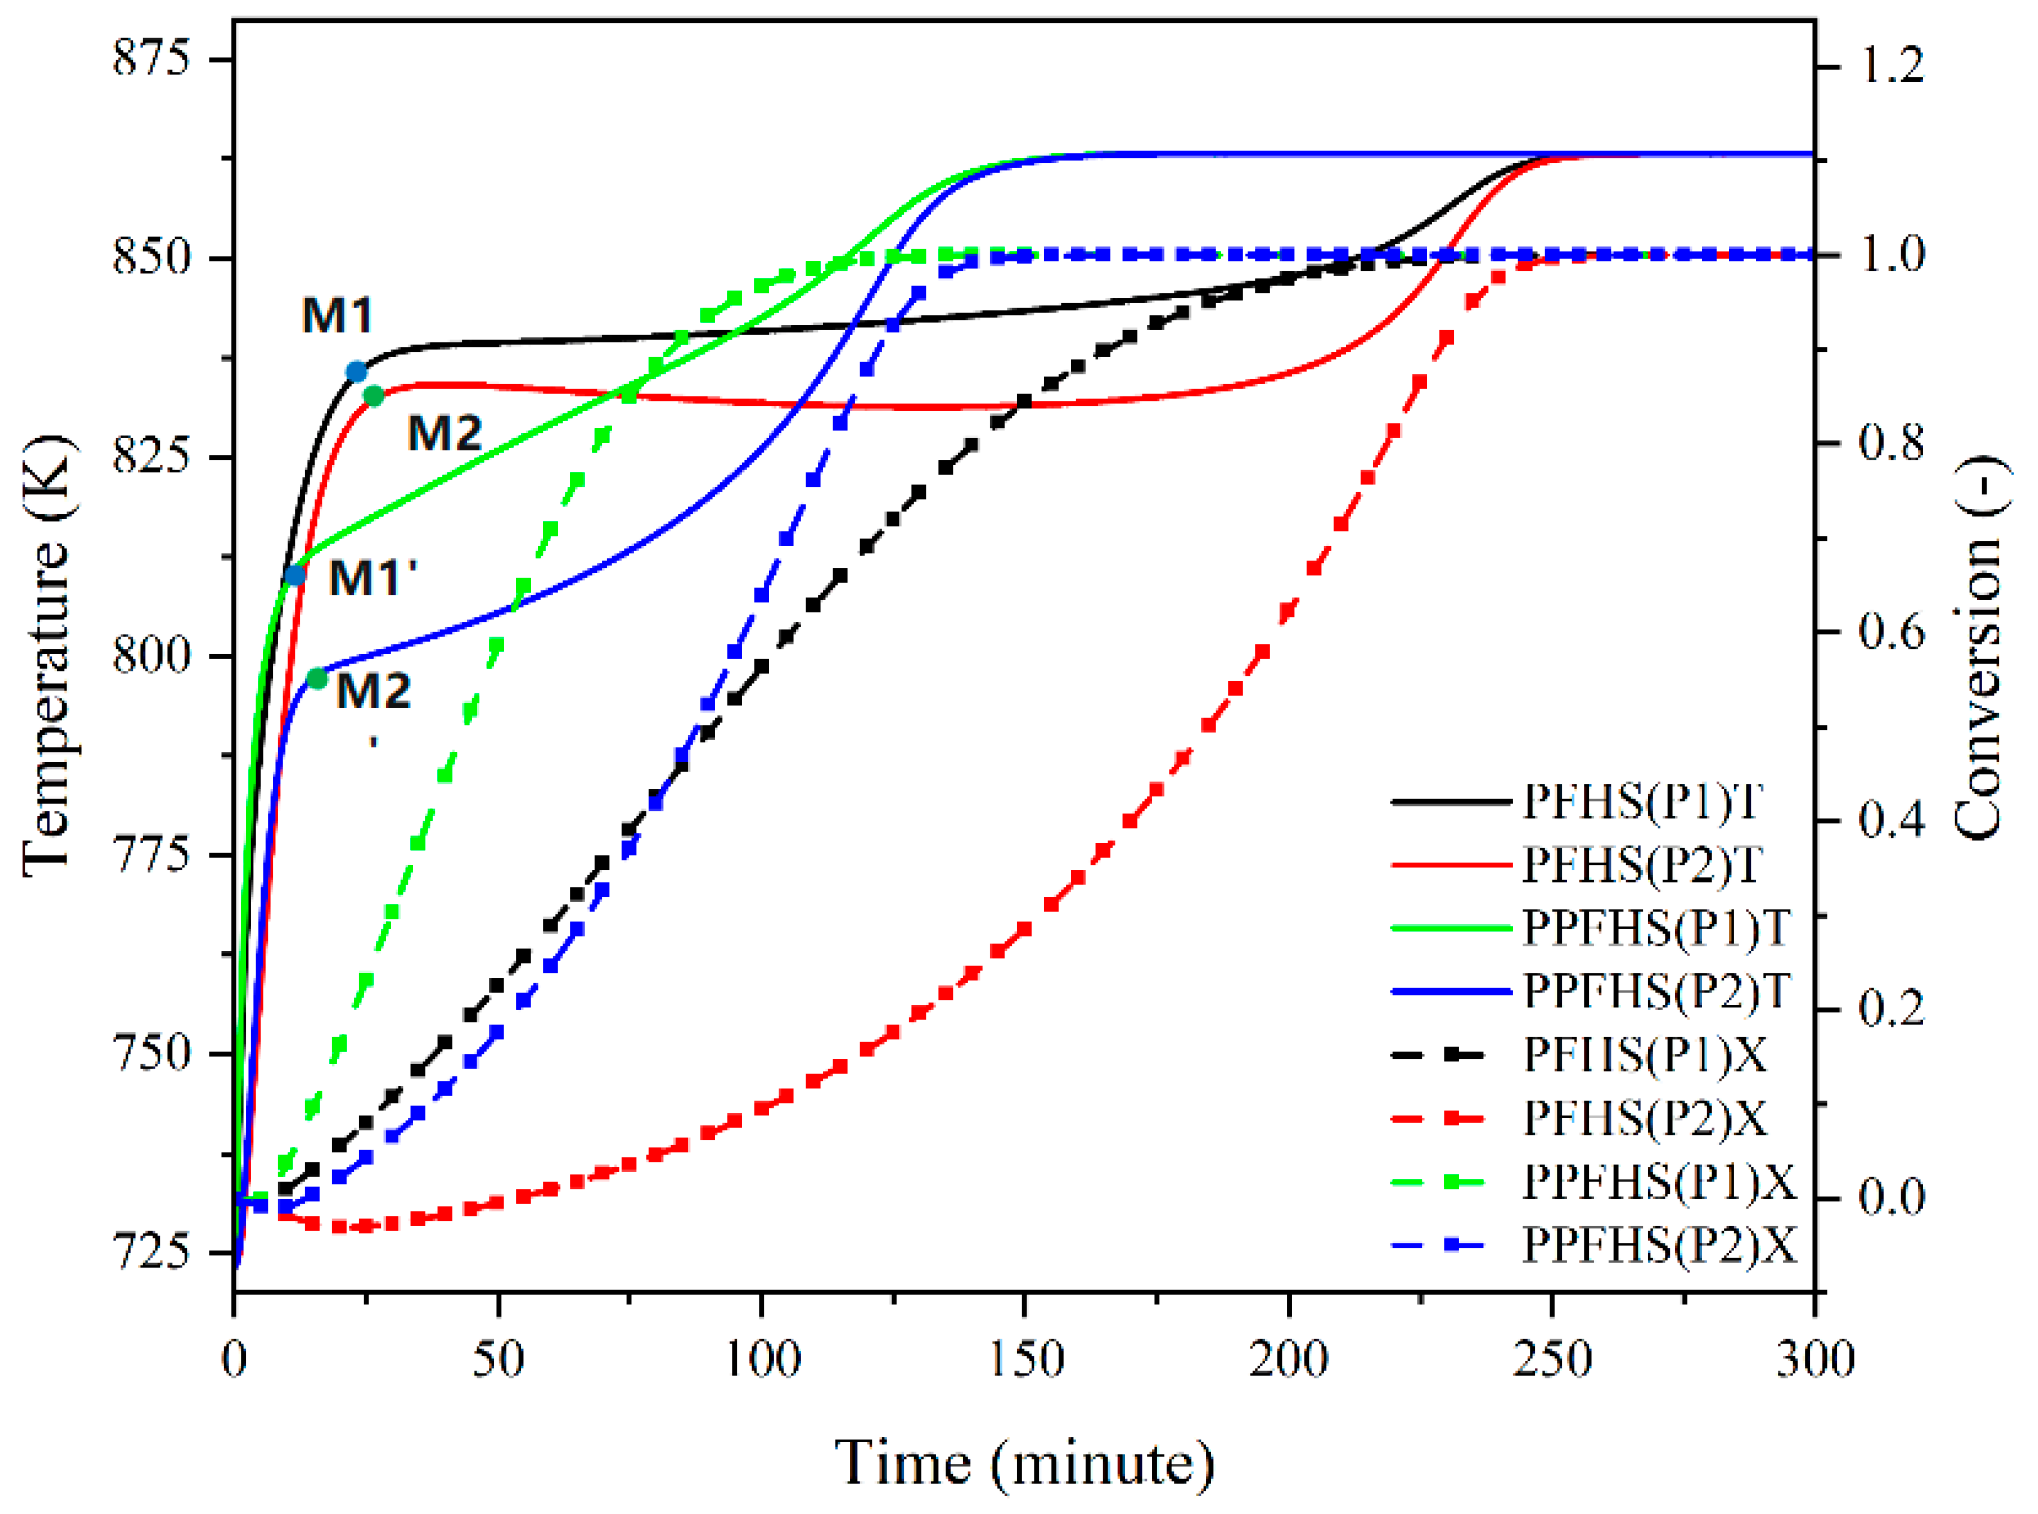
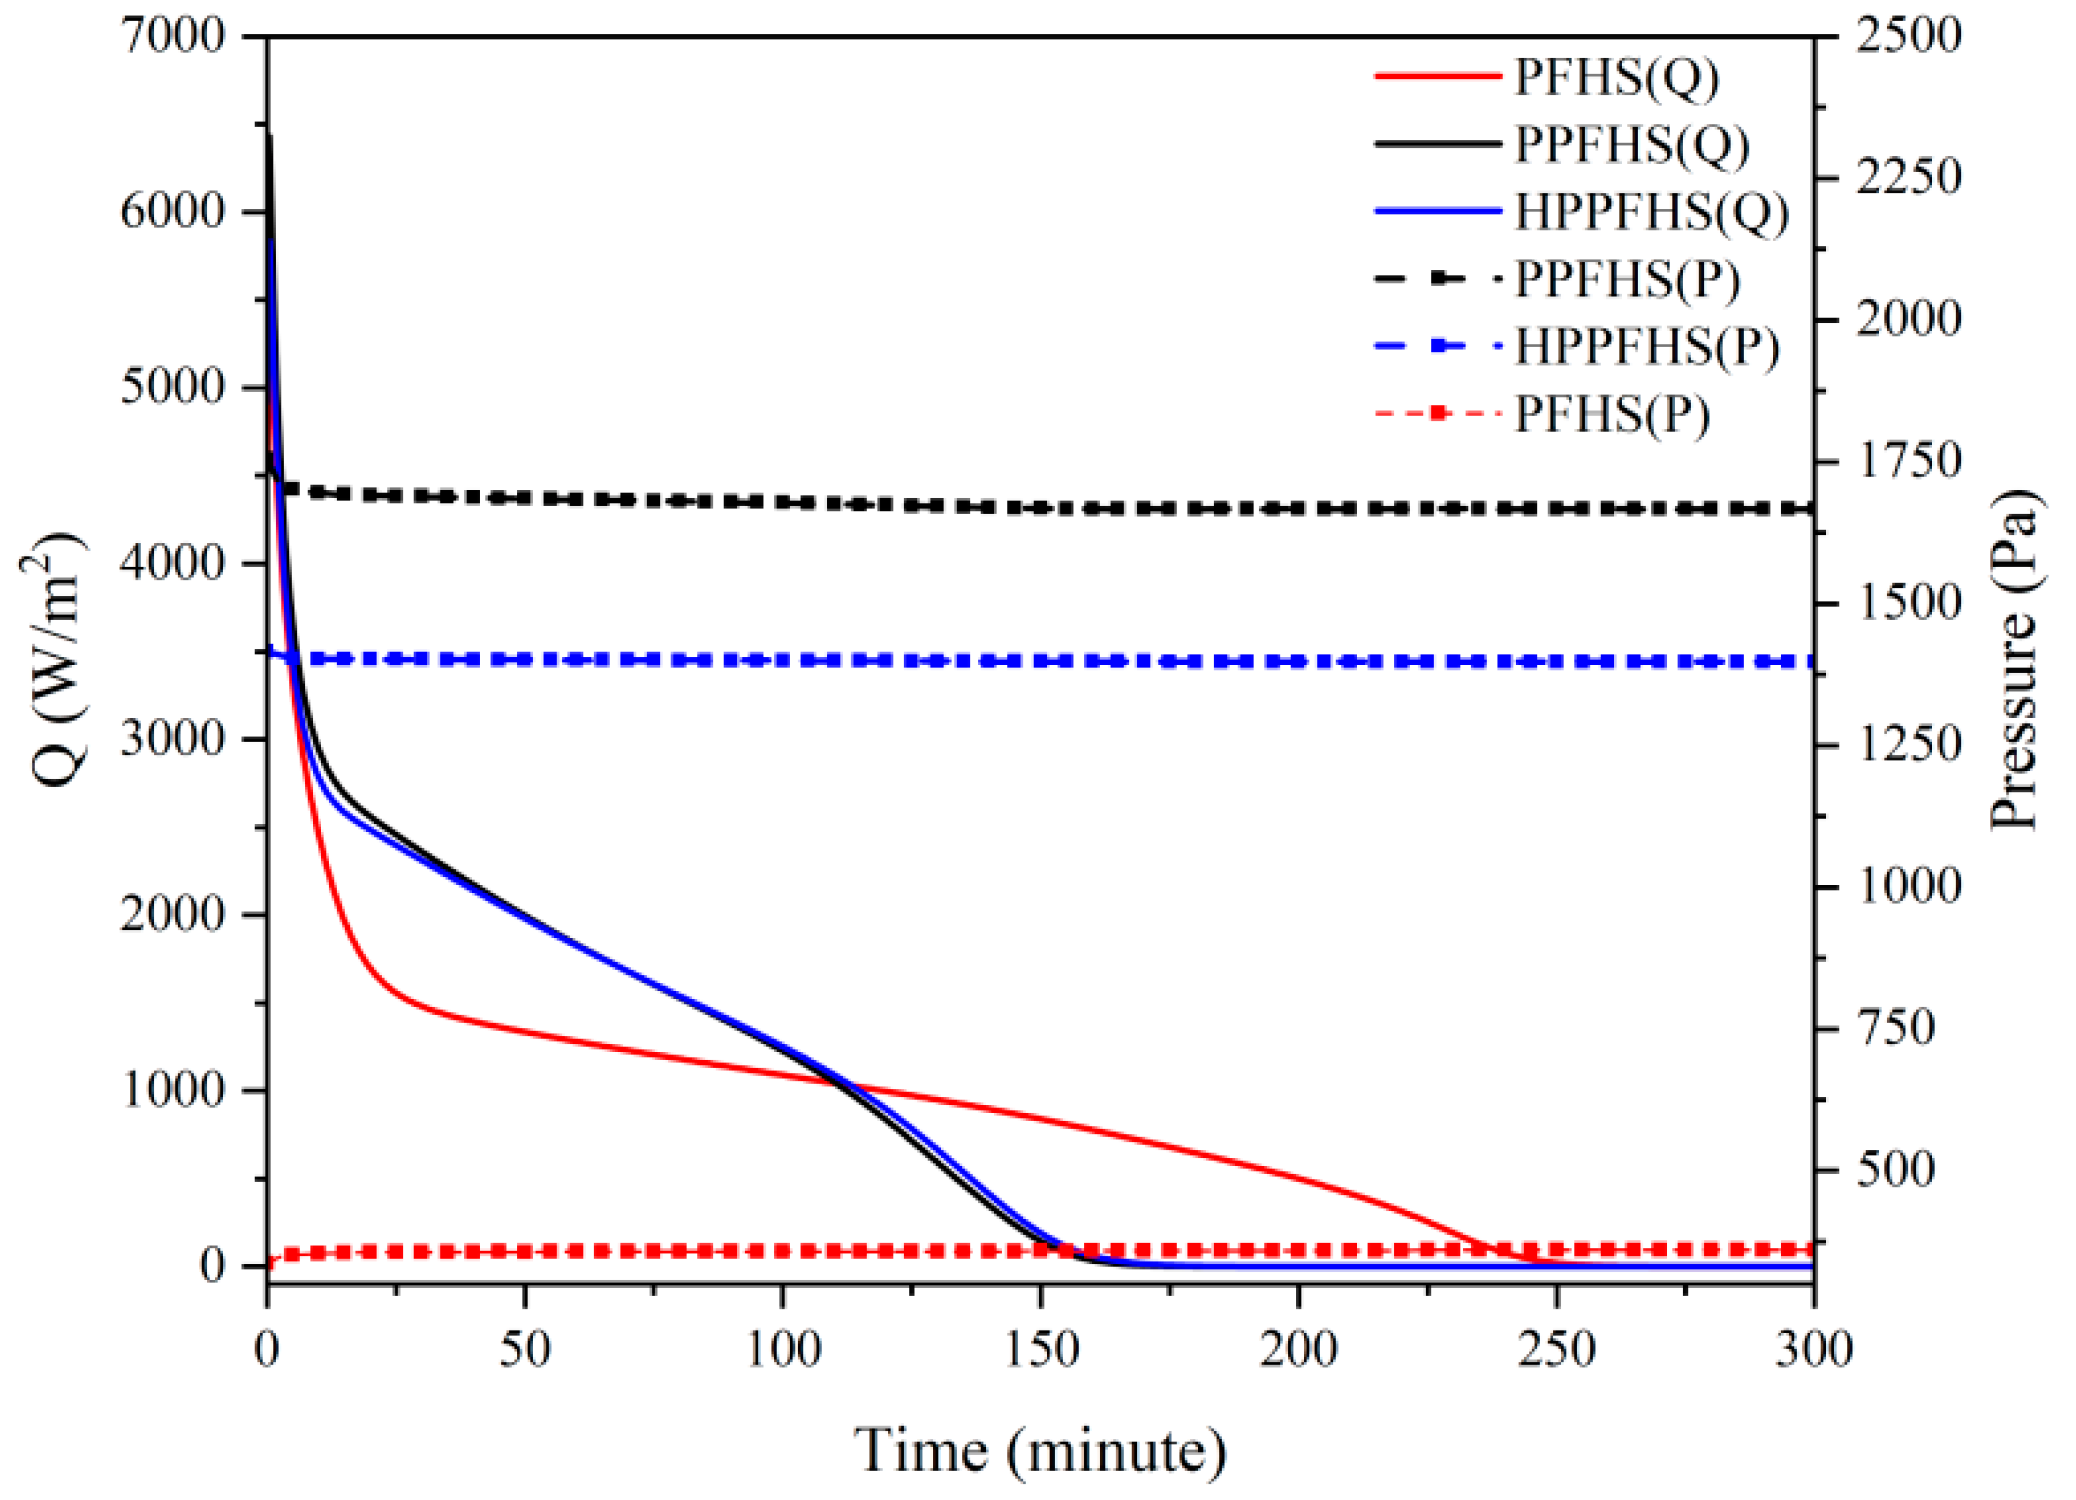
3.2.1. Dehydration
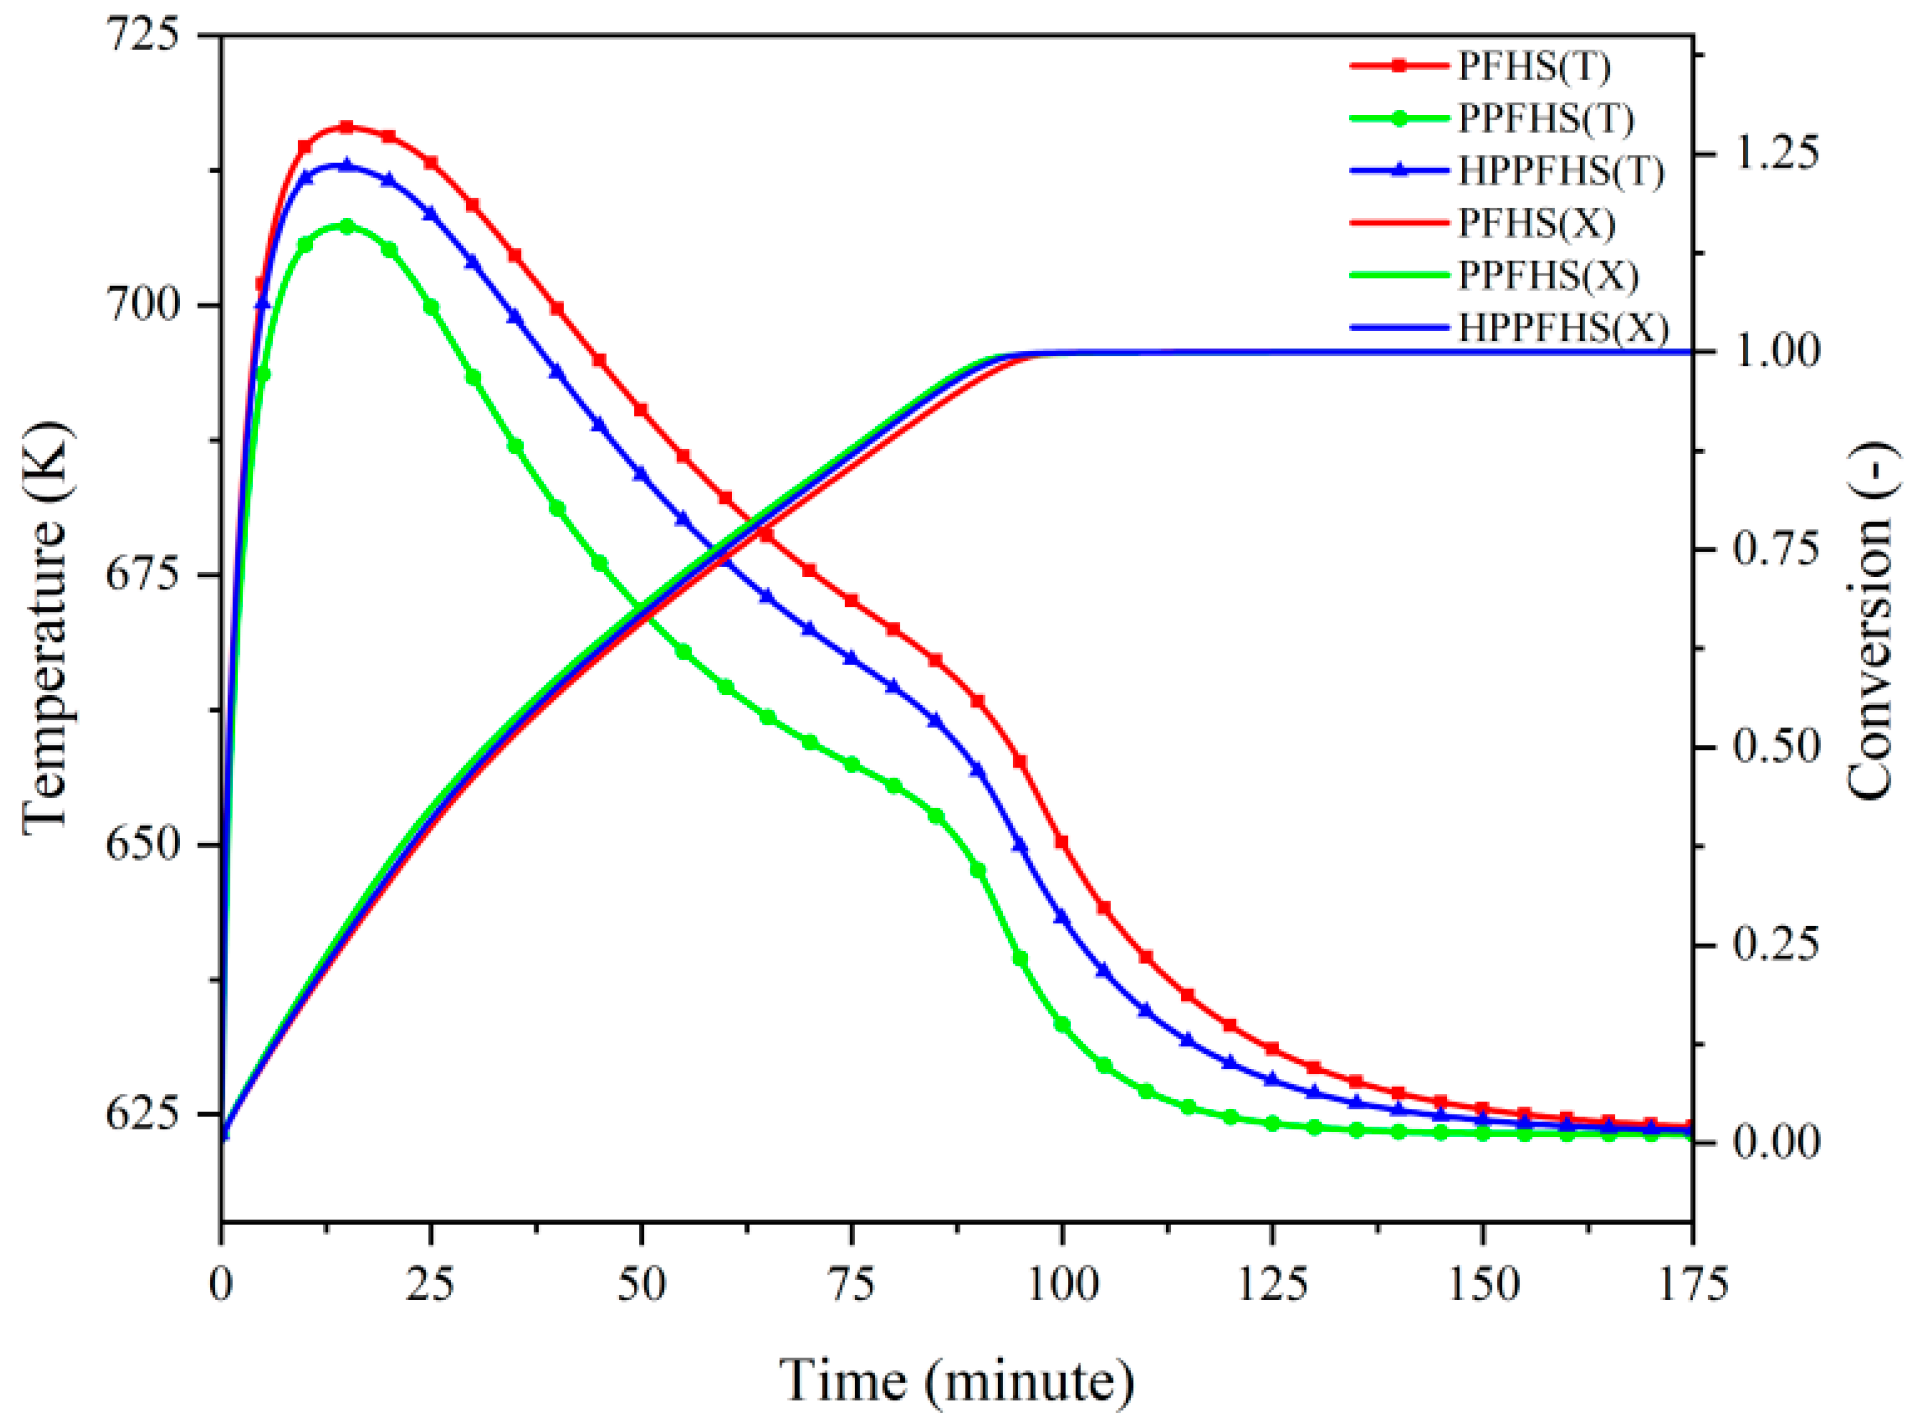
3.2.2. Hydration
3.2.3. Porosity
4. Conclusions
Author Contributions
Funding
Data Availability Statement
Acknowledgments
Conflicts of Interest
Nomenclature
| Acronyms | |
| PFHS | plate fin heat sinks |
| PPFHS | plate pin fin heat sinks |
| HPPFHS | half-plate pin fin heat sinks |
| PFHS (2 W/m·K) | plate fin heat sinks with extra heat conduction |
| PPFHS (2 W/m·K) | plate pin fin heat sinks with extra heat conduction |
| TCES | thermochemical energy storage |
| D | dehydration |
| H | hydration |
| HTF | heat transfer fluid |
| Symbol | |
| A | Pre-exponential factor(1/s) |
| C | Specific heat, J/(kg·K) |
| E | Activation energy(J/mol) |
| ΔH | Enthalpy of reaction(J/mol) |
| K | Permeability |
| M | Molar mass(kg/mol) |
| n | Number of mesh elements |
| P | Pressure(Pa) |
| R | Rate of reaction |
| SQ | Heat source(W/m3) |
| Sm | Mass source(kg/(m3 s)) |
| T | Temperature(K) |
| u | Velocity of HTF(m/s) |
| Vrs | Molar density of solid reactant(mol/m3) |
| Mst | molar mass(kg/mol) |
| Wb | Width of porous bed(mm) |
| Wc | Width of flow channel(mm) |
| L | Length of porous bed(mm) |
| ρCaO | Density of CaO(g/cm3) |
| ρCa(OH)2 | Density of Ca(OH)2,(g/cm3) |
| λeff | Effective thermal conductivity of porous bed (W/m∙K) |
| u | Velocity of air at entrance(m/s) |
| Por | Porosity of porous bed |
| r | Radius of cylindrical fins(mm) |
| dp | Diameter of grain(μm) |
| k | turbulent kinetic energy (m2/s2) |
| Ɛ | turbulent energy dissipation rate(m2/s2) |
| Q | heat flux between thin shells and HTF(W/m2) |
| X | Conversion of solid reactant,1 |
References
- Höök, M.; Tang, X. Depletion of fossil fuels and anthropogenic climate change—A review. Energy Policy 2013, 52, 797–809. [Google Scholar] [CrossRef] [Green Version]
- Palacios, A.; Barreneche, C.; Navarro, M.E.; Ding, Y. Thermal energy storage technologies for concentrated solar power—A review from a materials perspective. Renew. Energy 2020, 156, 1244–1265. [Google Scholar] [CrossRef]
- Bravoa, R.; Ortizb, C.; Chacarteguid, R.; Friedrich, D. Hybrid solar power plant with thermochemical energy storage: A multiobjective operational optimization. Energy Convers. Manag. 2020, 205, 112421. [Google Scholar] [CrossRef]
- Thaker, S.; Oni, A.O.; Kumar, A. Techno-economic evaluation of solar-based thermal energy storage systems. Energy Convers. Manag. 2017, 135, 423–434. [Google Scholar]
- Yana, Y.; Wanga, K.; Clougha, P.T.; Anthony, E.J. Developments in calcium/chemical looping and metal oxide redox cycles for high-temperature thermochemical energy storage: A review. Fuel Process. Technol. 2020, 199, 106280. [Google Scholar] [CrossRef]
- Desai, F.; Jenne, S.P.; Muthumar, P.; Rahman, M.M. Thermochemical energy storage system for cooling and process heating applications: A review. Energy Convers. Manag. 2021, 229, 113617. [Google Scholar] [CrossRef]
- Schaube, F.; Utz, I.; Wörner, A.; Müller-Steinhagen, H. De- and rehydration of Ca(OH)2 in a reactor with direct heat transfer for thermo-chemical heat storage. Part B: Validation of model. Chem. Eng. Res. Des. 2013, 91, 865–873. [Google Scholar] [CrossRef]
- Prasad, J.S.; Muthukumar, P.; Desai, F.; Basu, D.N.; Rahman, M.M. A critical review of high-temperature reversible thermochemical energy storage systems. Appl. Energy 2019, 254, 113733. [Google Scholar] [CrossRef]
- Linder, M.; Roßkopf, C.; Schmidt, M.; Wörner, A. Thermochemical energy storage in kW-scale based on CaO/Ca(OH)2. Energy Procedia 2014, 49, 888–897. [Google Scholar] [CrossRef] [Green Version]
- Schaube, F.; Koch, L.; Wörner, A.; Müller-Steinhagen, H. A thermodynamic and kinetic study of the de- and rehydration of Ca(OH)2 at high H2O partial pressures for thermo-chemical heat storage. Thermochem. Acta 2012, 538, 9–20. [Google Scholar] [CrossRef]
- Ogura, H.; Shimojyo, R.; Kage, H.; Matsuno, Y.; Mujumdar, A.S. Simulation of hydration/dehydration of CaO/Ca(OH)2 chemical heat pump for cold/heat generation. Dry. Technol 1999, 17, 1579–1592. [Google Scholar] [CrossRef]
- Ranjha, Q.; Oztekin, A. Numerical analyses of three-dimensional fixed reaction bed for thermochemical energy storage. Renew. Energy 2017, 111, 825–835. [Google Scholar] [CrossRef]
- Funayama, S.; Takasu, H.; Kim, S.T.; Kato, Y. Thermochemical storage performance of a packed bed of calcium hydroxide composite with a silicon-based ceramic honeycomb support. Energy 2020, 201, 117673. [Google Scholar] [CrossRef]
- Ranjha, Q.; Vahedi, N.; Oztekin, A. High-temperature thermochemical energy storage-heat transfer enhancements within reaction bed. Appl. Therm. Eng. 2019, 163, 114407. [Google Scholar] [CrossRef]
- Chen, J.T.; Xia, B.Q.; Zhao, C.Y. Topology optimization for heat transfer enhancement in thermochemical heat storage. Int. J. Heat Mass Transf. 2020, 154, 119785. [Google Scholar] [CrossRef]
- Yu, X.; Feng, J.; Feng, Q.; Wang, Q. Development of a plate-pin fin heat sink and its performance comparisons with a plate fin heat sink. Appl. Therm. Eng. 2005, 25, 173–182. [Google Scholar] [CrossRef]
- Yang, Y.-T.; Peng, H.-S. Investigation of planted pin fins for heat transfer enhancement in plate fin heat sink. Microelectron. Reliab. 2009, 49, 163–169. [Google Scholar] [CrossRef]
- Yuan, W.; Zhao, J.; Tso, C.P.; Wu, T.; Liu, W.; Ming, T. Numerical simulation of the thermal hydraulic performance of a plate pin fin heat sink. Appl. Therm. Eng. 2012, 48, 81–88. [Google Scholar] [CrossRef]
- Wang, C.; Cui, G.; Zhou, G.; Wang, J.; Peng, F. Numerical simulation on heat transfer characteristics of half-plate pin fin heat sink. Semicond. Optoelectron. 2013, 34, 616–620. [Google Scholar]
- Freegaha, B.; Hussaina, A.A.; Faliha, A.H.; Towsyfyan, H. CFD analysis of heat transfer enhancement in plate-fin heat sinks with fillet profile: Investigation of new designs. Therm. Sci. Eng. Prog. 2020, 17, 100458. [Google Scholar] [CrossRef]
- Schmidt, M.; Szczukowski, C.; Roßkopf, C.; Linder, M.; Worner, A. Experimental results of a 10-kW high temperature thermochemical storage reactor based on calcium hydroxide. Appl. Therm. Eng. 2014, 62, 53–559. [Google Scholar] [CrossRef] [Green Version]
- Vyazovkin, S.; Burnham, A.K.; Criado, J.M.; Perez-Maqueda, L.A.; Popescu, C.; Sbirrazzuoli, N. ICTAC kinetics committee recommendations for performing kinetic computations on thermal analysis data. Thermochem. Acta 2005, 520, 1–19. [Google Scholar] [CrossRef]
- Schaube, F.; Worner, A.; Tamme, R. High temperature chemical heat storage for concentrated solar power using gas-solid reactions. J. Sol. Energy Eng. 2011, 3, 111. [Google Scholar]
- Leon, O.; de Mey, G.; Dick, E. Study of the optimal layout of cooling fins in forced convection cooling. Microelectron. Reliab. 2002, 42, 1101–1111. [Google Scholar] [CrossRef]


| Parameter | Symbol | Value |
|---|---|---|
| Width of porous bed | Wb | 15 (mm) |
| Width of flow channel | Wc | 3 (mm) |
| Length of porous bed | L | 200 (mm) |
| Density of CaO [7,18] | ρCaO | 1.666 (g/cm3) |
| Density of Ca(OH)2 [7,18] | ρCa(OH)2 | 2.200 (g/cm3) |
| Reaction enthalpy | ∆H | 104,000 (J/mol) |
| Pre-exponential factor dehydration [7] | Ad | 715 × 107 (1/s) |
| Activation energy of dehydration [7] | Ed | 187 × 103 (J/mol) |
| Pre-exponential factor hydration [7] | Ah | 53 × 103 (1/s) |
| Activation energy of hydration [7] | Eh | 83 × 103 (J/mol) |
| Effective thermal conductivity of reactant solid [18] | λeff | 0.4, 0.1 (W/m·K) |
| Velocity of air at entrance | u | 25, 30, 35 (m/s) |
| Porosity [18] | ε | 0.5, 0.8 |
| Radius of cylindrical fins | r | 0.5 (mm) |
| Diameter of grain [6] | dp | 5 (μm) |
| Boundary/Initial Conditions | Description |
|---|---|
| Tbed(x,y,t = 0) = THTF(x,y,t = 0) = 623.15 K | Initial temperature of hydration |
| Tbed(x,y,t = 0) = THTF(x,y,t = 0) = 723.15 K | Initial temperature of dehydration |
| Tin/D = 863.15 K, Tin/H = 623.15 K | Inlet temperature of HTF for dehydration and hydration |
| q (x, ±(1/2Wc + Wb), t) = q(L,y,t) = q(0,y,t) = 0 | Adiabatic boundary |
| u (0, −1/2Wc < y < 1/2Wc, t) = 25,30,35 m/s | Velocity of HTF at entrance |
| At y = ±1/2Wc | No-slip of walls |
| PD (x,y,t = 0) = 13,300 Pa,PH(x,y,t = 0) = 3000 Pa | Initial partial pressure of steam for dehydration and hydration |
| PD (0, y, t) = 13,300 Pa | Steam pressure at outlet for dehydration |
| PH (0, y, t) = 198,000 Pa | Steam pressure at inlet for hydration |
| P(x = L,y,t) = P(x,y = ±1/2Wc,t) = P(x,y = ±(Wb + 1/2Wc),t) = 0 | No flux of steam |
| Name | Point.1 | Point.2 | Point.3 | Point.4 | Point.5 | Point.6 |
|---|---|---|---|---|---|---|
| X(mm) | 15 | 15 | 100 | 100 | 185 | 185 |
| Y(mm) | 5 | 10 | 5 | 10 | 5 | 10 |
Publisher’s Note: MDPI stays neutral with regard to jurisdictional claims in published maps and institutional affiliations. |
© 2021 by the authors. Licensee MDPI, Basel, Switzerland. This article is an open access article distributed under the terms and conditions of the Creative Commons Attribution (CC BY) license (https://creativecommons.org/licenses/by/4.0/).
Share and Cite
Wang, B.; Wang, Z.; Ma, Y.; Liang, Y. Heat Transfer Enhancement of Indirect Heat Transfer Reactors for Ca(OH)2/CaO Thermochemical Energy Storage System. Processes 2021, 9, 1136. https://doi.org/10.3390/pr9071136
Wang B, Wang Z, Ma Y, Liang Y. Heat Transfer Enhancement of Indirect Heat Transfer Reactors for Ca(OH)2/CaO Thermochemical Energy Storage System. Processes. 2021; 9(7):1136. https://doi.org/10.3390/pr9071136
Chicago/Turabian StyleWang, Boyan, Zhiyuan Wang, Yan Ma, and Yijing Liang. 2021. "Heat Transfer Enhancement of Indirect Heat Transfer Reactors for Ca(OH)2/CaO Thermochemical Energy Storage System" Processes 9, no. 7: 1136. https://doi.org/10.3390/pr9071136
APA StyleWang, B., Wang, Z., Ma, Y., & Liang, Y. (2021). Heat Transfer Enhancement of Indirect Heat Transfer Reactors for Ca(OH)2/CaO Thermochemical Energy Storage System. Processes, 9(7), 1136. https://doi.org/10.3390/pr9071136