Abstract
In this study, the machine vision and artificial intelligence algorithms were used to rapidly check the degree of cooking of foods and avoid the over-cooking of foods. Using a smart induction cooker for heating, the image processing program automatically recognizes the color of the food before and after cooking. The new cooking parameters were used to identify the cooking conditions of the food when it is undercooked, cooked, and overcooked. In the research, the camera was used in combination with the software for development, and the real-time image processing technology was used to obtain the information of the color of the food, and through calculation parameters, the cooking status of the food was monitored. In the second year, using the color space conversion, a novel algorithm, and artificial intelligence, the foreground segmentation was used to separate the vegetables from the background, and the cooking ripeness, cooking unevenness, oil glossiness, and sauce absorption were calculated. The image color difference and the distribution were used to judge the cooking conditions of the food, so that the cooking system can identify whether or not to adopt partial tumbling, or to end a cooking operation. A novel artificial intelligence algorithm is used in the relative field, and the error rate can be reduced to 3%. This work will significantly help researchers working in the advanced cooking devices.
1. Introduction
In modern society, more and more office workers and women who have no time to cook have increased in employment. Due to changes in the food culture, busyness, or love for food, and other reasons, all three meals are resolved outside. While eating out is convenient and fast, there are problems with high salt, high oil, high sugar, and various food additives, which cause a heavier burden on the cardiovascular system, kidneys, and intestines. Now, more than 50% of people eat out for three meals from Monday to Friday, and not knowing how to cook has become a new social issue. In order to solve the problem of no time or not knowing how to cook, it is easier for people to learn. The industry has launched a series of pots and pans, and small kitchen appliances to help people cook easily at home. For example, the multi-function cooking machine has the functions of weighing, chopping, cooking, grinding, stirring, and other kitchen utensils.
In recent years, products related to multi-function cooking are very popular, such as smart cooking pots, electric hot pots, and food vacuum packaging machines. The cooking pots will stir by themselves, and the cooking machine has developed automation technology to reduce the labor in the food cooking process. However, most of these devices use time sequence control and do not take into account the characteristics of the ingredients. For example, some vegetables are more tender and green, and some vegetables are older due to the late harvest. If the same cooking time is used, the former may be overcooked, and the latter will not be soft enough. Han Li proposed to classify RGB images with color space and color components. Since this study was acquired outdoors, different lighting conditions will affect the results of the processing [1,2]. Francisco J and others analyzed the appearance characteristics of food, through computer vision. This method is based on the subtractive clustering of the human eye perception threshold, which can be successfully applied to food images of different sizes, colors, and textures [3,4]. Khamar Basha Shaik and another five people proposed to use HSV and YCbCr color space to detect skin color. As human skin tone varies from person to person, under uneven lighting conditions, YCbCr is more effective than HSV in the segmentation and detection of image skin colors [5,6].
Image segmentation refers to dividing an image into several non-overlapping areas, based on features such as grayscale, color, texture, and shape, and making these features appear similar in the same area, but obvious differences appear between the different areas. The image segmentation method is as follows [7,8,9,10]:
- Segmentation method based on threshold;
- Edge-based segmentation method;
- Region-based segmentation method;
- Segmentation method based on graph theory;
- Segmentation method based on energy functional.
This research mainly uses a segmentation method based on the graph theory. The GrabCut algorithm was developed by Carsten Rother, Vladimir Kolmogorov, and Andrew Blake of Microsoft Research Cambridge, UK [11,12,13,14]. GrabCut cuts the image to obtain the best configuration, and continuously iterates and optimizes the results. According to the complexity of the scene, the number of iterations needed to obtain a satisfactory result is used. GrabCut is an improved image segmentation algorithm based on GraphCut. It is not based on image morphology, but on the graph cut theory. When using GrabCut, you need to manually specify a certain area of the target or background, and then the algorithm performs segmentation according to the set parameters. GrabCut is more complicated than the watershed algorithm in calculation, so it is more suitable for static images [15,16]. The Gaussian mixture model (GMM) is used to model the background and foreground, and mark the undefined pixels as possible foreground or background [17]. Adaboost is one of the mechanical learning methods. It was proposed by Yoav Freund and Robert Schapire [18]. The number of weak classifiers is customized according to the actual needs. All the weak classifiers are filtered out through the training data, and each weak classifier is passed through. The filter will separate two pieces of data, and the passed data will continue to be filtered to the end, while the weak classifier will separate the target or non-target [19]. Kah-Kay Sung et al. applied to the face frame [20,21,22,23], and Viola and Jones further proposed Haar-like features [24,25,26,27,28,29,30], which use rectangular feature templates for object detection, which are composed of two or more congruent black and white rectangles. The sum of pixels of each rectangle is calculated and the difference is taken, which is the sum of the characteristic values of the white rectangle pixels minus the sum of the black rectangle pixels. If such a rectangle is placed in a non-target area, the calculated feature value will be different from the target feature value. The main purpose of these rectangles is to quantify the feature, and the training data of the feature are supervised learning with labels. Simonyan [31] studied the accurate correlation of the convolutional network depth to large-scale image recognition, using convolutional filters to comprehensively evaluate and analyze the increasing depth of the neural networks, and proposed the concept of the so-called VGG (Visual Geometry Group) neural network; they found that if the convolutional layer is deepened to 16 or 19 layers, the recognition rate will be significantly improved. Yang [32] proposed a VGG16 model based on a fine-tuning model, to perform convolution and filter unnecessary information in the VGG convolution feature, reduce the amount of calculation, and increase the speed of convolution.
The Robotic Kitchen, built by the British Moley Robotics and Shadow Robot, forms a mobile kitchen module, including stoves, ovens, sinks, and tableware; the most important of which is two robotic arms, with joints that are designed to fully replicate the movements of the human arm, record the chef’s cooking movements, and allow the robotic arms to perform exactly the same repetitive implementation, which can complete more than one hundred dishes. However, the cost is not cheap, and it is difficult to enter every family in the short term.
The Robot Kitchen module was exhibited at the Hannover Messe in 2015. The exhibited version did not have a vision system, so the food must be placed in a designated position for the robotic arm to pick up [33]. The vision system is currently being developed, which can automatically identify ingredients, monitor to avoid errors in the cooking process, and conduct quality control after cooking.
MIT has created a fully automatic kitchen, called the Spyce Kitchen, which includes a refrigerator, a dishwasher, a stove, and a robot chef. The machine weighs automatically, and is sent to four pots along the conveyor to stir. When the cooking is complete, the machine pours the food on the plate and automatically cleans the pot. This is conducted through the detector to ensure the temperature and quality of the food.
Japan Fu-A-Men (fully automated ramen) restaurant can cook 80 bowls of ramen every day, which is claimed to be able to perfectly grasp the accuracy of time and the consistency of temperature. The finished product is quite stable, and the flavor of the ramen soup is consistent with the human hands.
This research uses a camera, combined with software for development. It also uses image processing technology for color discrimination, and achieves real-time monitoring of the cooking status of the food through image processing and innovative algorithms. The system uses machine vision technology to observe whether the cookedness of the food in the pot is sufficient, and it uses machine vision combined with algorithms to monitor, so as to enable the cooking machine to achieve a realm of color, fragrance, and taste. This study emphasizes that food is cooked at home to ensure the safety and health of the family. It can be combined with multi-functional cooking-related products, such as the smart cooking pot, electric hot pot, food vacuum packaging machine, cooking pot that can be stirred by yourself, and cooking vegetable machine, etc., which are developed as more advanced automation technology. In the research, a camera is used in combination with software for the development, real-time image processing technology is used for color discrimination, and parameter calculations are used to monitor the cooking status of the food. The color difference is used to judge the degree of cookedness of the food, so that the system can use the image color distribution to distinguish whether to perform the subsequent partial stirring or pan cooking action.
2. Materials and Methods
This research uses machine vision to observe whether the food in the pot is sufficiently cooked, and uses machine vision combined with algorithms to monitor it, so as to make the cooking machine reach the realm of color and fragrance.
2.1. Color Conversion and Segmentation
HSV (hue, saturation and value) color space is similar to human perception of color. The RGB color space is converted to the HSV color space through OpenCV, and the part of the green leaves is as shown in Figure 1.
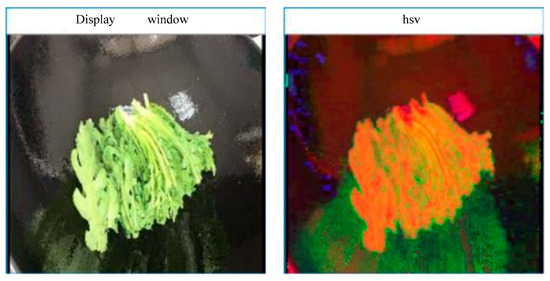
Figure 1.
Convert RGB to HSV ((left) is the original image, (right) is the false color operation image after HSV conversion).
The use of HSV characteristics is not affected by light, and is closer to human perception of color than RGB. It is an intuitive color model that can distinguish the desired image color, and then find it according to the desired brightness and color saturation.
Use the following formulas to convert, and the values of H, S, and V of the food image during cooking can be obtained, respectively.
Perform foreground segmentation on the converted image, set the rectangle range and size, and perform segmentation as shown in Figure 2.
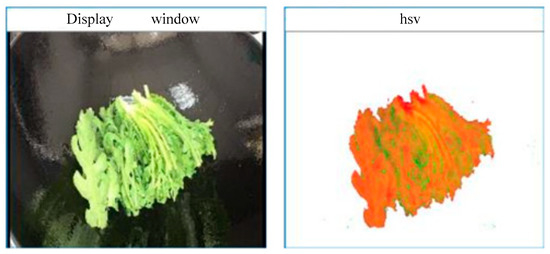
Figure 2.
Foreground segmentation ((left) is the original image, (right) is the false color operation image after HSV conversion).
Next, pseudocoloring is used, which does not fully reflect the color of the original image. Although it is not the true color of the image itself, the processing of assigning color values can improve the discrimination of image details. Foreground segmentation uses the texture (color) signal and boundary (contrast) signal in the image. The steps are to draw a frame around the target, and after the target is framed, the target can be segmented well. Next, decide whether to add an additional selected area (the user specifies the target pixel), and decide whether to add an additional selected area to use border matting technology to optimize the target segmentation boundary. The basic operation of the pseudocode calculation of this system is as follows: When starting to cook, if the color saturation is in the range of 75° to 95°, the hue is converted to a complementary color. After cooking for a period of time, if the color saturation is in the range of 20° to 65°, the hue is converted to a complementary color.
2.2. Judgment of Maturity and Stir-Fry Direction
Here, it is assumed that the color information of lettuce is , the color information when cooked is , and the color information of overripe is assumed to be , at time i. The color information at the time is , and the cooking maturity and the cooking unevenness are defined.
Next, we discuss the method of judging cooking maturity . The c is Cook for cooking, where is the hue coefficient of cooking maturity, is the saturation coefficient of cooking maturity, is the lightness coefficient of cooking maturity, and represents the hue value from i second to the difference when it is cooked. The represents the saturation value from i second to the difference when it is cooked. The represents the brightness value from i second to the difference when it is cooked.
Let , , and be as shown in the following equations, where is the hue coefficient of cooking maturity, is the saturation coefficient of cooking maturity, and is the lightness of cooking maturity coefficient, represents the hue value of the hue from i second to the difference when cooked, represents the saturation value of the saturation from i second to the cooked time, represents the difference in brightness from i second to the cooked time.
In the cooking of all dishes, the change in hue is the most obvious, so the hue difference during cooking is also used as the basis for judgment, but the saturation and lightness changes in the cooking process cannot be ignored, so the design of the equation is in accordance with this. The percentage is multiplied by the change difference, and then the three values obtained are added together to get the maturity.
Let the food’s cooking unevenness , u indicate unevenness, because it is impossible to heat every surface when cooking, so take the maximum and minimum values of the cooked image to determine the maturity to do the calculation, and use to find the difference in cooking maturity of each part of the food, and then divide by to determine the unevenness of the leaves during cooking, to facilitate the monitoring of the follow-up stir-fry status.
In terms of the timing of judging whether to end cooking, and can provide the judgment of cooked or overcooked, assuming and are the upper and lower limit of HSV value of the cooking range of food, , is the cooking time of food i seconds. When the HSV value is at in the time image, when all the points in the food image meet the condition of Formula (9), it is the time to start the pot and the cooking should end.
Oil gloss is represented by color space, g is glossy, which means oily gloss, , , are cooking oil gloss coefficients, is the brightness of the difference between non-oily gloss and oily gloss, is the blue component of the difference between the luster and the oily luster, is the red component that does not have the difference between the oily luster and the oily luster.
Let , and be as shown in the following equations, where is the coefficient of oil gloss, is the coefficient of the different blue component, and is the oil gloss red component coefficient, represents the difference in oil luster, does not have the oily luster and the blue component of the oily luster, and does not have the oily luster and the red component of the oily luster.
When cooking food, if it is too oily or not enough oil is added, it will affect the deliciousness of the dishes. To judge whether the oil is added properly, it can be judged according to the component ratio of the appropriate oil gloss. Assume that and are the upper and lower limits of the suitable oil gloss range, and is the oil gloss image gray level when the food is cooked to the time i seconds at the position , then the following applies:
Among them, is the number of all the points in the food image. Then, is all the satisfactions in the food image > condition of the number of pixels.
Sauce absorption is expressed by , s is sauce for sauce, is the coefficient of hue absorbed by cooking sauce, is the saturation coefficient for cooking sauce absorption, is the coefficient of brightness absorbed by cooking sauce, and is expressed as the hue value from i second to the difference when it is cooked. The represents the saturation value from i second to the difference when it is cooked, and represents the brightness value from i second to the difference when it is cooked.
If the sauce is too much or not enough, the dishes will be too salty or tasteless. To judge whether the sauce is added properly, it can be judged according to the component ratio Rs of the appropriate sauce absorption. Assume that and are the upper and lower limits of the appropriate sauce absorption range, and is the cooking time of the food i second and the absorption of the sauce at in the time image, then the following applies:
Among them, is the number of pixels in the food image that satisfy the condition of > .
As mentioned earlier, after the image is converted to HSV color space, the color of the vegetable leaf can be judged and the unevenness of the vegetable leaf can be known, so that the user can know where to stir fry, which can be found by the value in the cooking parameter. When it is cooked, and , the stir-fried square phase must be moved from to . Get stirring direction as follows:
When the leaves are overripe, the direction of stir-frying is the opposite, and the overripe stir-fry is in the direction of . Get the direction of stir-fry as follows:
In image recognition, the feature extraction of the image is very important data. The edge can be detected from the pre-processed image and the geometric features can be segmented for recognition. Therefore, it is necessary to find the most discriminative feature value for the previously processed image in order to effectively improve the success rate of the recognition by the classifier. In the previous article, I mentioned the neural network architecture, but the most important factor to train a neural network is to collect data to build a database and pre-process the pictures. The diversity of data will affect the effect of its neural network. If the type of dish is single, you may face undesirable results when facing different dishes.
In order to complete this study, in addition to the collection of different types of vegetable leaves, each type of vegetable leaf must also have a certain number of pieces. At present, about 120 dishes of various maturity maps have been completed. In order to make use of the limited training data as much as possible, we will use a series of random transformation heap data to improve this, so that our model will not see any two identical pictures, which helps us suppress over-fitting and make the model universal, with better chemical ability.
2.3. Network Training Process
Suppose there is a training data set with m samples, , for the entire sample, the total cost function of the network can be expressed as shown in the following formula [32]:
where is the neural network model, is the one between the jth element of the first layer and the ith element of the 1st layer, and the weight of the connection in between, and b is the partial weight of the hidden layer neuron. The right half of the above formula is used to reduce the size of the weight value of the regular term of the following terms, which can prevent over-fitting, and substitute λ to adjust the relative importance of the two terms before and after the loss function. Additionally, the batch gradient descent optimization algorithm was used to solve the minimum value of the formula, and finally the inverse transfer algorithm was used to calculate the partial derivative of of W and b.
3. Results
Figure 3 shows the architecture of the dynamic image vision system of the experiment. This system is composed of the cooking system at the bottom and the image recognition system at the top. The system lighting the four LED bulbs on the top, bottom, left, and right sides of the CCD lens, to avoid insufficient brightness caused by the scattered light. Additionally, the external reflection is properly shielded to reduce the image noise. The bottom part uses the induction cooker as the heating device, with the black cast-iron wok as the background. The black cast-iron wok not only heats more evenly, but the black background is also more conducive to foreground segmentation and feature extraction; this is shown in the image above. Identified from the system, using a CCD camera to capture the cooking process, the system uses the color to convert to HSV, and then segment the foreground to find the part of the vegetable, and use the cooking parameters to determine the maturity of the leaf, the luster, and the color of the sauce.
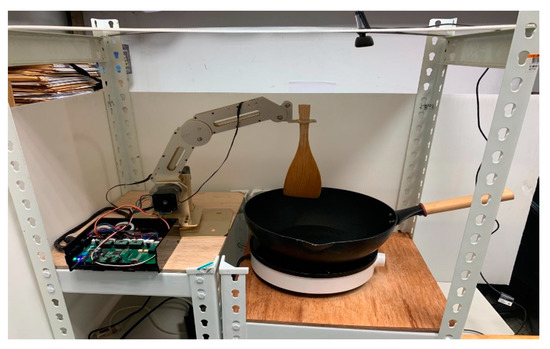
Figure 3.
Device architecture.
In this study, during the cooking process, the robot arm and the spatula were moved at a fixed distance, adjusted according to the position of the arm and the mechanism, defined new joint coordinates and established a parameter table on the overall structure, and then went through forward kinematics, to verify that it is correct. After confirming, the converted matrix is pushed down through inverse kinematics, to adjust the angle of the motor to allow the robotic arm to position and move in space. When the dish is from the state of uncooked lettuce to the cooked process, the volume of the dish can change significantly in comparison with the picture. Suppose here that N_r is all the points after the back image of lettuce is separated, and is all the points after the leaf image and the back are separated after cooking. Here, we define the lettuce shrink ratio as SR, as in the Formula (20), as follows:
Taking the process of cooking cabbage as an example, we can see that there are obvious volume changes before and after cooking. In the 640 × 480 screen, all the points after the lettuce image and the back are separated are 187,566 points. There are 1,097,445 dots, and 74,368 dots when cooked and overcooked, respectively. The shrinkage ratio is shown in Table 1.

Table 1.
The number of vegetables and the shrinkage ratio of cabbage in different cooking stages.
In the whole cooking process, the relationship between the ten times of images captured and the shrinkage ratio is shown in Figure 4, and the time interval of each capture is fixed. During the cooking process, this study captures the first image when the dish is still lettuce, the cooked image is the fifth image captured, and the tenth image is captured when the dish is overcooked, as shown in Figure 5. Between the second and third image captures, the second shrinkage ratio was 1.68%, but the third shrinkage ratio increased to 36.9%, and the shrinkage ratio increased significantly. It can be seen that the leaves are just under this, and there will be a significant reduction in volume during the pot; and between the eighth and tenth times, the eighth shrinkage ratio is 64.13%, and the tenth shrinkage ratio is 64.51%. There is almost no change in the shrinkage ratio. It can be inferred that the volume of the dishes will not change significantly after overripe.
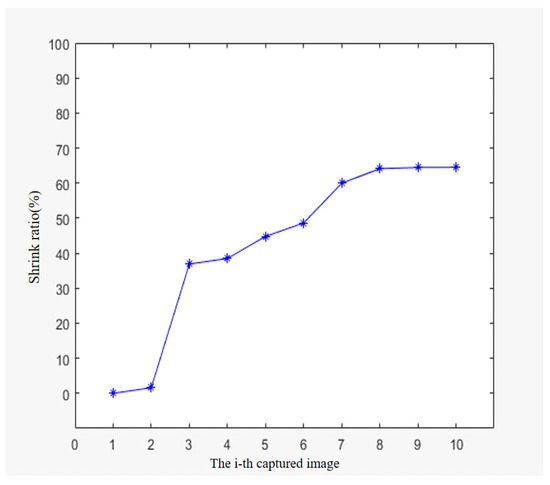
Figure 4.
The relationship between the ten times of image acquisition and its shrinkage ratio.
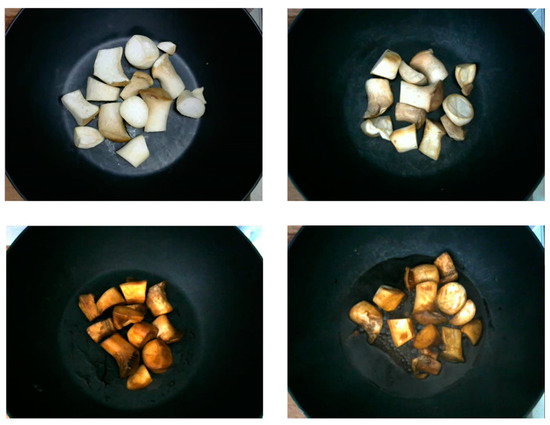
Figure 5.
Pleurotus eryngii cooking process. Upper: Beginning, Bottom: Finish. Left: More sauce. Right: Less sauce.
There are a few dishes that do not change significantly, in the volume of lettuce, from the state of uncooked to cooked. As seen in Figure 5, the upper left is the uncooked Pleurotus eryngii, and the lower left is the overcooked Pleurotus eryngii. Pleurotus eryngii usually, as shown in Table 2, cannot be polished, and its shrinkage ratio falls between 3% and 9%, so it is impossible to judge whether the Pleurotus eryngii has been cooked from the degree of volume shrinkage.
Table 2.
The number and shrinkage ratio of Pleurotus eryngii in different cooking stages.
The color changes are observed through YCbCr and HSV images. During the entire cooking process, the hue, saturation, and lightness of Pleurotus eryngii at different stages are added to the seasoning sauce. There are great differences, which can also be used as a basis for judgment.
After the histogram analysis, the cooking parameters are obtained, and it is judged that the HSV divides the three components of H, S, and V during cooking. With the status of H, S, and V, the statistics of the H, S, and V components during cooking can be understood.
In Figure 6 and Figure 7, the original RGB image is converted to the HSV false color calculation image. It can be seen that the false color calculation hue when the HSV hue is uncooked is more red, and the false color calculation hue after cooking is more orange; the brightness of the uncooked time until the brightness of the cooked time is getting bigger and bigger.
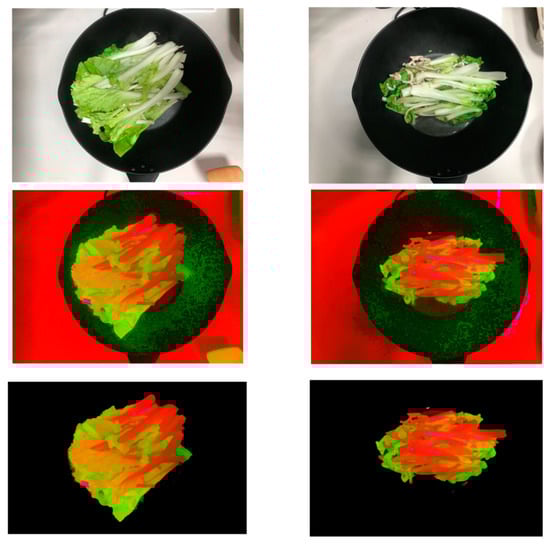
Figure 6.
The cooking of the Chinese cabbage. Upper: Lettuce original image, Middle: HSV false color operation image, Bottom: target extraction. Left: Beginning. Right: Finish.
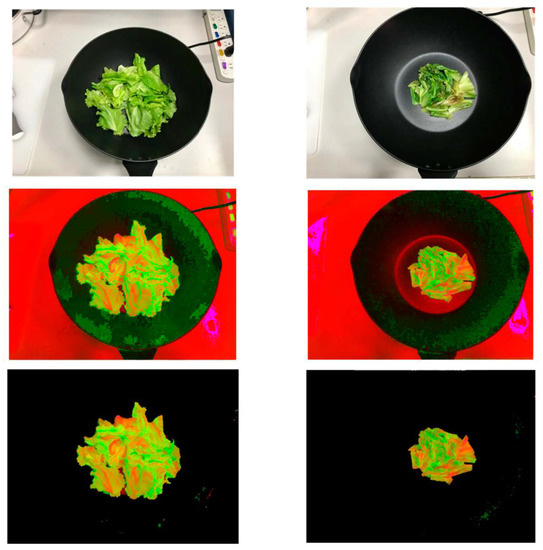
Figure 7.
The cooking of the Lettuce. Upper: Lettuce original image, Middle: HSV false color operation image, Bottom: target extraction. Left: Beginning. Right: Finish.
For different cooking images, nine phase pixels are taken at the same position in each image, the position of each phase pixel is marked, and the HSV value is obtained for analysis. The position marked with a red dot in Figure 8 is the original nine sampling points in the study.
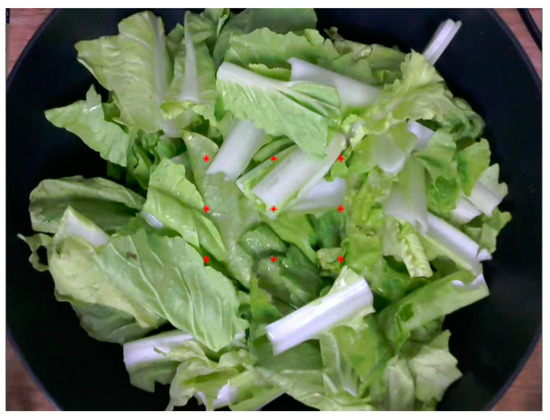
Figure 8.
Image of uncooked cabbage and nine marking points.
In Figure 9, the color images of Jiugongge correspond to the colors of the same relative position of the pixel points. From the color of the picture, it can be judged that the color of the uncooked cabbage is the most vivid, so the saturation value is also the largest. The next step is to complete the cooking. The image with the least saturation at the end is the over-mature image.
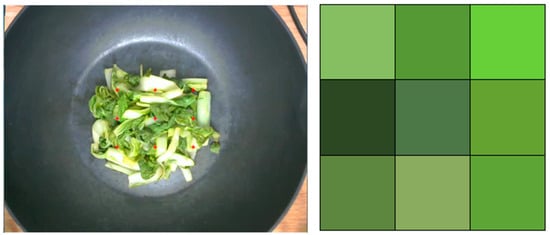
Figure 9.
HSV components after lettuce is cooked. Left: nine sampling points. Right: the color of nine sampling points.
In Figure 10, it can be seen that the hue changes in cabbage during the cooking process. The cabbage is slowly heated from the lettuce state. The hue value generally rises from the original 76° to 88° interval to the 88° to 96° interval. A significant improvement is observed, but when the heating process comes to the over-cooked stage, the color change can be clearly judged, and the overcooked fold line also falls in the range of 70° to 83°.
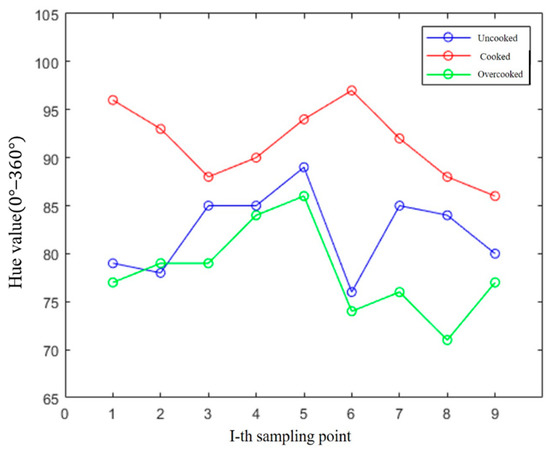
Figure 10.
The hue value changes of nine marking points.
From the saturation distribution of the image in Figure 11, we can see the change in the saturation of the cabbage during the cooking process. The cabbage is slowly heated from the lettuce state, and the saturation drops from the original maximum of the 76° to 96° interval to the 40° to 65° interval; the saturation has dropped significantly, and then when the heating process reaches the over-cooking stage, the saturation continues to decline, reaching the 20% to 50% interval. From this, it can be inferred that the saturation will continue to decrease during the entire cooking process. The decline from the state of lettuce to the state of cooking is more obvious, while the decline is not so obvious from the time of cooking to the state of overcooking.
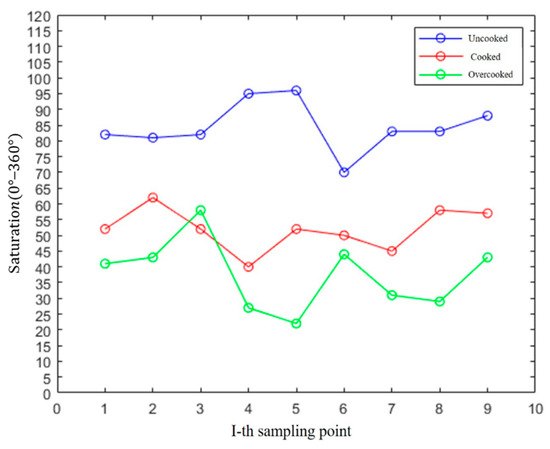
Figure 11.
Saturation changes in nine marker points.
From Figure 12, we can obtain the brightness change in cabbage during the cooking process. The blue polyline is the nine brightness values of the cabbage lettuce state. The red polyline represents the cabbage lettuce that was slowly heated to the cooked state. It can be found that the brightness is slightly improved, from the original 57% to 65% range to the 65% to 76% range. However, from the just cooked state, the lightness will be greatly reduced in the overcooked stage. In addition to the obvious judgment from the picture that the color becomes darker, the lightness value at this time can also be known from the overcooked broken line distribution in the picture. It falls below 55%, and the lowest is even as low as 20%.
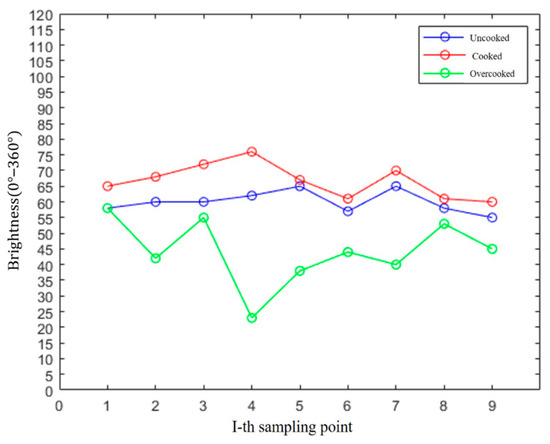
Figure 12.
The brightness changes in the nine marking points.
The next step is to compare four different cooking conditions for cabbage. After the image is converted to HSV color space, the color of the leaves and the brightness of the oil luster can be judged, and then the unevenness of the leaves can be known. The cooking parameters assume that the color information of lettuce is , the color information when it is cooked is , the color information of the overripe is , the color information at time i is , and the color information of the sauce is , as shown in Figure 13.
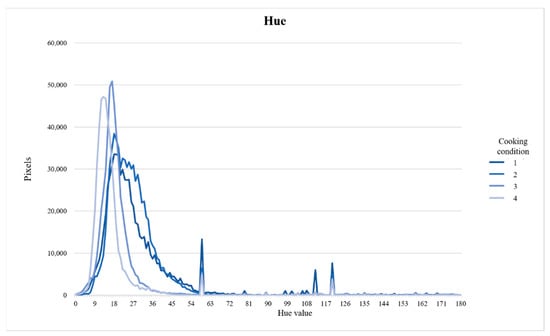
Figure 13.
Hue comparison during cooking.
After the image is converted into HSV color space, the color of the leaves can be judged and the unevenness of the leaves can be known, so that the user can know where to stir-fry. Also, the value in the cooking parameters can find out when and , the stir-fried square phase, must be moved from to . Obtain the stirring direction as follows:
When the leaves are overcooked, the direction of stir-frying is the opposite, and the overripe stir-fry in the direction of . Obtain the direction of stir-fry as follows:
In this research, we find the minimum and maximum values of cooking parameters through programs, and mark them to get the starting point and ending point of the position, and then control the arm to move, as shown in Figure 14.
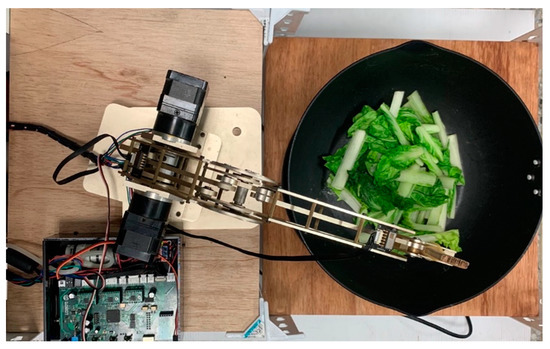
Figure 14.
The robotic arm touches the far right end of the pot and stirs. Left: the robotic arm Right: the pot.
This research uses the VGG-16 model to provide a method for constructing an efficient and practical image classifier for small data sets (hundreds to thousands of pictures), and gives the experimental results. As the backbone of deep learning, convolutional neural networks are designed to be one of the best models for finding feature problems, such as image classification problems. Even with very little data, they can learn features well. Neural networks for small data sets can still get reasonable results. In order to use the limited training data as much as possible, we use a series of random transformation heap data for upgrading. The so-called lifting process is also called lifting operation, which rotates and adjusts an original image at random angles, zooms in and zooms out at random, and flips it horizontally or vertically, to obtain multiple new images. The dataset is formed only by the elements captured by the proposed architecture. Through this method, we expand our database so that the model we trained cannot see any two identical pictures, which helps us suppress over-fitting and make the generalization ability of the model better.
The recognition rate is shown in Table 3, which can be divided into the original VGG network recognition rate and the recognition rate after fine-tuning the structure, to supplement the training database before training. It can also be seen from the table that the recognition rate has increased significantly. The algorithm of this system was used to segment the leaves and stems, to identify whether the color of the leaves meets the requirements, and, if not, continue to re-analyze.
recognition rate = (Aa − Al − As)/Aa
Table 3.
(A) Identification rate of cabbage. (B) Identification rate of lettuce. (C) Identification rate of Pleurotus eryngii.
- Aa—all image pixels.
- Al—the Image pixels of vegetable leaves misjudged as vegetable stems.
- As—the image pixels of vegetable stems misjudged as vegetable leaves.
There is no relevant research on the color state of stir-fried dishes. Therefore, this study uses the cooking results of the purely sequential control automatic cooking machine in the market for comparison. Finally, the cooking results of this system and the automatic cooking machines, PY18-X2, on the market are compared. The tasters score according to the following four points: 1. The color of the vegetables; 2. The crispness of the taste; 3. The proper ratio of oil and water; 4. Whether the vegetables can maintain the original flavor. After 200 person-times of tasting results, the average delicious evaluation score is shown in Table 4.
Table 4.
Comparison of cooking results between this system and market automatic cooking machines.
4. Conclusions
This research uses a camera combined with software for development, and image processing technology for color discrimination, and it achieves real-time monitoring of the cooking status of the food through image processing. It is mainly based on the discrimination of the cooking status of the dishes, based on the HSV imaging system, and the cooking maturity of the dishes can be effectively judged through the various components of the HSV image.
In the study, the color space conversion, the RGB color space conversion to HSV, and the foreground segmentation are used to separate the leaves from the background. Through the separated leaves, the three-component histograms of H, S and V are generated. From the cooking parameters, the maturity status of the leaves is determined. Assuming that the color information of lettuce is , the color information when cooked is , the color information when overripe is , and the color information at time i is , the cooking maturity can be defined and the cooking parameters can be adjusted flexibly under different conditions, to facilitate the subsequent development. The cooking ripeness, cooking unevenness, oil glossiness, and sauce absorption are very innovative parameter definitions, which can be used to monitor and analyze the quality changes in cooking. It is believed that these parameters can provide revolutionary methods for future cooking automation research.
This research also combines neural networks to complete multiple classifications, and uses the established database to identify different vegetable species. Currently, there are three completed items, namely, cabbage, lettuce, and Pleurotus eryngii. Other varieties of vegetables will be added in the future; This will increase the types that can be identified, and expand the database to make this research more complete. In addition, this research also added a robotic arm to perform the stir-frying actions. At present, it is possible to mark the overcooked and undercooked locations in the picture and perform stir-frying. The judgment time of each image can be reduced to less than 0.2 s, and the false judgment rate can be reduced to less than 3%.
Author Contributions
Conceptualization, C.-S.L., Y.-C.P., Y.-X.K. and C.-K.C.; methodology, Y.-C.P. and C.-S.L.; software, Y.-C.P.; validation, C.-S.L., Y.-C.P. and Y.-X.K.; formal analysis, C.-L.T. and C.-S.L.; investigation, Y.-C.P.; resources, C.-S.L.; data curation, Y.-X.K.; writing—original draft preparation, C.-S.L.; writing—review and editing, C.-S.L. and Y.-C.P.; visualization, Y.-X.K.; supervision, C.-S.L.; project administration, C.-S.L.; funding acquisition, C.-S.L. All authors have read and agreed to the published version of the manuscript.
Funding
This research and APC were funded by the Ministry of Science and Technology, under grant No. MOST 109-2622-E-035-016.
Institutional Review Board Statement
Not applicable.
Informed Consent Statement
Not applicable.
Data Availability Statement
Data are contained within the article.
Conflicts of Interest
The authors declare no conflict of interest.
References
- Li, H.; Lee, W.S.; Wang, K. Identifying blueberry fruit of different growth stages using natural outdoor color images. Comput. Electron. Agric. 2014, 106, 91–101. [Google Scholar] [CrossRef]
- Annamalai, P.; Lee, W.S.; Burks, T.F. Color Vision Systems for Estimating Citrus Yield in Real-time. In Agricultural and Biological Engineering; University of Florida: Gainesville, FL, USA, 2004; pp. 154–196. [Google Scholar]
- Rodríguez-Pulido, F.J.; Gordillo, B.; González-Miret, M.L.; Heredia, F.J. Analysis of food appearance properties by computer vision applying ellipsoids to colour data. Comput. Electron. Agric. 2013, 99, 108–155. [Google Scholar] [CrossRef]
- Arzate-Vázquez, I.; Chanona-Pérez, J.J.; de Jesús Perea-Flores, M.; Calderón-Domínguez, G.; Moreno-Armendáriz, M.A.; Calvo, H.; Godoy-Calderón, S.; Quevedo, R.; Gutiérrez-López, G. Image Processing Applied to Classification of Avocado Variety Hass (Persea americana Mill.) During the Ripening Process. Food Bioprocess Technol. 2011, 4, 1307–1313. [Google Scholar] [CrossRef]
- Shaik, K.B.; Ganesan, P.; Kalist, V.; Sathish, B.S.; Jenitha, J.M.M. Comparative Study of Skin Color Detection and Segmentation in HSV and YCbCr Color Space. Procedia Comput. Sci. 2015, 57, 41–48. [Google Scholar] [CrossRef] [Green Version]
- Soriano, M.; Martinkauppi, B.; Huovinen, S.; Laaksonen, M. Skin Detection in Video under Changing Illumination Conditions. In Proceedings of the 15th International Conference on Pattern Recognition, ICPR-2000, Barcelona, Spain, 3–7 September 2000; pp. 839–842. [Google Scholar]
- Lin, C.S.; Chen, S.H.; Chang, C.M.; Shen, T.S. The Crack Detection of the Retaining Wall with an Innovative Ensemble Learning Method in a Dynamic Imaging System. Sensors 2019, 19, 4784. [Google Scholar] [CrossRef] [PubMed] [Green Version]
- Lin, C.S.; Huang, Y.C.; Chen, S.H.; Hsu, Y.L.; Lin, T.C. The Application of Deep Learning and Image Processing Technology in Laser Positioning. Appl. Sci. 2018, 8, 1542. [Google Scholar] [CrossRef] [Green Version]
- Chang, C.M.; Lin, C.S.; Chen, W.C.; Chen, C.T.; Hsu, Y.L. Development and Application of a Human-Machine Interface Using Head Control and Flexible Numeric Tables for Severely Disabled. Appl. Sci. 2020, 10, 7005. [Google Scholar] [CrossRef]
- Lin, C.S.; Huang, Y.C.; Chen, C.T.; Lin, Y.D.; Chen, P.C. The Remote Cruise Method for the Robot with Multiple Sensors. Measurement 2018, 118, 194–201. [Google Scholar] [CrossRef]
- Phung, S.L.; Bouzerdoum, A.; Chai, D. A Novel Skin Color Model in YCbCr Color Space and Its Application to Human Face Detection, Proceedings. Int. Conf. Image Process. 2002, 1, 289–292. [Google Scholar]
- Chai, D.; Bouzerdoum, A. A Bayesian Approach to Skin Color Classification in YCbCr Color Space. In Proceedings of the 2000 TENCON Proceedings, Intelligent Systems and Technologies for the New Millennium (Cat. No.00CH37119), Kuala Lumpur, Malaysia, 24–27 September 2000; Volume 2, pp. 421–424. [Google Scholar]
- Menser, B.; Wien, M. Segmentation and Tracking of Facial Regions in Color Image Sequences. In Visual Communications and Image Processing 2000; Proceedings of SPIE-The International Society for Optical Engineering; Society of Photo Optical: Perth, Australia, 2000; Volume 4067, pp. 731–740. [Google Scholar]
- Rother, C.; Kolmogorov, V.; Blake, A. “GrabCut”—Interactive Foreground Extraction using Iterated Graph Cuts. ACM Trans. Graph. 2004, 23, 309–314. [Google Scholar] [CrossRef]
- Ju, R.; Xu, X.; Yang, Y.; Wu, G. Stereo GrabCut: Interactive and Consistent Object Extraction for Stereo Images. Adv. Multimed. Inf. Process. 2013, 1, 418–429. [Google Scholar]
- Scharstein, D.; Szeliski, R.; Zabih, R. A Taxonomy and Evaluation of Dense Two-Frame Stereo Correspondence Algorithms. In Proceedings of the IEEE Workshop on Stereo and Multi-Baseline Vision (SMBV 2001), Kauai, HI, USA, 9–10 December 2001; Volume 17, pp. 131–140. [Google Scholar]
- Geiger, A.; Roser, M.; Urtasun, R. Efficient Large-Scale Stereo Matching. In Proceedings of the Computer Vision–ACCV 2010, Queenstown, New Zealand, 8–12 November 2010; Springer: Berlin/Heidelberg, Germany, 2010; Volume 6492, pp. 25–38. [Google Scholar]
- Geiger, A.; Lenz, P.; Urtasun, R. Are we ready for Autonomous Driving? The KITTI Vision Benchmark Suite. In Proceedings of the 2012 IEEE Conference on Computer Vision and Pattern Recognition, Providence, RI, USA, 16–21 June 2012; Volume 3, pp. 3354–3361. [Google Scholar]
- Freund, Y.; Schapire, R. A desicion-theoretic 60 generalization of on-line learning and an application to boosting. Lect. Notes Comput. Sci. 1995, 904, 23–37. [Google Scholar]
- Alionte, E.; Lazar, C. A Practical Implementation of Face Detection by Using Matlab Cascade Object Detector. In Proceedings of the 2015 19th International Conference on System Theory, Control and Computing (ICSTCC), Cheile Gradistei, Romania, 14–16 October 2015; pp. 785–790. [Google Scholar]
- Meijering, E.H.W.; Zuiderveld, K.J.; Viergever, M.A. Image reconstruction by convolution with symmetrical piecewise nth-order polynomial kernels. IEEE Trans. Image Processing 1999, 8, 192–201. [Google Scholar] [CrossRef] [PubMed] [Green Version]
- Gan, G.; Cheng, J. Pedestrian Detection Based on HOG-LBP Feature. In Proceedings of the 2011 Seventh International Conference on Computational Intelligence and Security, Sanya, China, 3–4 December 2011; pp. 1184–1187. [Google Scholar]
- Wang, X.; Han, T.X.; Yan, S. An HOG-LBP human detector with partial occlusion handling. In Proceedings of the 2009 IEEE 12th International Conference on Computer Vision, Kyoto, Japan, 29 September–2 October 2009; pp. 32–39. [Google Scholar]
- Mita, T.; Kaneko, T.; Hori, O. Joint Haar-like features for face detection. In Proceedings of the Tenth IEEE International Conference on Computer Vision (ICCV), Beijing, China, 17–21 October 2005; Volume 1, pp. 1–8. [Google Scholar]
- Dalal, N.; Triggs, B. Histograms of Oriented Gradients for Human Detection. In Proceedings of the IEEE Computer Society Conference on Computer Vision and Pattern Recognition, San Diego, CA, USA, 20–25 June 2005; pp. 886–893. [Google Scholar]
- Vondrick, C.; Khosla, A.; Malisiewicz, T.; Torralba, A. HOGgles: Visualizing Object Detection Features. In Proceedings of the 2013 IEEE International Conference on Computer Vision (ICCV), Sydney, Australia, 1–8 December 2013; pp. 1–8. [Google Scholar]
- Ojala, T.; Pietikainen, M.; Maenpaa, T. Multiresolution gray-scale and rotation invariant texture classification with local binary patterns. IEEE Trans. Pattern Anal. Mach. Intell. 2002, 24, 971–987. [Google Scholar] [CrossRef]
- Sung, K.K.; Poggio, T. Example-Based Learning for View-Based Human Face Detection. IEEE Trans. Pattern Anal. Mach. Intell. 1998, 20, 39–51. [Google Scholar] [CrossRef] [Green Version]
- Viola, P.; Jones, M. Rapid Object Detection using a Boosted Cascade of Simple Features. In Proceedings of the 2001 IEEE Computer Society Conference on Computer Vision and Pattern Recognition (CVPR), Kauai, HI, USA, 8–14 December 2001; pp. 512–518. [Google Scholar]
- Otsu, N. A Threshold Selection Method from Gray-Level Histograms. Image Anal. Process. 1979, 9, 62–66. [Google Scholar] [CrossRef] [Green Version]
- Simonyan, K.; Zisserman, A. Very deep convolutional networks for large-scale image recognition. arXiv 2015, arXiv:1409.1556. [Google Scholar]
- Yang, Z.; Yue, J.; Li, Z.; Zhu, L. Vegetable Image Retrieval with Fine-tuning VGG Model and Image Hash. IFAC-PapersOnLine 2018, 51, 280–285. [Google Scholar] [CrossRef]
- Garfield, L. MIT Students Invented a Robotic Kitchen that Could Revolutionize Fast Food. Business Insider. Available online: https://www.businessinsider.com/mit-students-invented-a-robotic-kitchen-2016-4 (accessed on 19 April 2016).
Publisher’s Note: MDPI stays neutral with regard to jurisdictional claims in published maps and institutional affiliations. |
© 2021 by the authors. Licensee MDPI, Basel, Switzerland. This article is an open access article distributed under the terms and conditions of the Creative Commons Attribution (CC BY) license (https://creativecommons.org/licenses/by/4.0/).