Article

A Framework in Calibration Process for Line Structured Light System Using Image Analysis

School of Intelligent Manufacturing Engineering, Chongqing University of Arts and Sciences, Chongqing 402160, China
*
Author to whom correspondence should be addressed.
Processes 2021, 9(6), 917; https://doi.org/10.3390/pr9060917
Submission received: 22 April 2021 / Revised: 19 May 2021 / Accepted: 20 May 2021 / Published: 24 May 2021
(This article belongs to the Special Issue Advances in Digital Design and Manufacturing)

Abstract

:
Line structured light systems have been widely applied in the measurement of various fields. Calibration has been a hot research topic as a vitally important process of the line structured light system. The accurate calibration directly affects the measurement result of the line structured light system. However, the external environment factors, such as uneven illumination and uncertain light stripe width, can easily lead to an inaccurate extraction of light stripe center, which will affect the accuracy of the calibration. An image analysis-based framework in the calibration process was proposed for the line structure light system in this paper. A three-dimensional (3D) vision model of line structure light system was constructed. An image filtering model was established to equalize the uneven illumination of light stripe image. After segmenting the stripe image, an adaptive window was developed, and the width of the light stripe was estimated by sliding the window over the light stripe image. The light stripe center was calculated using the gray centroid method. The light plane was fitted based on the calibration points coordinates acquired by the camera system. In the measurement experiment of standard gauge block width, the maximum and minimum average deviations of 0.021 pixels and 0.008 pixels and the maximum and minimum absolute deviations of 0.023 pixels and 0.009 pixels could be obtained by using the proposed method, which implies the accuracy of the proposed method.

1. Introduction

Measurement is a reflection process of accurate information that needs highly accurate measurement methods [1]. Contact measurement and non-contact measurement are the main methods of measurement. The application of contact measurement is limited with the constraint of outside environment and the untouchability of the measured object. In contrast, more attention has been paid to the non-contact measurement with the advantages of measurement flexibility [2]. A variety of non-contact measurement technologies have emerged, and the methods have been applied in many fields [3,4,5,6,7,8]. As a non-contact measurement technology, structured light technology-based methods have been researching hot topics. Structured light is usually divided into point structured light and line structured light according to the way of laser producing. The line structured light measurement method has a greater application prospect than the point structured light measurement method with the advantages of simple structure, high precision, and fast speed measurement [9].
The line structured light-based measurement is a process in which a light plane is firstly produced by a laser generator, then the light plane is projected on the surface of the measured object, the three-dimensional (3D) coordinates of the intersection point between the light plane and the object surface finally can be obtained by the corresponding sensor and measured by the developed algorithm [10]. The system model of line structured light is an overall framework of the line structured light-based measurement method. The system model mainly consists of a laser generator, a calibrator, and a sensor, where the transformation relationship between the components needs to be given.
The calibration of line structured light system is an important link in the process of line structured light-based measurement. It is a primary guarantee for the accurate measurement of the line structured light system. The system calibration includes sensor calibration and light plane calibration, which mainly uses a calibrator to obtain n 3D point in a world coordinate and n two-dimensional (2D) points in an image coordinate, then converses three dimensions to two dimensions by using a matrix algorithm combining the sensor’s internal and external parameters and aberration coefficients. The sensor calibration technology is mature, and includes the traditional calibration method, self-calibration technology, and the calibration method based on active vision [11,12]. The light plane calibration is to get the equation of the light plane in the sensor coordinates so that the light plane coordinate and the sensor coordinate can be unified for calculating the 3D coordinates of the points on the intersection line between the light plane and the measured object surface.
In the process of light plane calibration, it is necessary to adjust the position relationship between the laser generator and the calibrator. Thus, multiple light strips that are the intersection lines between the light plane and the calibrator surface can be formed. The light plane equation can be fitted by using the 3D coordinates of feature points in the coordinates system of the sensor. The light stripe has a certain width, the feature points cannot be extracted directly on it, which will lead to inaccurate light plane fitting. In order to ensure the accuracy of the light plane calibration, the feature points are usually selected from the light stripe center. However, the external uneven illumination promotes the formation of different brightness spots, which affects the determination of the light stripe center, and then affects the calibration of the light plane. Therefore, it is extremely important to develop a calibration framework of line structured light which is robust to the external environment.
The remaining sections of this paper are organized as follows. The relating literature review is presented in Section 2. The structure of line structured light system is introduced, and the calibration principle is described in Section 3. The illumination normalization model, segmentation algorithm, and adaptive window-based light extraction model are proposed in Section 4. In Section 5, the experiment results are presented based on the proposed method. A discussion of relative results is presented in Section 6. Section 7 presents the conclusions and future research of this paper.

2. Literature Review

In this section, related research on line structured light are presented. Studies on types of line structured light system are first reviewed. Then, research on the calibration methods of line structured light system are presented. Finally, reviews of the methods for extracting the light stripe center are presented.
The measurement methods based on the line structured light technology have been applied in many fields [13,14,15]. For the model research of line structured light system, some methods try to improve the accuracy of the model measurement by changing the accuracy or type of hardware or by deducing the mathematical logic relationship. Ha et al. simplified the traditional transformation matrix in calibration model of the line structured light system. They proposed a new calibration structure that used two planes to compute the relative pose of the laser coordinate system with respect to the camera coordinate system [16]. Nan et al. constructed a flexible measurement model of line structured light, which could use the conversion relationship between the manipulator and the camera to calibrate the line structure light system combining with the robot coordinate system in order to accurately measure and grasp the workpiece [17]. In [18], a 3D measurement model was established, and a two-step calibration algorithm was developed. They claimed that the height of block gauge measured by the proposed 3D measurement model was accurate. A line structured light model developed by Li et al. was compared with three different models, and their proposed model was suitable to most measurement conditions [19]. Although researchers have developed a large number of line structured light system models, accurate measurement depends on the combination of robust calibration algorithm and line structured light system model.
Many novel calibration algorithms of line structured light system have been developed. Li et al. improved the traditional camera calibration model, where they used the surface points of the free-moving planar target to be calibration points for promoting the calibration accuracy [20]. A new calibration method was proposed by Ze et al. It has been used in on-site calibration of industrial robots [21]. Sun et al. advanced an integrated calibration method of line structure light system for 3D measurement [22]. Chen et al. proposed a novel calibration method for axes in the line structured light vision measurement system. Their calibration method could reduce calibration cost [23]. The vanishing points to self-calibrate a structured light system was proposed in [24] and it could replace the complex patterns and 3D calibrated objects. Liu et al. proposed a method for the rapid calibration of a line-structured light system based on a single ball target [25]. A flexible and accurate method for calibrating the structured light system and a hybrid pattern was proposed, which took both the advantages of time multiplexing method and spatial neighborhood method [26]. Zeng et al. proposed a calibration method which was based on pseudo-random coding theory to generate binary shape-coded pattern for structured light system [27]. The calibration accuracy of the method could reach about 0.2 pixels and the quality of reconstructed surface is great. A novel calibration method was introduced in [28] that only used patterns in a single direction and the existence of one degree-of-freedom of redundancy in conventional calibration methods was also theoretically proven. In [29], a novel high-accuracy calibration method that corrected image deviation was proposed for line-structured light vision sensor. A new calibration method based on a concentric circle feature was introduced which could reduce the perspective projection error by geometrical properties [30]. Although there are many calibration methods, the accuracy of the calibration needs to be reflected in the specific structured light system. Different calibration methods also reflect inconsistent accuracy when measuring different objects.
In order to improve the calibration accuracy, a lot of research has been devoted to the extraction of light stripe center. The traditional algorithms for extracting the light stripe center are the edge detection-based method, the threshold-based method, the extra value-based method, and the gravity center extraction-based method [31,32,33,34]. There are many improved methods based on the traditional methods. Mei et al. presented a subpixel extraction method to extract the light strip center based on the geometric center method [35]. A new algorithm for extracting light stripe center is given in [36], which has higher robustness and faster detection speed. Mao ameliorated gray centroid algorithm. The new algorithm solves the CCD location subdivision and improves the accuracy of laser triangulation measurement [37]. In [38], a new stripe center extraction method is proposed for structured light measurement to eliminate the stripe distortion and improve the accuracy of light stripe center extraction. It will a research tend to develop robust algorithms of the light stripe center extraction under complex environments.
Based on the above review analysis, this paper creatively proposed a framework in the calibration process for line structured light system with the aim of promoting the measurement accuracy. A three-dimensional model of line structure light system was firstly constructed with a charge coupled device (CCD) camera. The calibration principle was described. An algorithm of illumination normalization was developed to remove light spots and shadows on the surface of light stripe image. Then, an adaptive window was created to estimate the width of light stripe by sliding the window over the light stripe image. The center point of light stripe was calculated using the method of gray centroid method. The local world coordinates of the light stripe center point in the camera coordinate system were obtained by analyzing the position relationship between the camera and the checkerboard. Light plane in the camera coordinate system was fitted based on the calibration points coordinates acquired by the camera system.

3. System Model of Line Structured Light

The line structured light system model used in this paper includes a laser generator OL, a CCD camera OC and a measured object. When the line structured light system is calibrated, the measured object will be replaced by a 2D plane calibration board OW as shown in Figure 1. The angle between the laser generator and the normal of the calibration board is 45 degrees. The distance between the CCD camera and the calibration board is adjusted to make the calibration board fall in the field of view of the CCD camera, and the distance should also meet the requirements of clear light stripe and complete measured object when the light stripe is projected on the measured object. Therefore, the distance between the CCD camera and the calibration board is 300 mm in our study. The laser generator projects the line light on the surface of the measured object, and a light stripe L is formed on the surface of the measured object. The light stripe image is collected by the CCD camera. The point PW on the light stripe center is the measured point. The imaging process of the line structured light system can be considered as a pinhole imaging process. The PI is the imaging point of the point PW. The 3D coordinates of the point PW in the camera coordinate system can be obtained by solving the light plane equation and the line equation simultaneously. The light plane equation can be obtained by the light plane calibration. When the line plane is calibrated, the point PW locates in two different coordinates, which are the world coordinate system OwXwYwZw and the camera coordinate system OcXcYcZc, respectively. The image coordinate system is O0U0V0, and the image distortion coordinate system is O1×1Y1. The relationship between the coordinates of the point PW in the image coordinate system and the world coordinate system can be established based on the vision measurement theory. The internal and external parameters and distortion parameters of the camera can be obtained by the camera calibration.

4. Calibration Process

4.1. Overview of Calibration Process

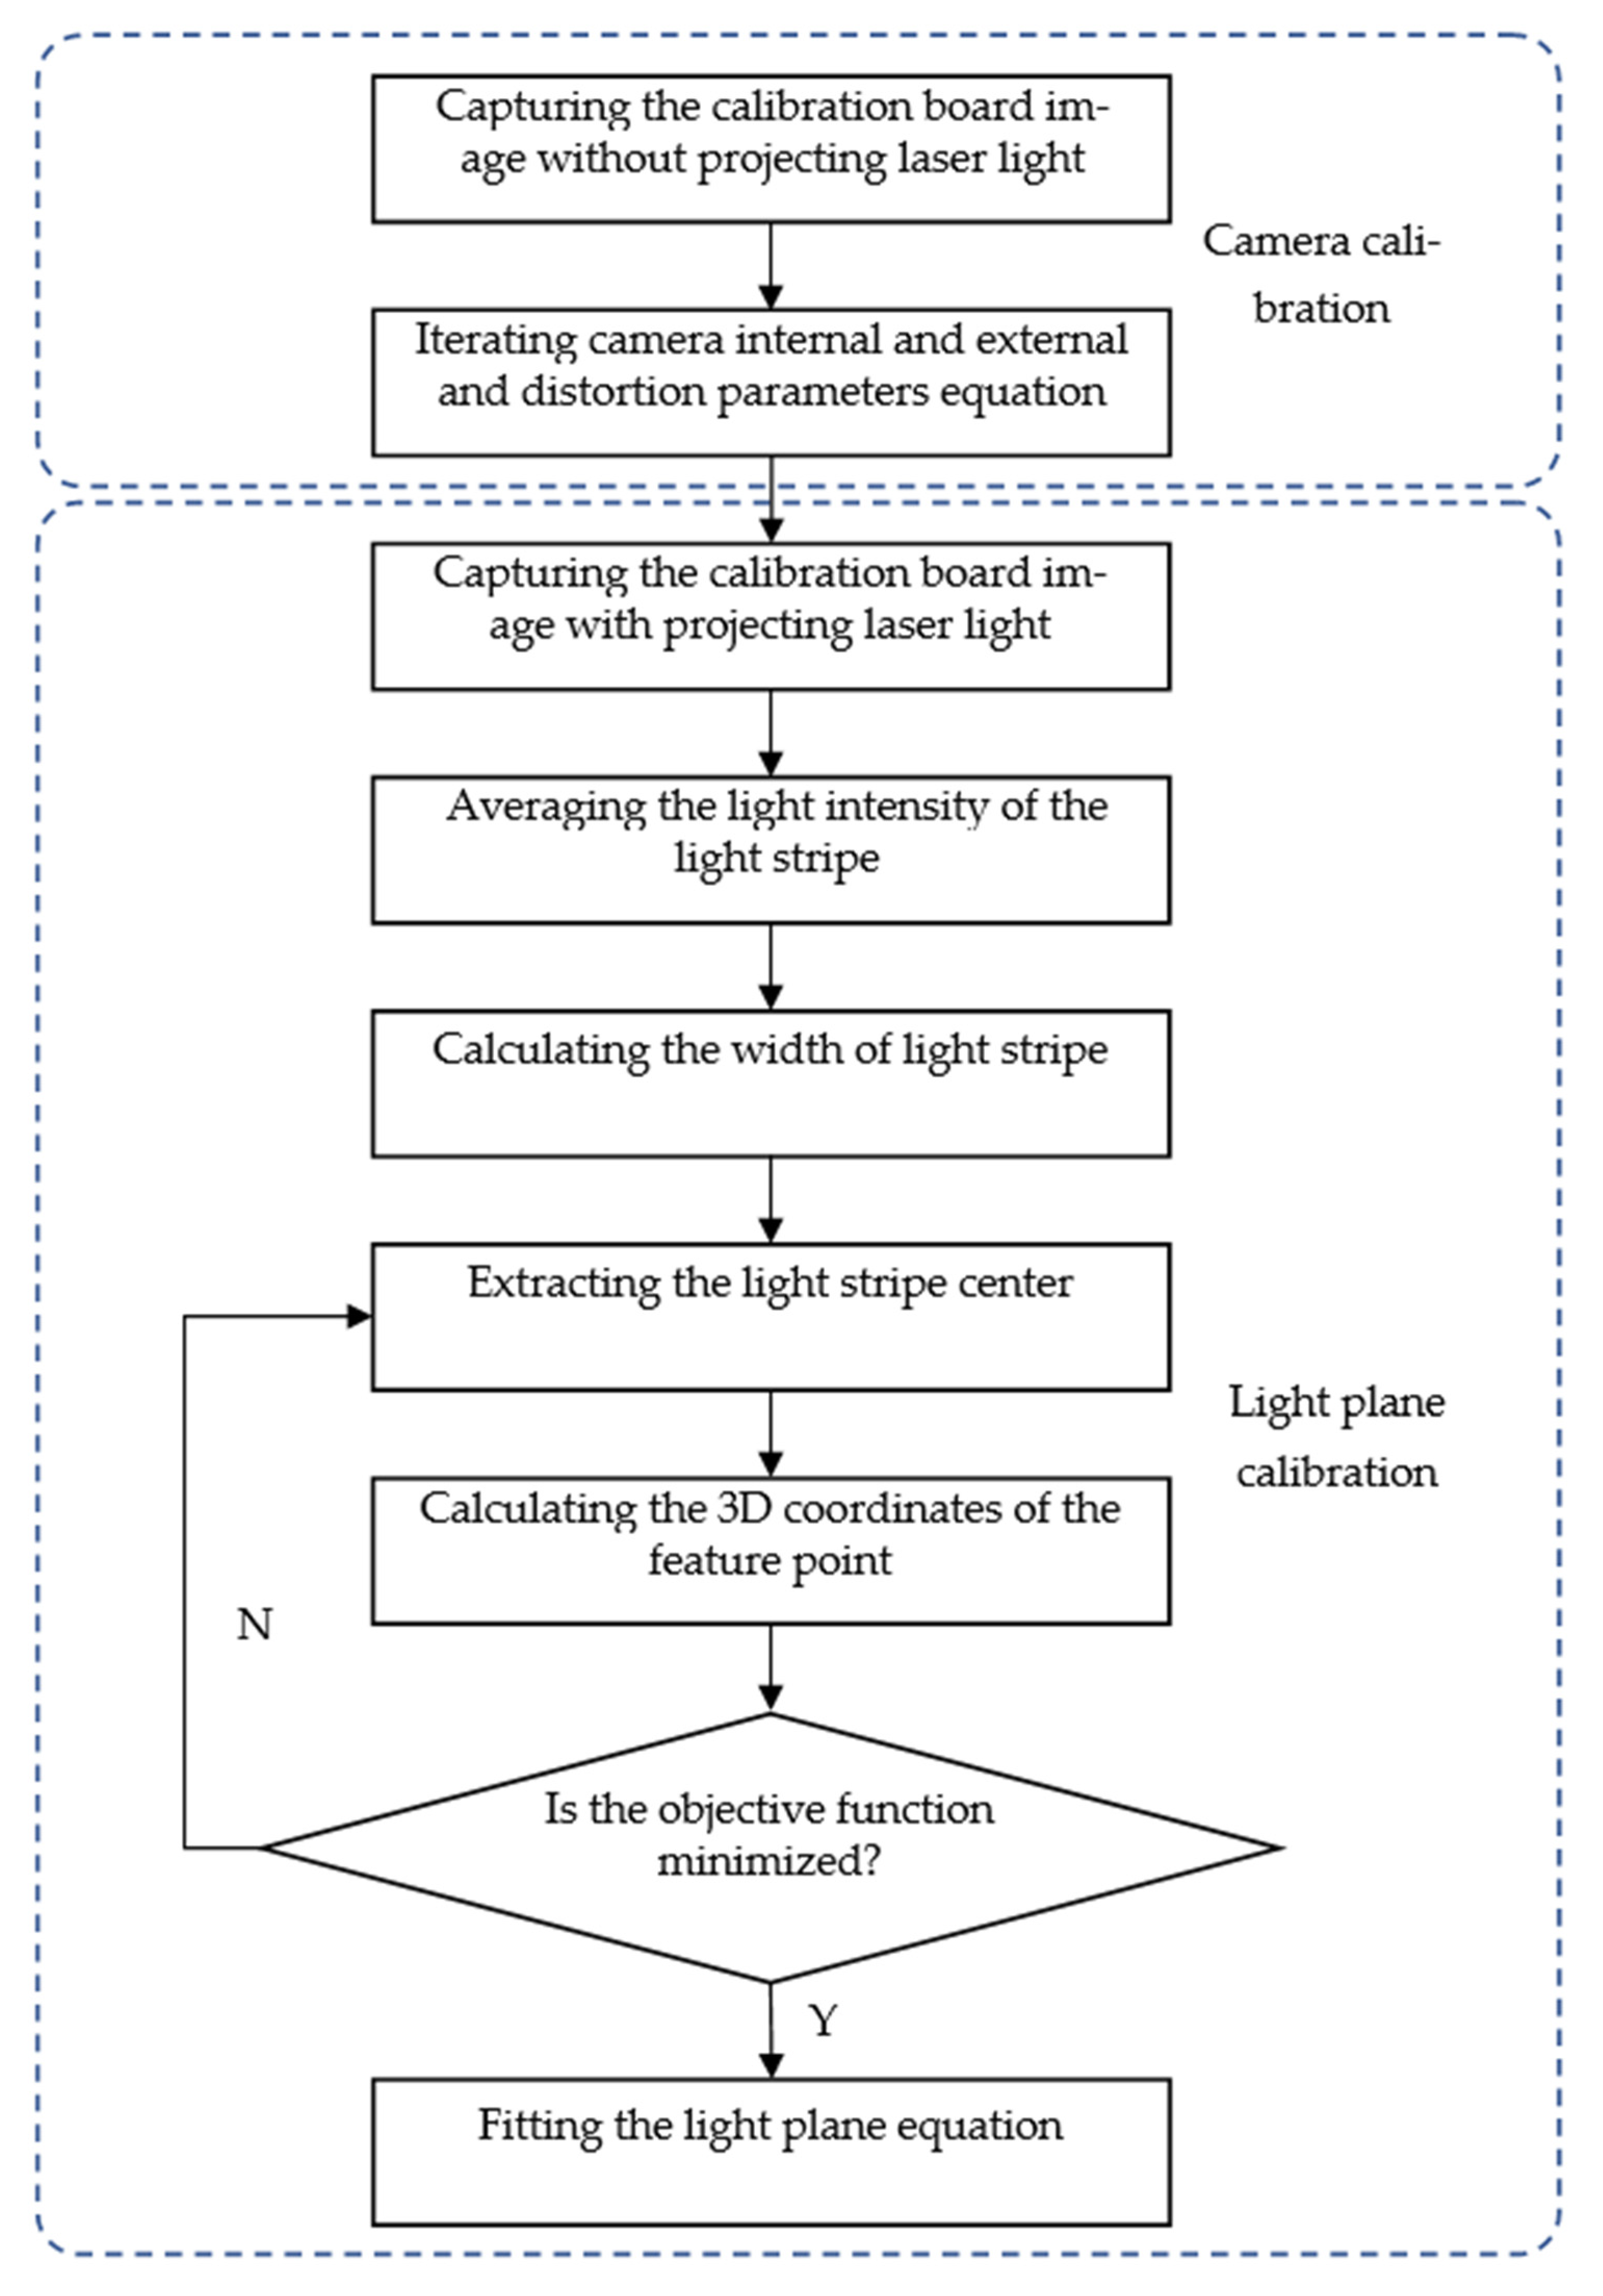
As shown in Figure 2, the calibration of line structured light system mainly includes the camera calibration and the light plane calibration. In the camera calibration process, the laser generator is first switched off. Then, the camera captures images of the calibration board with different attitudes. The coordinates of the feature points on the calibration board are finally substituted into the corresponding equation to solve the camera’s internal and external parameters and distortion parameters. After calculating the camera parameters, the light plane calibration will be carried out. The light plane produced by the laser generator is projected onto the calibration board. The camera captures the image of the light stripe generated by the intersection of light plane and calibration board. Then the light intensity of the light stripe is homogenized. An adaptive window is constructed to calculate the width of the light stripe. The light stripe center is calculated and extracted by using the gray centroid method. The 3D coordinates of the feature point on the light stripe center are calculated based on the coordinate system of calibration board. Therefore, the 3D coordinates of the feature point are substituted into the light plane equation to calculate the light plane parameters. The feature points extraction of light stripe center will end until the equation of light plane parameters reaches the minimum based on the least square method. Finally, the light plane equation fitting is completed.

4.2. Camera Calibration

Camera calibration uses the calibration method presented in [39]. A 2D chessboard is prepared as a calibration board, and the size of the chessboard needs to be known. The angle of the chessboard relative to the camera is adjusted so that a group of chessboard images can be obtained by the CCD camera. Chessboard corners are detected as the feature points to calculate the pixel coordinates of the corners. According to the size and the coordinate system origin of the chessboard, the world coordinates of the chessboard corners can be calculated. As shown in Figure 1, the relationship between the world coordinate system and the image coordinate system is shown in Equation (1):
s [ x 0 y 0 1 ] = [ α c u 0 0 β v 0 0 0 1 ] [ R T ] [ x w y w z w 1 ] = A [ R T ] [ x w y w z w 1 ]
where s is a scale factor, [R T] is the external parameters of the CCD camera. R and T are the rotation matrix and the translation matrix between the world coordinate system and the camera coordinate system, respectively. A is the internal parameters of the CCD camera as shown in Equation (2):
A = [ α c u 0 0 β v 0 0 0 1 ]
Since the world coordinate system coincides with the chessboard, the coordinates of the chessboard corner have no z component. Equation (1) can be simplified to Equation (3), where r1 and r2 are the first and second column of the rotation matrix R, respectively.
s [ x 0 y 0 1 ] = A [ r 1 r 2 T ] [ x w y w 1 ] = H [ x w y w 1 ]
where H is equal to A [ r 1 r 2 T ] . Therefore, H can be calculated out by using the pixel coordinates and the world coordinates of the chessboard corners. The internal and external parameters of the CCD camera also can be calculated out by matrix operation of H. The image distortion relationship is shown in Equations (4) and (5):
{ x I = μ ( 1 + k 1 r 2 + k 2 r 4 + k 3 r 6 ) y I = ν ( 1 + k 1 r 2 + k 2 r 4 + k 3 r 6 )
{ x I = μ + [ 2 p 1 ν + p 2 ( r 2 + 2 μ 2 ) ] y I = ν + [ p 1 ( r 2 + 2 ν 2 ) + 2 p 2 μ ]
where ( μ , ν ) and ( x I , y I ) are undistorted image coordinates and distorted image coordinates, respectively. k1, k2 and k3 are lens radial distortion parameters. p1 and p2 are lens tangential distortion parameters. r is the distance from the image pixel to the image center, that is r 2 = x 2 + y 2 . Lens distortion parameters can be obtained and optimized by the least square method the Levenberg–Marquardt (L–M) algorithm [40].

4.3. Light Plane Calibration

4.3.1. Light Intensity Equalization of Light Stripe

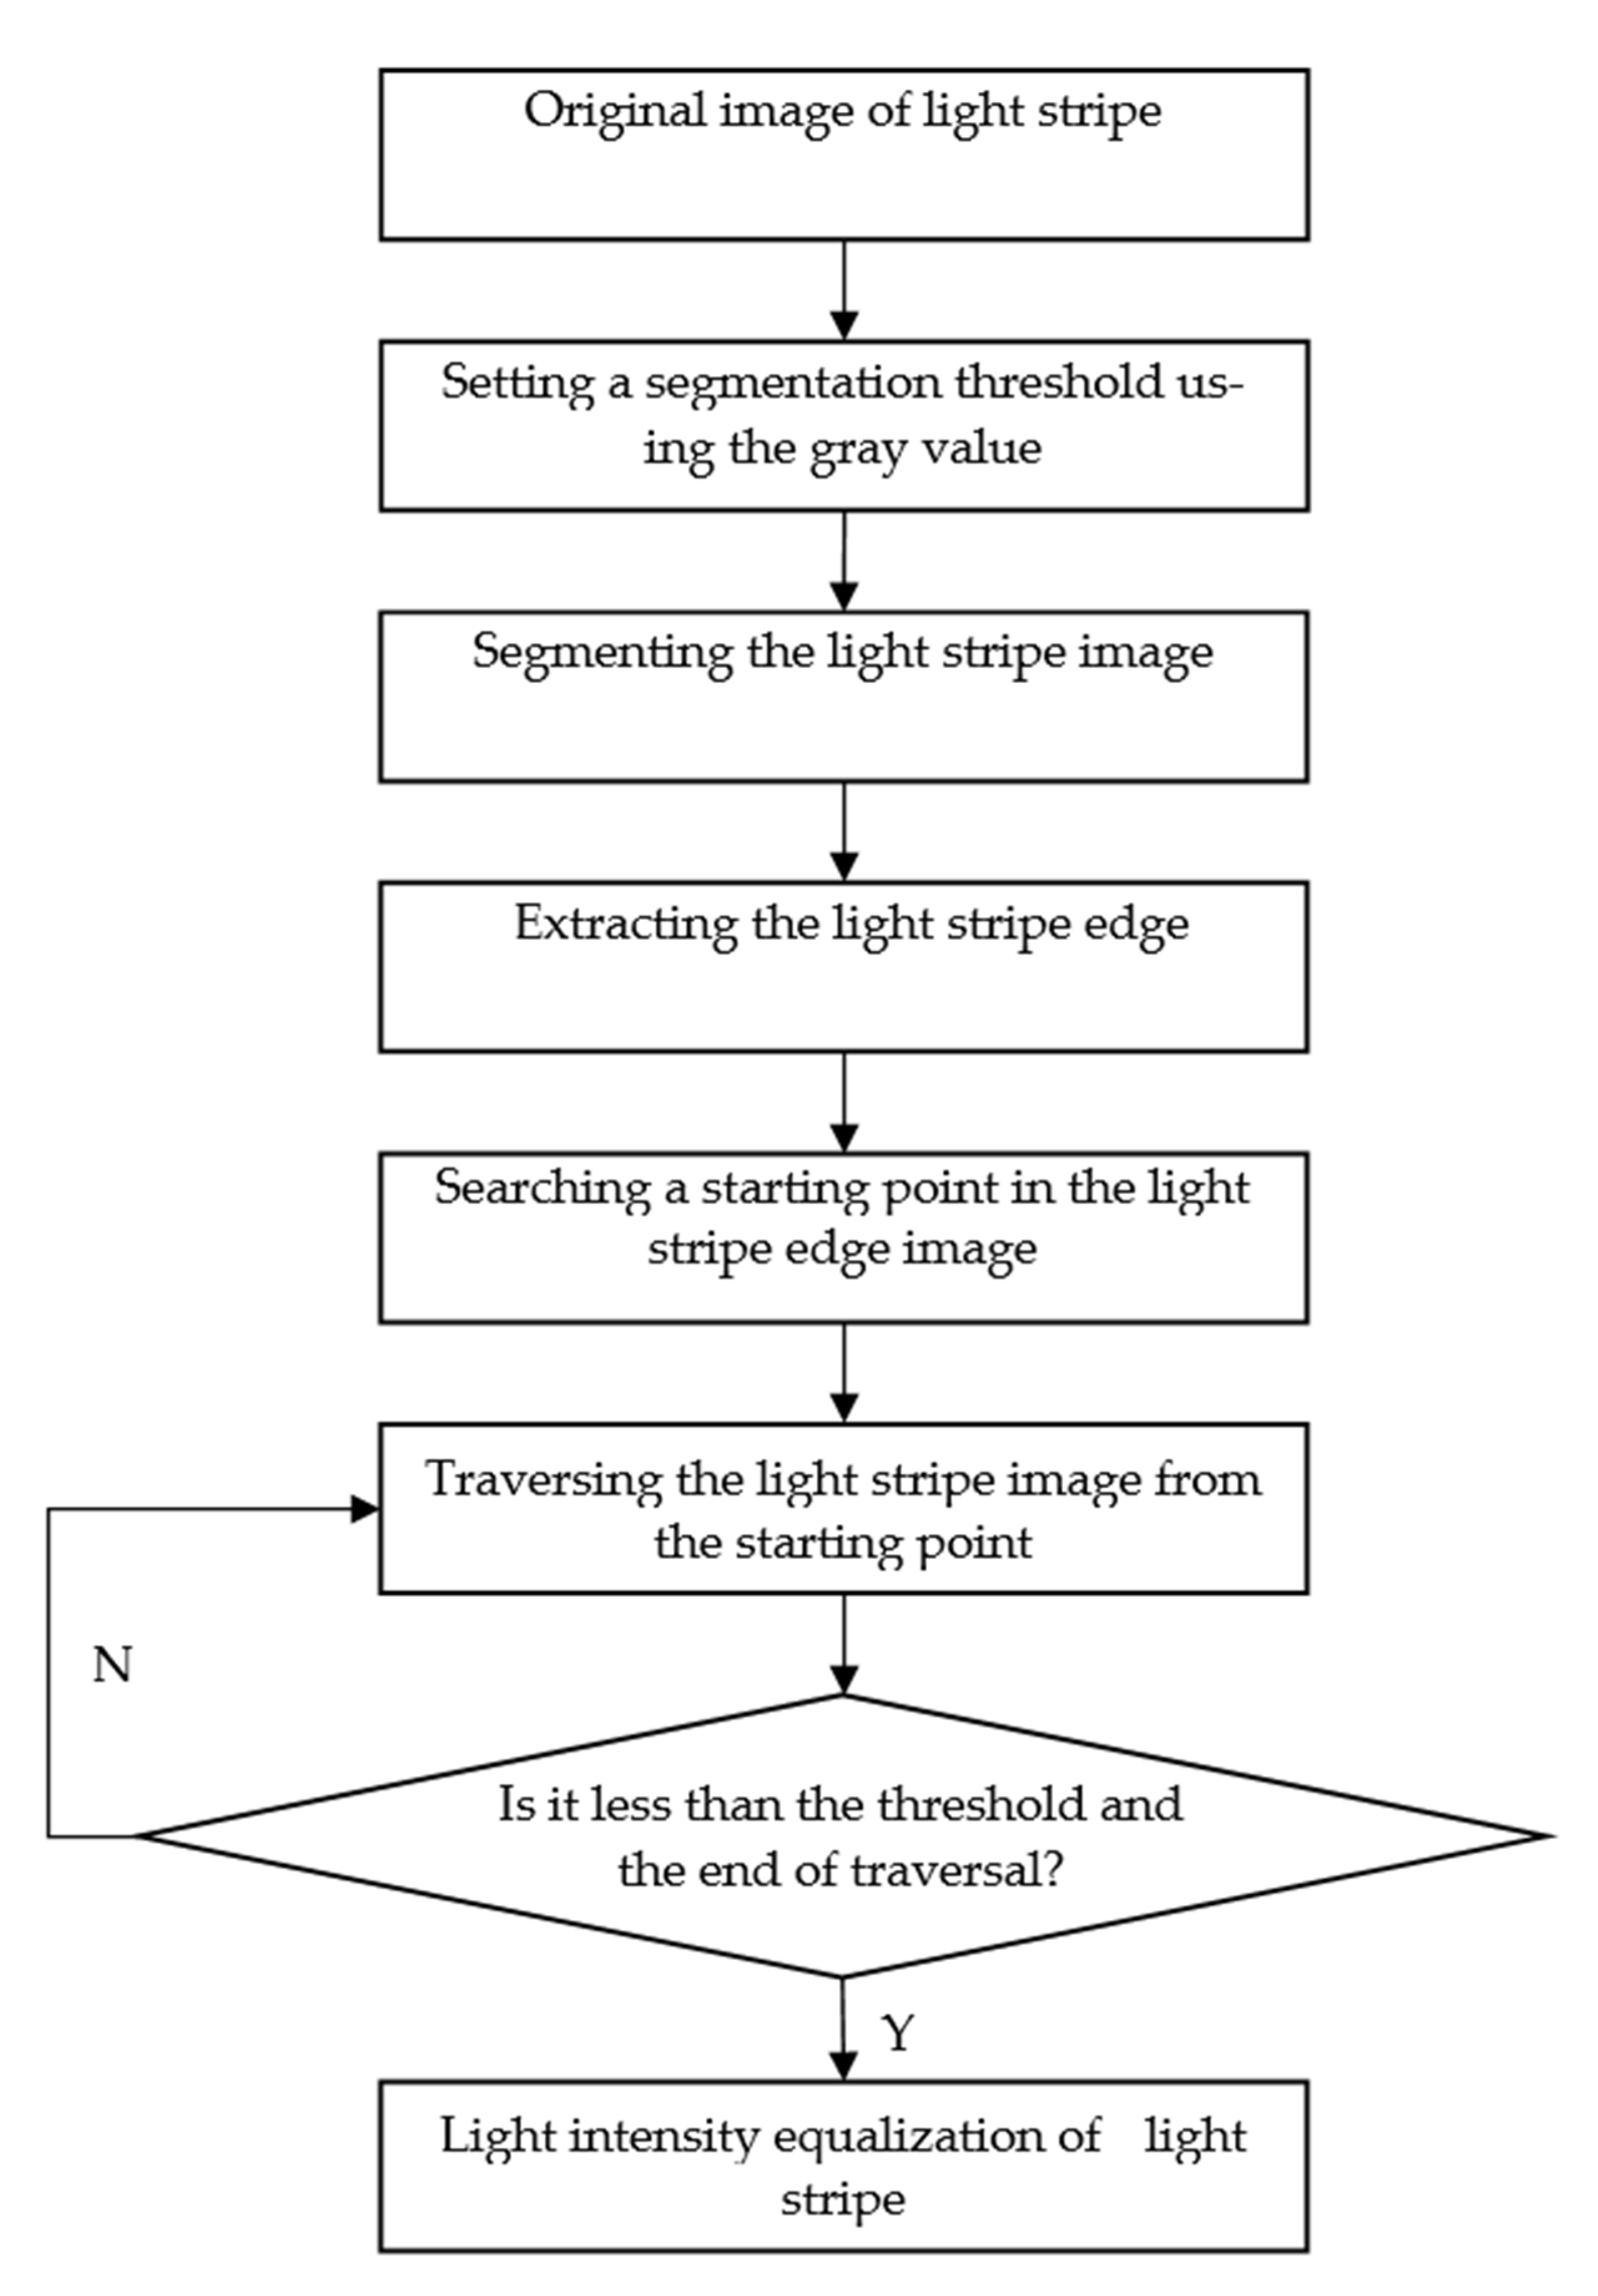
The light intensity of light stripe is not evenly distributed when projecting on the object surface. When the laser generator vertically projects the light on the object, the light intensity of the light stripe on the object surface presents a Gaussian distribution. Moreover, if the laser generator projects the light at any angle onto the object surface, where the light intensity of the light stripe will show irregular distribution. The above two conditions will affect the extraction of light stripe center and the light plane calibration. This paper innovatively proposes an algorithm of light intensity equalization of the light stripe. The algorithm process is shown in Figure 3. The gray histogram of the light stripe image is firstly obtained. The median value between the maximum gray level and the minimum gray level of the light stripe image is selected as a threshold T1. The standard deviation of the gray values of the light stripe image is used as a threshold T2. The light stripe image is segmented with the threshold T1 and the extracted light stripe is stored as an image I1. The boundary of light stripe is extracted using the Sobel edge detection operator and stored as a binary image I2. In the image I2, take the upper left corner of the image as the starting point and traverse the image from top to bottom and from left to right to find the first 1 value pixel. The coordinates of the pixel are recorded. In the image I1, take the coordinates of the first 1 value pixel as the starting point and traverse the light stripe image to judge pixel gray values. If the ratio of the difference between the traversed pixel and the threshold T1 and the pixel is less than the threshold T2, the gray value of the pixel remains unchanged. Otherwise, the gray value of the pixel is replaced by the threshold T1. When the stripe image is traversed and its pixels meet the threshold T2 conditions, the intensity equalization of light stripe is completed and the light intensity equation image I3 is obtained. The pseudo code of the light intensity equalization is shown in Algorithm 1.
Algorithm 1: Pseudo-code of Light Intensity Equalization Algorithm
Processes 09 00917 i001

4.3.2. Adaptive Window-Based Extraction of Light Stripe Center

The gray centroid method is usually used to extract the light stripe center. The principle of the gray centroid method is the same as the weighted average algorithm, which calculates the light stripe column by column and takes the vertical coordinate with gray center of gravity of the light stripe to calculate in each column as its central coordinate. It can be shown as Equation (6):
y k = i = 1 M f ( x k , y i ) y i i = 1 M f ( x k , y i )
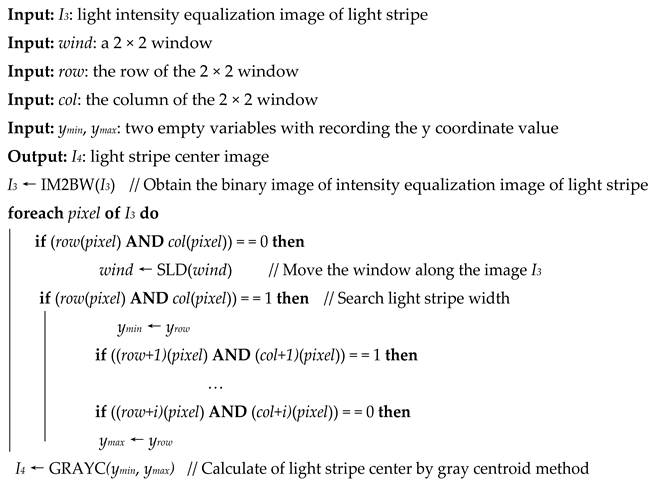
Along the direction perpendicular to the light stripe, the coordinate position of column K of the light stripe cross-section is assumed to be ( x k , y i ) , and the gray value corresponding to the coordinate of this column is f ( x k , y i ) , the variable i = 1,…, M, M represents the width of light stripe cross-section of this column and k is a variable of light stripe length determined by the image size. However, the width of light stripe is difficult to be obtained in practical environment, which affects the extraction of light stripe center based on the gray centroid algorithm. At the same time, the noise scattered outside the strip makes it more difficult to extract the light stripe center. Therefore, the adaptive determination of the light stripe width is a vital step in the light stripe center extraction process. An adaptive window-based width determination of the light stripe can be taken by the following steps and the principle is shown in Figure 4. The pseudo code of the light intensity equalization is shown in Algorithm 2.
  • Step 1: The light intensity equalization image is converted into a binary image. A 2 × 2 window is constructed in the binary image, and its upper left corner coincides with the upper left corner of the binary image. Let it move from left to right and from top to bottom in the binary image.
  • Step 2: The 2 × 2 window and the pixels on the binary image are used to do the logic AND operation in order to determine whether the detected pixels are noise points or the points on the light stripe. The specific algorithm is as follows:
The logic AND operation is firstly implemented between the pixels on each row of the 2 × 2 window. The logic AND operation is implemented between the results of the logic AND operations of the two rows again. As shown in Figure 4, the logic AND operation result between the first row of pixels in the yellow 2 × 2 window is 1, and the logic AND operation result between the second row of pixels is 0. Therefore, the final result of logic AND operation between the two rows is 0 in the yellow 2 × 2 window. If the final operation result is 0, the window continues to move. The above logical judgment operation is repeated. The 2 × 2 window stops moving and the y value of the uppermost row of the window is recorded when the logic AND operation of the two rows result is 1. Meanwhile, the 2 × 2 window is enlarged to a 3 × 3 window in the lower right direction as shown in the green part of Figure 4. The window stops zooming until the result of the AND operation between each line is 0, and the y value of the bottom line is recorded.
  • Step 3: All the recorded y values are compared, and the maximum and minimum values of the y values are determined. The M value in Equation (6) is calculated by using the different between the maximum and minimum values of the y values.
  • Step 4: The light stripe center is calculated by using the Equation (6) and the light stripe center image I4 is obtained by labelling the light stripe center in the light stripe image.
Algorithm 2: Pseudo-code of Adaptive Window Algorithm of Light Stripe Center Extraction
Processes 09 00917 i002

4.3.3. Light Plane Fitting

The internal parameters, external parameters, distortion parameters of CCD camera, and the coordinates of the feature point on the light stripe center in the image coordinate system are substituted into Equation (3). The coordinates of feature point on the light stripe center in the chessboard coordinate system can be calculated out. Thus, the coordinates of feature point on the light stripe center in the camera coordinate system can be obtained based on the transformation relationship between chessboard coordinate system and camera coordinate system. Equation (7) is the light plane equation in the camera coordinate system:
A X + B Y + C Z + D = 0
where A, B, C are the parameters of light plane. Equation (7) can be transformed into Equation (8). In Equation (8), the parameters can be expressed as the parameter in Equation (9) because C in Equation (7) is not 0.
Z = b 1 X + b 2 Y + b 3
b 1 = A C b 2 = B C b 3 = D C
Some feature points on the light stripe center are selected and the coordinates of the feature points are substituted into Equation (8). The light plane parameters can be solved when the objective function Equation (10) of Equation (8) is minimized by the least square method:
F = i = 0 N 1 ( b 1 X + b 2 Y + b 3 Z ) 2
where N is the number of selected feature points on the light stripe center.

5. Experiment and Results

In order to test the accuracy of the proposed method, some quantitative experiments were conducted. The camera used in this paper is an industrial camera with a resolution of 1280 × 1024 produced by Shenzhen MEDI micro vision technology Co., Ltd. An MV-JT0612 industrial lens was used as the camera lens with a focal length of 6–12 mm. The laser generator has a wavelength of 650 nm with the model HW650L100-22BD produced by Shenzhen infrared laser technology Co., Ltd. Chessboard is an alumina calibration board with an accuracy of ± 0.01 mm.

5.1. Camera Calibration Results

The chessboard was placed in the field of view of the camera. The chessboard pictures of different postures obtained by the CCD camera were stored in the PC, which had 8 GB RAM, an Intel Core i5-8300H CPU, and a Windows 10 operating system. The software system of the image processing running in the PC was Matlab 2020b. The camera calibrator in Matlab APPS was applied to process 20 different attitude chessboard images to obtain camera internal parameters as shown in Figure 5. The internal parameter matrix and distortion parameters of the CCD camera are shown in Equations (8) and (9), respectively.
A = | 1396.4000 0 0 0 1393 . 7000 0 637 . 5335 519 . 0403 1 |
k1 = −0.2245, k2 = 1.7162, k3 = −14.3058, p1 = 0.0000, p2 = 0.0000

5.2. Light Plane Calibration Results

5.2.1. Light Intensity Averaging Results of Light Stripe Image

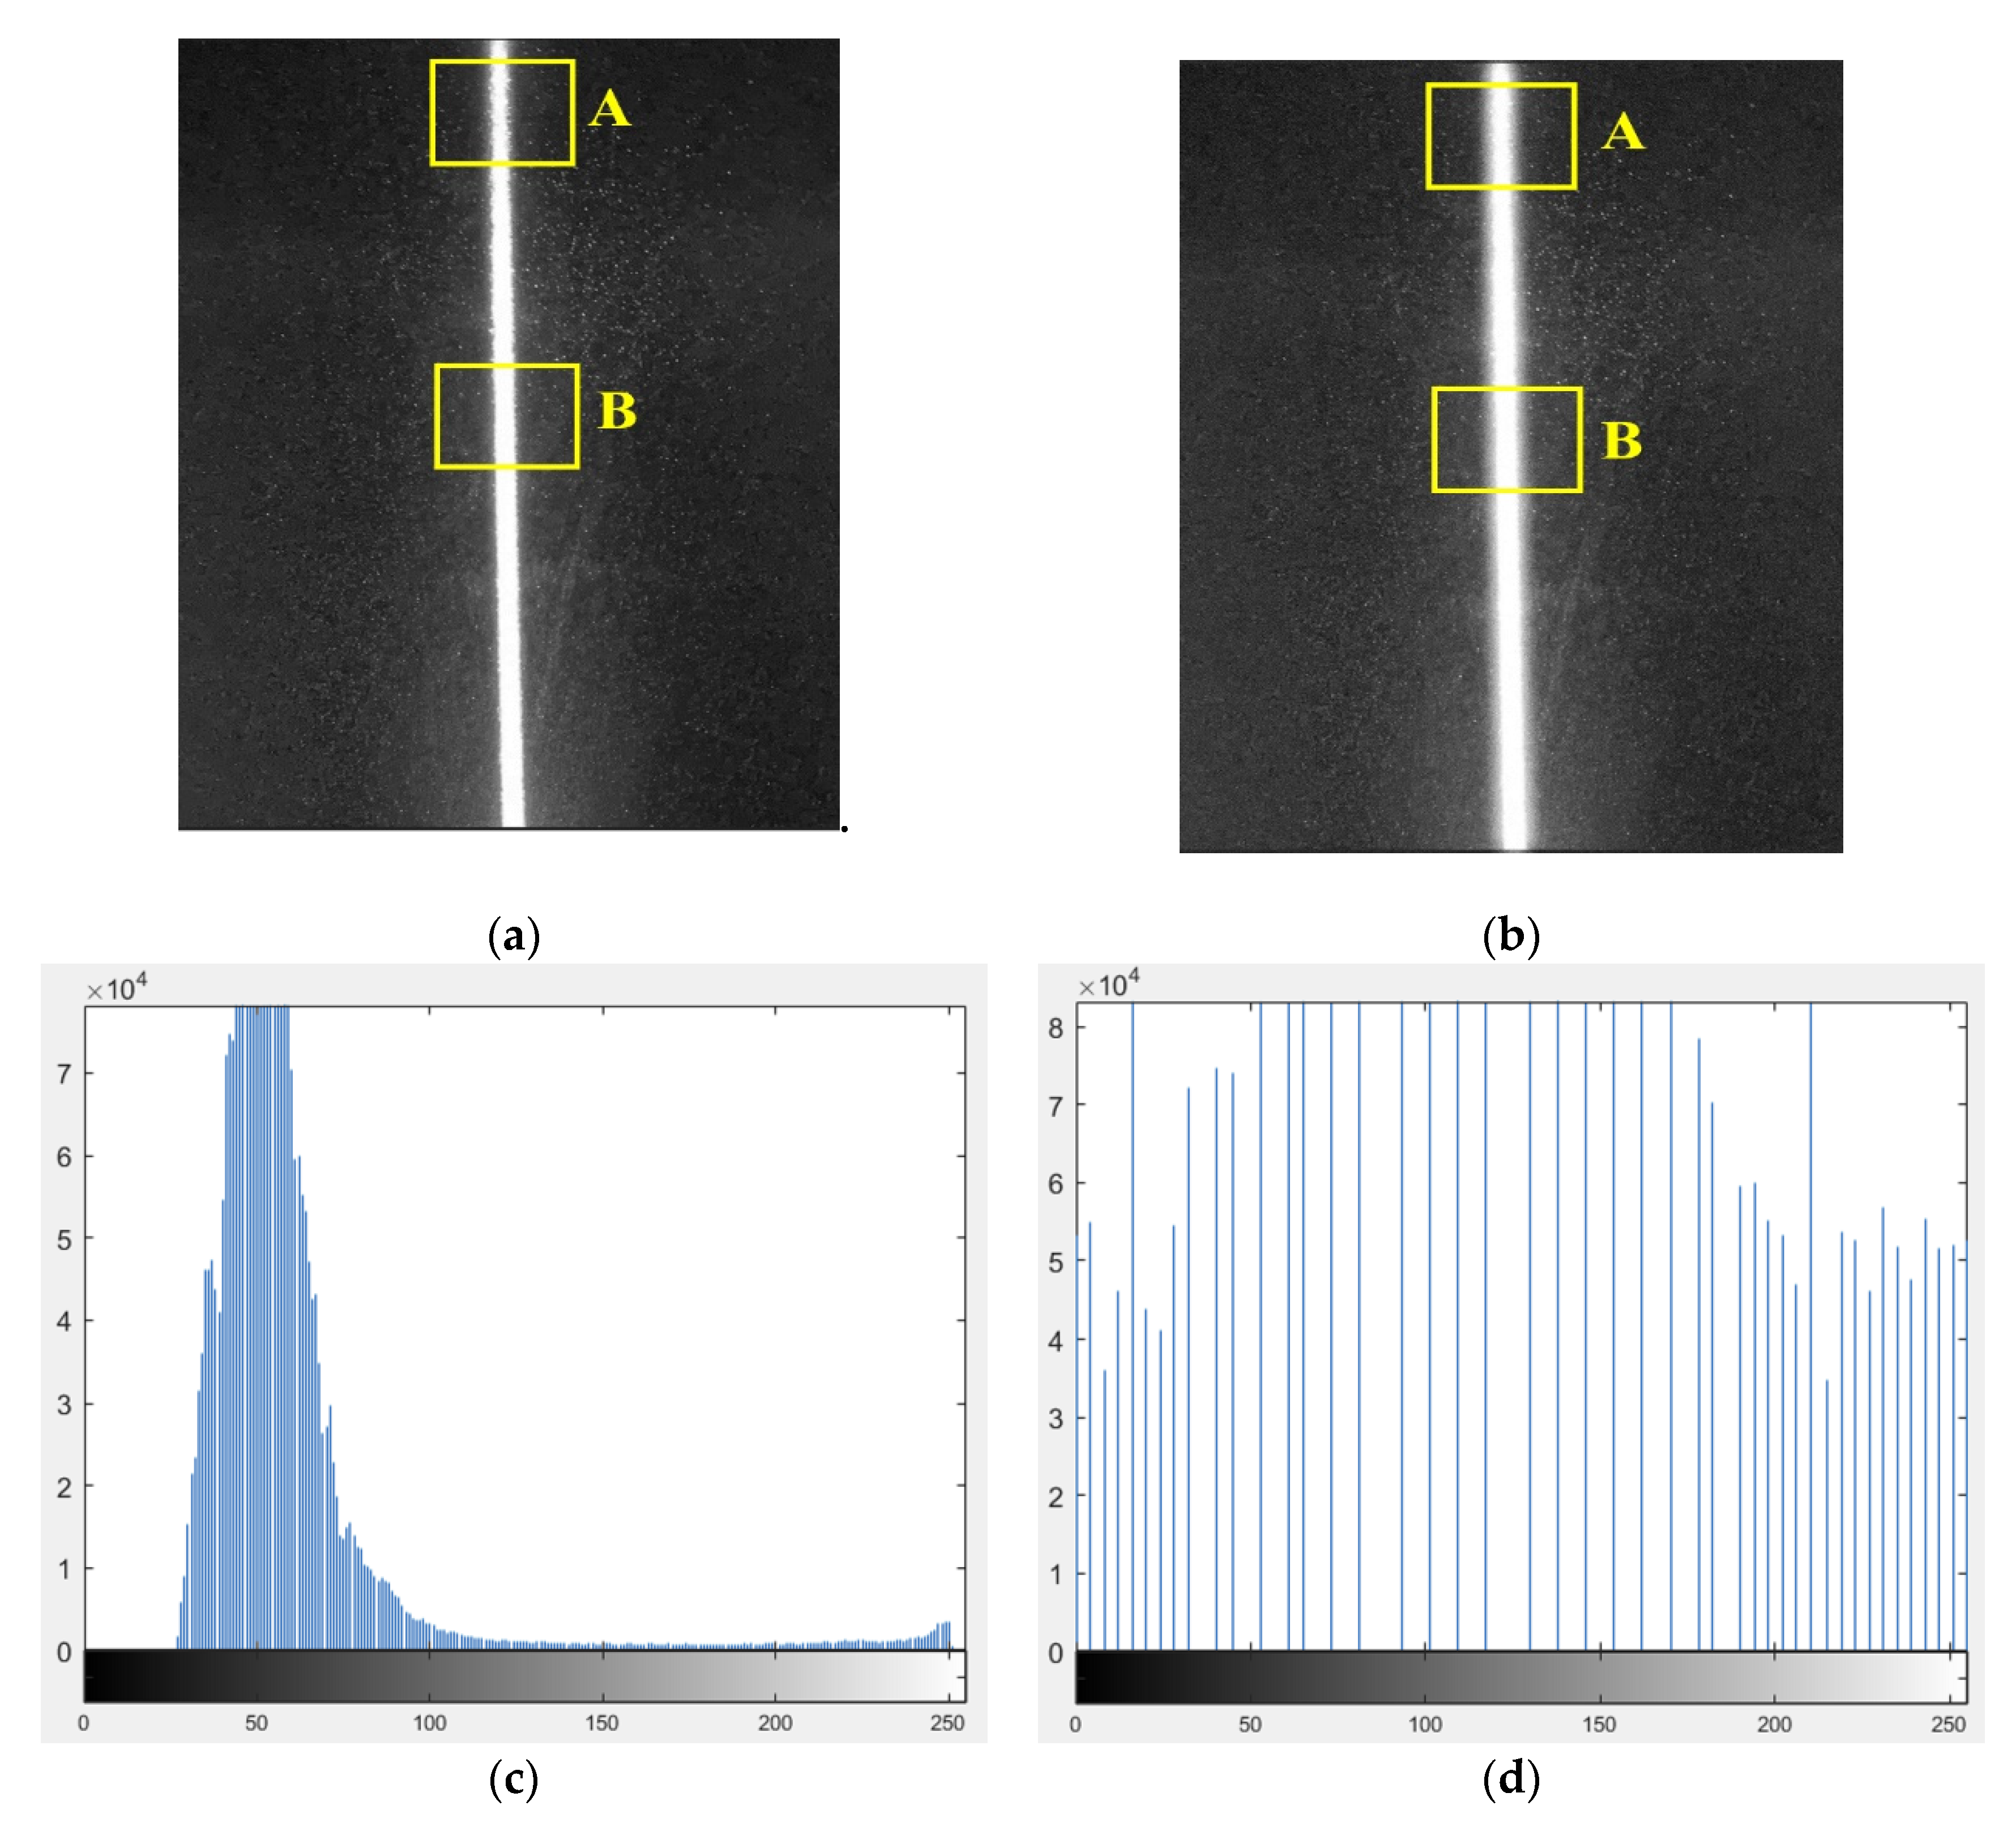
The original image of the light stripe and the image after the light intensity averaging are shown in Figure 6a,b, respectively. Their gray histograms are shown in Figure 6c,d, respectively. As can be seen from Figure 6c, the intensity of the original light stripe is Gaussian distribution, and the illumination intensity of the window B in the central region of the light stripe is larger than that of the window A in the end region of the light stripe. However, the light intensity of window A and window B is almost the same in the averaged intensity light stripe, which can also be proven from the nearly equal gray histogram in Figure 6d. It can prove the effectiveness of the proposed light stripe averaging algorithm.

5.2.2. Results of Light Stripe Center Extraction

The extraction result of light stripe center is shown in Figure 7a using the proposed method. For comparison, the skeleton-based method and the gray centroid-based method were used in light stripe center extraction, and their extraction results are shown in Figure 7b,c, respectively. It can be seen from Figure 7 that the proposed method can extract the light stripe center well without the interference of uneven illumination and noise. However, the other two methods extract the light stripe center incompletely, resulting in broken line or even unrecognizable phenomenon. The light stripe center extracted by the method in [36] is regarded as the extraction result of the standard light stripe shown in Figure 7d.
Three different positions were randomly selected as pixel reference points on the standard light stripe center. These three positions were correspondingly extracted on the light stripe centers that are extracted by the proposed method, the skeleton method, and the gray centroid method, respectively. The three position pixels were used to compare with the corresponding position pixels on the standard light stripe center. The comparison difference was counted, and the average value of the comparison difference of the three position pixels was recorded. Then, 360 images were divided into 90 small groups, with each group only containing one image of standard light stripe center, one result image of the proposed method, one result image of the skeleton method and one result image of the gray centroid method. The 90 small groups of pictures were randomly divided into 5 large groups. The maximum and minimum values of the difference between the center of light strip extracted by different methods and the standard method in each group are recorded in Table 1.
It can be seen from Table 1 that the maximum average deviation of the three different positions of the light stripe extracted by the proposed method from the corresponding positions of the standard light stripe is 0.031 pixel, and the minimum average deviation is 0.015 pixel. The maximum average deviations of the three different positions of the light stripe extracted by the skeleton method and the gray centroid method from the corresponding positions of the standard light stripe are 0.118 pixel and 0.104 pixel, respectively. Also, 0.025 pixel and 0.044 pixel are the minimum average deviations of the three different positions of the light stripe extracted by the skeleton method and the gray centroid method from the corresponding positions of the standard light stripe, respectively.
After extracting the light stripe center using the proposed method, the light plane equation is fitted by using the feature points on the center of multi light stripe. The light plane equation can be shown in Equation (10):
10 - 3 × ( 3.785 x + 0.089 y + 2.23 z   ) = 1

5.3. Measurement Experiment and Results

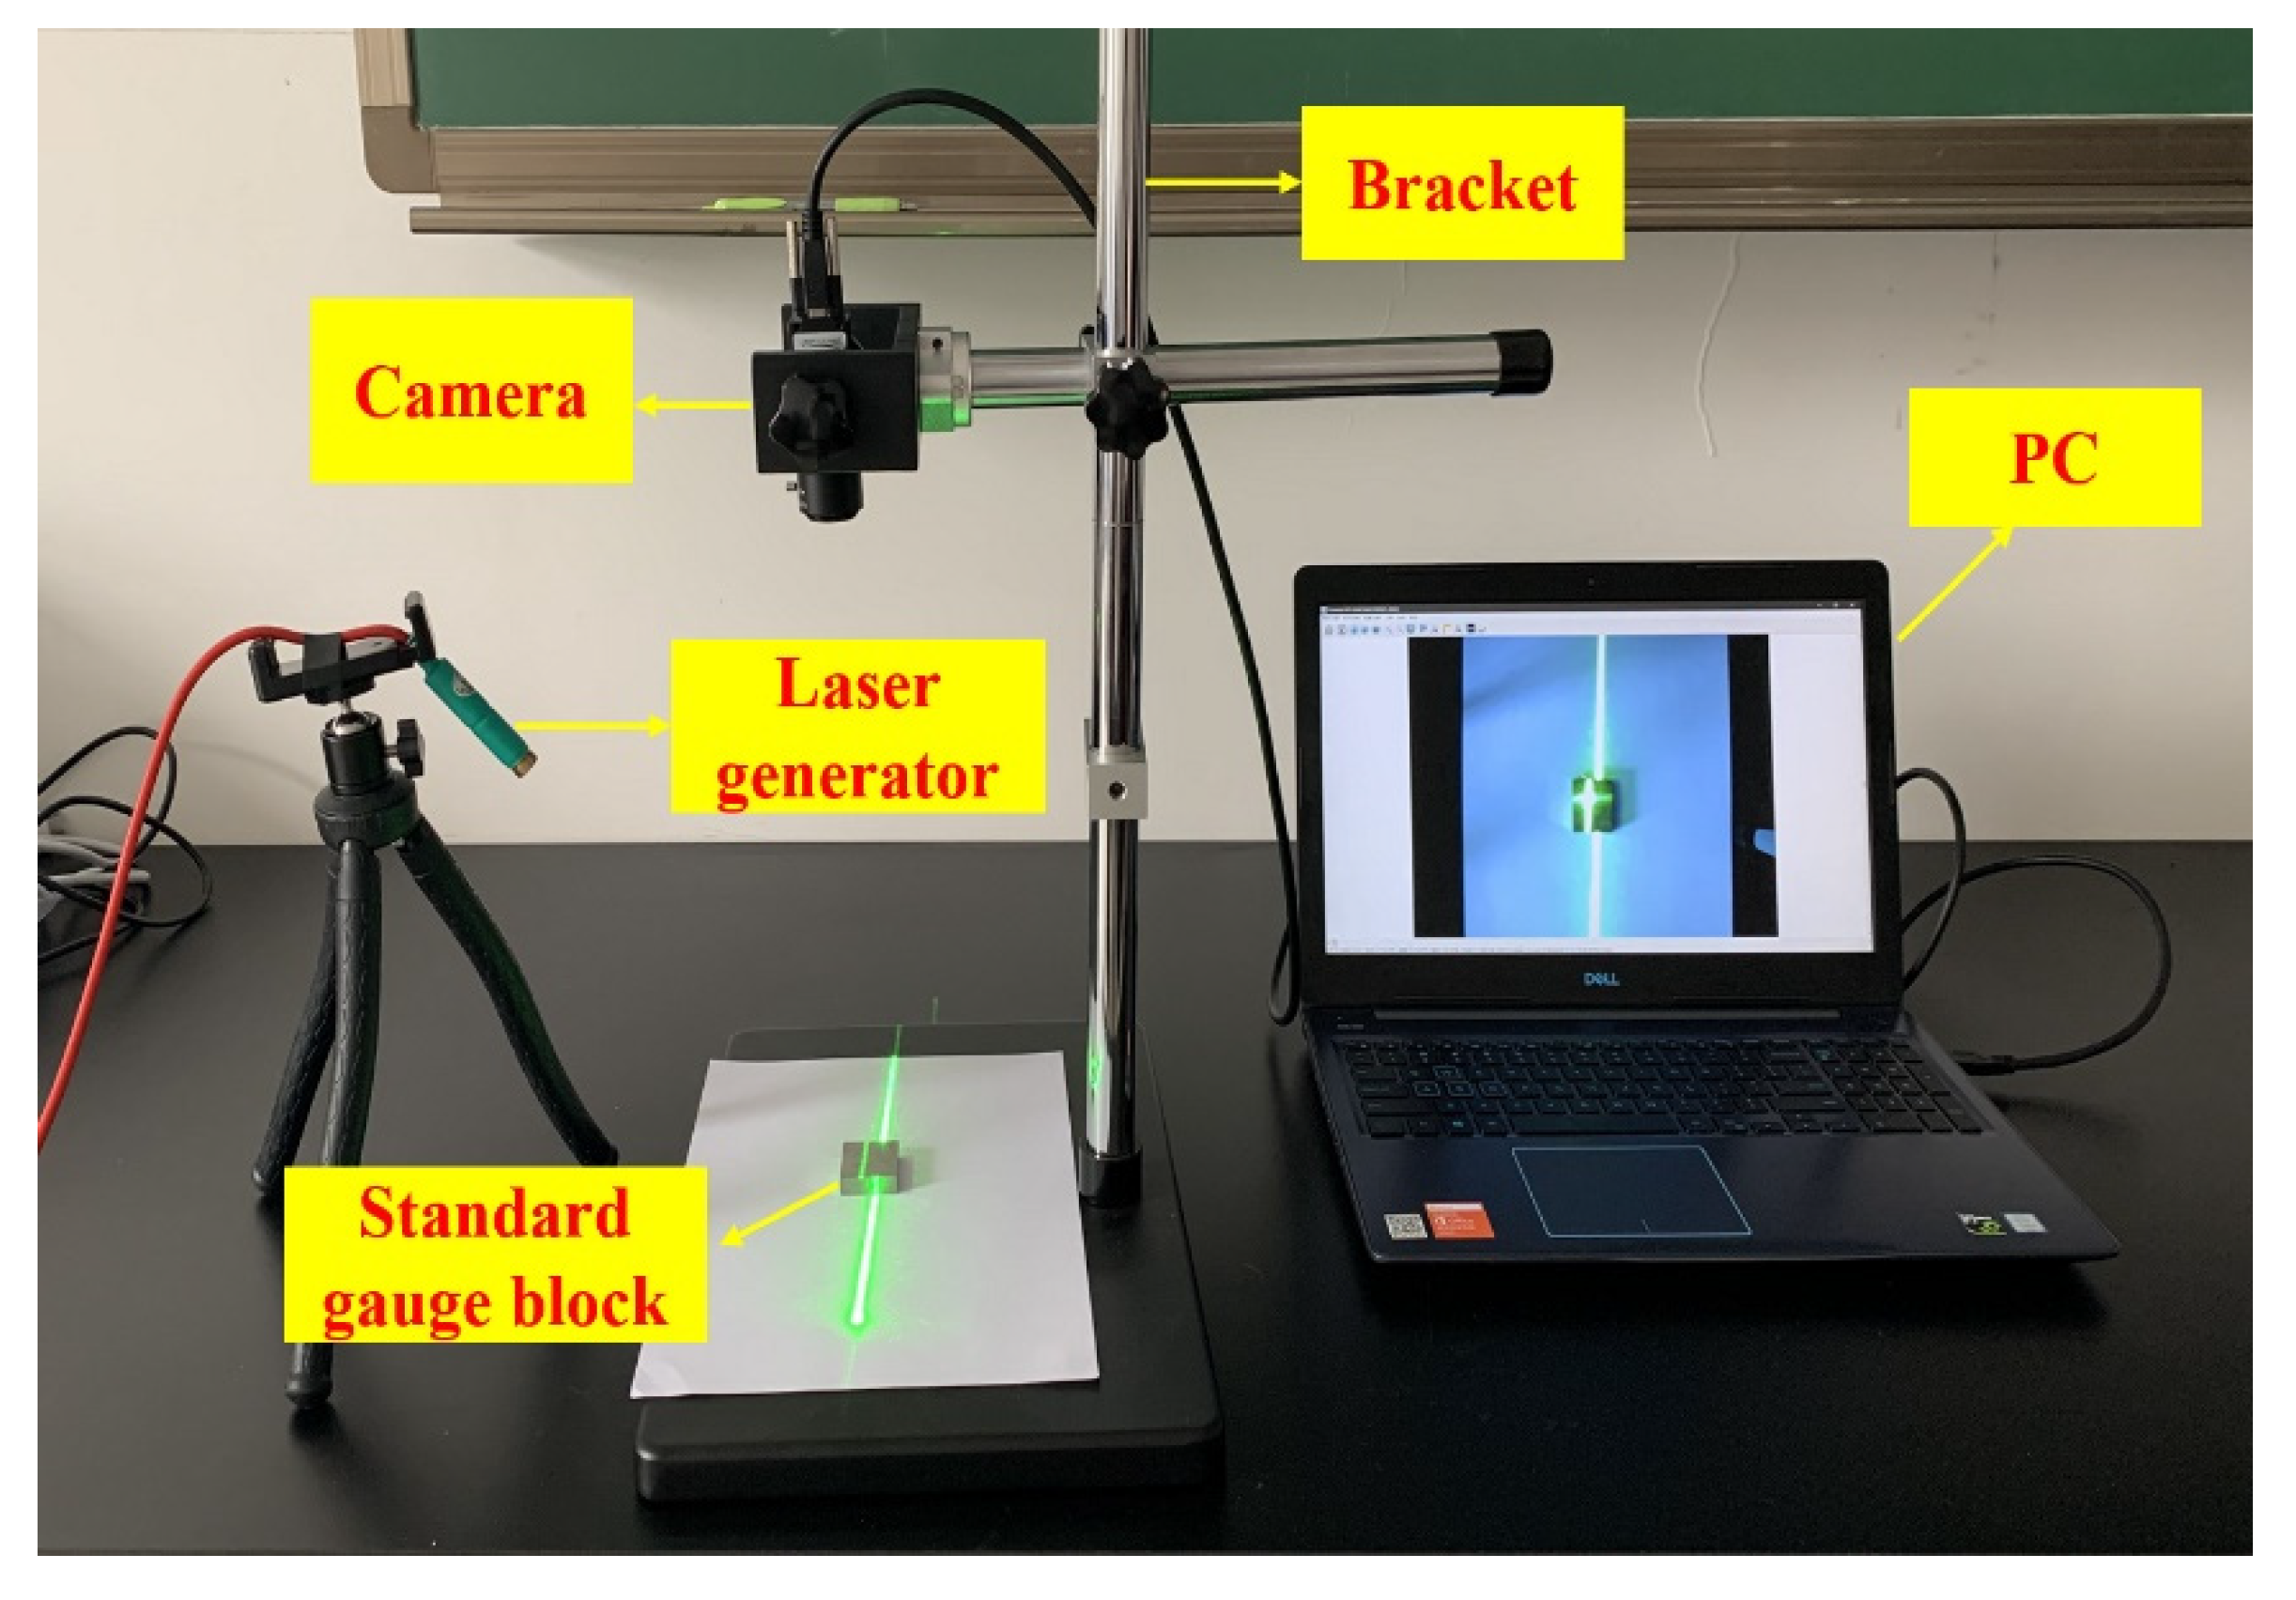
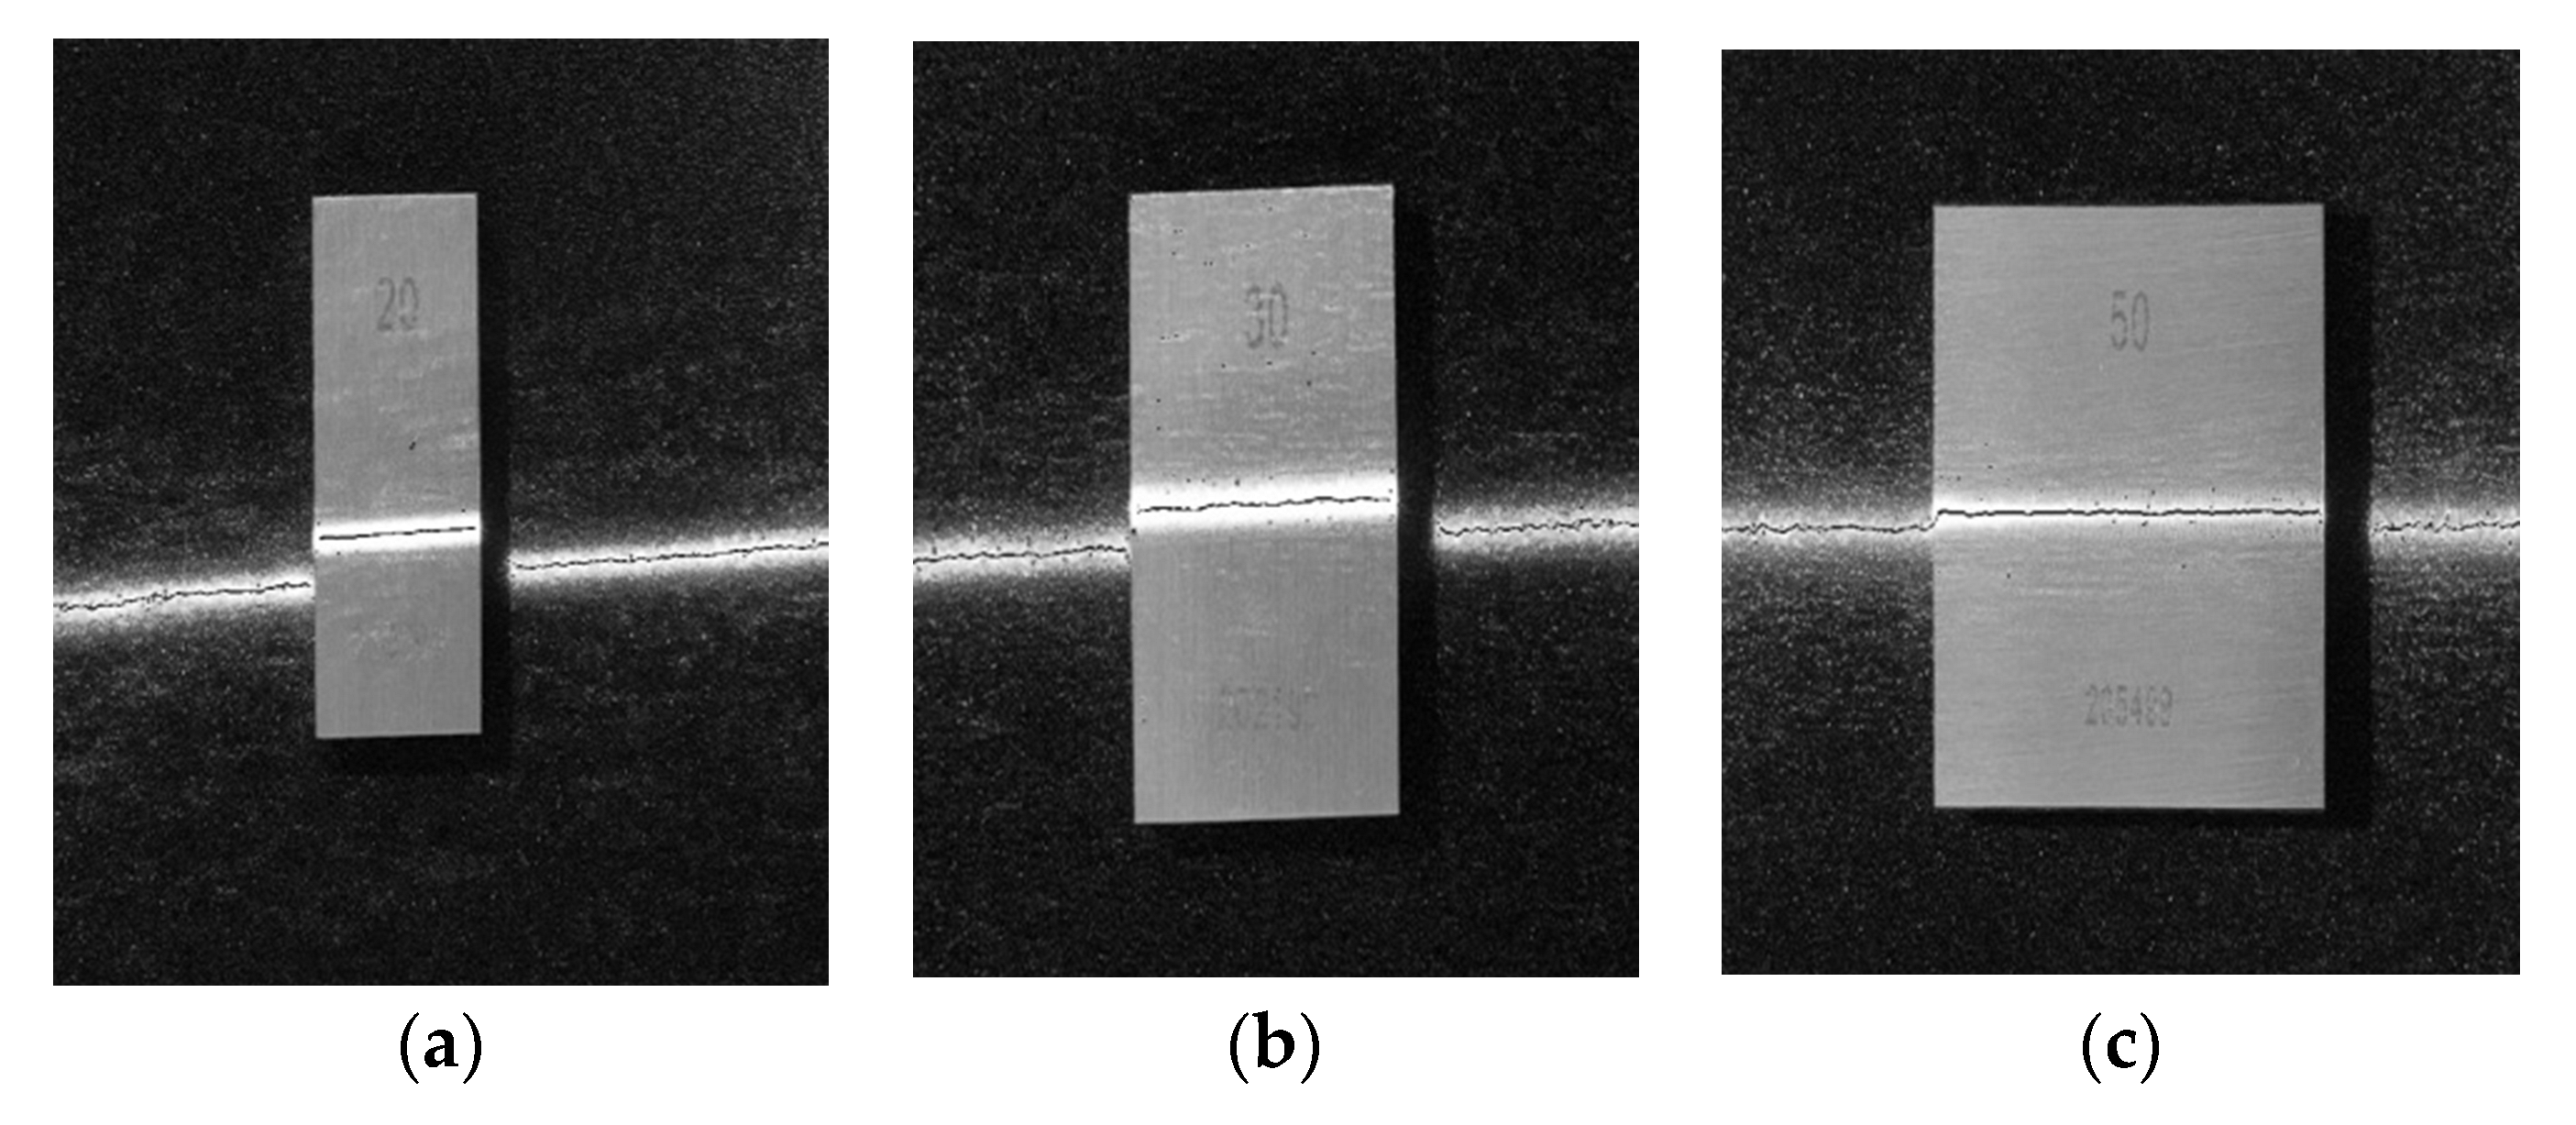
The laser generator, the color CCD industrial camera, and the lens compose our line structured light camera, which is used in the measurement experiment. The optical properties of the line structured light camera are that FOV (Field of View) is H 53°×V 28° and the working range is 30 mm to 2000 mm. It can be seen from the Figure 8 that the CCD camera is installed on the top of a bracket and connected to the PC by a cable with one USB3.0 interface. The PC configuration and the image processing software are the same as that used in the camera calibration experiment. Three kinds of standard gauge blocks with different specifications, namely 20 mm, 30 mm, and 50 mm, are used to verify the effectiveness of the proposed method. The angle between the laser and the normal of the calibration board is 45 degrees. The laser is projected on the surface of the standard gauge block by the laser generator. The results of light stripe center extraction of three standard gauge blocks with different specifications are shown in Figure 9a–c, respectively.
The above three different gauge blocks were measured by the proposed method, the skeleton method, and the gray centroid method. 50 pictures of each gauge block were acquired for the measurement experiment. The picture of each gauge block was used for measurement on three different positions of the gauge block surface. The average values of measurement values of the three positions were compared with the width values of the standard gauge block. The comparison difference values in pixels are recorded in Table 2 using the different methods. The absolute deviation values of measurement values of the three positions are recorded in Table 3 comparing with the standard values.
It can be seen from Table 2 that the maximum deviations between the average values measured at three different positions and the standard values of the three gauge blocks are 0.014 pixels, 0.021 pixels, and 0.016 pixels using the proposed method, respectively. However, the maximum deviations relative standard gauge block width values measured by the skeleton method and the gray centroid method are 0.094 pixels, 0.089 pixels, 0.105 pixels, and 0.085 pixels, 0.083 pixels, 0.092 pixels, respectively. The minimum deviations measured by the proposed method are 0.008 pixels, 0.008 pixels and 0.009 pixels, respectively. 0.017 pixels, 0.042 pixels, 0.056 pixels and 0.047 pixels, 0.057 pixels, 0.054 pixels are the minimum deviations measured by the skeleton method and the gray centroid method, respectively. In Table 3, the maximum absolute deviation are 0.013 pixels, 0.023 pixels, and 0.018 pixels using the proposed method, respectively. By using the skeleton method and the gray centroid method, the maximum absolute deviation are 0.102 pixels, 0.092 pixels, 0.113 pixels and 0.130 pixels, 0.104 pixels, 0.110 pixels, respectively. The minimum deviations measured by the proposed method, the skeleton method and the gray centroid method are 0.009 pixels, 0.015 pixels, 0.012 pixels, 0.064 pixels, 0.043 pixels, 0.062 pixels and 0.052 pixels, 0.042 pixels, 0.040 pixels, respectively.

6. Discussion

In order to improve the calibration accuracy of line structured light, a new calibration process is proposed based on image processing and analysis in this paper. In the system model of line structured light used in the study, the laser generator is not perpendicular to the measured workpiece. The distribution of light intensity on the surface of light stripe does not have the characteristics of Gaussian distribution, which increases the difficulty of illumination processing on the surface of light stripe. In the preprocessing process of light stripe image, the light intensity averaging algorithm can transform the irregular light intensity distribution on the surface of light stripe into a light stripe image with nearly uniform light intensity.
However, noise still exists in the segmented light stripe image, which seriously affects the extraction of light stripe width. The algorithm based on adaptive window can slide to search pixel information on the light stripe image. Through the scaling of the structure window and the pixel logic, the noise points and the pixels on the light strip surface can be effectively distinguished. From the results of light stripe extraction in Figure 7, we can see that the light stripe center extraction is complete. It can show that the proposed method effectively improves the gray centroid method by comparing Figure 7a with Figure 7c. In the comparison experiment of extracting the light stripe center, the proposed method can accurately extract the light stripe center.
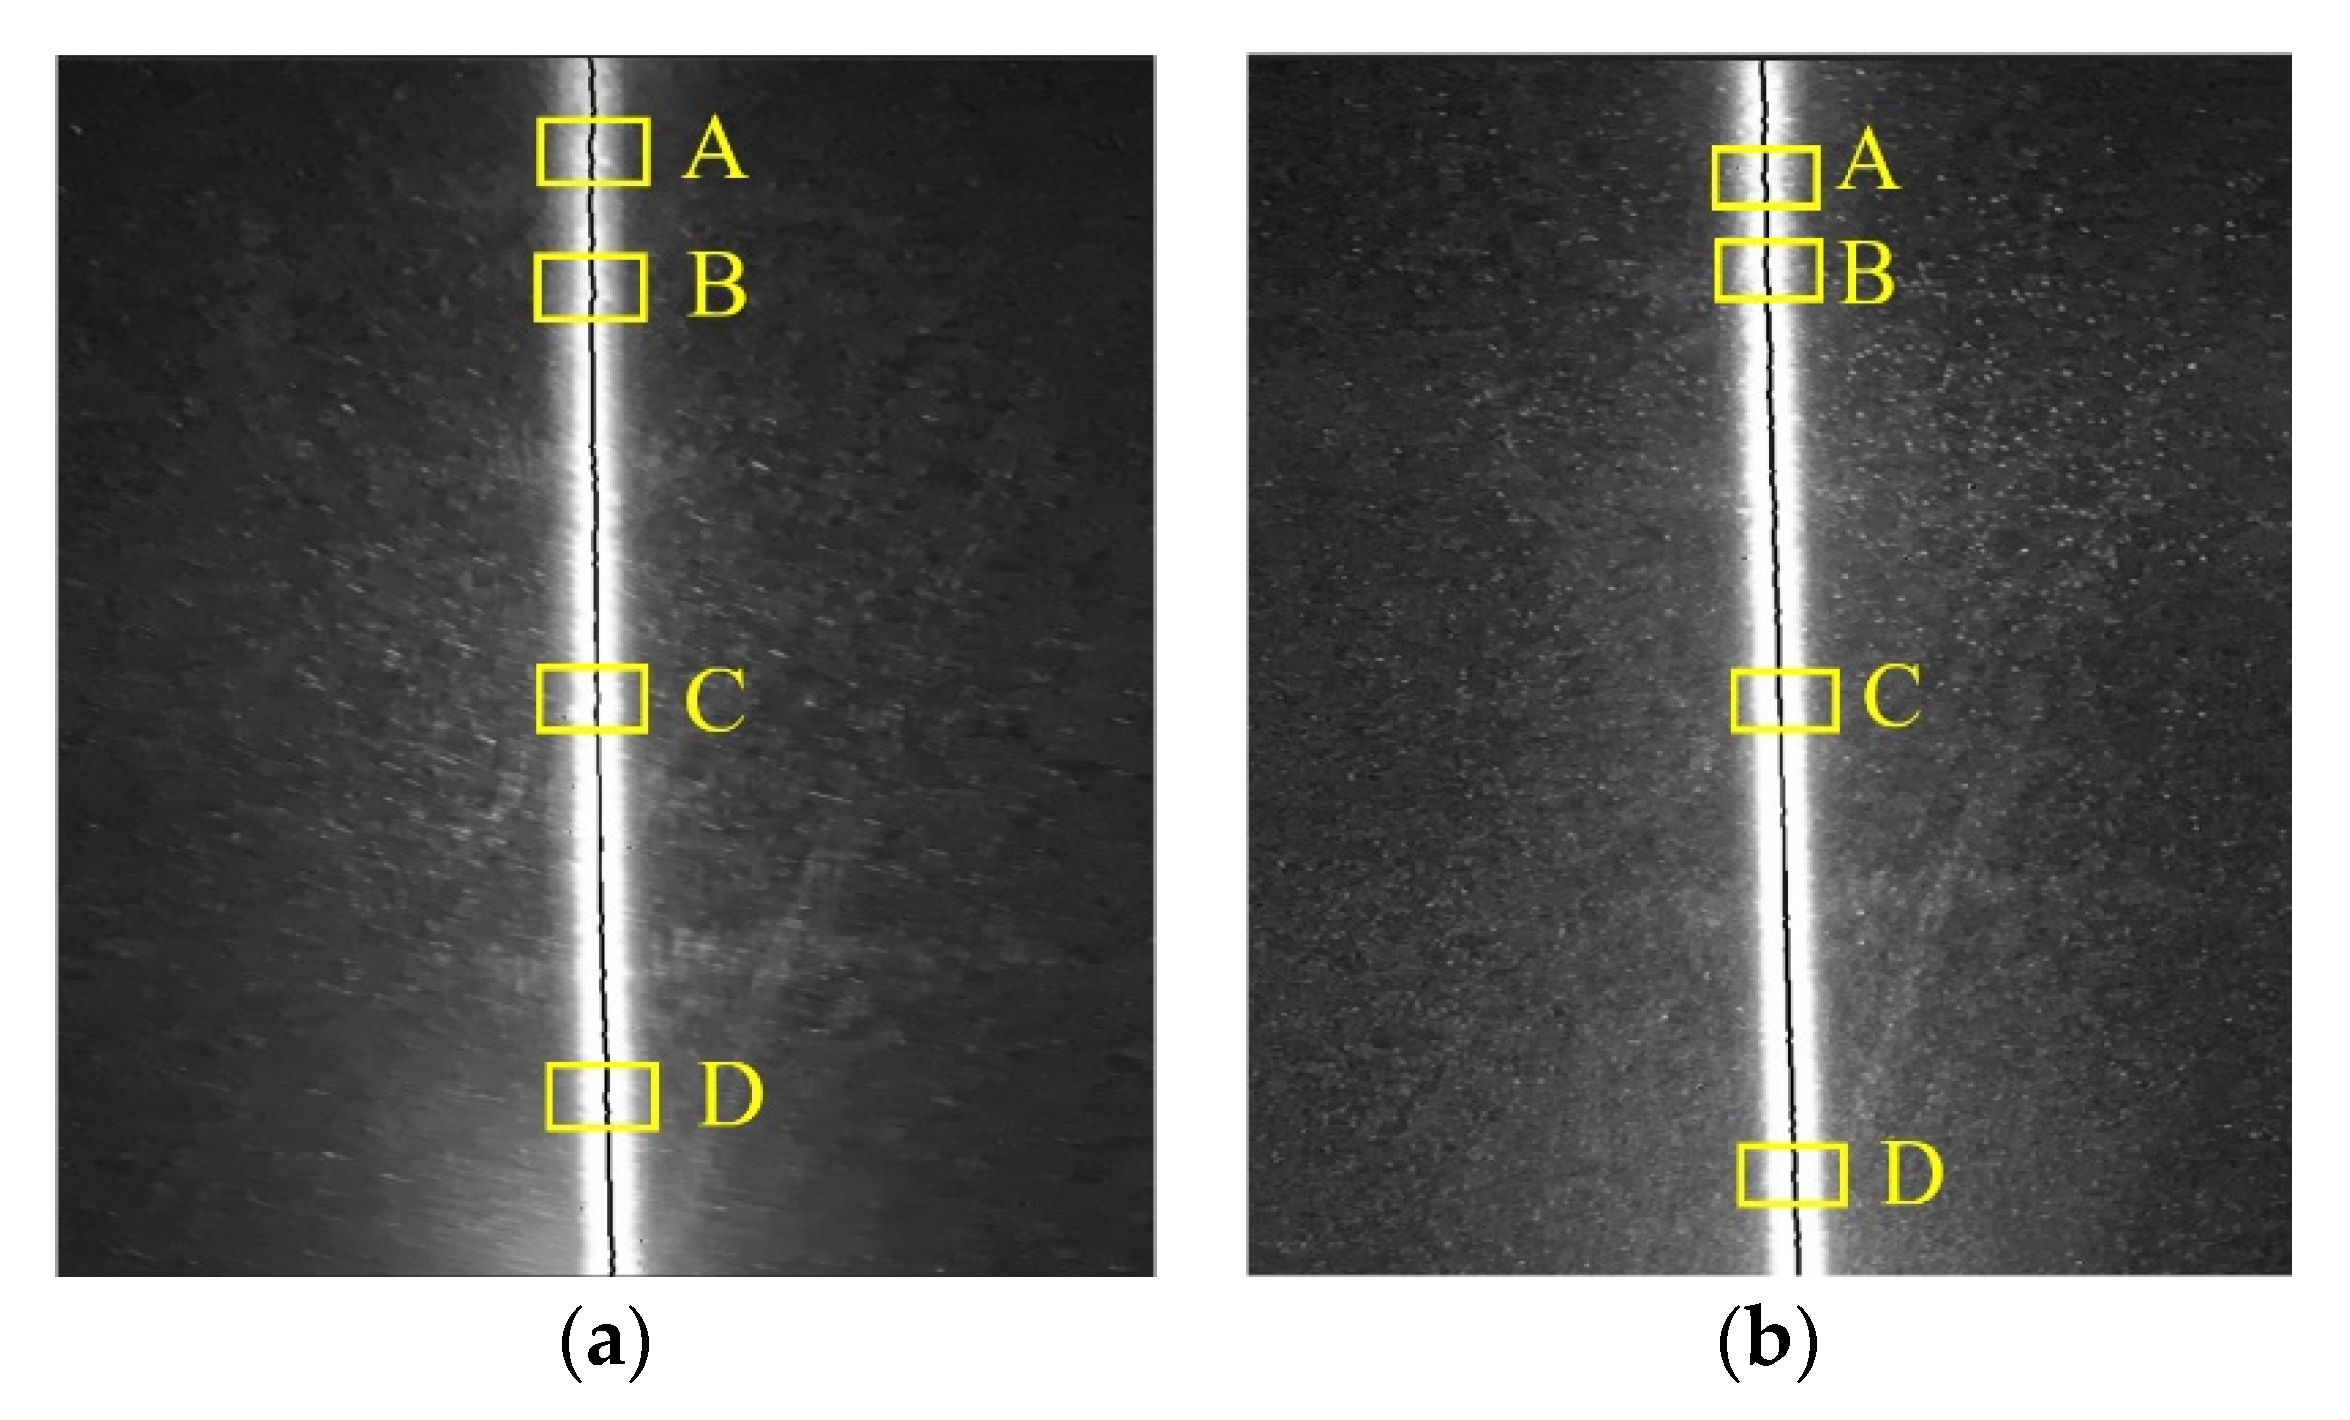
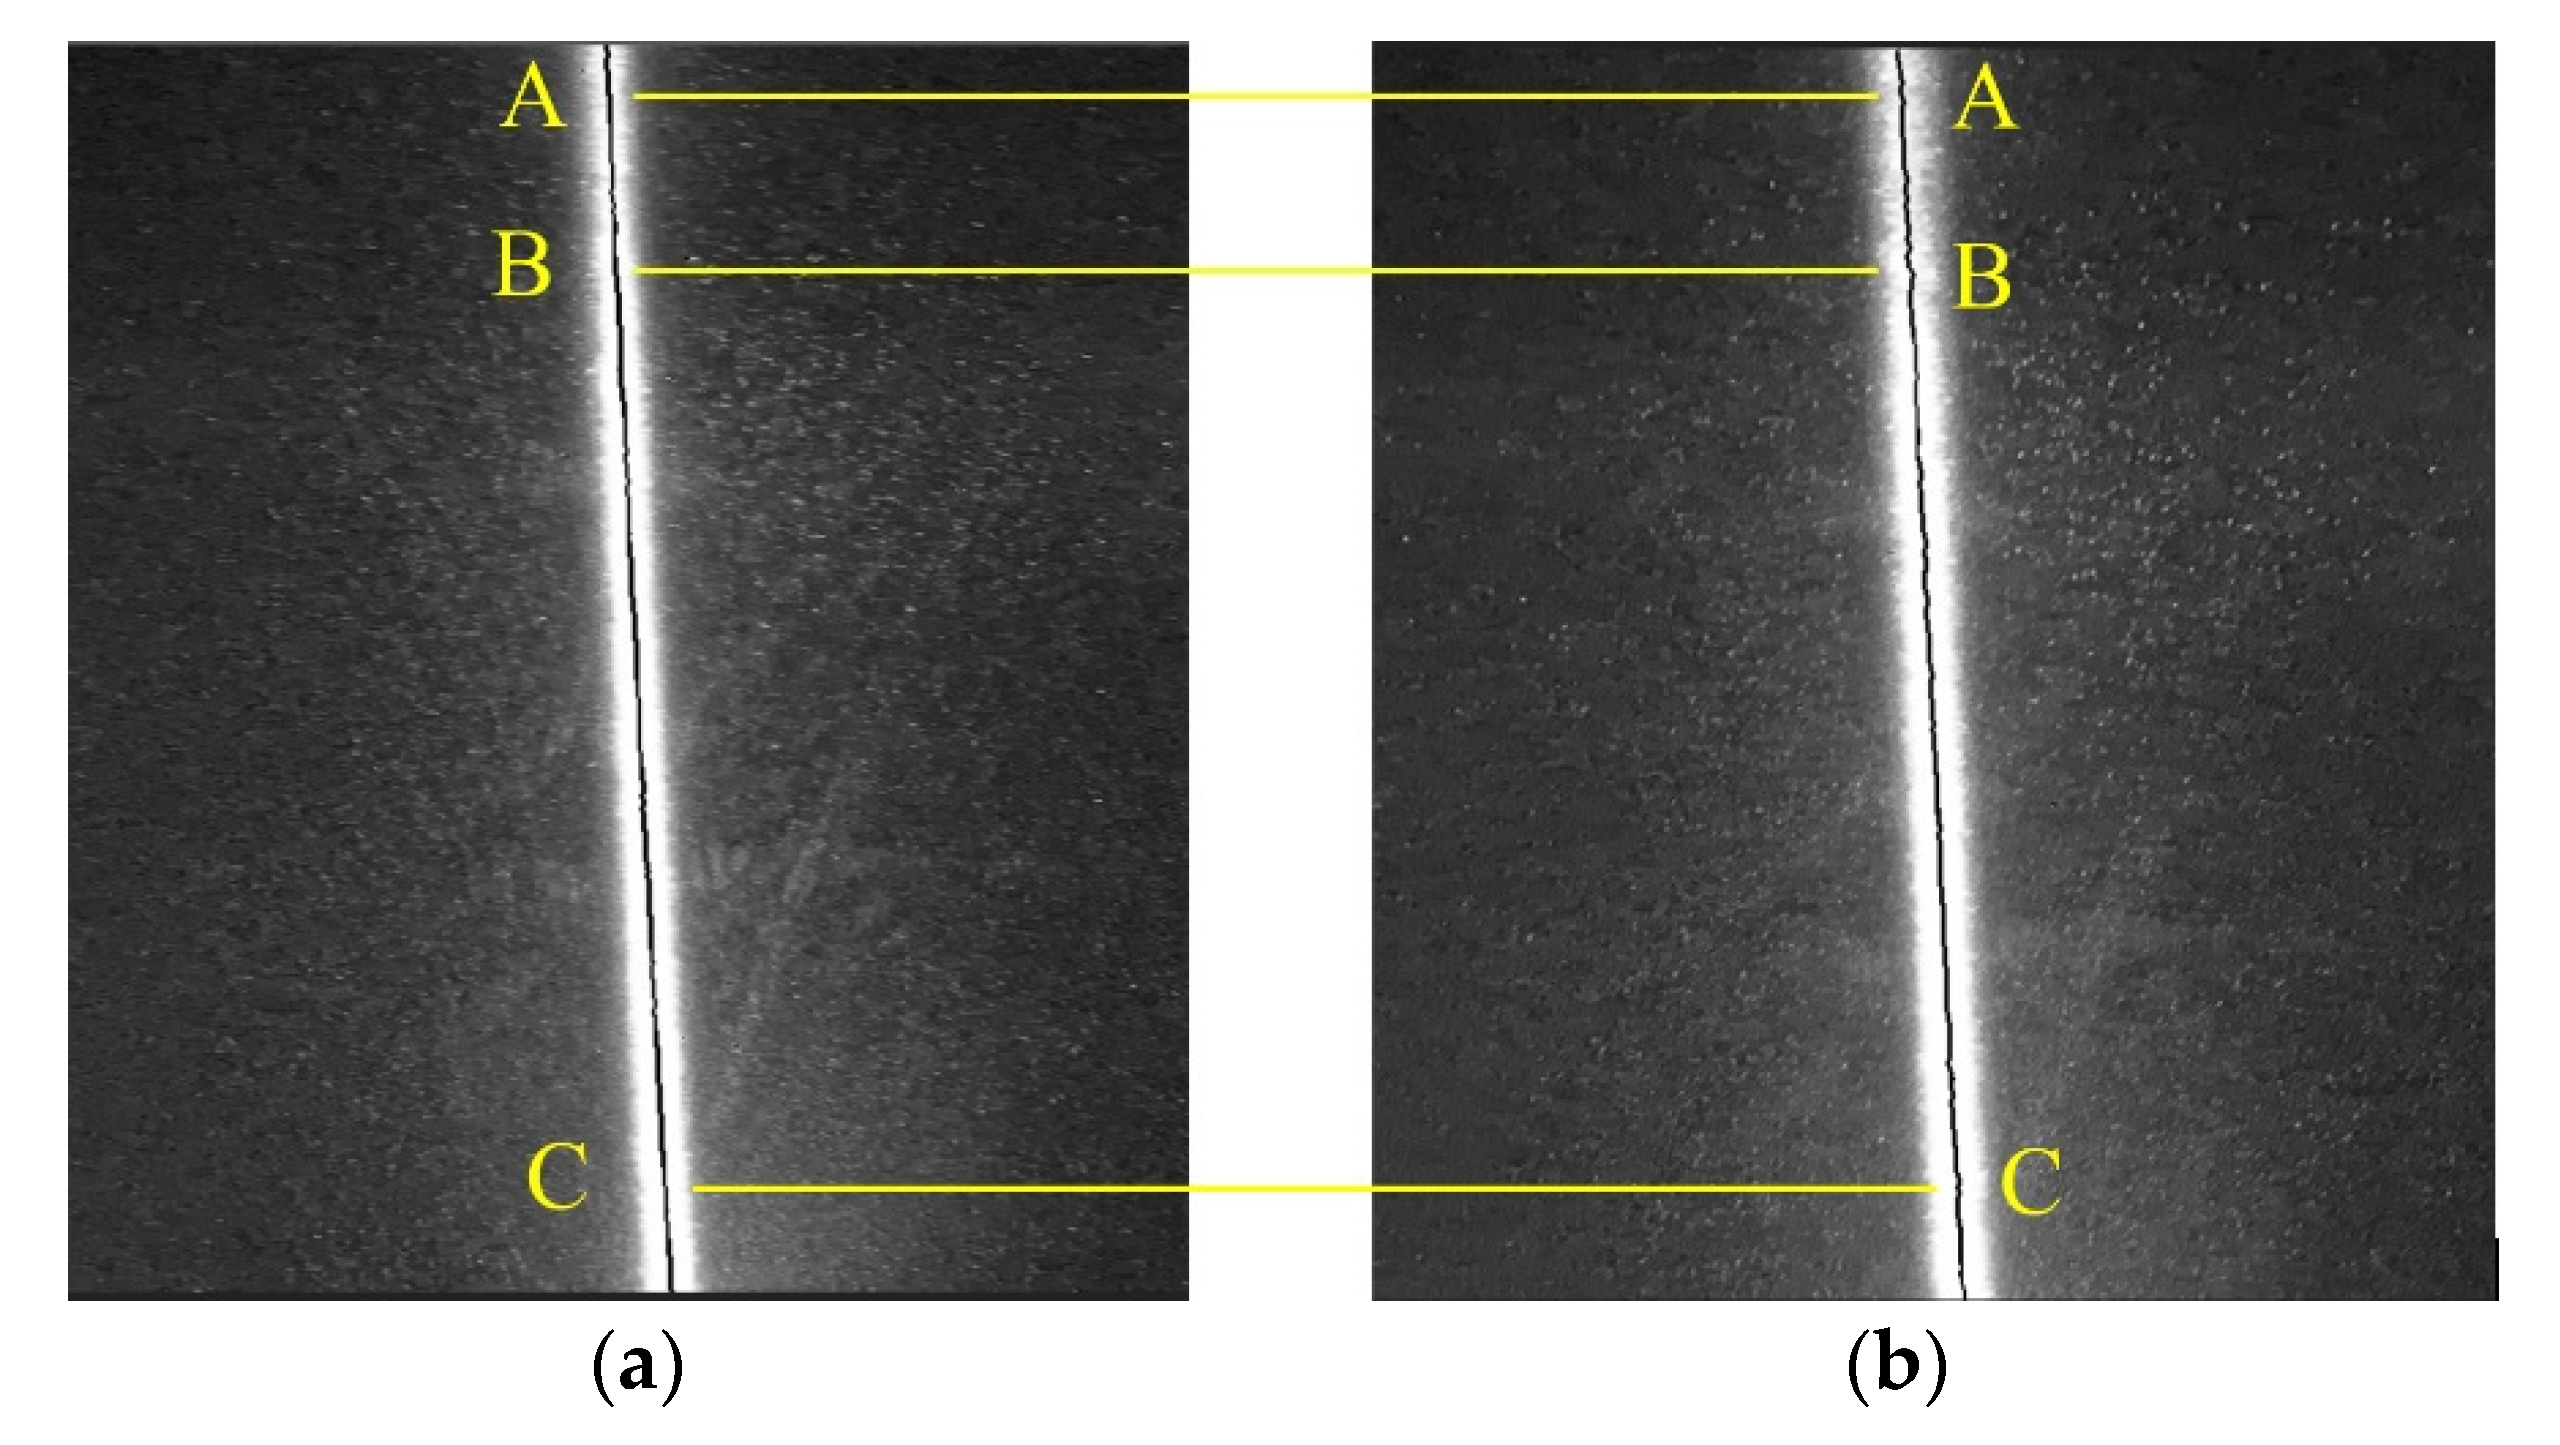
However, local wiggle phenomenon occurs in the light stripe centers extracted by both the proposed method and the standard method, which can be seen from the areas A, B, C, and D in Figure 10. The external noise and system noise make the edge waggle seriously when the laser generates the light stripe, which leads to the similarity between the edge pixels of the light stripe and the noise pixels. The error will appear when using algorithms to search the width of the light stripe, which eventually leads to the local waggle of the light stripe center. The waggle points usually appear continuously as shown in Figure 10 and Figure 11b. Our algorithm can search the edge pixels to determine the width of the light stripe, thus reduce the local waggle points on the basis of extracting the center of the light stripe completely as shown in Figure 11a. The influence of the edge noise on the extraction of light stripe center is also proved in the conclusion of [36].
In Table 1, a large number of statistical data show that the proposed method is more accurate than the other two methods in extracting the light stripe center. The maximum average deviation between the proposed method and the standard method is only 0.031 pixel and the minimum average deviation is 0.015 pixel, which implies the effectiveness of the illumination averaging method and the adaptive window. In the standard gauge block measurement experiment, the proposed method can extract the light stripe center on the smooth gauge block surface, and the average error with the gauge block width is between 0.008 pixel and 0.021 pixel. The standard experiment shows that the proposed algorithm can extract the light stripe center stably. The above discussions implied the feasibility and accuracy of our proposed process of line structured light calibration.

7. Conclusions

In this study, the calibration method of line structured light was studied to improve the measurement accuracy based on the line structured light. A calibration process framework was proposed for the line structure light system based on the image analysis. A 3D vision model of the line structure light system was established. The surface illumination of the light stripe was equalized to eliminate the interference of uneven illumination using the proposed light equalization algorithm. After extracting the light stripe using the image segmentation algorithm, the width of the light stripe was accurately obtained by using the adaptive sliding window-based algorithm. Thus, the light stripe center was extracted by the gray barycenter method, and the line structured light plane was fitted by the feature points on the extracted light center. Finally, the conclusions could be obtained in the measurement experiment of standard gauge block width, such as the maximum average deviation of 0.021 pixels, the minimum average deviation of 0.008, the maximum absolute deviation of 0.023, and the minimum absolute deviation of 0.009, which shows the accuracy of the proposed framework.
This study only proposed an algorithm flow to overcome the uneven illumination on the surface of the light stripe, filter out the redundant noise, and then accurately search the width of the light stripe and measure the width of the standard gauge block in the experimental environment. However, the future research focus is that the line structure light calibration in unstructured environment such as the light stripe center fitting under the occluded light condition.

Author Contributions

All authors contributed to the work of this paper. T.L. reviewed the relevant literatures and wrote the sections of introduction and literature review. C.W. designed the whole algorithm flow and supervised the writing of the article. S.L. wrote the sections of system model and calibration process. X.Z. designed the experiment and tested the method with the experiment. Q.F. and X.Z. analyzed the experiment results. All authors have read and agreed to the published version of the manuscript.

Funding

This research was funded by Subproject of the National Key Research and Development Program of China, grant number 2018YFB2001403-02.

Institutional Review Board Statement

Not applicable.

Informed Consent Statement

Not applicable.

Data Availability Statement

Not applicable.

Acknowledgments

This project was supported by the Subproject of the National Key Research and Development Program of China (No. 2018YFB2001403-02).

Conflicts of Interest

The authors declare no conflict of interest.

References

  1. Maul, A.; Mari, L.; Torres Irribarra, D.; Wilson, M. The quality of measurement results in terms of the structural features of the measurement process. Measurement 2018, 116, 611–620. [Google Scholar] [CrossRef]
  2. Wang, Z. Review of real-time three-dimensional shape measurement techniques. Measurement 2020, 156, 107624. [Google Scholar] [CrossRef]
  3. Suk, J.; Kim, S.; Ryoo, I. Non-Contact Plant Growth Measurement Method and System Based on Ubiquitous Sensor Network Technologies. Sensors 2011, 11, 4312–4334. [Google Scholar] [CrossRef] [PubMed]
  4. Hishikawa, Y.; Yamagoe, K.; Onuma, T. Non-contact measurement of electric potential of photovoltaic cells in a module and novel characterization technologies. Jpn. J. Appl. Phys. 2015, 54, 8KG05. [Google Scholar] [CrossRef]
  5. Wei, Y.; Ding, Z.; Huang, H. A non-contact measurement method of ship block using image-based 3D reconstruction technology. Ocean Eng. 2019, 178, 463–475. [Google Scholar] [CrossRef]
  6. Kulik, E.A.; Cahalan, P. Laser Profilometry of Polymeric Materials. Cells Mater. 1997, 17, 103–109. [Google Scholar]
  7. Mita, G.; Dobránsky, J.; Rubarsk, J.; Olejárová, S. Application of Laser Profilometry to Evaluation of the Surface of the Workpiece Machined by Abrasive Waterjet Technology. Appl. Sci. 2019, 9, 2134. [Google Scholar] [CrossRef] [Green Version]
  8. Krenický, T. Non-contact study of surfaces created using the AWJ technology. Manuf. Technol. 2015, 15, 61–64. [Google Scholar] [CrossRef]
  9. Xua, X.; Fei, Z.; Yang, J.; Tan, Z.; Luo, M. Line structured light calibration method and centerline extraction: A review. Results Phys. 2020, 19, 103637. [Google Scholar] [CrossRef]
  10. Chen, F.; Brown, G.; Song, M. Overview of three-dimensional shape measurement using optical methods. Opt. Eng. 1999, 39, 10–22. [Google Scholar] [CrossRef]
  11. Liu, M.; Zhang, X.; Zhang, Y.; Lyu, S. Calibration algorithm of mobile robot vision camera. Int. J. Precis. Eng. Manuf. 2016, 1, 51–57. [Google Scholar] [CrossRef]
  12. Heinze, C.; Sptropouls, S.; Hussmann, S.; Perwass, C. Automated robust metric calibration algorithm for multifocus plenoptic cameras. IEEE Trans. Instrum. Meas. 2016, 65, 1197–1205. [Google Scholar] [CrossRef]
  13. Risholm; Petter, T.; Kirkhus; Trine, T.; Jens, T.; Thorstensen, J. Adaptive Structured Light with Scatter Correction for High-Precision Underwater 3D Measurements. Sensors 2019, 19, 1043. [Google Scholar] [CrossRef] [PubMed] [Green Version]
  14. Xin, J.; Shi, J.; Chao, D.; Bin, S. On site calibration of inner defect detection based on structured light. Vibroeng. Procedia 2018, 20, 161–166. [Google Scholar] [CrossRef]
  15. Han, Y.; Fan, J.; Yang, X. A structured light vision sensor for on-line weld bead measurement and weld quality inspection. Int. J. Adv. Manuf. Technol. 2020, 106, 2065–2078. [Google Scholar] [CrossRef]
  16. Ha, J.; Her, K. Calibration of structured light stripe system using plane with slits. Opt. Eng. 2013, 52, 1–4. [Google Scholar] [CrossRef] [Green Version]
  17. Nan, M.; Kun, W.; Ze, X.; Ping, R. Calibration of a flexible measurement system based on industrial articulated robot and structured light sensor. Opt. Eng. 2017, 56, 1–9. [Google Scholar] [CrossRef]
  18. Liu, S.; Zhang, Y.; Zhang, Y.; Shao, T.; Yuan, M. Research on 3D measurement model by line structure light vision. Eurasip. J. Image Video Process. 2018, 1, 1. [Google Scholar] [CrossRef] [Green Version]
  19. Li, Z.; Cui, J.; Wu, J.; Zhou, T.; Tan, J. A uniform and flexible model for three-dimensional measurement of line-structured light sensor. Tenth Int. Symp. Precis. Eng. Meas. Instrum. 2019, 11053, 110534N. [Google Scholar] [CrossRef]
  20. Li, G.; Tan, Q.; Kou, Y.; Zhang, Y. A New Method for Calibrating Line Structured-light 3D Measurement Model. Acta Photonica Sin. 2013, 42, 1334–1339. [Google Scholar] [CrossRef]
  21. Ze, X.; Peng, F.; Peng, Y.; Ping, R. Calibration of 6-DOF industrial robots based on line structured light. Optik. 2019, 183, 1166–1178. [Google Scholar] [CrossRef]
  22. Sun, Q.; Liu, R.; Zhang, H.; Tan, Q. A complete calibration method for a line structured light vision system. Lasers Eng. 2017, 37, 77–93. [Google Scholar]
  23. Xin, Y.; Zi, M.; Tian, F.; Peng, L. Novel calibration method for axes in line structured light vision measurement system. Chin. J. Lasers 2012, 39, 1–9. [Google Scholar] [CrossRef]
  24. Orghidan, R.; Salvi, J.; Gordan, M.; Florea, C.; Batlle, J. Structured light self-calibration with vanishing points. Mach. Vis. Appl. 2014, 25, 489–500. [Google Scholar] [CrossRef] [Green Version]
  25. Liu, Z.; Li, X.; Li, F.; Zhang, G. Calibration method for line-structured light vision sensor based on a single ball target. Opt. Lasers Eng. 2015, 69, 20–28. [Google Scholar] [CrossRef]
  26. Ke, F.; Xie, J.; Chen, Y. A flexible and high precision calibration method for the structured light vision system. Optik 2016, 127, 310–314. [Google Scholar] [CrossRef]
  27. Zeng, H.; Tang, S.; Song, Z.; Gu, F.; Huang, Z. Calibration of a Structured Light Measurement System Using Binary Shape Coding. Comput. Vis. Syst. 2017, 10528, 603–614. [Google Scholar] [CrossRef]
  28. Suresh, V.; Holton, J.; Beiwen, L. Structured light system calibration with unidirectional fringe patterns. Opt. Laser Eng. 2018, 106, 86–93. [Google Scholar] [CrossRef]
  29. Pan, X.; Liu, Z. High-accuracy calibration of line-structured light vision sensor by correction of image deviation. Opt. Express 2019, 27, 4364–4385. [Google Scholar] [CrossRef] [PubMed]
  30. Shao, M.; Dong, J.; Madessa, A. A new calibration method for line-structured light vision sensors based on concentric circle feature. J. Eur. Opt. Soc. Rapid. 2019, 15, 1. [Google Scholar] [CrossRef] [Green Version]
  31. Steger, C. An unbiased detector of curvilinear structures. IEEE Trans. Pattern. Anal. 1998, 20, 113–125. [Google Scholar] [CrossRef] [Green Version]
  32. Jang, J.H.; Hong, K.S. Detection of curvilinear structures and reconstruction of their regions in gray-scale images. Pattern. Recogn. 2002, 35, 807–824. [Google Scholar] [CrossRef]
  33. Izquierdo, M.A.G.; Sanchez, M.T. Sub-pixel measurement of 3D surfaces by laser scanning. Sens. Actuators A Phys. 1999, 76, 1–8. [Google Scholar] [CrossRef]
  34. Seokbae, S.; Hyunpung, P.; Lee, K.H. Automated laser scanning system for reverse engineering and inspection. Int. J. Mach. Tool. Manuf. 2002, 42, 889–897. [Google Scholar] [CrossRef]
  35. Mei, J.; Lai, L. Development of a novel line structured light measurement instrument for complex manufactured parts. Rev. Sci. Instrum. 2019, 90, 67–77. [Google Scholar] [CrossRef]
  36. Sun, Q.; Hou, Y.; Tan, Q.; Xu, Z. A fast and robust detection algorithm for extraction of the center of a structured light stripe. Lasers Eng. 2015, 31, 41–51. [Google Scholar]
  37. Cao, M.; Wang, D. The Application of CCD Pixel Positioning Subdivision in the Reach of Laser Triangulation Measurement. Int. J. Multimed. Ubiquitous Eng. 2016, 11, 41–51. [Google Scholar] [CrossRef]
  38. Zhang, L.; Zhang, Y.; Chen, B. Improving the extracting precision of stripe center for structured light measurement. Optik 2020, 58, 9603–9613. [Google Scholar] [CrossRef]
  39. Zhang, Z. A flexible new technique for camera calibration. IEEE Trans. Pattern. Anal. 2000, 22, 1330–1334. [Google Scholar] [CrossRef] [Green Version]
  40. More, J.J. The Levenberg-Marquardt Algorithm: Implementation and Theory. Numerical Analysis; Springer: Berlin/Heidelberg, Germany, 1978; pp. 105–116. [Google Scholar]
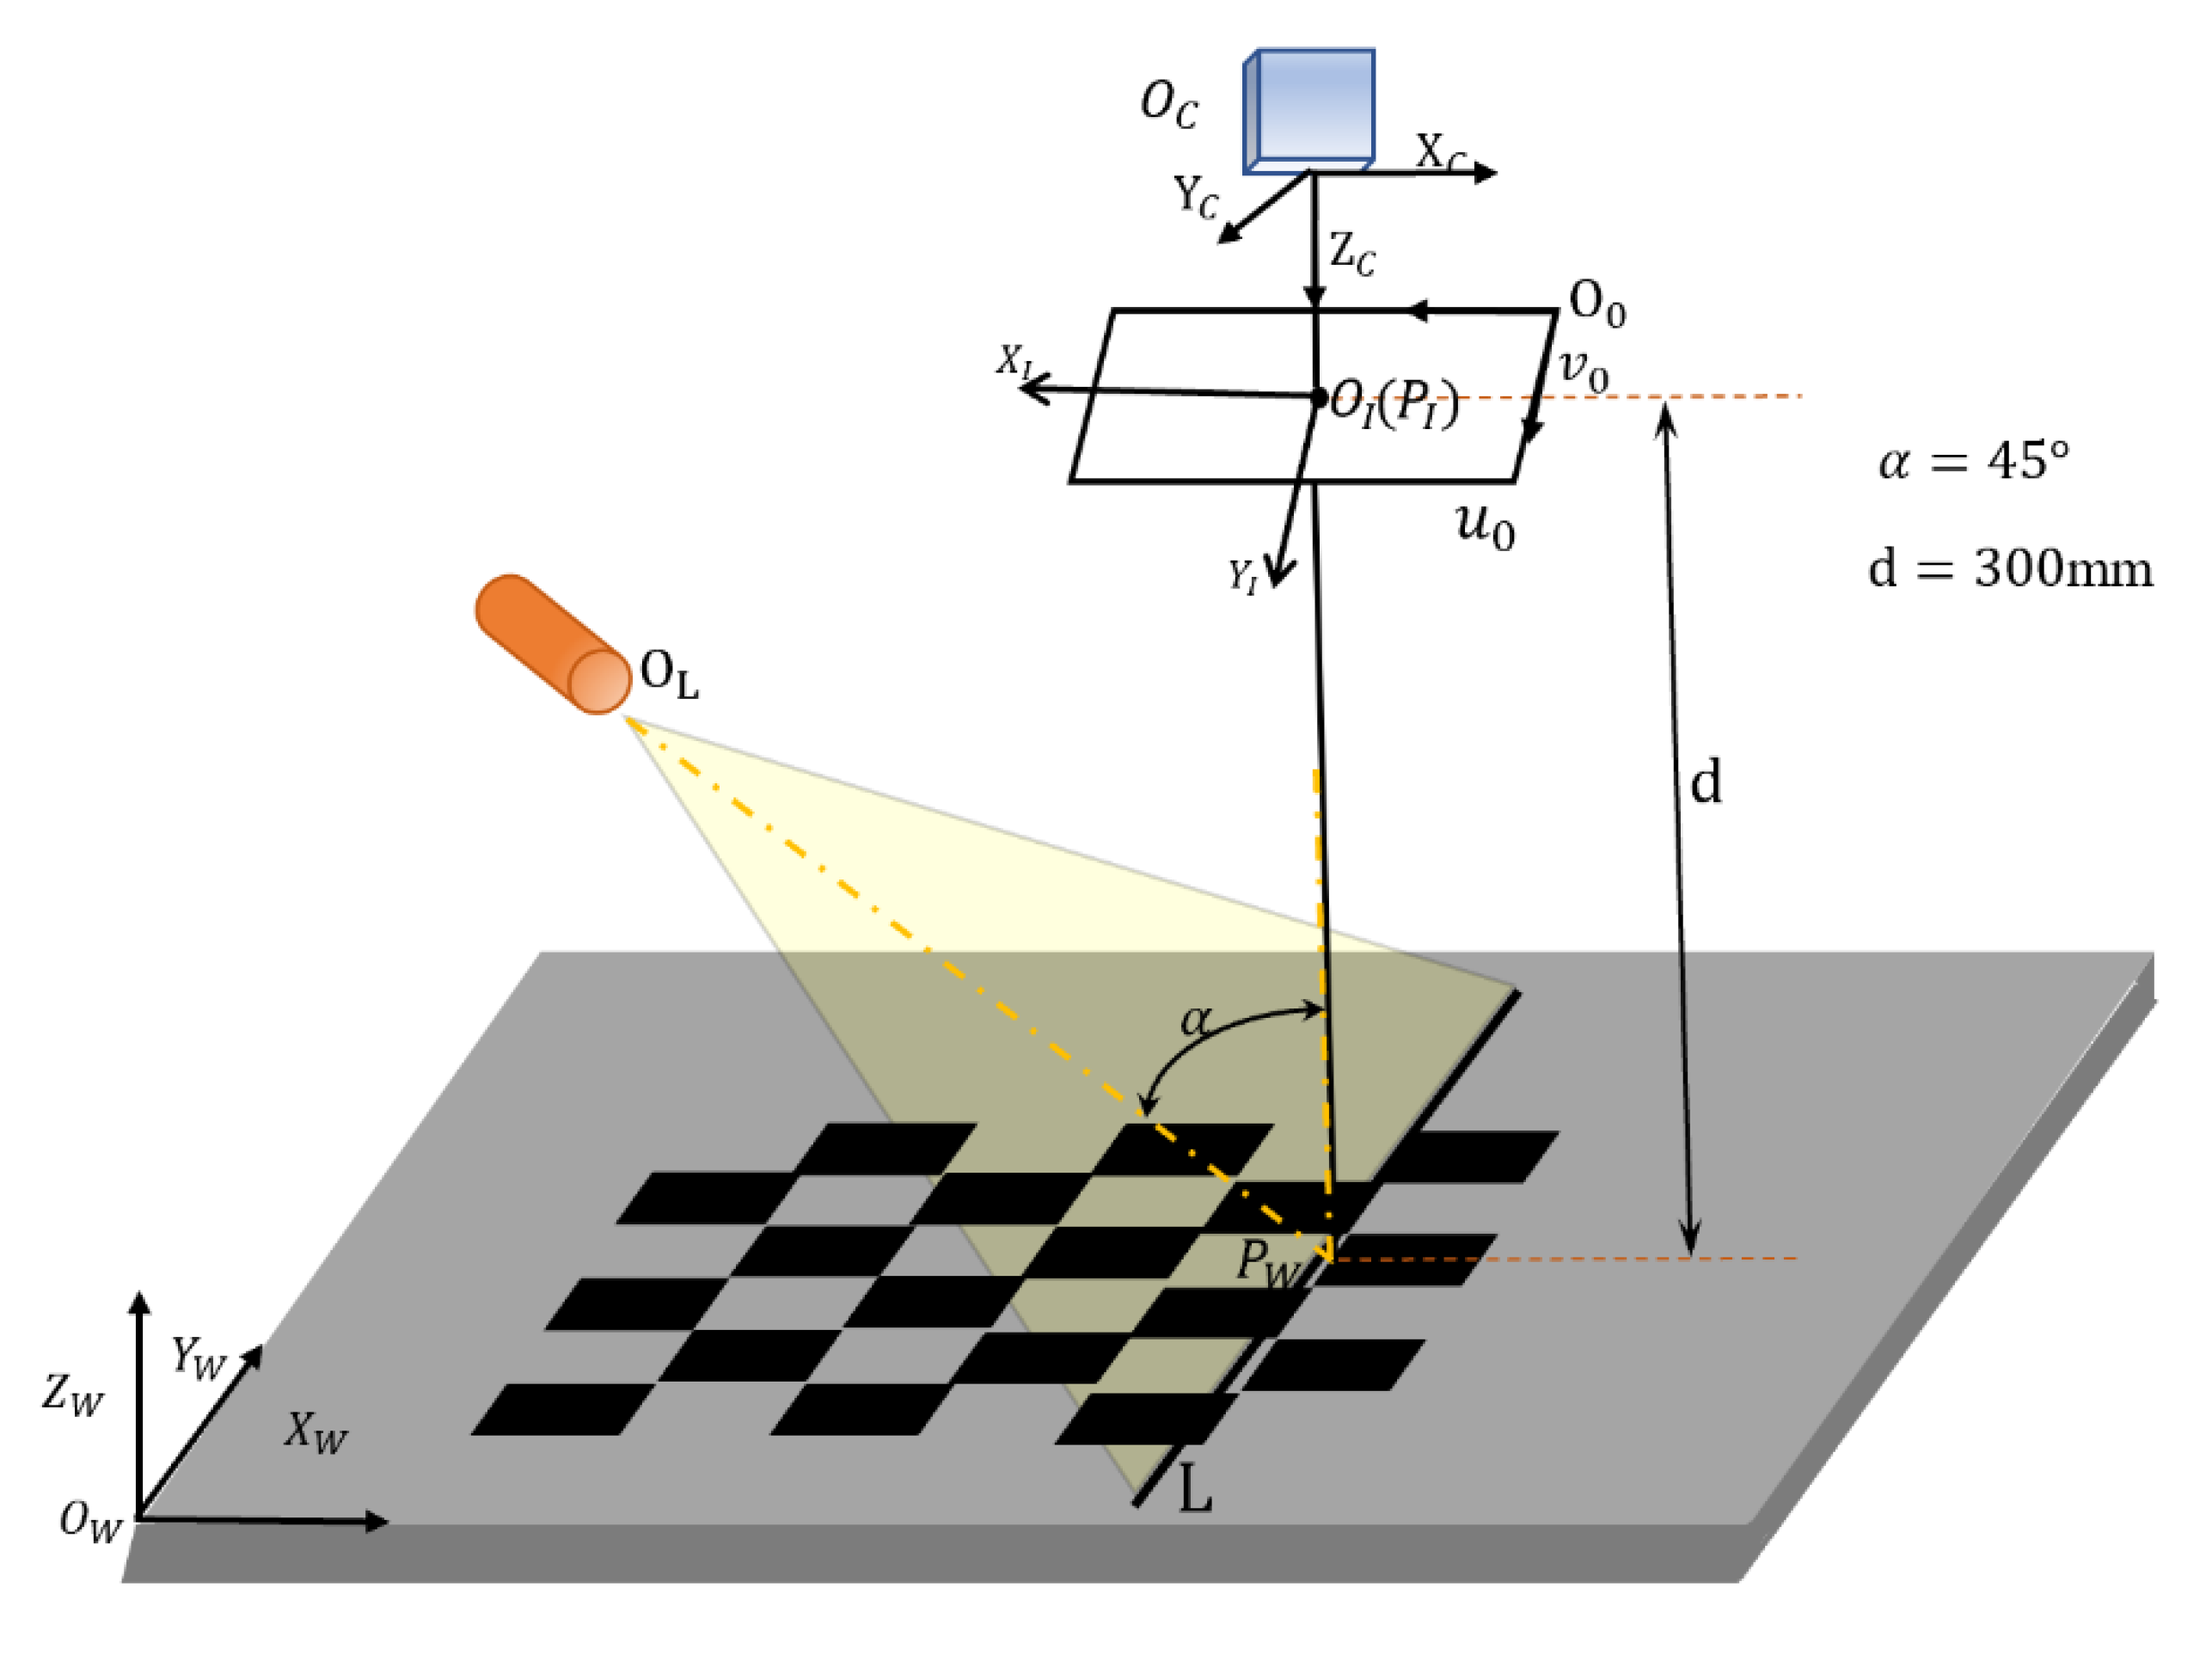
Figure 1. Measurement principle diagram of line structured light system.
Processes 09 00917 g001
Figure 2. Calibration flow chart of line structured light system.
Processes 09 00917 g002
Figure 3. Flow chart of light intensity equalization of light stripe.
Processes 09 00917 g003
Figure 4. Schematic diagram of adaptive window.
Processes 09 00917 g004
Figure 5. Camera calibration diagram.
Processes 09 00917 g005
Figure 6. Light intensity averaging results of light stripe image. (b) Original image. (b) Light intensity averaging image. (c) Gray histogram of original image. (d) Gray histogram of light intensity averaging image.
Processes 09 00917 g006
Figure 7. Results image of light stripe center extraction. (a) Proposed method. (b) Skeleton method. (c) Gray centroid method. (d) Standard method.
Processes 09 00917 g007
Figure 8. Measurement experiment diagram.
Processes 09 00917 g008
Figure 9. Extraction results of light stripe center of standard gauge blocks with different specifications: (a). Extraction results of light stripe center of 20 mm standard gauge block; (b). Extraction results of light stripe center of 20 mm standard gauge block; (c). Extraction results of light stripe center of 20 mm standard gauge block.
Processes 09 00917 g009
Figure 10. Comparison of local waggle areas. (a) The proposed method. (b) The standard method.
Processes 09 00917 g010
Figure 11. Comparison of local waggle points. (a) The proposed method. (b) The standard method.
Processes 09 00917 g011
Table 1. Comparison between different methods and the standard method for extracting light stripe center (unit: pixel).
Proposed MethodSkeleton MethodGray Centroid Method
Group 1max0.0240.0540.076
min0.0150.0250.044
Group 2max0.0310.1050.098
min0.0140.0360.053
Group 3max0.0290.0750.104
min0.0200.0360.073
Group 4max0.0450.0840.083
min0.0150.0340.054
Group 5max0.0190.1180.098
min0.0160.0580.067
Table 2. The average deviation of different methods comparing the standard value (unit: pixel).
Standard Gauge Blocks (mm) Proposed MethodSkeleton MethodGray Centroid Method
20max0.0140.0940.085
min0.0080.0170.047
30max0.0210.0890.083
min0.0080.0420.057
50max0.0160.1050.092
min0.0090.0560.054
Table 3. The absolute deviation of different methods comparing the standard value (unit: pixel).
Standard Gauge Blocks (mm) Proposed MethodSkeleton MethodGray Centroid Method
20max0.0130.1020.130
min0.0090.0640.052
30max0.0230.0920.104
min0.0150.0430.042
50max0.0180.1130.110
min0.0120.0620.040
Publisher’s Note: MDPI stays neutral with regard to jurisdictional claims in published maps and institutional affiliations.