
A Computational Approach for Pathway-Based Systemic Drug Influence

Abstract
1. Introduction
2. Materials and Methods
2.1. Materials
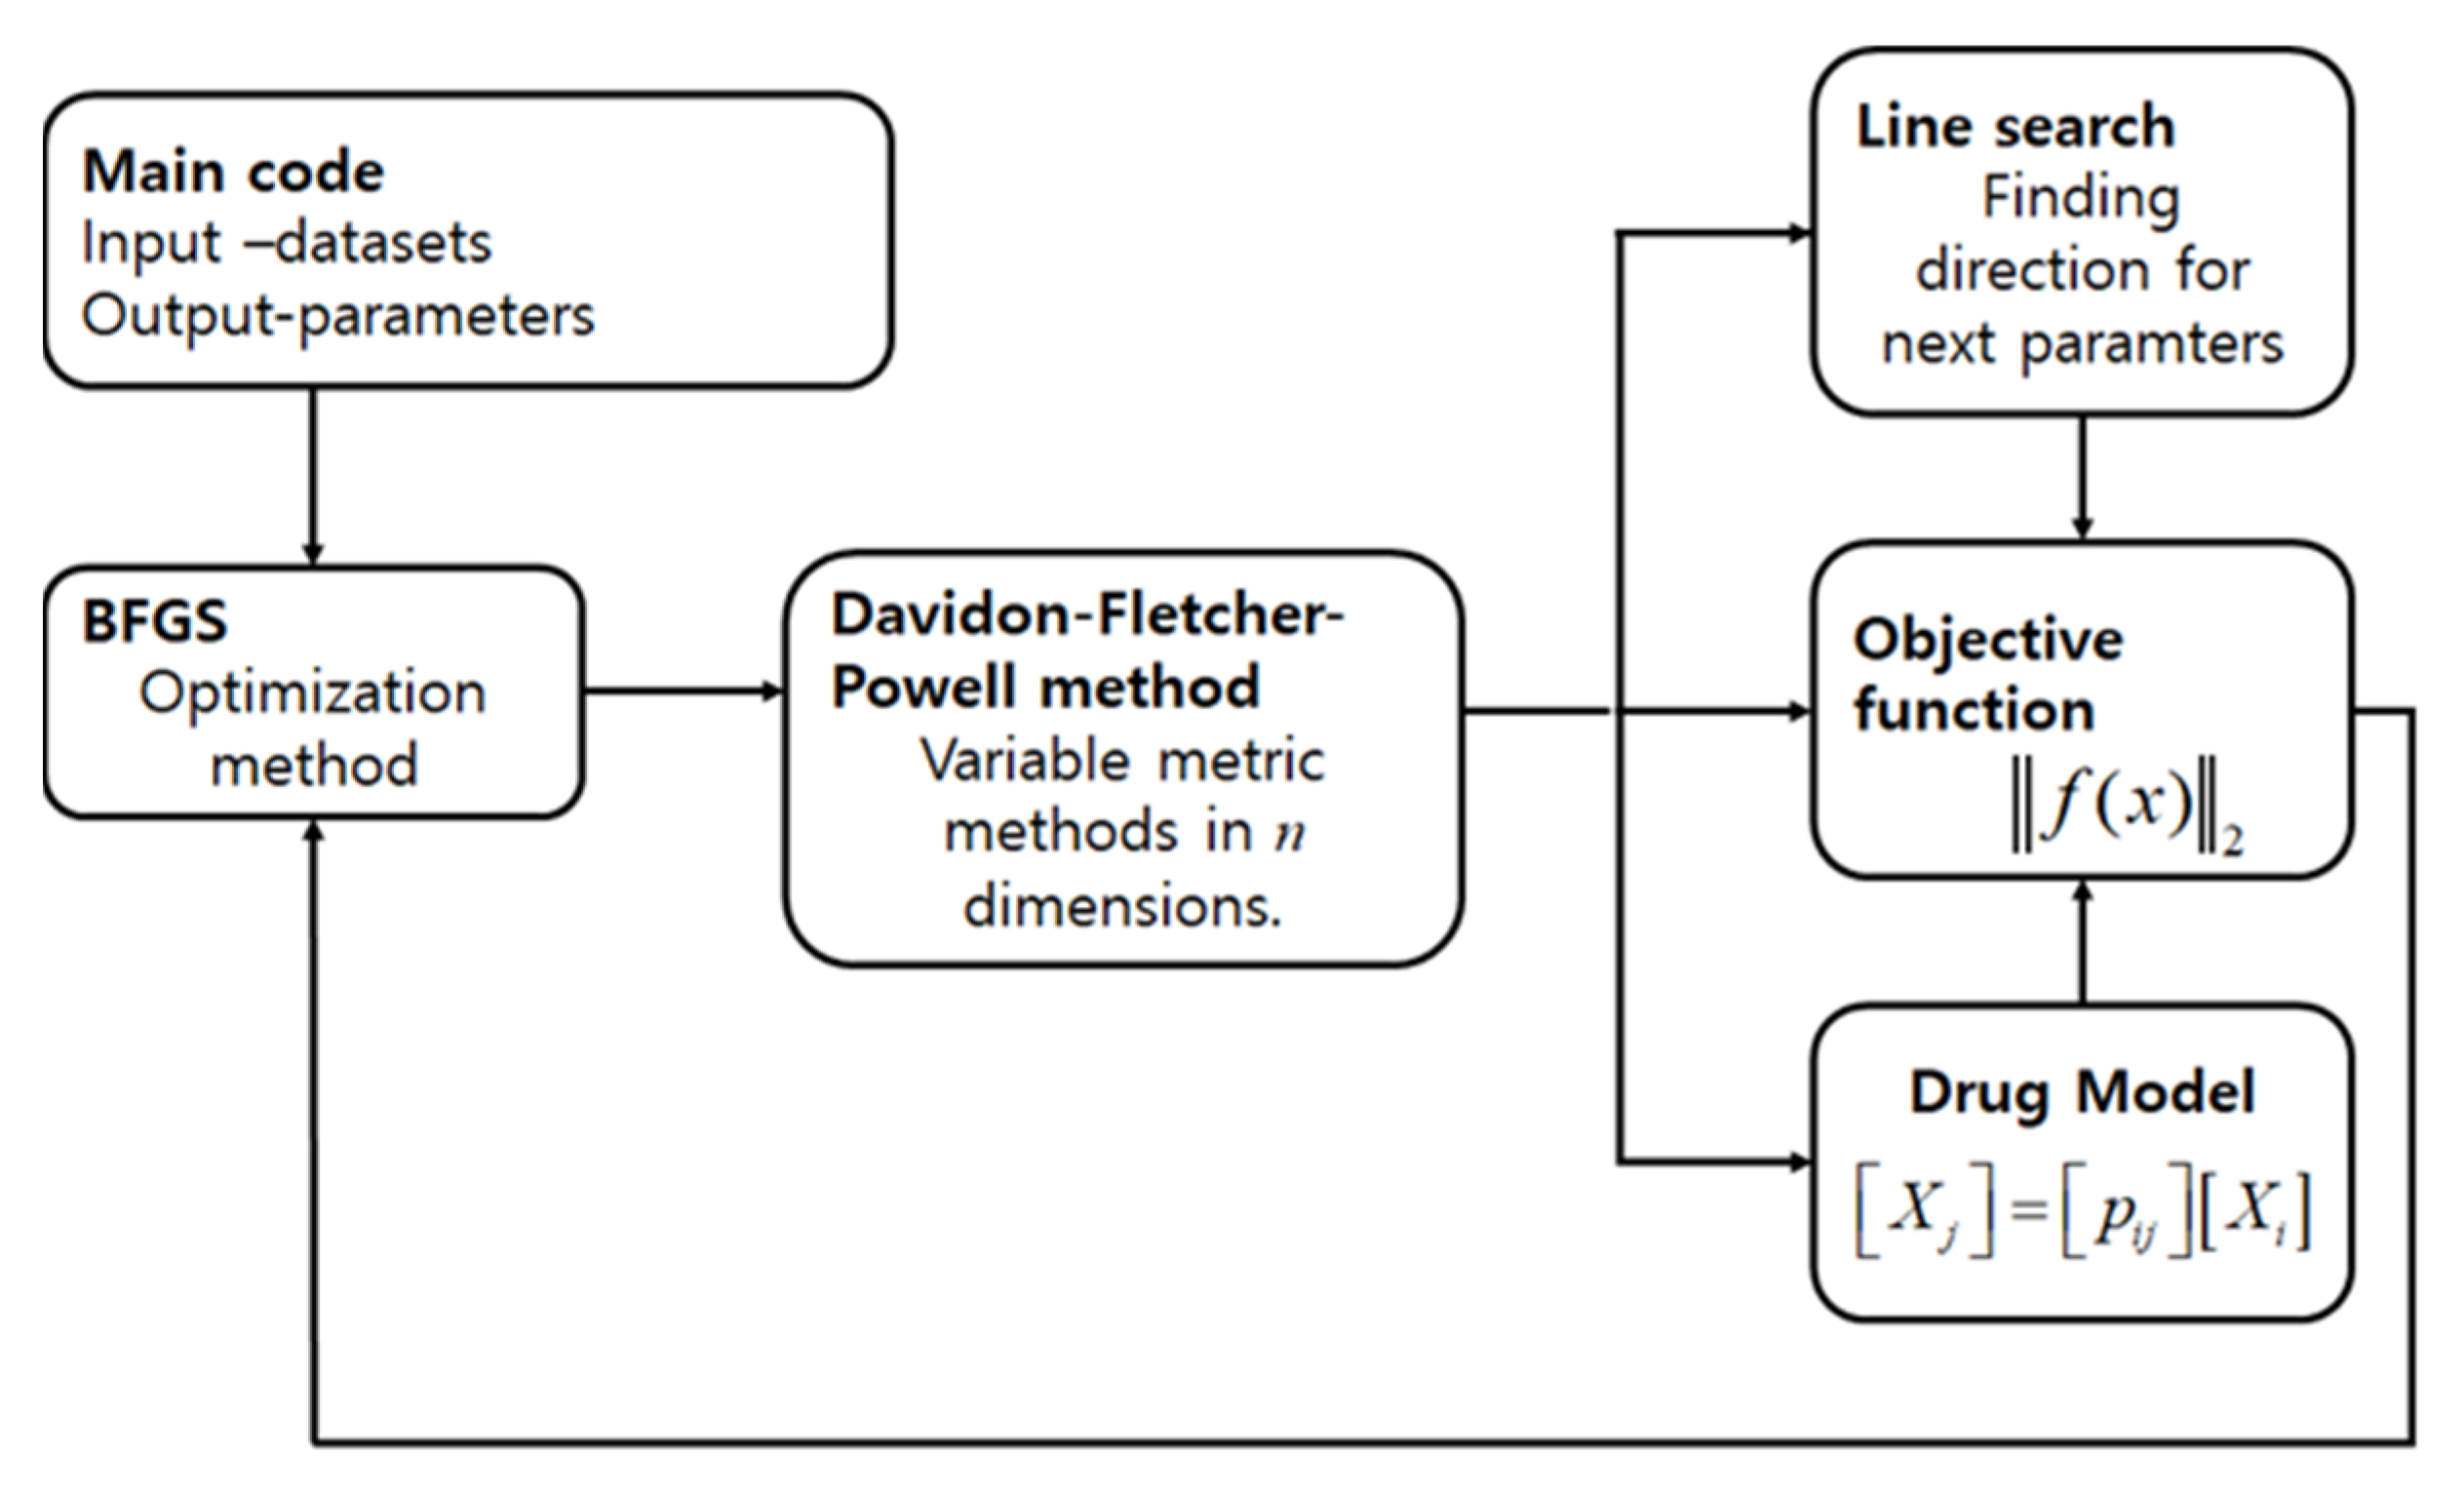
2.2. Methods
3. Results
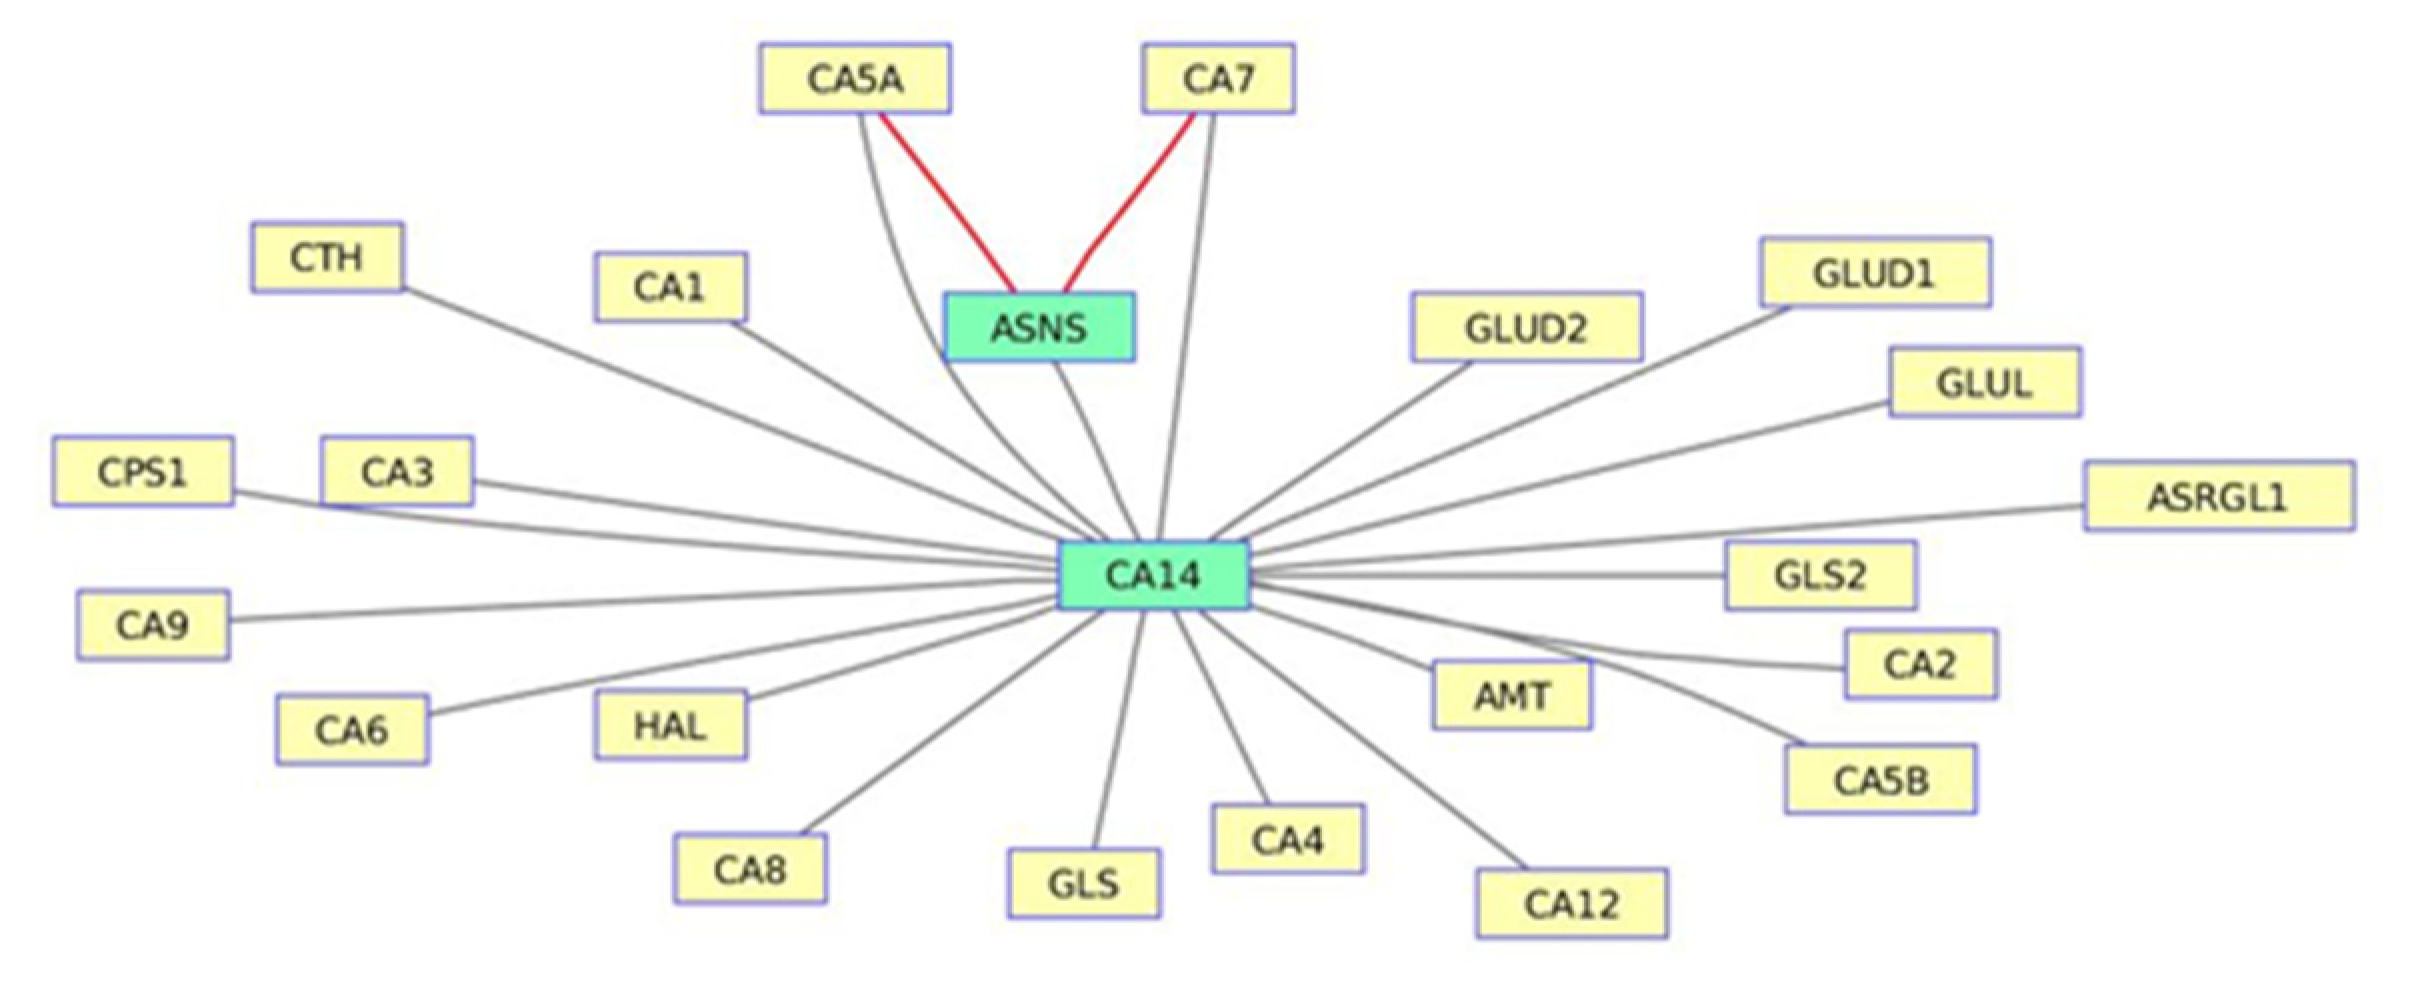
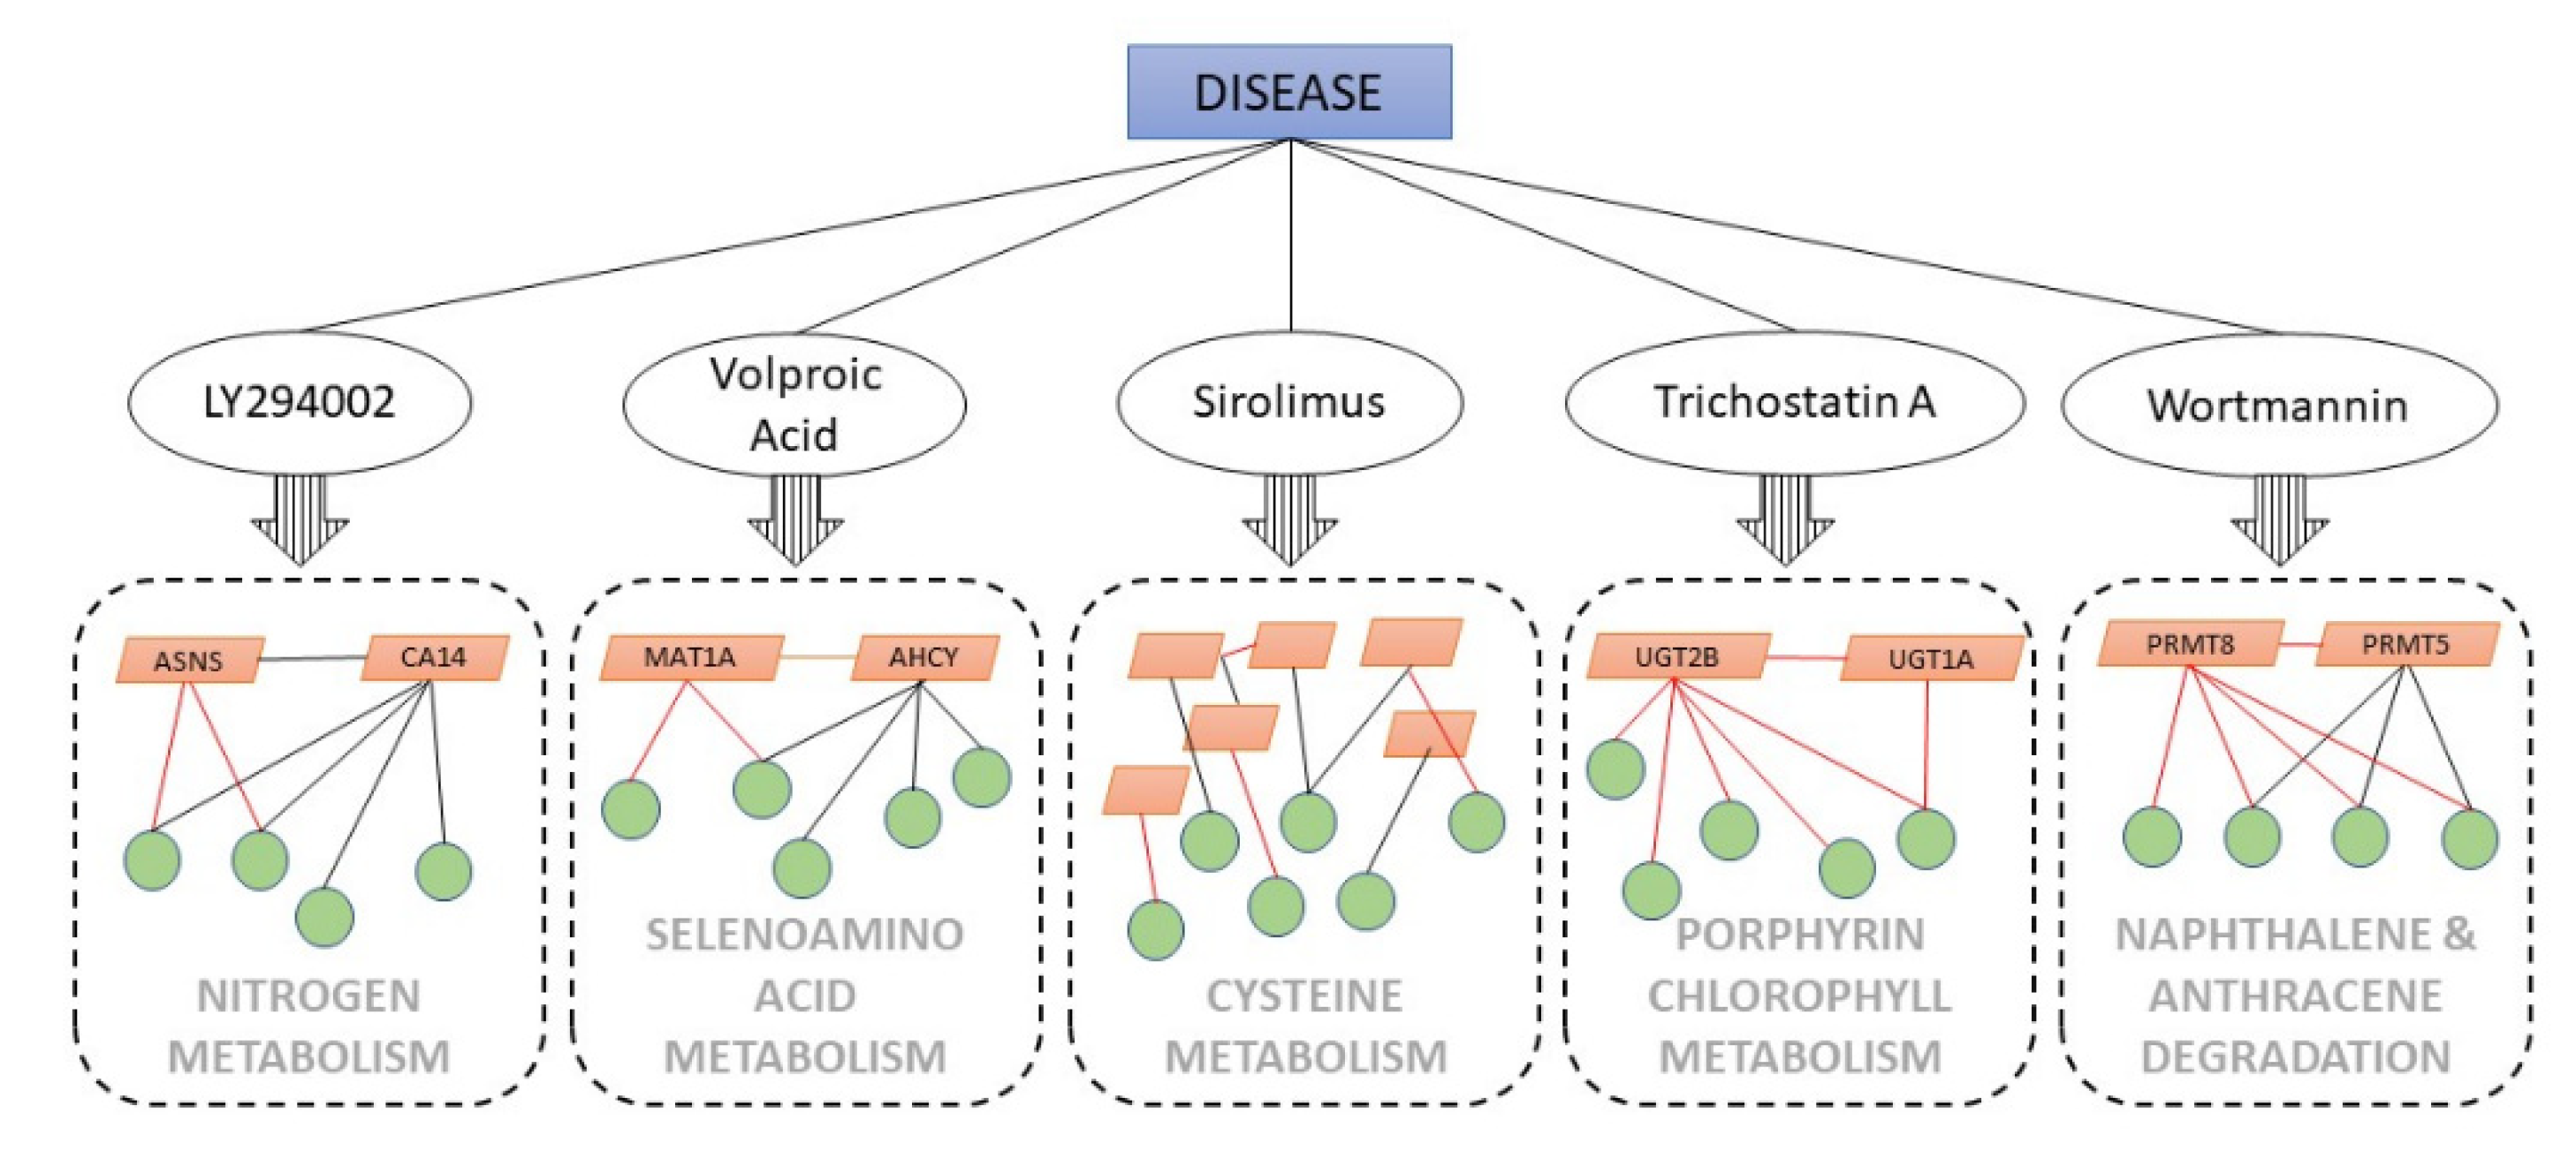
3.1. The Nitrogen Metabolism Pathway from LY294002-Induced Datasets
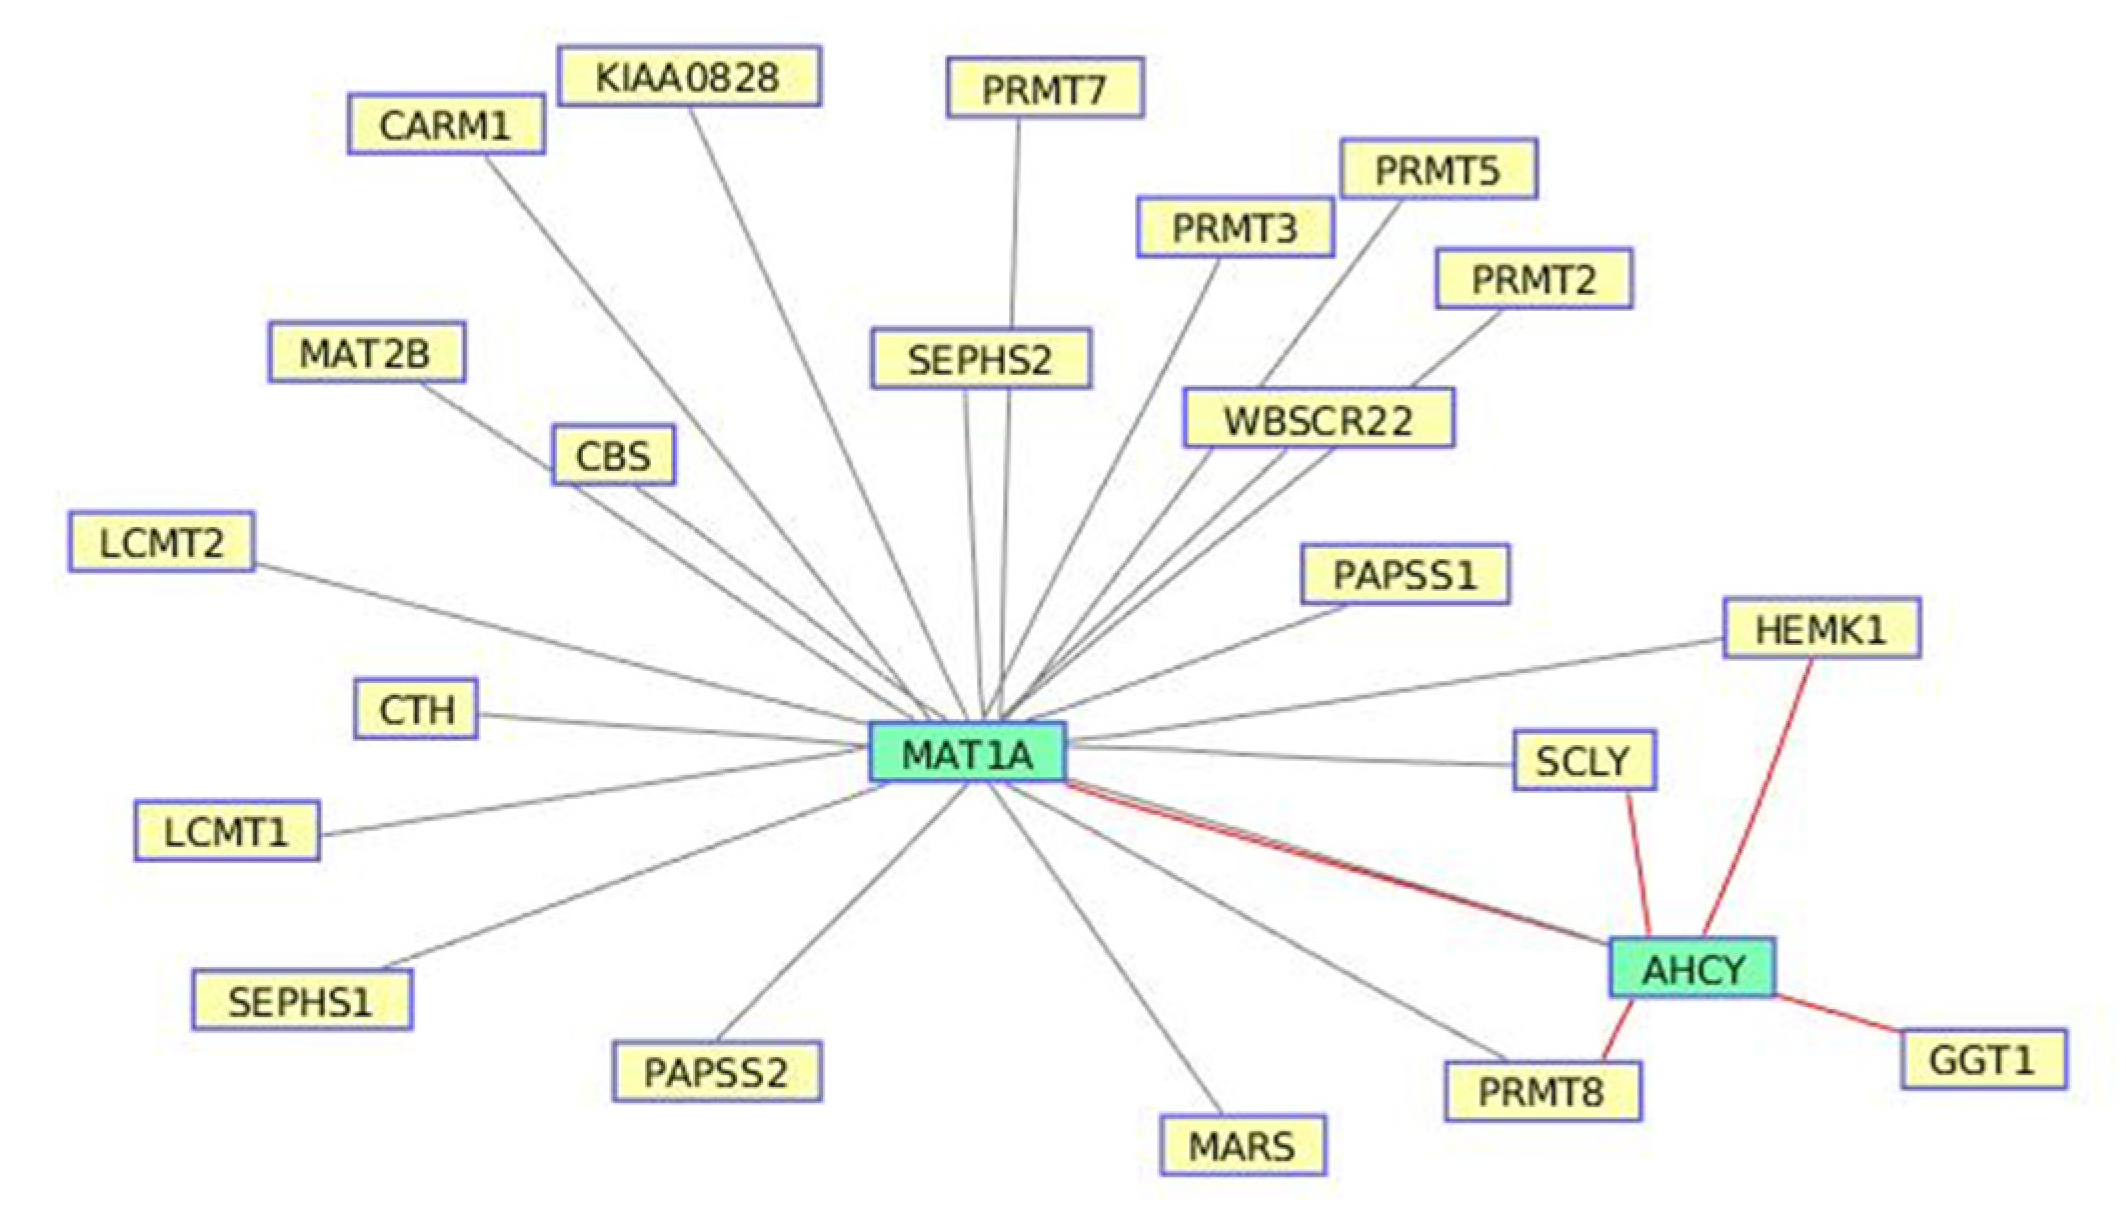
3.2. Selenoamino Acid Metabolism from Valproic Acid-Induced Datasets
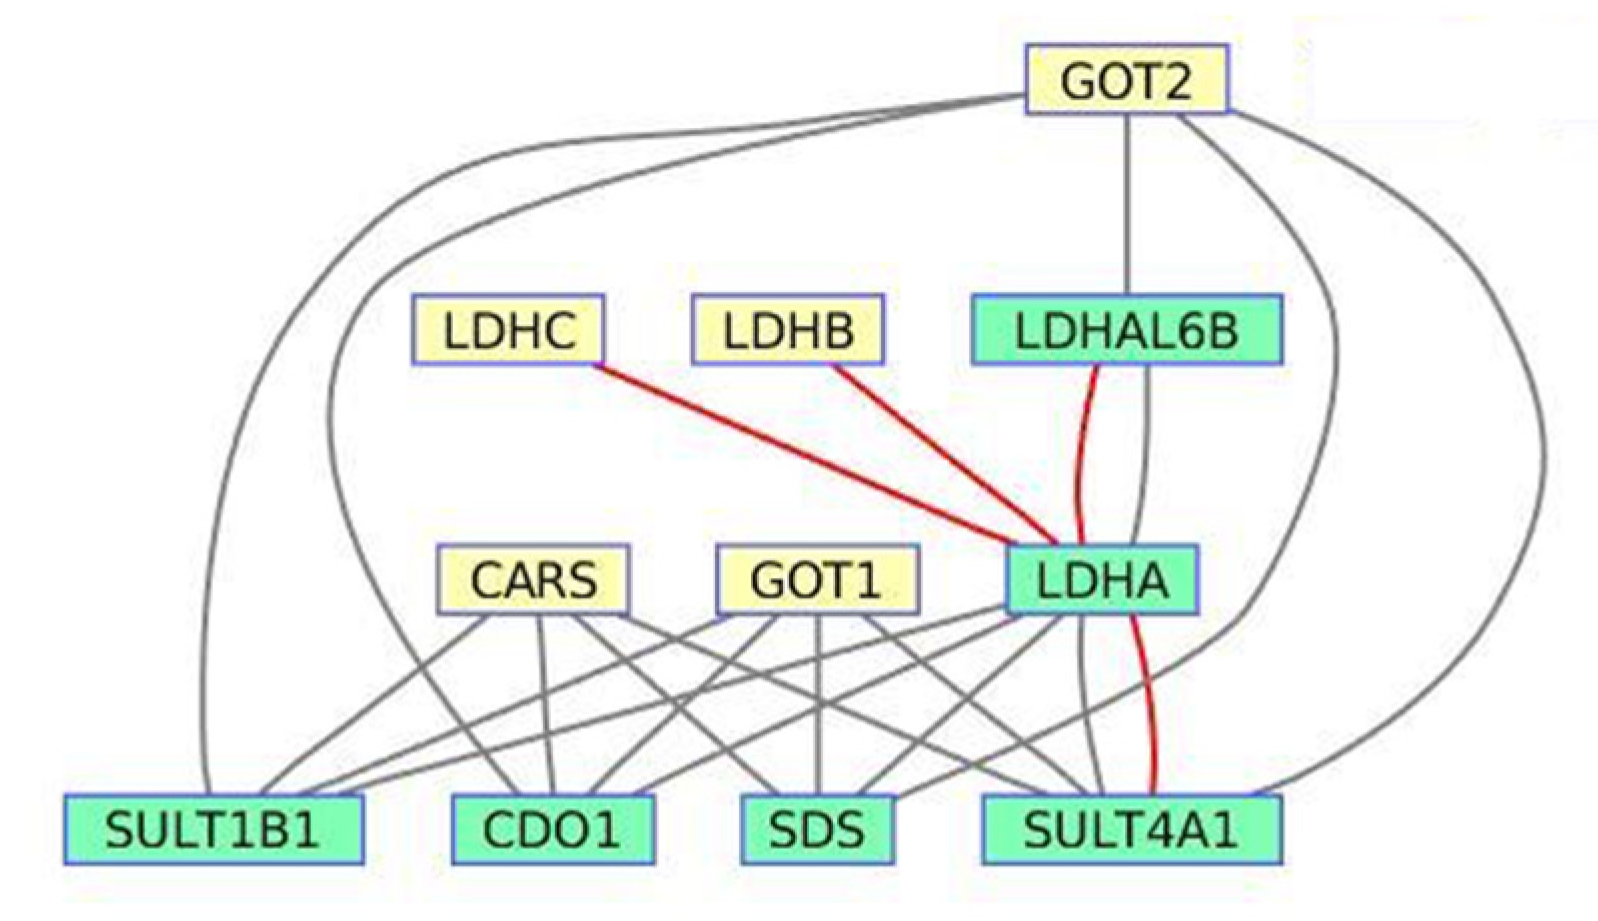
3.3. Cysteine Metabolism Pathway from Sirolimus-Induced Datasets
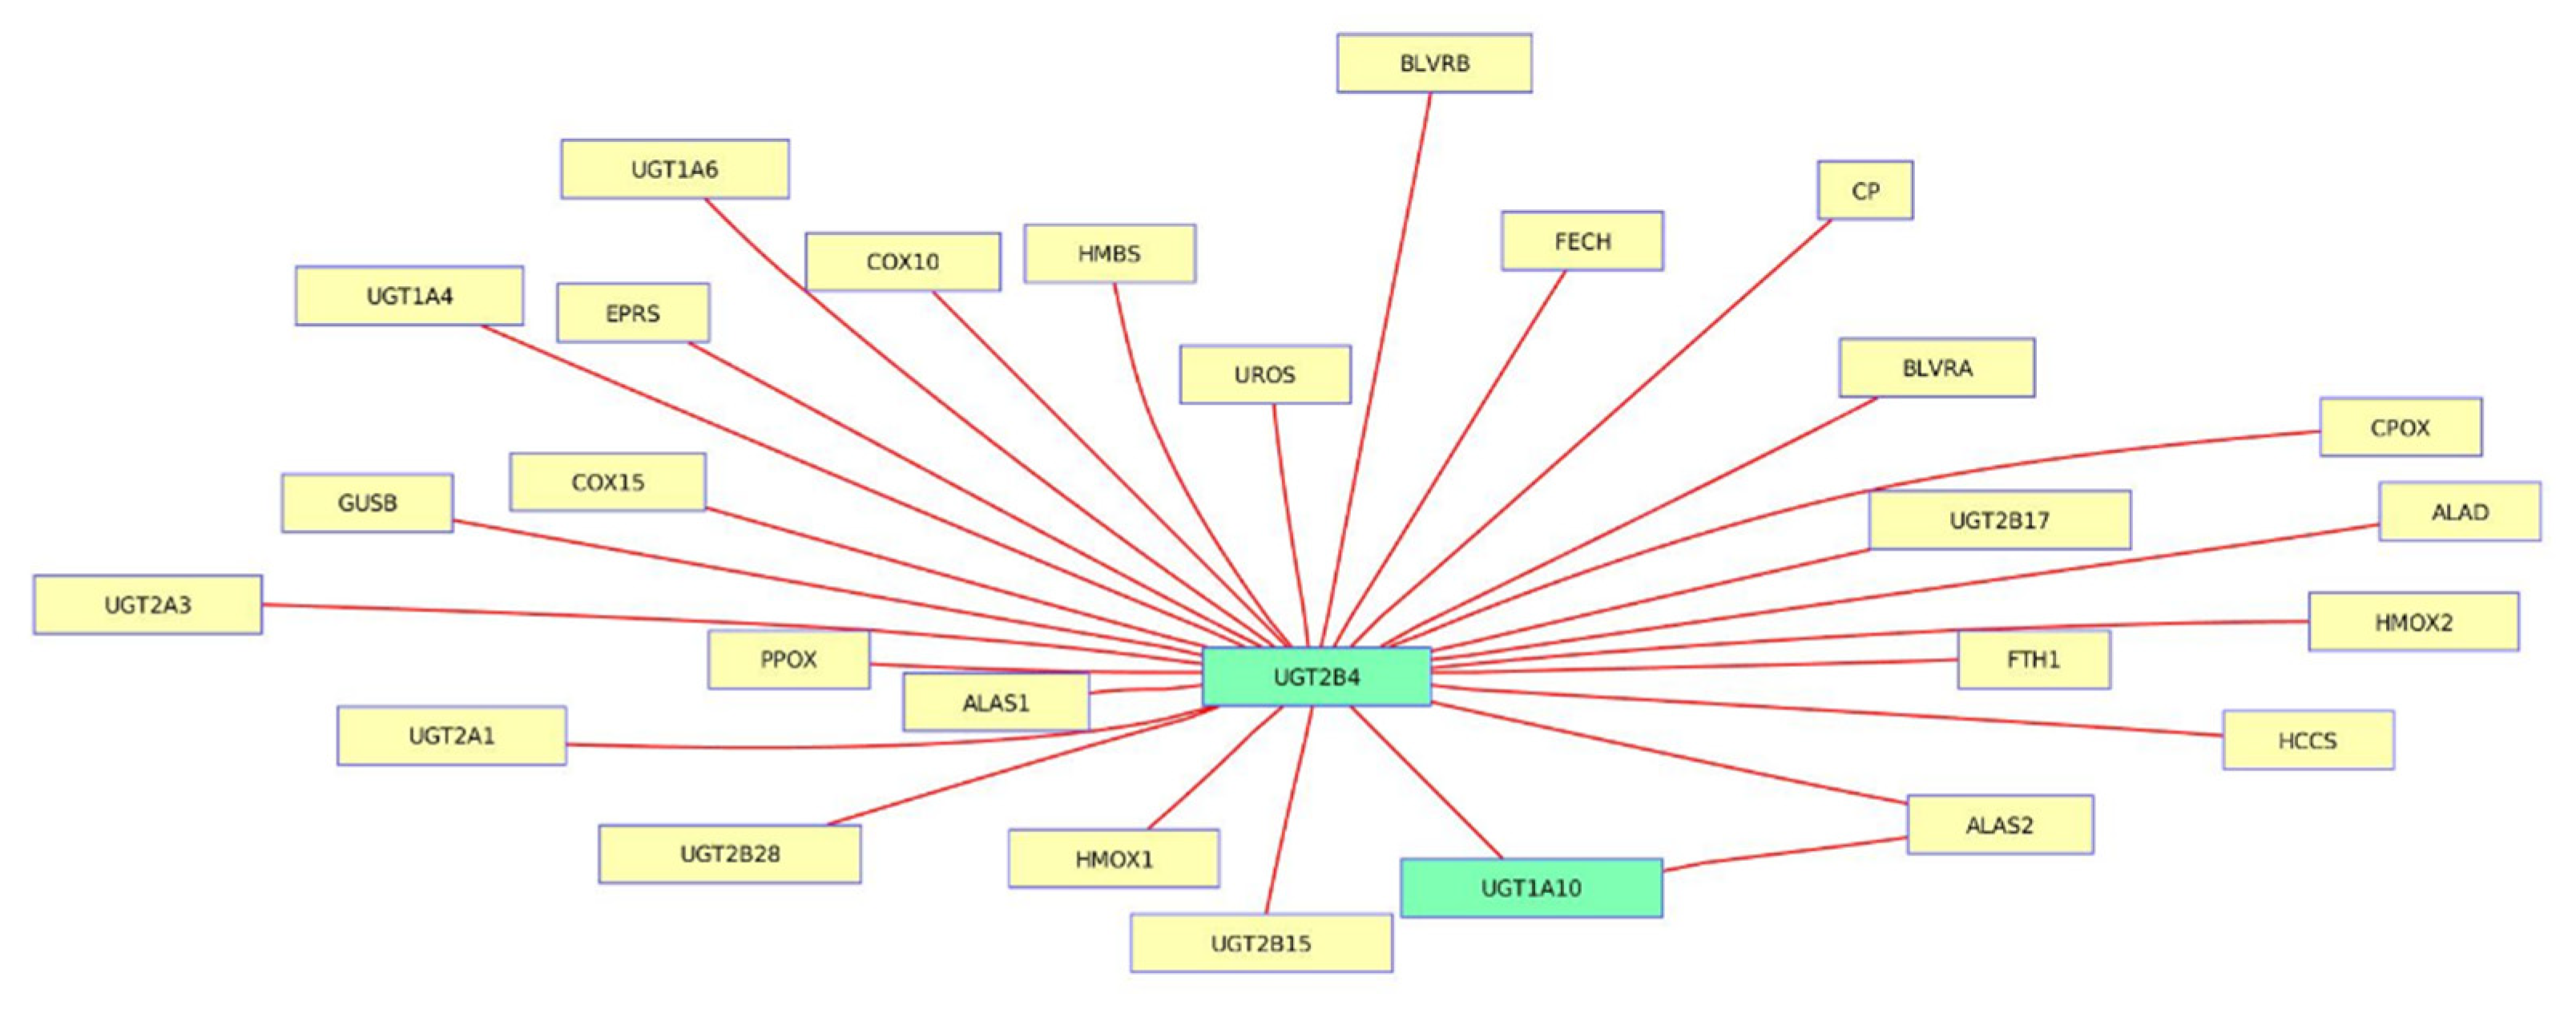
3.4. Porphyrin Chlorophyll Metabolism from Trichostatin A-Induced Datasets
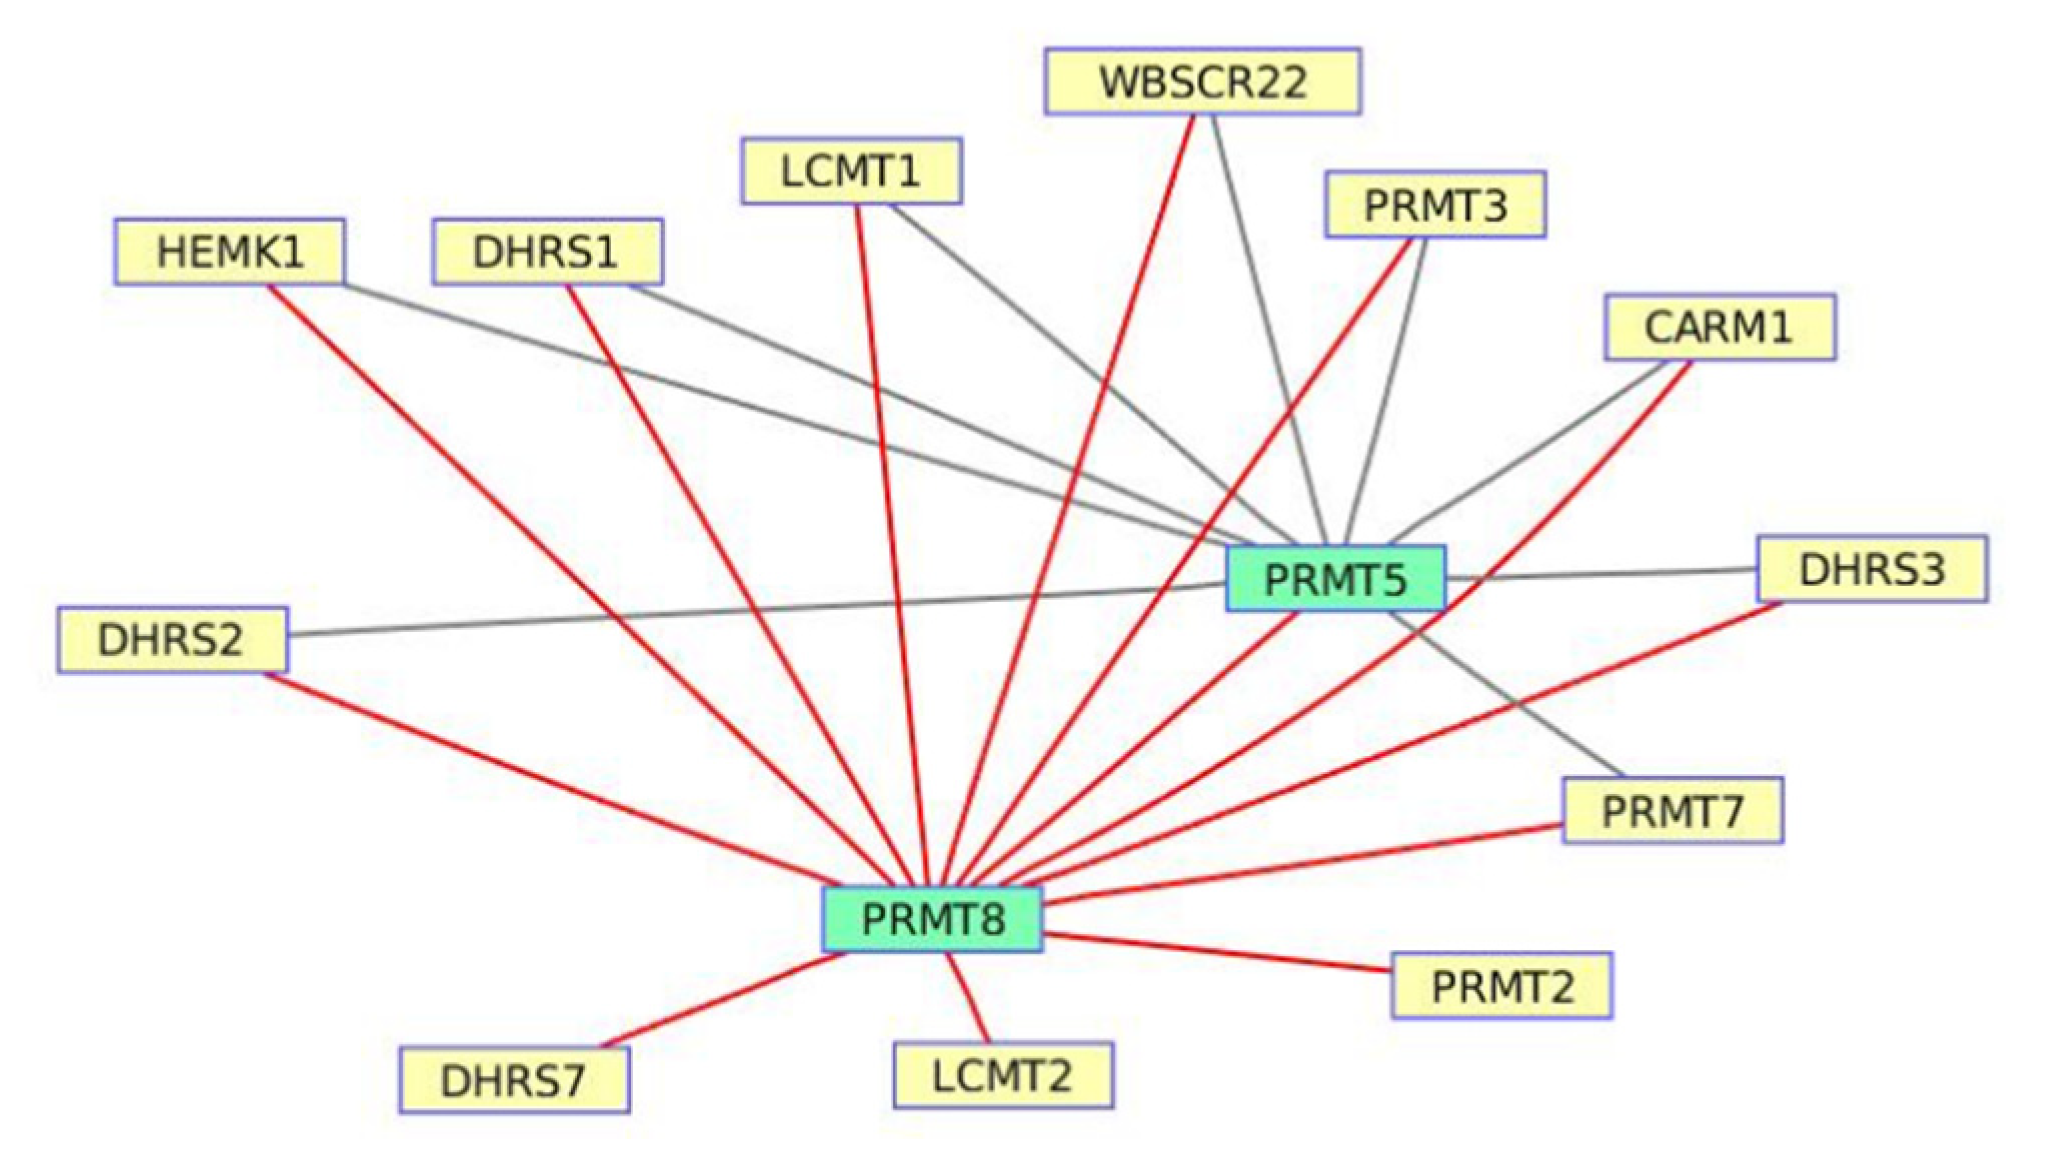
3.5. Naphthalene and the Anthracene Degradation Pathway from Wortmannin-Induced Datasets
4. Discussion
5. Conclusions
Funding
Institutional Review Board Statement
Informed Consent Statement
Data Availability Statement
Conflicts of Interest
References
- Pushpakom, S.; Iorio, F.; Eyers, P.A.; Escott, K.J.; Hopper, S.; Wells, A.; Doig, A.; Guilliams, T.; Latimer, J.; McNamee, C.; et al. Drug repurposing: Progress, challenges and recommendations. Nat. Rev. Drug Discov. 2019, 18, 41–58. [Google Scholar] [CrossRef]
- Badkas, A.; De Landtsheer, S.; Sauter, T. Topological network measures for drug repositioning. Brief. Bioinform. 2020. [Google Scholar] [CrossRef]
- Lotfi Shahreza, M.; Ghadiri, N.; Mousavi, S.R.; Varshosaz, J.; Green, J.R. A review of network-based approaches to drug repositioning. Brief. Bioinform. 2018, 19, 878–892. [Google Scholar] [CrossRef]
- Adasme, M.F.; Bolz, S.N.; Adelmann, L.; Salentin, S.; Haupt, V.J.; Moreno-Rodriguez, A.; Nogueda-Torres, B.; Castillo-Campos, V.; Yepez-Mulia, L.; De Fuentes-Vicente, J.A.; et al. Repositioned drugs for chagas disease unveiled via structure-based drug repositioning. Int. J. Mol. Sci. 2020, 21, 8809. [Google Scholar] [CrossRef] [PubMed]
- Cheng, A.C.; Coleman, R.G.; Smyth, K.T.; Cao, Q.; Soulard, P.; Caffrey, D.R.; Salzberg, A.C.; Huang, E.S. Structure-based maximal affinity model predicts small-molecule druggability. Nat. Biotechnol. 2007, 25, 71–75. [Google Scholar] [CrossRef] [PubMed]
- Luo, H.; Li, M.; Wang, S.; Liu, Q.; Li, Y.; Wang, J. Computational drug repositioning using low-rank matrix approximation and randomized algorithms. Bioinformatics 2018, 34, 1904–1912. [Google Scholar] [CrossRef]
- Luo, H.; Li, M.; Yang, M.; Wu, F.X.; Li, Y.; Wang, J. Biomedical data and computational models for drug repositioning: A comprehensive review. Brief. Bioinform. 2020, 22, 1604–1619. [Google Scholar] [CrossRef]
- Ashburn, T.T.; Thor, K.B. Drug repositioning: Identifying and developing new uses for existing drugs. Nat. Rev. Drug Discov. 2004, 3, 673–683. [Google Scholar] [CrossRef] [PubMed]
- Wang, W.; Yang, S.; Zhang, X.; Li, J. Drug repositioning by integrating target information through a heterogeneous network model. Bioinformatics 2014, 30, 2923–2930. [Google Scholar] [CrossRef] [PubMed]
- Keiser, M.J.; Roth, B.L.; Armbruster, B.N.; Ernsberger, P.; Irwin, J.J.; Shoichet, B.K. Relating protein pharmacology by ligand chemistry. Nat. Biotechnol. 2007, 25, 197–206. [Google Scholar] [CrossRef] [PubMed]
- Pastor-Satorras, R.; Vespignani, A. Epidemic spreading in scale-free networks. Phys. Rev. Lett. 2001, 86, 3200–3203. [Google Scholar] [CrossRef]
- Albert, R.; Jeong, H.; Barabasi, A.L. Error and attack tolerance of complex networks. Nature 2000, 406, 378–382. [Google Scholar] [CrossRef]
- Yin, N.; Ma, W.; Pei, J.; Ouyang, Q.; Tang, C.; Lai, L. Synergistic and antagonistic drug combinations depend on network topology. PLoS ONE 2014, 9, e93960. [Google Scholar] [CrossRef]
- Wang, P.; Lu, J.; Yu, X. Identification of important nodes in directed biological networks: A network motif approach. PLoS ONE 2014, 9, e106132. [Google Scholar] [CrossRef]
- Wang, P. Statistical identification of important nodes in biological systems. J. Syst. Sci. Complex 2021, 1–17. [Google Scholar] [CrossRef]
- Kim, S.; Kim, J.; Cho, K.H. Inferring gene regulatory networks from temporal expression profiles under time-delay and noise. Comput. Biol. Chem. 2007, 31, 239–245. [Google Scholar] [CrossRef]
- Park, S.M.; Hwang, C.Y.; Choi, J.; Joung, C.Y.; Cho, K.H. Feedback analysis identifies a combination target for overcoming adaptive resistance to targeted cancer therapy. Oncogene 2020, 39, 3803–3820. [Google Scholar] [CrossRef]
- Lamb, J.; Crawford, E.D.; Peck, D.; Modell, J.W.; Blat, I.C.; Wrobel, M.J.; Lerner, J.; Brunet, J.P.; Subramanian, A.; Ross, K.N.; et al. The connectivity map: Using gene-expression signatures to connect small molecules, genes, and disease. Science 2006, 313, 1929–1935. [Google Scholar] [CrossRef] [PubMed]
- Subramanian, A.; Tamayo, P.; Mootha, V.K.; Mukherjee, S.; Ebert, B.L.; Gillette, M.A.; Paulovich, A.; Pomeroy, S.L.; Golub, T.R.; Lander, E.S.; et al. Gene set enrichment analysis: A knowledge-based approach for interpreting genome-wide expression profiles. Proc. Natl. Acad. Sci. USA 2005, 102, 15545–15550. [Google Scholar] [CrossRef] [PubMed]
- Van’t Veer, L.J.; Dai, H.; van de Vijver, M.J.; He, Y.D.; Hart, A.A.; Mao, M.; Peterse, H.L.; van der Kooy, K.; Marton, M.J.; Witteveen, A.T.; et al. Gene expression profiling predicts clinical outcome of breast cancer. Nature 2002, 415, 530–536. [Google Scholar] [CrossRef] [PubMed]
- Zeng, H.; Qiu, C.; Cui, Q. Drug-path: A database for drug-induced pathways. Database 2015, 2015, bav061. [Google Scholar] [CrossRef] [PubMed]
- Kanehisa, M.; Goto, S. KEGG: Kyoto encyclopedia of genes and genomes. Nucleic Acids Res. 2000, 28, 27–30. [Google Scholar] [CrossRef] [PubMed]
- Subramanian, A.; Kuehn, H.; Gould, J.; Tamayo, P.; Mesirov, J.P. GSEA-P: A desktop application for Gene Set Enrichment Analysis. Bioinformatics 2007, 23, 3251–3253. [Google Scholar] [CrossRef] [PubMed]
- Press, W.H. Numerical Recipes in C: The Art of Scientific Computing, 2nd ed.; Cambridge University Press: Cambridge, UK, 1992. [Google Scholar]
- Kim, S.; Kreider, K. Parameter identification for nonlinear elastic and viscoelastic plates. Appl. Numer. Math. 2006, 56, 1538–1554. [Google Scholar] [CrossRef]
- Kim, S. Identifying dynamic pathway interactions based on clinical information. Comput. Biol. Chem. 2017, 68, 260–265. [Google Scholar] [CrossRef]
- Ideker, T.; Dutkowski, J.; Hood, L. Boosting signal-to-noise in complex biology: Prior knowledge is power. Cell 2011, 144, 860–863. [Google Scholar] [CrossRef]
- Aquino, G.; Rocco, A. Bimodality in gene expression without feedback: From Gaussian white noise to log-normal coloured noise. Math. Biosci. Eng. 2020, 17, 6993–7017. [Google Scholar] [CrossRef]
- MATLAB. Version (R2020a); The MathWorks Inc.: Portola Valley, CA, USA, 2020. [Google Scholar]
- Walker, E.H.; Pacold, M.E.; Perisic, O.; Stephens, L.; Hawkins, P.T.; Wymann, M.P.; Williams, R.L. Structural determinants of phosphoinositide 3-kinase inhibition by wortmannin, LY294002, quercetin, myricetin, and staurosporine. Mol. Cell 2000, 6, 909–919. [Google Scholar] [CrossRef]
- Gharbi, S.I.; Zvelebil, M.J.; Shuttleworth, S.J.; Hancox, T.; Saghir, N.; Timms, J.F.; Waterfield, M.D. Exploring the specificity of the PI3K family inhibitor LY294002. Biochem. J. 2007, 404, 15–21. [Google Scholar] [CrossRef]
- Kurmi, K.; Haigis, M.C. Nitrogen metabolism in cancer and immunity. Trends Cell Biol. 2020, 30, 408–424. [Google Scholar] [CrossRef]
- Knott, S.R.V.; Wagenblast, E.; Khan, S.; Kim, S.Y.; Soto, M.; Wagner, M.; Turgeon, M.O.; Fish, L.; Erard, N.; Gable, A.L.; et al. Asparagine bioavailability governs metastasis in a model of breast cancer. Nature 2018, 554, 378–381. [Google Scholar] [CrossRef]
- Chou, Y.C.; Lee, M.S.; Wu, M.H.; Shih, H.L.; Yang, T.; Yu, C.P.; Yu, J.C.; Sun, C.A. Plasma homocysteine as a metabolic risk factor for breast cancer: Findings from a case-control study in Taiwan. Breast Cancer Res. Treat. 2007, 101, 199–205. [Google Scholar] [CrossRef]
- Lin, J.; Lee, I.M.; Song, Y.; Cook, N.R.; Selhub, J.; Manson, J.E.; Buring, J.E.; Zhang, S.M. Plasma homocysteine and cysteine and risk of breast cancer in women. Cancer Res. 2010, 70, 2397–2405. [Google Scholar] [CrossRef]
- Zhang, S.M.; Willett, W.C.; Selhub, J.; Hunter, D.J.; Giovannucci, E.L.; Holmes, M.D.; Colditz, G.A.; Hankinson, S.E. Plasma folate, vitamin B6, vitamin B12, homocysteine, and risk of breast cancer. J. Natl. Cancer Inst. 2003, 95, 373–380. [Google Scholar] [CrossRef]
- Zhang, S.M.; Willett, W.C.; Selhub, J.; Manson, J.E.; Colditz, G.A.; Hankinson, S.E. A prospective study of plasma total cysteine and risk of breast cancer. Cancer Epidemiol. Biomark. Prev. 2003, 12, 1188–1193. [Google Scholar]
- Paul, B.D.; Sbodio, J.I.; Snyder, S.H. Cysteine Metabolism in Neuronal Redox Homeostasis. Trends Pharmacol. Sci. 2018, 39, 513–524. [Google Scholar] [CrossRef] [PubMed]
- Imai, Y.; Maru, Y.; Tanaka, J. Action mechanisms of histone deacetylase inhibitors in the treatment of hematological malignancies. Cancer Sci. 2016, 107, 1543–1549. [Google Scholar] [CrossRef]
- Vigushin, D.M.; Ali, S.; Pace, P.E.; Mirsaidi, N.; Ito, K.; Adcock, I.; Coombes, R.C. Trichostatin A is a histone deacetylase inhibitor with potent antitumor activity against breast cancer in vivo. Clin. Cancer Res. 2001, 7, 971–976. [Google Scholar]
- Hernandez, S.J.; Dolivo, D.M.; Dominko, T. PRMT8 demonstrates variant-specific expression in cancer cells and correlates with patient survival in breast, ovarian and gastric cancer. Oncol. Lett. 2017, 13, 1983–1989. [Google Scholar] [CrossRef] [PubMed]


Publisher’s Note: MDPI stays neutral with regard to jurisdictional claims in published maps and institutional affiliations. |
© 2021 by the author. Licensee MDPI, Basel, Switzerland. This article is an open access article distributed under the terms and conditions of the Creative Commons Attribution (CC BY) license (https://creativecommons.org/licenses/by/4.0/).
Share and Cite
Kim, S. A Computational Approach for Pathway-Based Systemic Drug Influence. Processes 2021, 9, 1063. https://doi.org/10.3390/pr9061063
Kim S. A Computational Approach for Pathway-Based Systemic Drug Influence. Processes. 2021; 9(6):1063. https://doi.org/10.3390/pr9061063
Chicago/Turabian StyleKim, Shinuk. 2021. "A Computational Approach for Pathway-Based Systemic Drug Influence" Processes 9, no. 6: 1063. https://doi.org/10.3390/pr9061063
APA StyleKim, S. (2021). A Computational Approach for Pathway-Based Systemic Drug Influence. Processes, 9(6), 1063. https://doi.org/10.3390/pr9061063