Article

Study on the Aerodynamic Performance of Floating Offshore Wind Turbine Considering the Tower Shadow Effect

College of Energy and Mechanical Engineering, Shanghai University of Electric Power, Shanghai 200090, China
*
Author to whom correspondence should be addressed.
Processes 2021, 9(6), 1047; https://doi.org/10.3390/pr9061047
Submission received: 3 May 2021 / Revised: 31 May 2021 / Accepted: 11 June 2021 / Published: 15 June 2021
(This article belongs to the Topic Marine Renewable Energy)

Abstract

:
The aerodynamic performance of the floating offshore wind turbine (FOWT) is obviously affected by the motion of the platform, and becomes much more complicated considering the effect of tower shadow. In view of this, this paper aims at investigating the aerodynamic performance of the floating offshore wind turbine with and without a tower under the three most influential motions (surge, pitch and yaw) by computational fluid dynamic (CFD). The results show that the power of the wind turbine is reduced by 1.58% to 2.47% due to the tower shadow effect under the three motions, and the pressure difference distribution is most obviously interfered by the tower shadow effect under yaw motion and concentrates at the root and tip of the blade. In addition, the degree of interference of the tower shadow effect on the wake flow field is different under the three motions, resulting in a more complex wake structure. These conclusions can provide a theoretical basis and technical reference for the optimal design of floating offshore wind turbines.

1. Introduction

With the consumption of traditional fossil fuels and serious environmental pollution, more and more countries in the world begin to attach importance to the development of renewable energy. As a kind of green, pollution-free and abundant renewable energy, wind energy has great potential for development [1]. Originally, wind turbines were mainly built on land, but due to the large noise of onshore wind turbines and relatively few wind and land resources, the wind power industry gradually developed to the sea [2]. From a worldwide point of view, the sea wind is rich in resources, and the wind is stable, which has become the irresistible general trend [3]. With the large-scale capacity of the offshore wind turbine, the size of the wind turbine and the height of the tower are increasing, resulting in a more obvious tower shadow effect [4]. Therefore, it is particularly important to study the unsteady aerodynamics under the tower shadow effect of FOWT.
Offshore wind power generation has obvious advantages over onshore wind power generation; however, FOWTs produce six degrees-of-freedom (6-DOF) [5] motions under the combined action of wind, waves and currents, resulting in more complex aerodynamics compared with onshore and offshore fixed wind turbines. In recent years, many scholars have studied the aerodynamic performance and structural characteristics of FOWTs from the aspects of experiments, models, research methods, etc. The blade element momentum (BEM) theory with two widely used engineering dynamic inflow models was used by Vaal [6] to investigate the effect of a periodic surge on the wind turbine. Ma [7] investigated the effects of the control system of the wind turbine and the motion of the floating platform on the blade aerodynamic performance during the representative typhoon time history. However, the BEM methods used to research aerodynamics lack the characteristics of capturing the physical details of the flow field, which the reasonability and accuracy are suspectable. Farrugia [8] used the results from the free-wake vortex simulations to analyze the wake characteristics of the wind turbine under floating conditions. Complex wake phenomena under the influence of extreme wave conditions were observed. Wen et al. [9,10] also used the FVM method for numerical simulation and found that the power coefficient overshoot is caused by the time lag between the output power and the wind farm power. The time lag and the resultant power coefficient overshoot increase as the platform surge frequency increases. In pitch motion, with the increase of the reduced frequency, the mean power output decreases at a low tip speed ratio and increases at a high tip speed ratio. Salehyar [11] investigated the dynamic response of a spar-buoy-based floating wind turbine to non-periodic disturbances through a coupled aero-hydro-elastic numerical model, observing the ability of the wind turbine to recover to the balanced position after being disturbed. Lin [12] investigated the aerodynamic characteristics in system pitch and surge motions and the asymmetric and complicated wake was observed. Tran et al. [13,14,15,16] performed the CFD simulation based on the dynamic mesh technique and an advanced overset moving grid method, respectively, to accurately consider the aerodynamic loads of a three-dimensional wind turbine. Results summarized the comparisons of different aerodynamic analyses under periodic surge, pitch and yaw motions to show the potential differences between the applied numerical methods. Chen [17] proposed a model of a spar-buoy and a semi-submersible floating wind turbine to compare with the experimental results of the two. Nguyen [18] studied the fully coupled motion of FOWT and applied the six degrees-of-freedom solid motion solver to multi-motion coupling to study the coupling of the surge, pitch and yaw motions. Huang [19] discussed the dynamic response of the local relative wind speed and local angle of attack of the blade section and the wind–wave force acting on the floating platform to reveal the interaction mechanism between the aerodynamic load and the motion of the platform with different degrees of freedom. Fang [20,21] applied a 1:50 model FOWT to explore the aerodynamics and characteristics of its wake under surge and pitch motions. Chen [22,23] investigated the aerodynamic characteristics of the wind turbine under surge–pitch coupling and pitch–yaw coupling by the combination of dynamic mesh and sliding mesh. The results show that the fluctuation of the overall aerodynamic performance of the wind turbine dramatically with the increase of amplitude and frequency. Sivalingam [24] examined the predictions of numerical codes by comparing them with experimental data of a scaled floating wind turbine.
In addition to the research on changes in wind turbine performance caused by platform motions, a series of studies have also focused on the tower shadow effect of the wind turbine. Kim [25] and Quallen [26] found that the diameter of the tower has a greater effect on the wind turbine than the gap between the tower and the blade, and the root of the blade is more affected by the tower. Ke [27] proposed an effective method for calculating the aerodynamic load and aeroelastic response of a large wind turbine tower blade coupling structure under the yaw condition, taking full account of wind shear, tower shadow, aerodynamic interaction and rotation effect. Noyes [28] used unsteady aerodynamic experiments to analyze the influence of tower shadow effect on aerodynamic loads and blade-bending moments of downwind two-blade wind turbines. Zhang [29] found that the maximum displacement and Mises stress increase with the increase of the average wind speed under the tower shadow effect. Li [30] investigated the aeroelastic coupling effect under periodic unsteady inflows, indicating that the tower shadow effect causes dramatic changes in the tilting moment, thrust force and output power when the blade rotates in front of the tower. Wu [31] investigated the unsteady flow characteristics in the tip region of the blade, observing the static pressure distribution of different blades near the leading edge of the tip is very different due to the influence of turbulence intensity and tower shadow effect.
According to the above literature review, the influence of the six degrees-of-freedom motions of the platform on the FOWTs has been studied to a certain extent, and the investigations on the tower shadow effect are mostly focused on the land-based fixed wind turbine. Nevertheless, the effect of platform motions combined with the tower shadow effect is rarely mentioned. This paper aims to investigate the unsteady aerodynamic characteristics of FOWTs under surge, pitch and yaw motions based on the tower shadow effect. The unsteady dynamic numerical simulation of the aerodynamic characteristics of the full-size wind turbine model in the rotating process was carried out using a UDF (user-defined function) and embedded sliding mesh, and the unsteady Reynolds-Averaged Navier–Stokes equations (RANS) and SST k-ω turbulence model are adopted. Considering the effect of the tower shadow effect, the power, thrust and the pressure distribution of blade sections under surge, pitch and yaw motions are compared and analyzed, and the near wake and far wake flow fields of the wind turbine are analyzed.

2. Model and Numerical Methods

2.1. Governing Equations and Turbulent Model

The three laws of mass conservation equation, momentum conservation equation and energy conservation equation need to be followed in fluid mechanics. For incompressible fluids, the continuity equation and the momentum equation (Navier–Stokes equation) can be used to describe the law of conservation of mass and momentum of the fluid. Regodeseves [32] and Burmester [33] validated the accuracy of the model in simulating the aerodynamic characteristics of FOWTs by comparing the simulation results of the model with the experimental data.
The definition of the continuity equation, Reynolds equation and scalar Φ time-averaged transport equation expressed in the tensor form are expressed as follows:
ρ t + x i ( ρ u i ) = 0 ,
t ρ u i + x j ρ u i u j = p x i + x j ( μ u i x j ρ u l u j ¯ ) + S i ,
( ρ ϕ ) t + ( ρ u j ϕ ) x j = x j Γ ϕ x j ρ u j ϕ ¯ + S ,
τ i j = ρ u l u j ¯ ,
where ρ is the air density, t is the time, ui and uj represent the Reynolds mean velocity components of fluid, p is the pressure, μ denotes the coefficient of dynamic viscosity, S is the generalized source term (i, j = 1, 2, 3) and Γ represents the diffusivity. τ i j corresponds to six different Reynolds stress terms, which is defined as Reynolds stress.
The SST k-w model combines the advantages of the k-w model in the near-wall region and the far-field calculation of the k-ε model, further modifies the turbulent viscosity and adds an orthogonal diffusion term, which can well predict the separation of the fluid under the negative pressure gradient. For the aerodynamic analysis of the wind turbine in this paper, the SST k-w model has obvious advantages, which is used in the later simulation.
The transport equation expression of SST k-w is as follows:
( ρ k ) t + ( ρ u i k ) x i = x j Γ k k x j + G ¯ k Y k + S k ,
( ρ w ) t + ( ρ u i w ) x i = x j Γ w w x j + G w Y w + D w + S w ,
where G ¯ k is the turbulent energy caused by the average velocity gradient, G w is the turbulent dissipation rate, Γ k   and Γ w represent the effective diffusivity of k and w caused by turbulence, respectively, Y k and Y w are the dissipation of k and ω, D w is the orthogonal divergence, both S k and S w   represent user-defined source items.

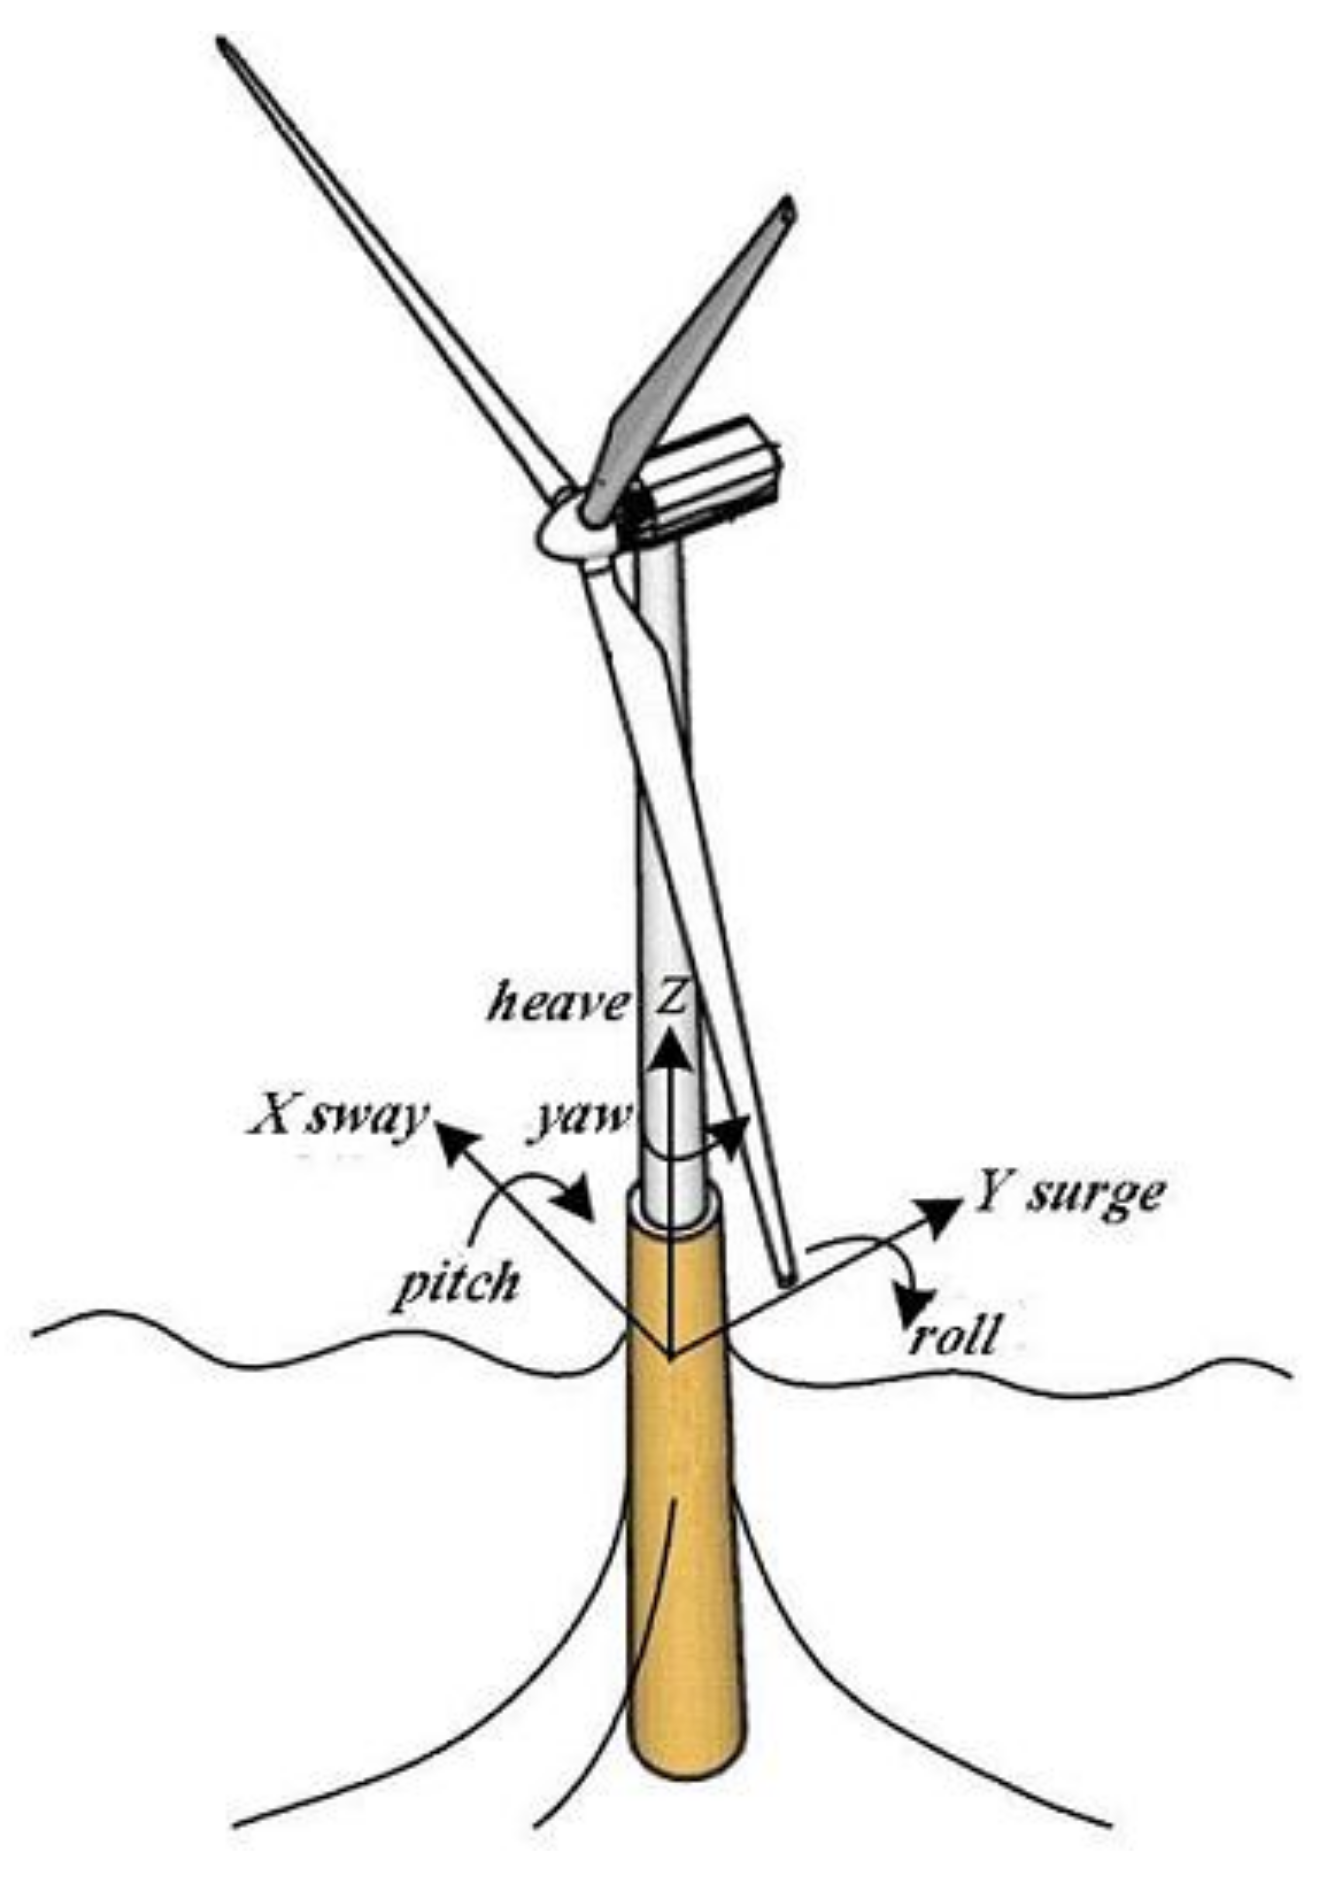
2.2. Floating Foundation

The floating foundation wind turbine is affected by wind, waves and currents in the marine environment, which produces 6-DOF motions. As shown in Figure 1, the motion of the platform includes three rotational components (pitch about X, roll about Y and yaw about Z) and three translational components (sway in X, surge in Y and heave in Z). This paper chooses a Spar floating wind turbine foundation for its larger draft, small vertical excitation force and heave motion [34].

2.3. Wind Turbine Model

The NREL 5 MW wind turbine was selected as the research object, which is a three-bladed, upwind wind turbine and the power control adopts variable speed and variable pitch method. The diameter of the wind turbine is 126 m, and the hub height is 90 m. From root to tip, DU series airfoils of different thicknesses are used, and NACA series airfoils are used in the tip part. This study considers the existence of the tower, the bottom diameter of the tower is 6 m, and the top diameter is 3.87 m. The numerical simulation of the wind turbine is carried out under the rated operating conditions; the incoming wind speed is 11.4 m/s with the rotational speed of 12.1 r/min.

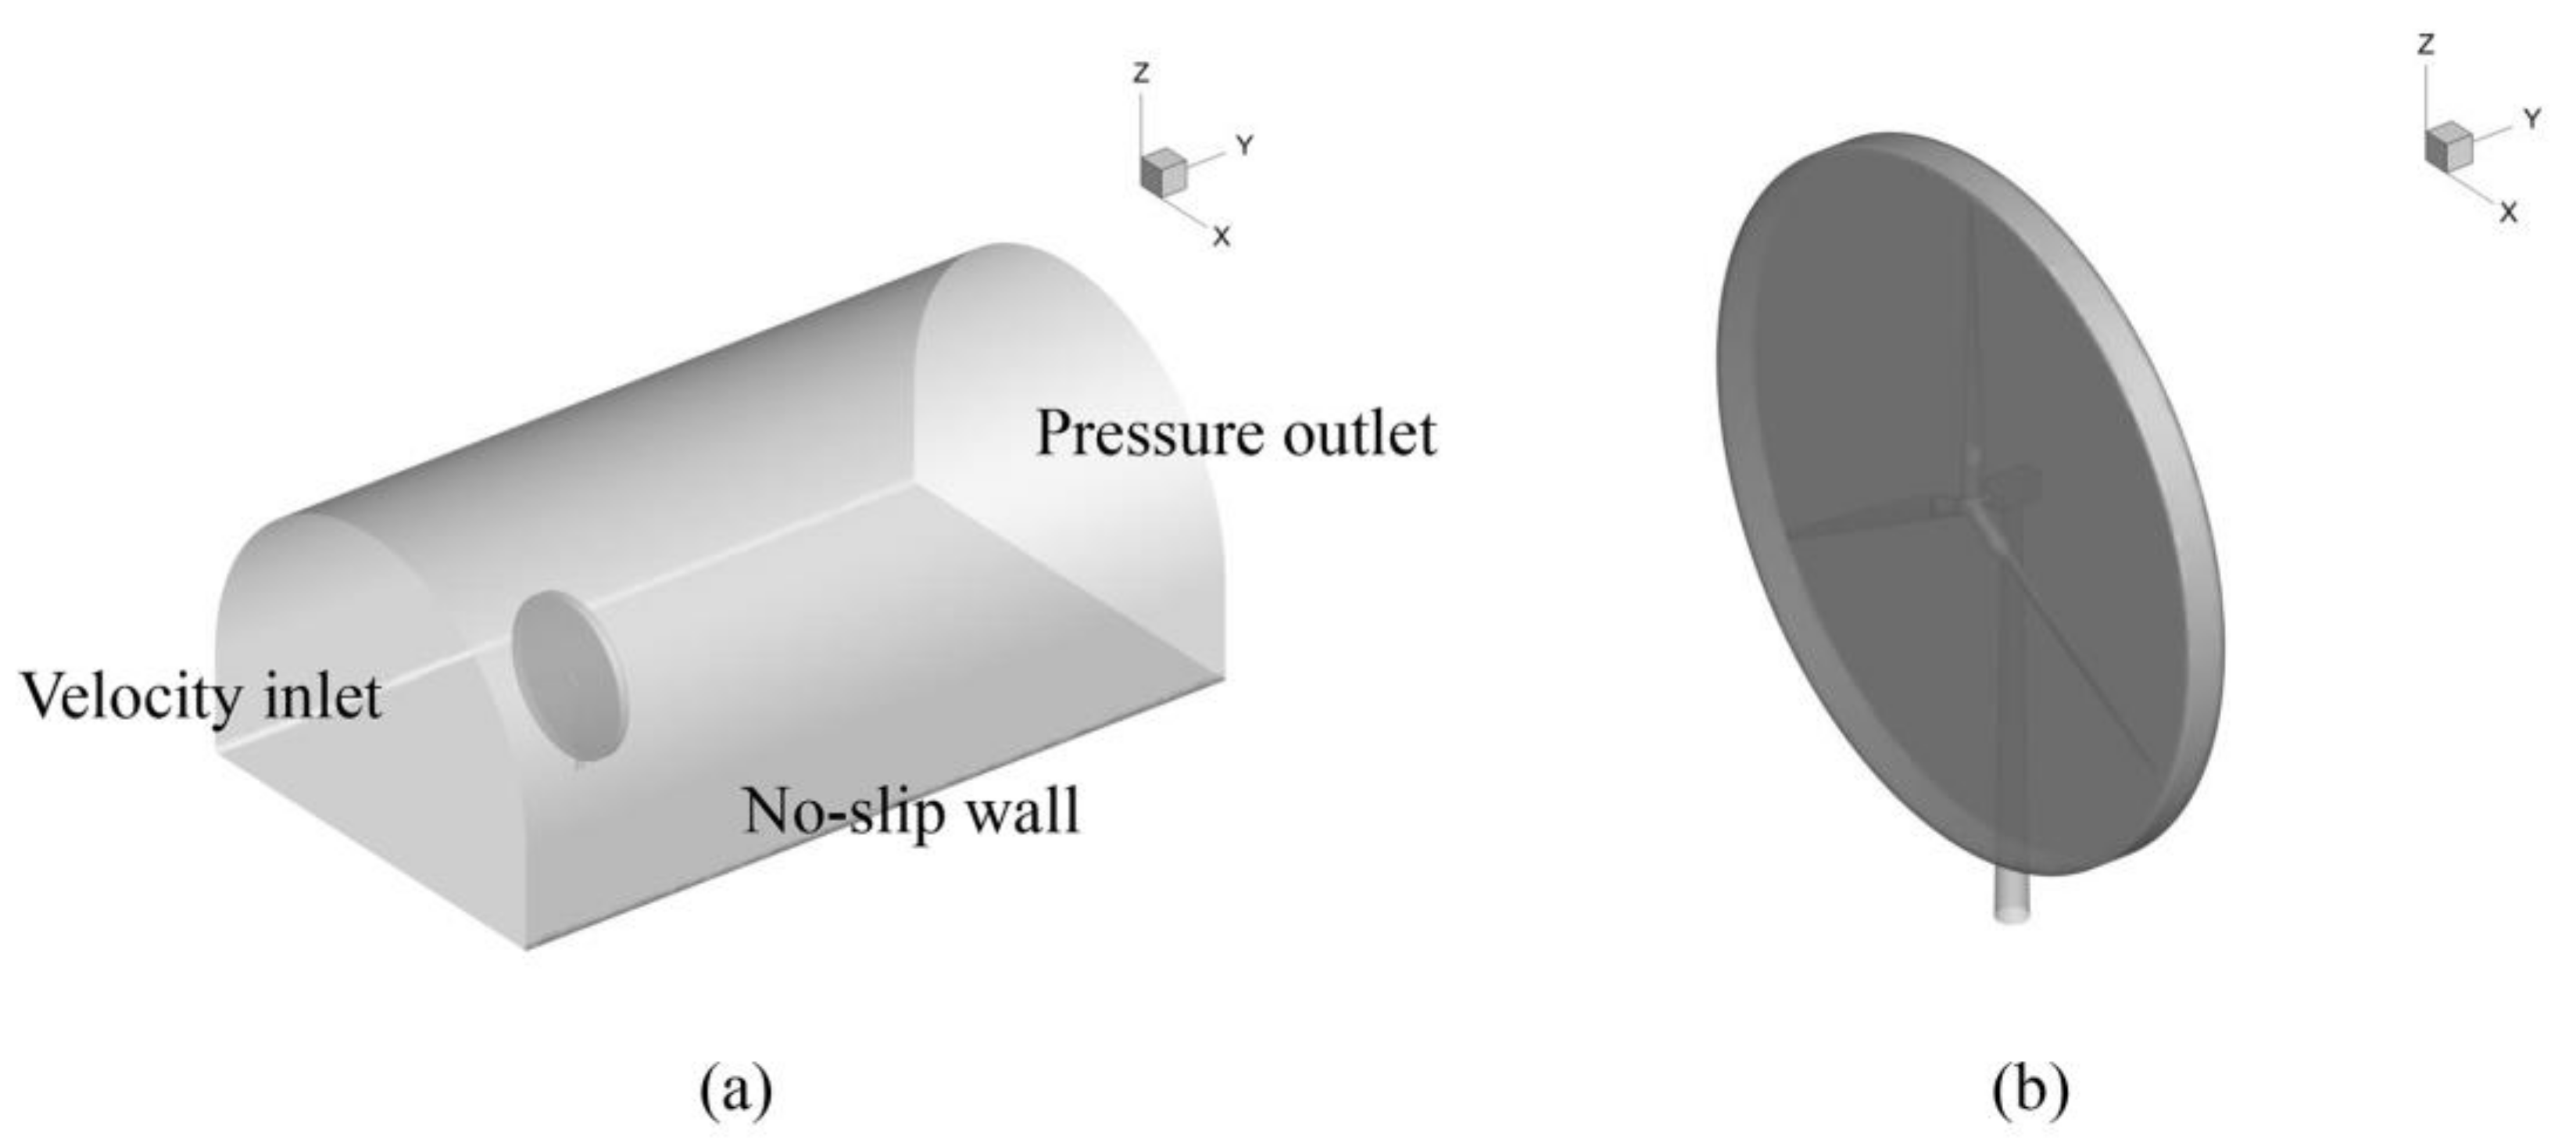
2.4. Flow Field and Boundary Conditions

As shown in Figure 2, the flow field calculation domain is divided into the external static domain and internal rotation domain. The rotational domain is used to define the rotation of the wind turbine relative to the external domain under the action of the inflow wind. The origin of the coordinate system is located in the center of the hub. The rotational domain is a cylinder with a diameter of 140 m and a height of 8 m. Considering the vastness of the sea area, the calculation domain should be divided large enough to reduce the influence of the boundary on the calculation accuracy [35]. The external flow field is a combination of a hemisphere with a diameter of 6.3 R (R is 63 m radius of the wind turbine rotor) and a cuboid with a width of 90 m. The inlet distance is 3.2 R from the rotation domain, and the outlet distance is 8 R from the rotation domain.
Due to the nested motion in the blade rotation domain, it is necessary to use the embedded sliding mesh to define its rotation. The area where the inner and outer domains are in contact with each other is set as the interface. There is a relative slip between the interfaces and the flow field information is transmitted. The inlet and outlet of the external flow field are set as velocity inlet and pressure outlet, respectively. Additionally, the surface of the blade and the surrounding boundary of the external flow field are set as non-slip walls.

2.5. Computational Mesh

The internal and external flow field of the wind turbine is divided into unstructured grids by using MESH software. Figure 3 presents the grid generation in the overall computational domain. As the blade structure of the wind turbine model is complex and the tip position of the blade is too sharp, the grid size of the rotation region close to the blade needs to be set smaller, and the surface grid of the blade is further refined, which meets the requirements of the SST k-w turbulence model. As shown in Figure 3a, there are a total of 8.27 million grids in the whole flow field, of which the internal flow field grid is 6.21 million and the external field grid is 2.06 million.

2.6. Computational Methods

The flow field of the wind turbine is simulated in ANSYS Fluent software, and the unsteady Reynolds-Averaged Navier–Stokes equations (RANS) is solved by using the SST k-w turbulence model considering the transition effects on the blade surface. The sliding grid method is used to simulate the rotation of the wind turbine, which is set as a transient calculation. The pressure-based solver is used, the SIMPLEC algorithm is selected for pressure-velocity coupling, in which the second-order upwind scheme is used for pressure term, convection term, turbulent kinetic energy equation and turbulent dissipation rate. Based on the steady calculation results, the unsteady calculation for 20 s is carried out, the additional calculation for 40 s is carried out in the case of platform motion, and the last platform motion period after convergence is taken as the analysis result. The residual of the continuity equation is reduced by at least four orders of magnitude in the process of calculation.
Figure 1 has defined the form of platform motions, including surge, pitch and yaw, which are the main factors affecting the aerodynamic performance of FOWTs. According to the situation of the literature [36], the suitable amplitude and frequency parameters of the floating foundation are selected, and the main motion parameters are shown in Table 1. In order to realize the above platform motions, the additional speed change is compiled by the DEFINE_PFORILE macro of UDF. It is assumed that the motion of the FOWT floating foundation is harmonic; its expression can be written as:
β i ( t ) = A i sin ( ε i t ) ,
where βi(t), Ai and εi (i = surge, pitch, yaw) denote the angle/displacement, amplitude and frequency of the platform motion.
The motion of the floating foundation is described by the matrix between coordinate systems [37]. The incoming wind speed is set to V = [Vx, Vy, Vz]T, where Vx, Vy, Vz represents the partial velocity in the direction of X, Y and Z, respectively. the relative inflow velocity of the platform during surge motion is converted into VS, which can be written as
V S = V ( t ) + 0 β s u r g e ( t ) 0 = 0 V y + ε s u r g e A s u r g e cos ( ε s u r g e t ) 0 ,
where β s u r g e ( t ) denotes the velocity of surge motion at each moment.
The pitch motion corresponds to the rotation β p i t c h of the floating platform around the x-axis, and the incoming flow velocity is converted to the relative velocity V P , which can be presented as
V P = 1 0 0 0 cos β p i t c h sin β p i t c h 0 sin β p i t c h cos β p i t c h V = 0 V y cos ( A p i t c h sin ( ε p i t c h t ) ) V y sin ( A p i t c h sin ( ε p i t c h t ) )
The yaw motion corresponds to the rotation β y a w of the floating platform around the z-axis, and the incoming flow velocity is converted to the relative velocity V Y , which can be presented as
V Y = cos β y a w sin β y a w 0 sin β y a w cos β y a w 0 0 0 1 V = V y sin ( A y a w sin ( ε y a w t ) ) V y cos ( A y a w sin ( ε y a w t ) ) 0

3. Numerical Model Verification

3.1. Model Grid Independence Verification

Table 2 exhibits the numerical value of the wind turbine torque under different meshing precision, which are refined along the circumference of wind turbine blades. The number of simulated grids is as follows: 2.86 million, 4.77 million, 6.71 million, 8.50 million and 10.08 million.
It can be found that with the refinement of the mesh, the error value of torque decreases constantly, and the decrease becomes smaller and smaller. The mesh of 8.50 million is selected for in-depth research due to the consideration of calculation accuracy and efficiency.

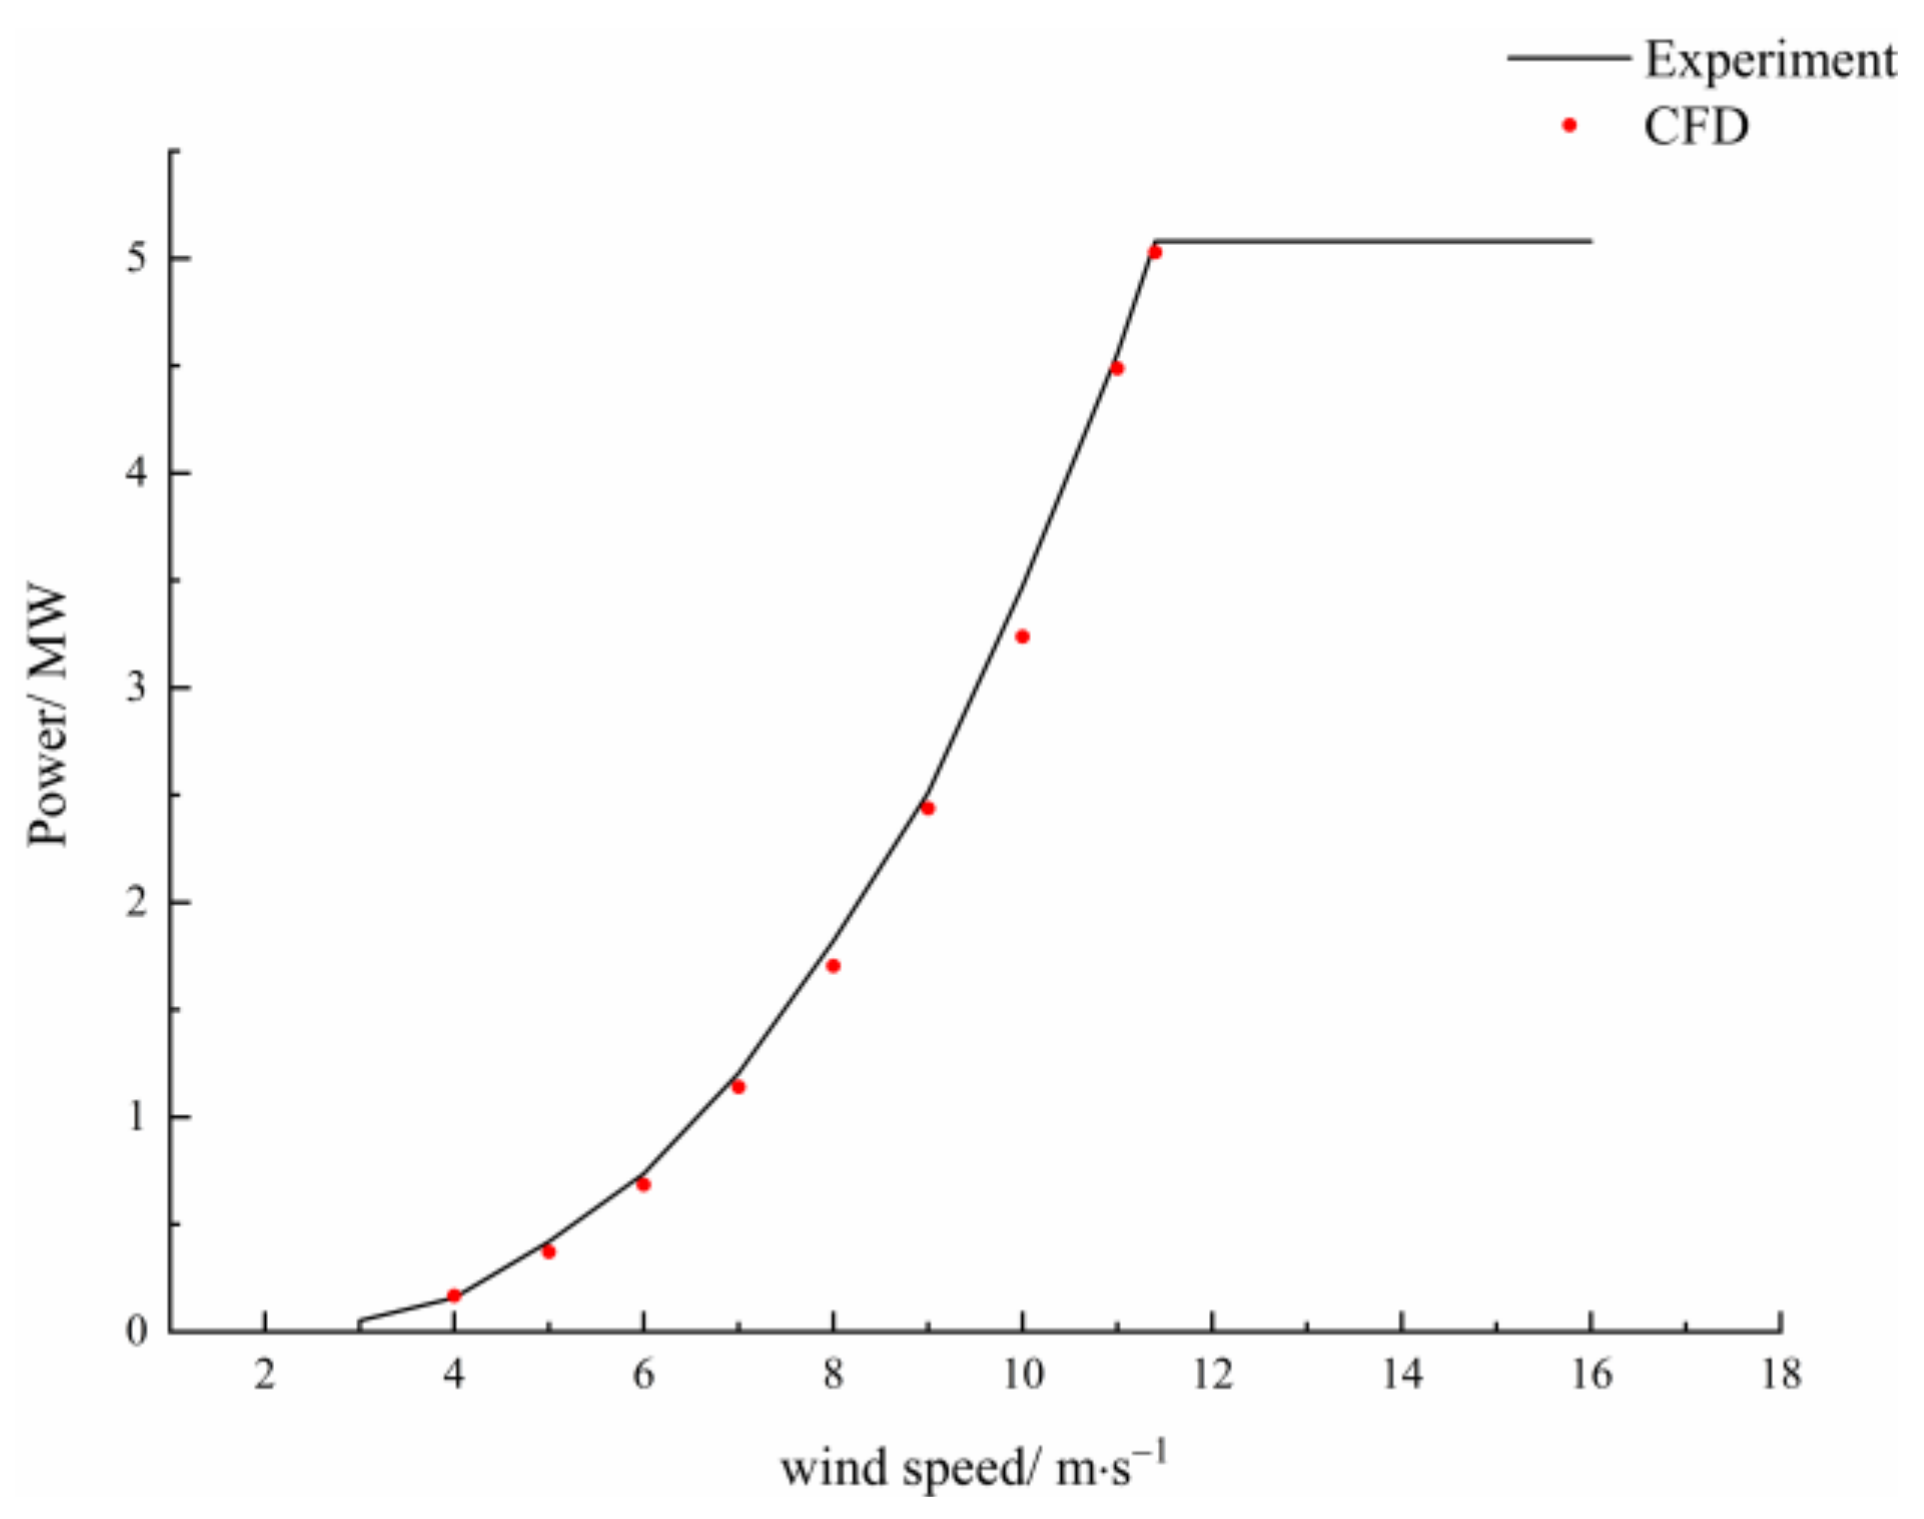
3.2. Model Power Verification

Due to the lack of feasible experimental data, the experimental results of Jonkman [38] were selected for verifying the accuracy of the simulation. The cut-in wind speed of the NREL 5 MW wind turbine is 3 m/s. When the wind speed reaches more than 3 m/s, the wind turbine starts to operate. The rated wind speed is 11.4 m/s, and the rated speed is 12.1 rpm. When the wind speed exceeds the rated wind speed, the constant power control is realized by changing the pitch angle and reducing the lift-drag ratio.
Figure 4 illustrates the comparison of stable power between numerical simulation and experimental data under different incoming wind speeds. All of the results exhibited a high consistency before the incoming wind speed reached 11.4 m/s, indicating that the current simulation method has good accuracy and reasonable results.

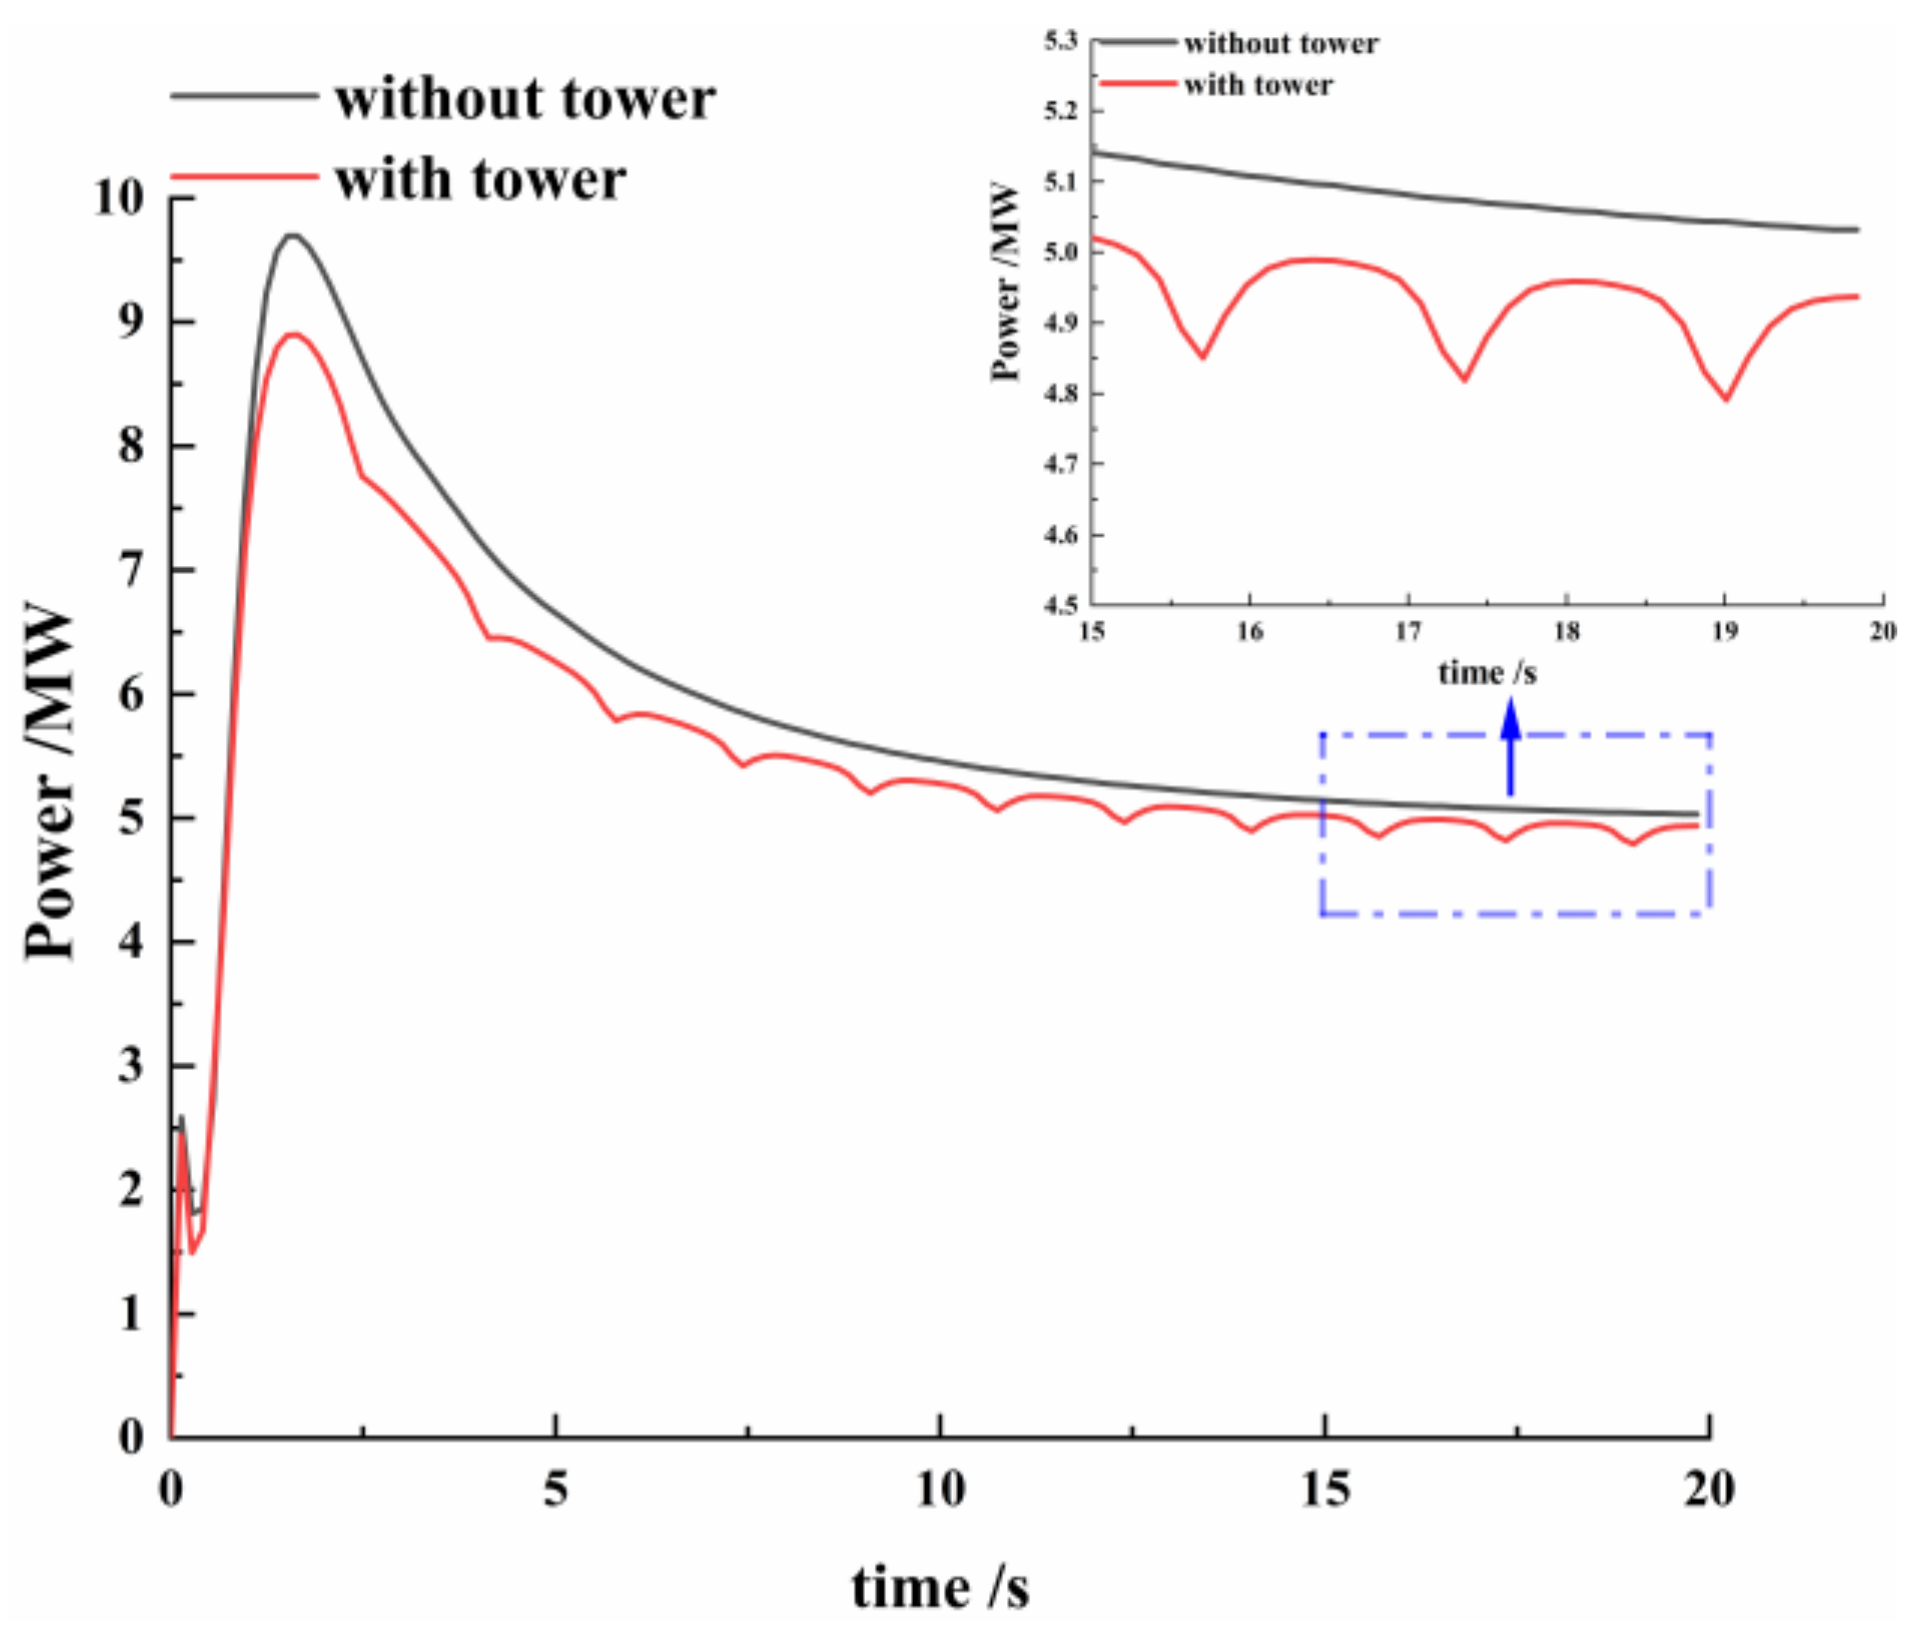
3.3. Validation Considering the Tower under the Unsteady Condition

It should be noted that the change of additional wind speed caused by the motion of the platform is synchronously added to the inlet velocity. The numerical model is verified with and without tower under unsteady calculation, respectively. A sufficient degree of steady condition calculation is carried out for the numerical model under rated conditions first, and the results of the steady calculation are taken as the initial flow field under unsteady wind speed conditions.
The uniform wind speed is 11.4 m/s, which is set at the inlet of the flow field. The speed of the wind turbine is 12.1 rpm. The time-step corresponding to 10° azimuth increment with 40 pseudo-time sub-iterations is 0.137741 s. The rotation time of the wind turbine for 4 cycles is calculated under unsteady conditions. Figure 5 shows the power fluctuation with and without the tower and it indicated that the power of the wind turbine tends to be stable after the wind turbine rotates for three cycles. Furthermore, a periodic rotation variation of the wind turbine in stable operation was observed locally. Compared with the non-tower, the existence of the tower makes the power decrease dramatically with an azimuth of 120° apart. This phenomenon is consistent with Wen [39]’s research, which verifies the influence of the tower shadow effect on the wind turbine.

4. Results and Discussion

Due to the obstruction of the tower to the airflow, the interference effect of the tower on the blades is different when the blades rotate to different azimuth angles. This paper takes the blades rotating to the azimuth directly above the tower as the starting point. The schematic diagram of the azimuth angle of the wind turbine blades is shown in Figure 6. θ is the angle between the two blades, γ is the influence area of the tower shadow effect and the wind turbine rotates counterclockwise.

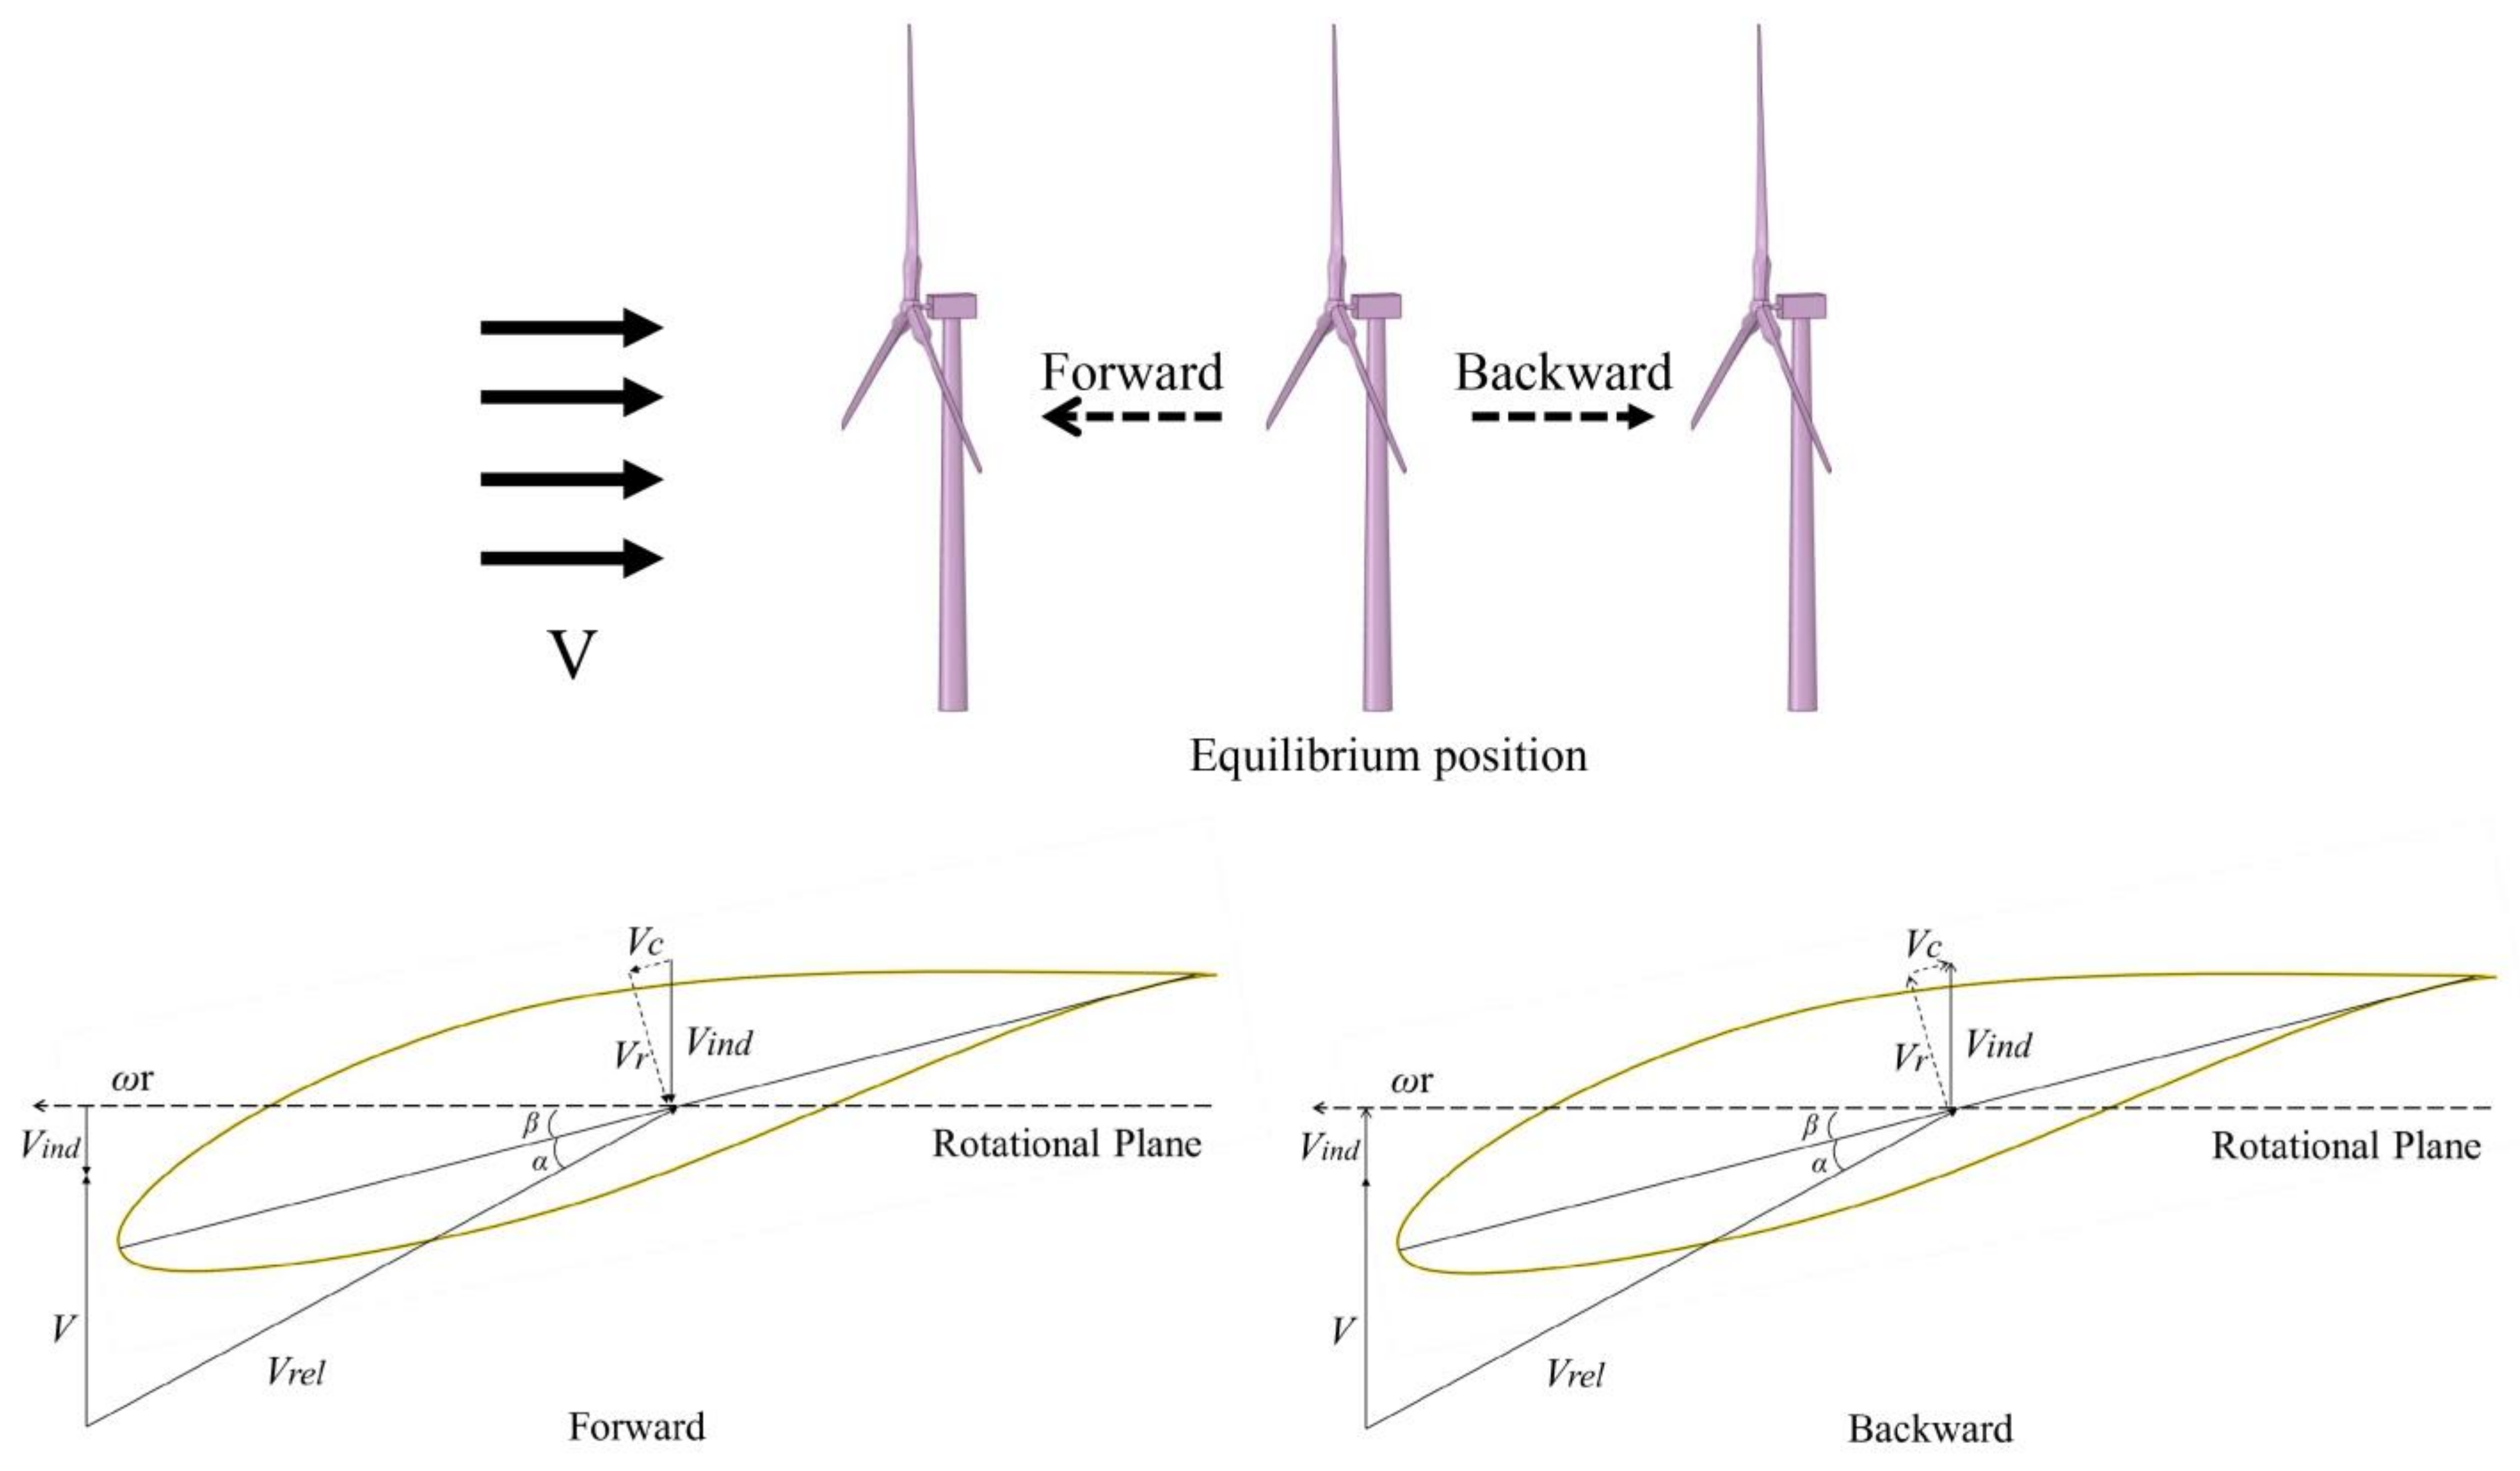
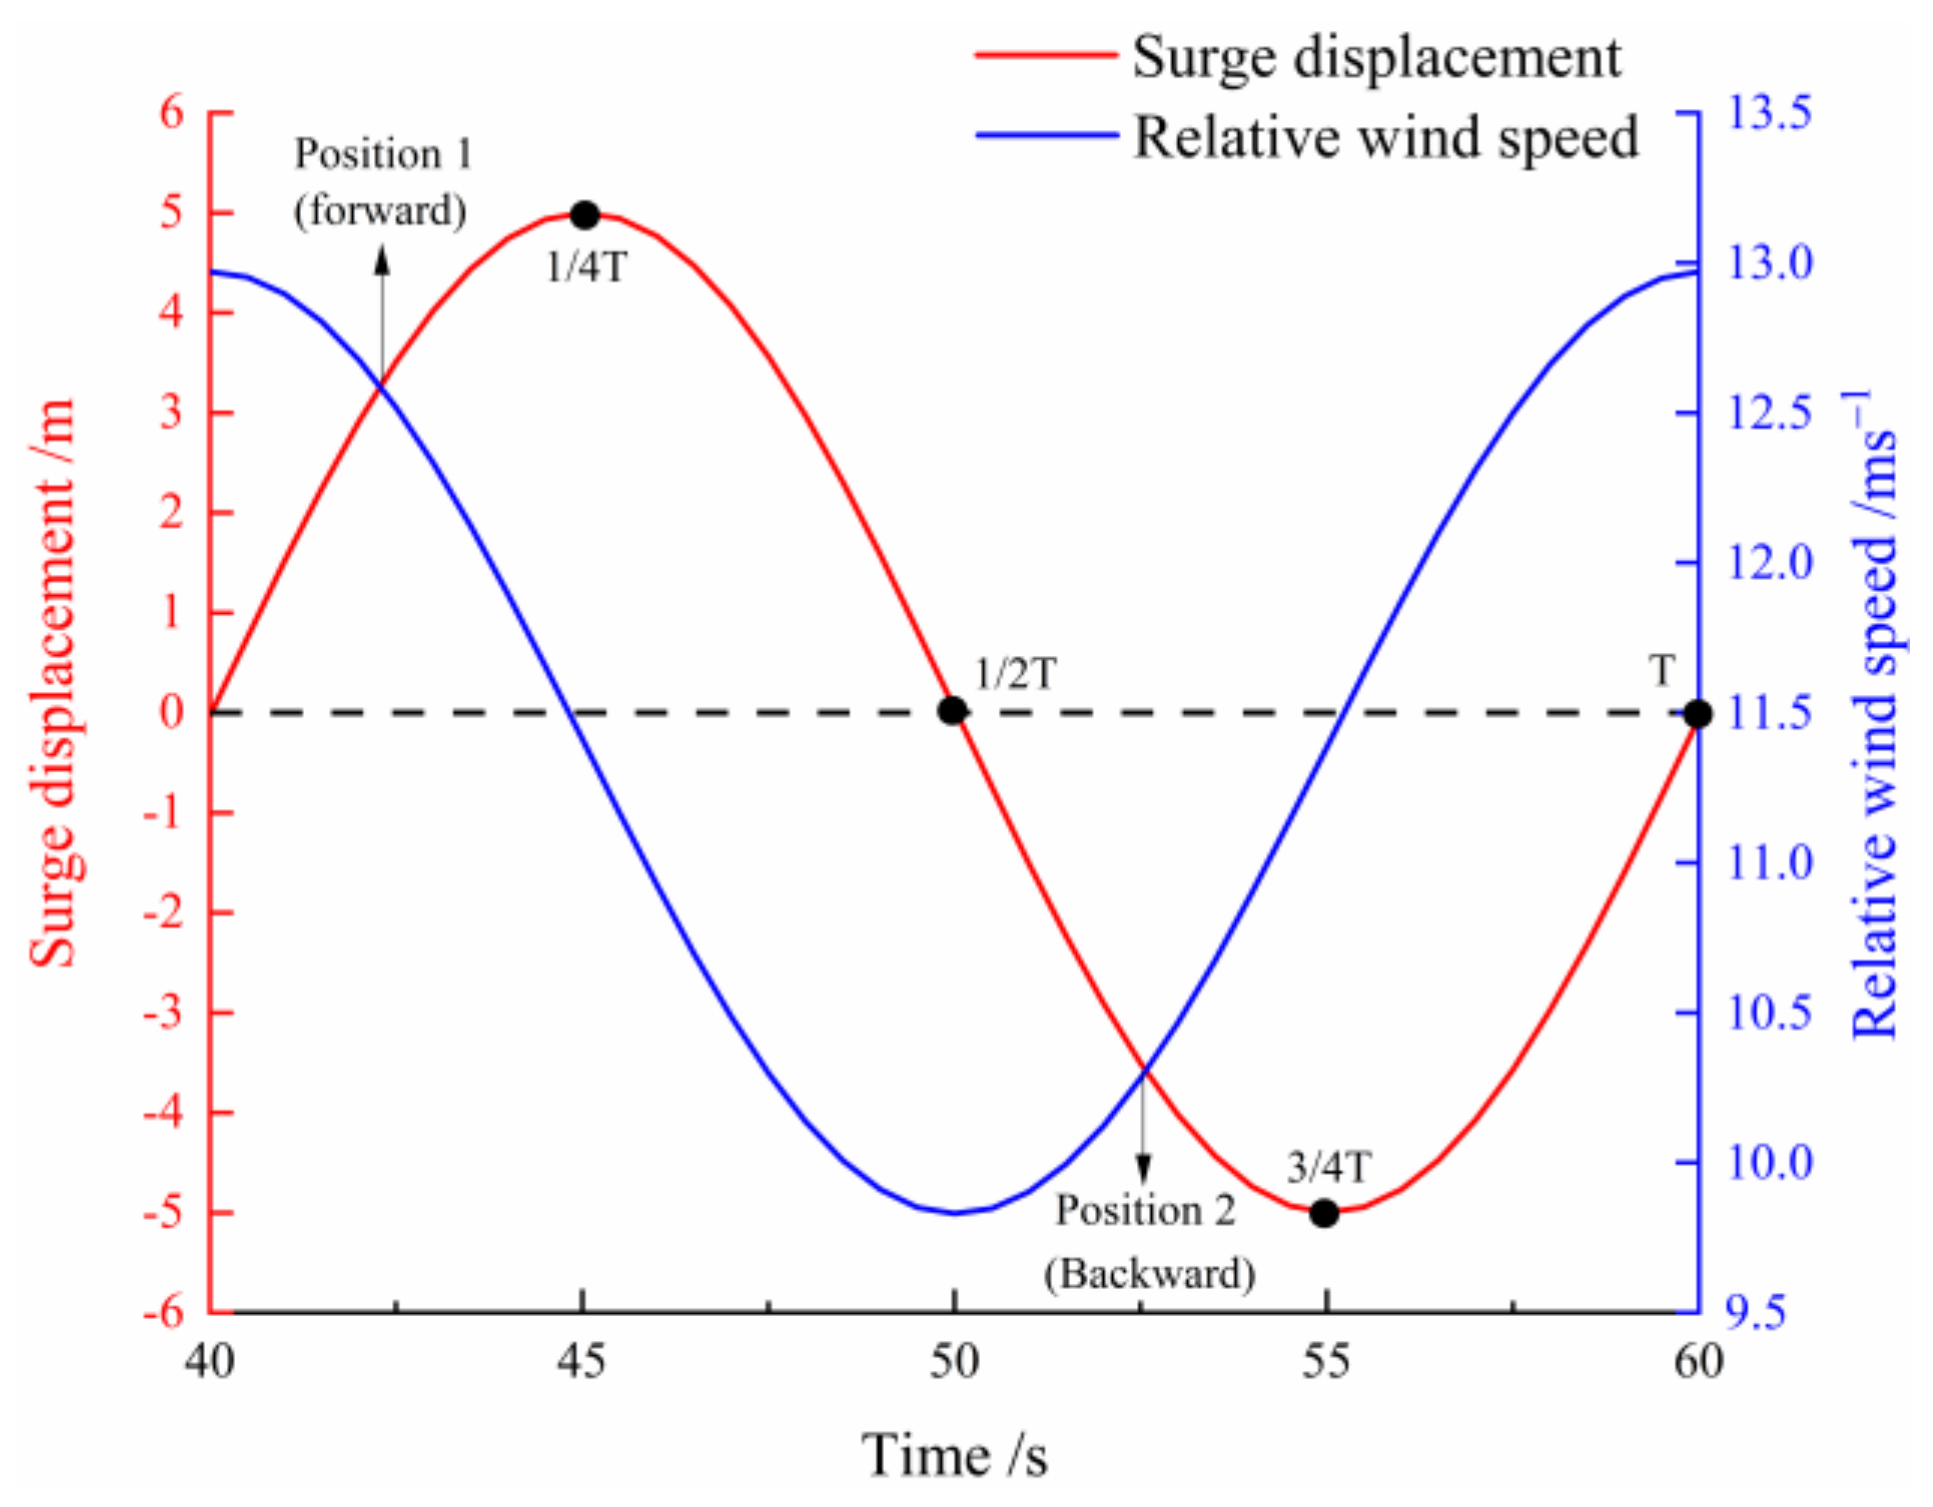
4.1. Unsteady Aerodynamic Analysis under Surge Motion

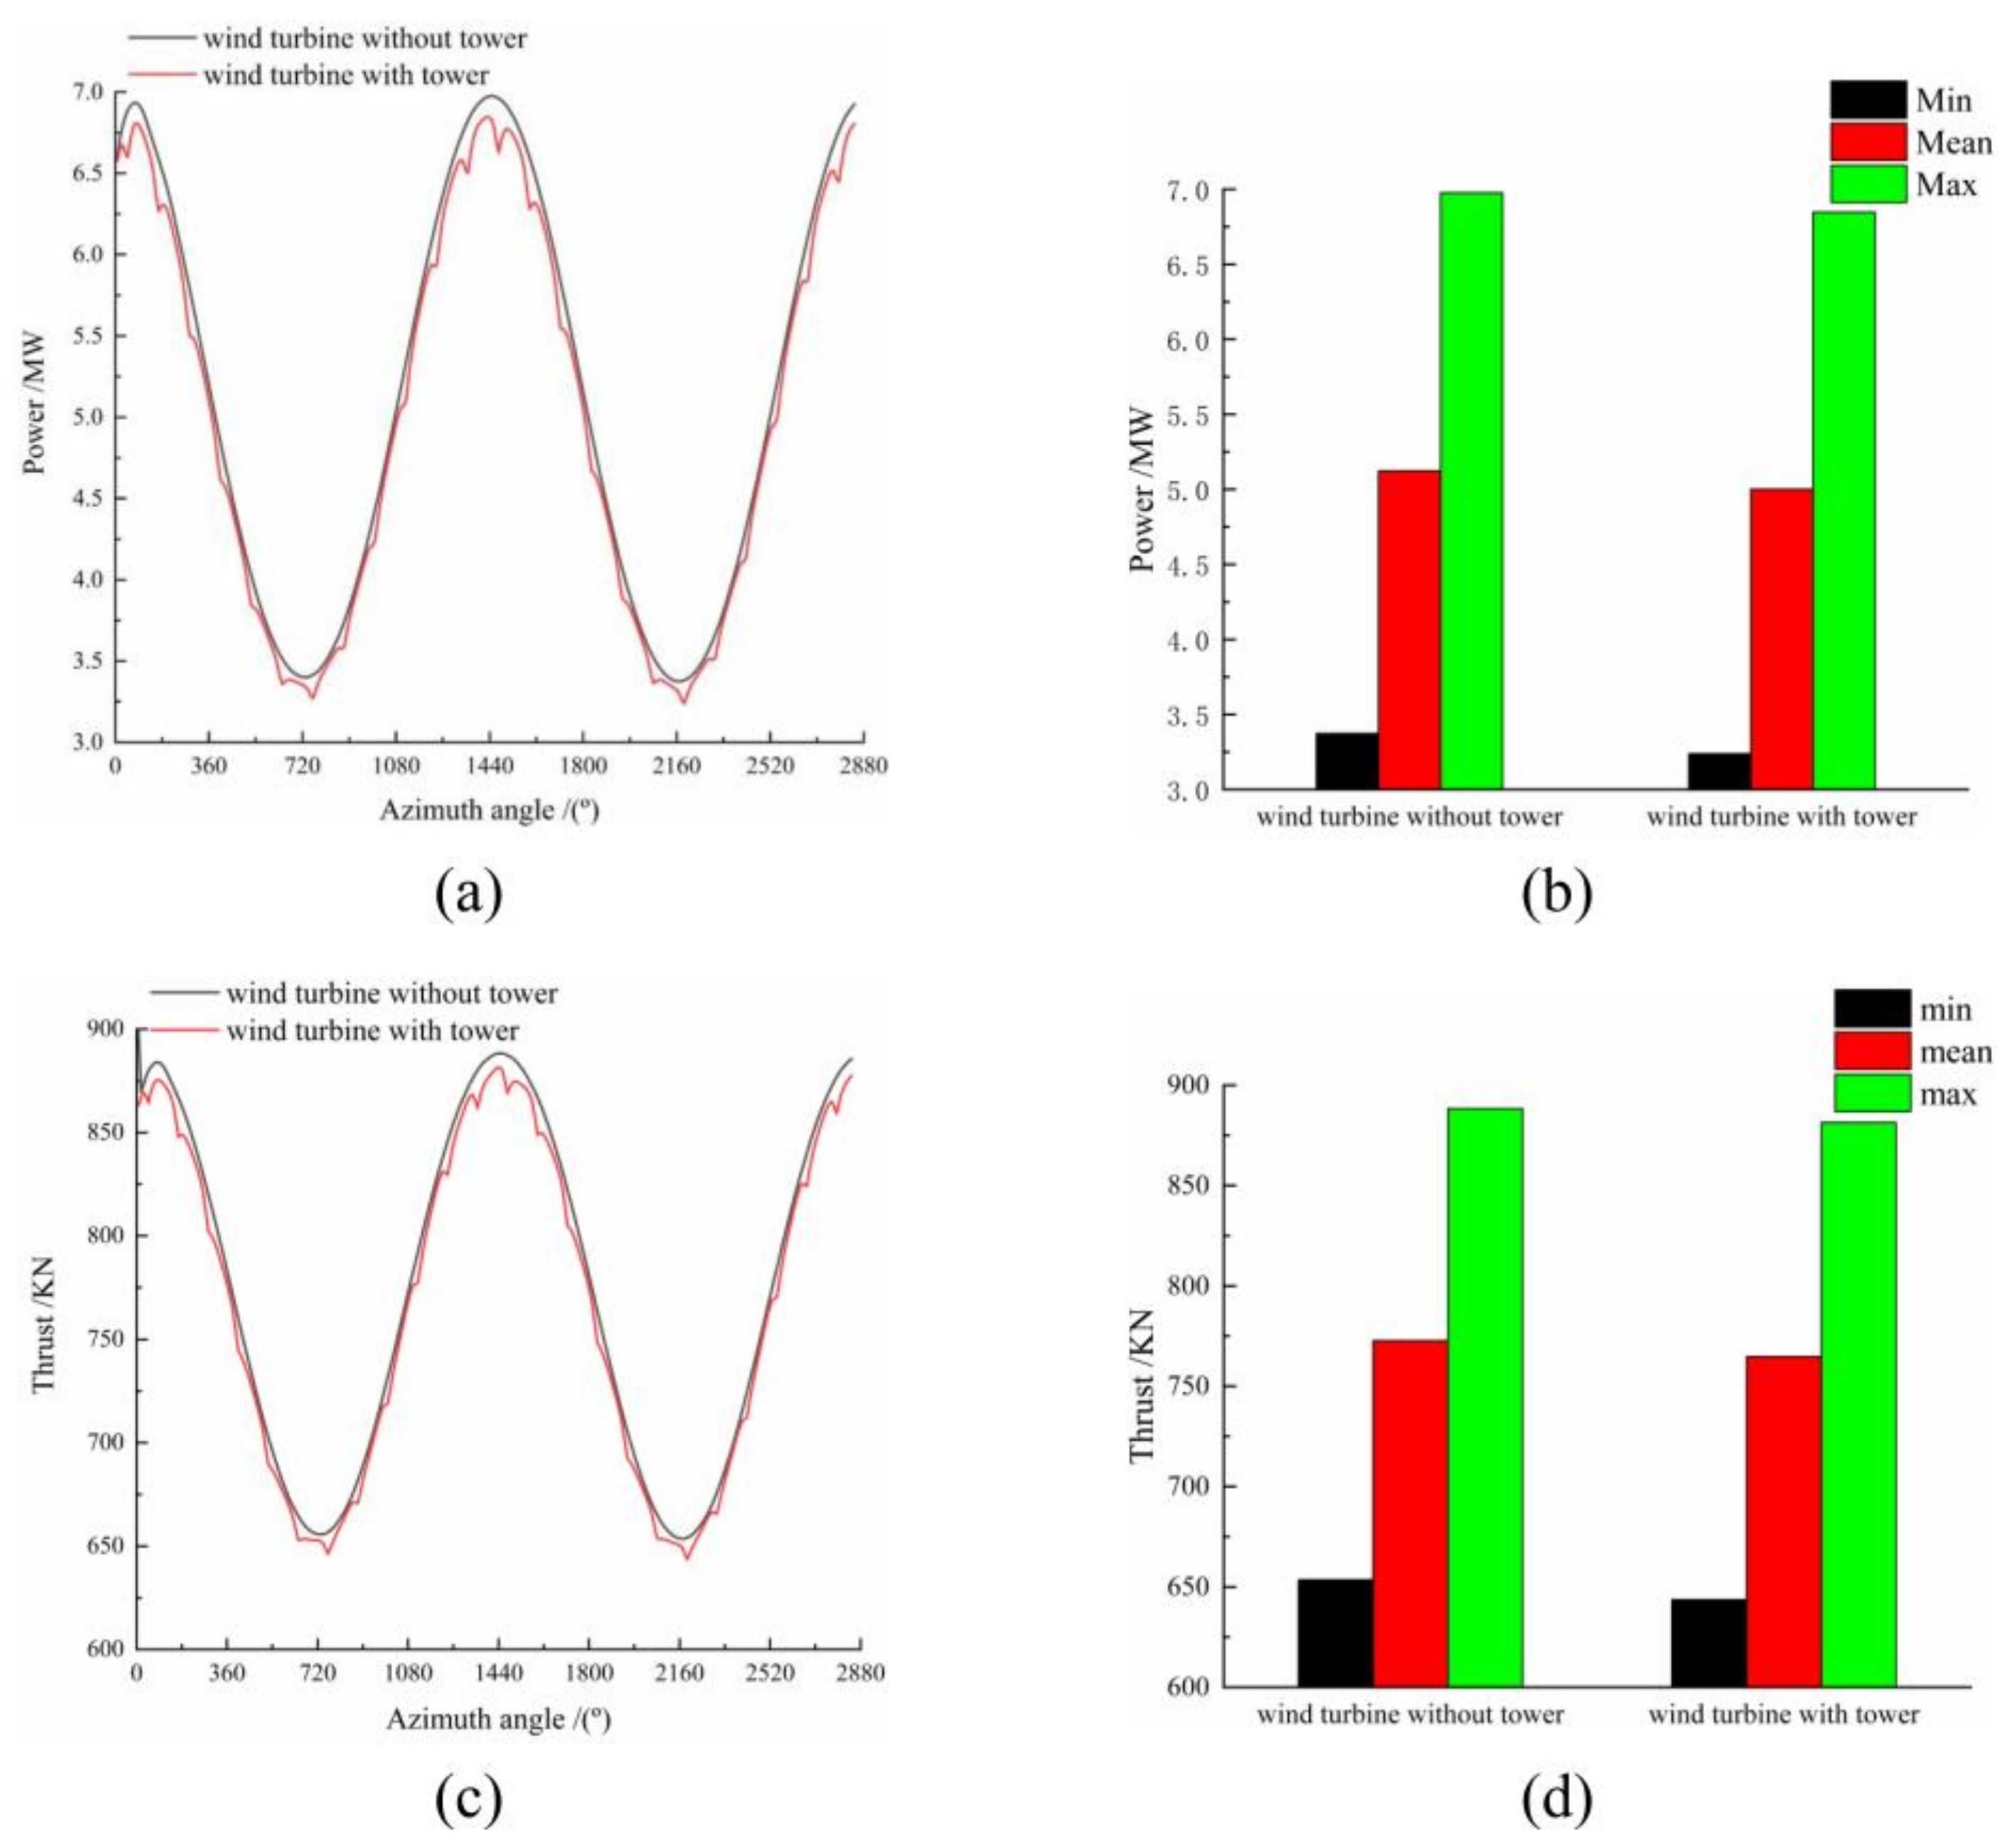
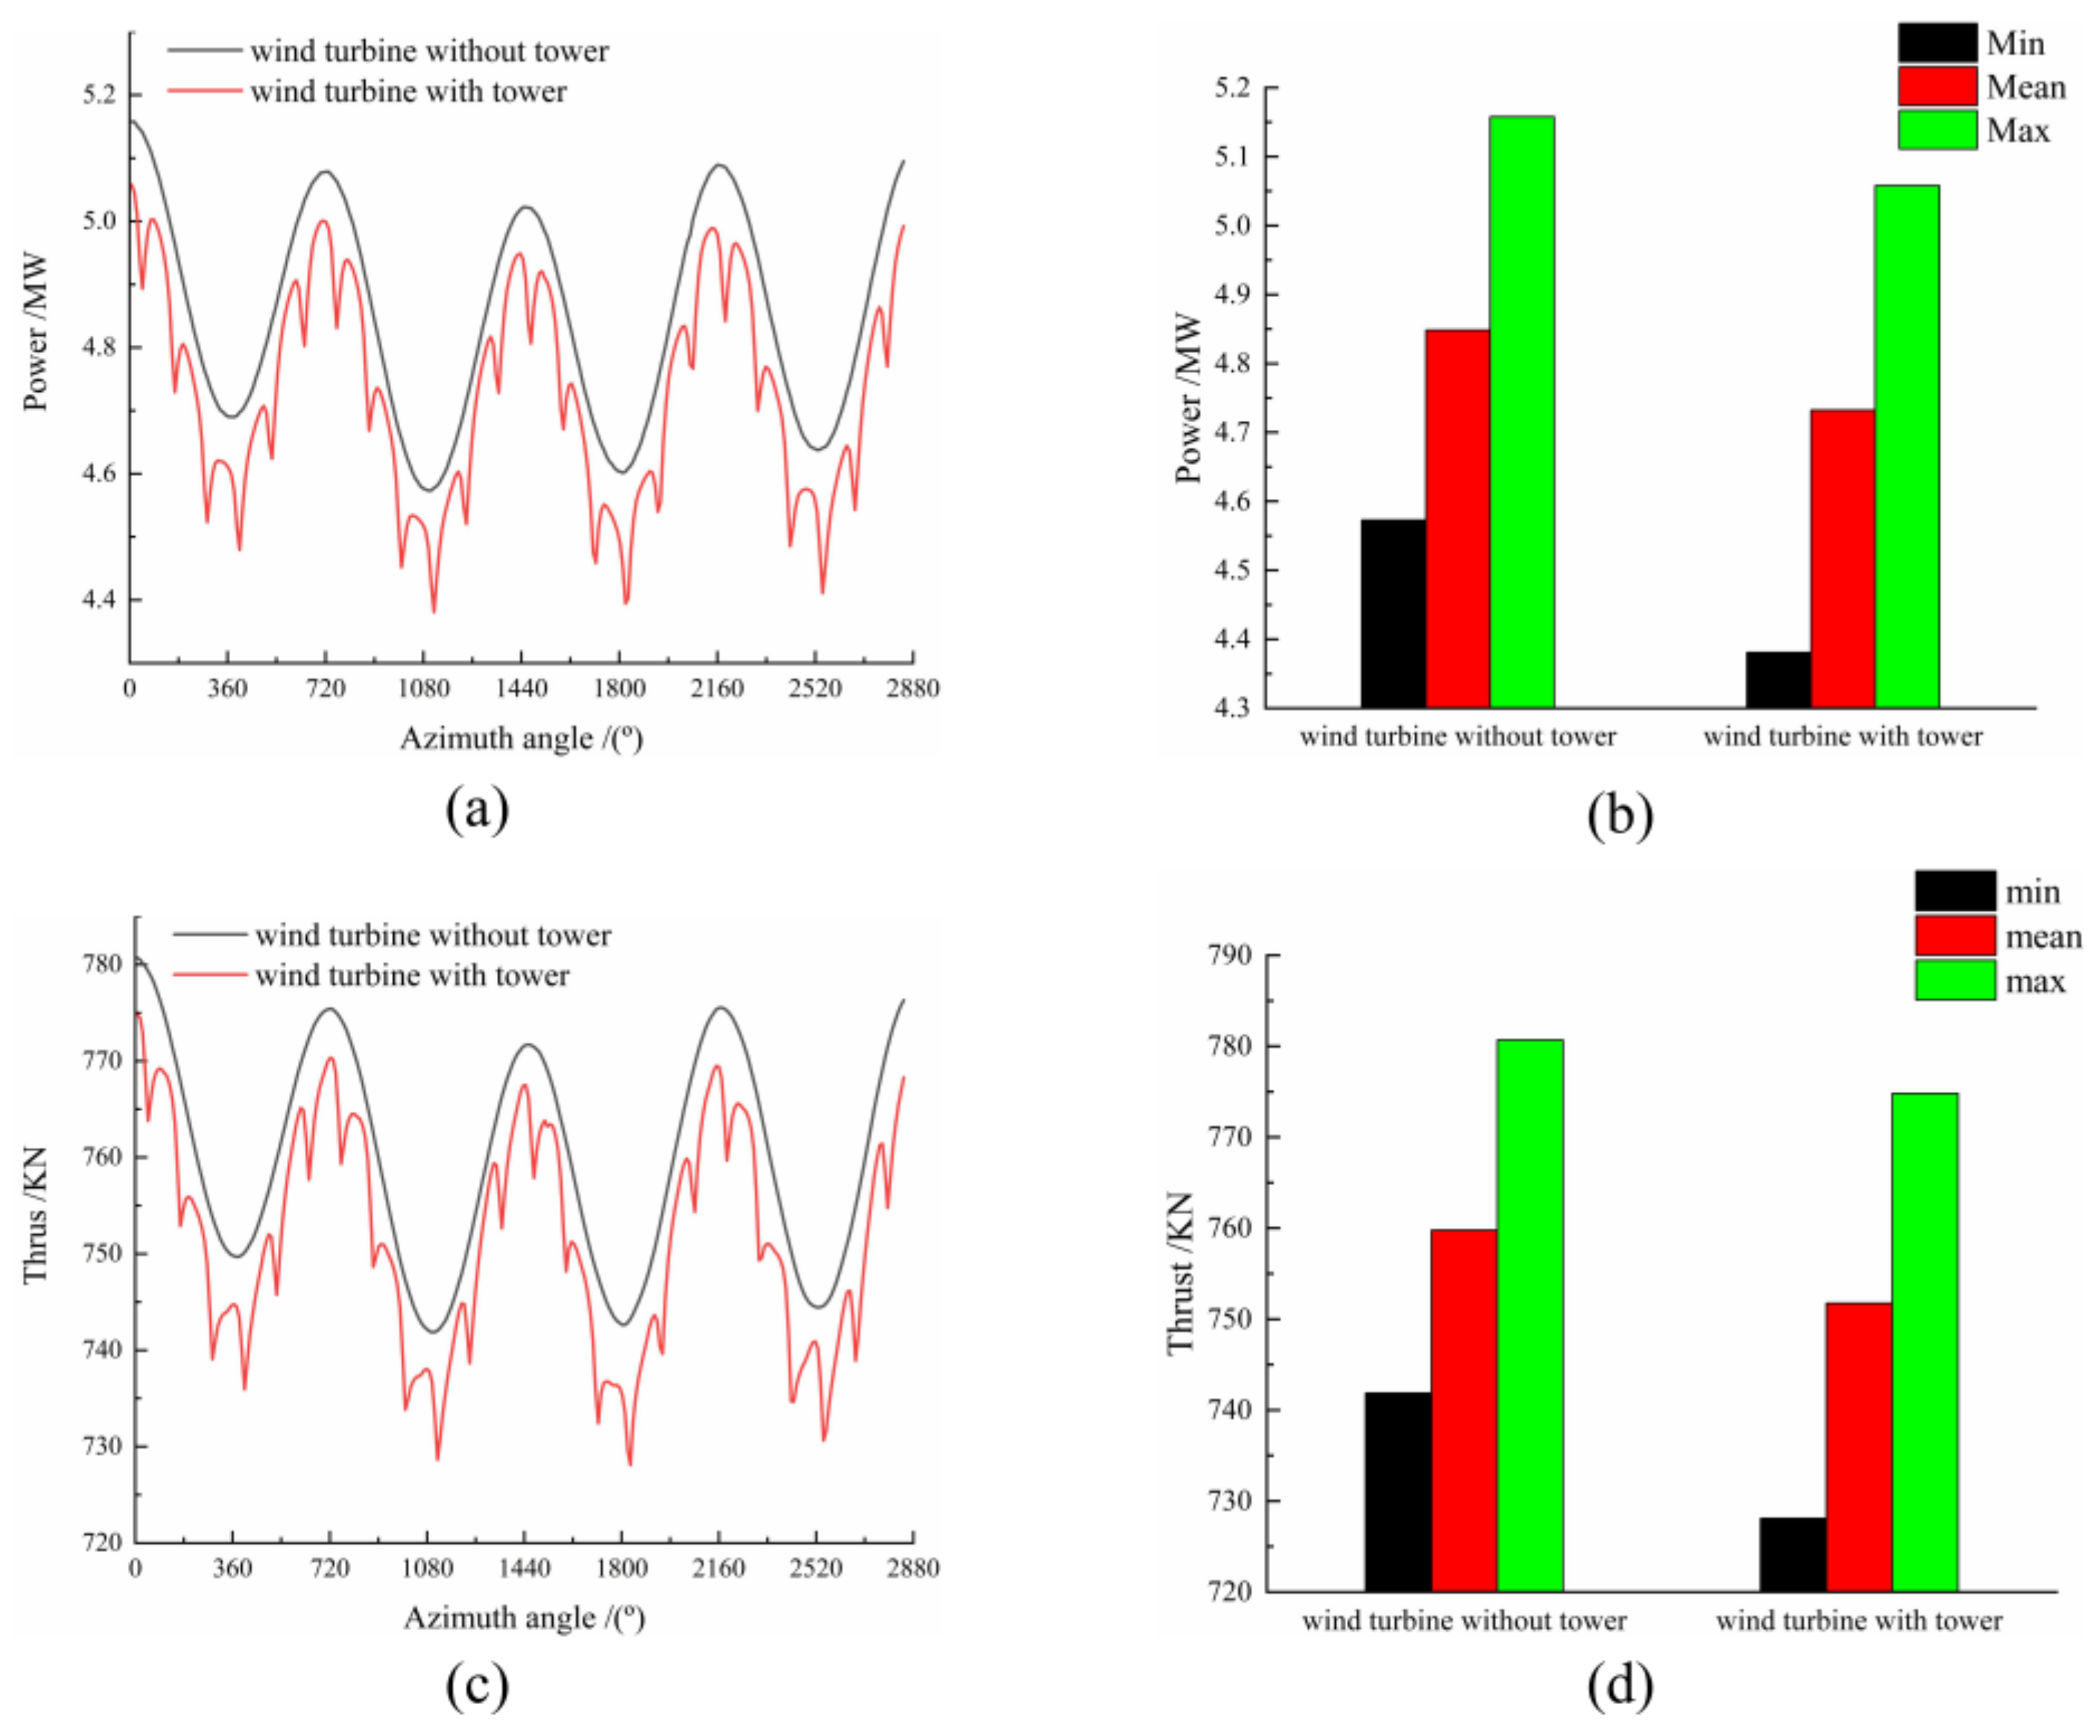
4.1.1. Total Performance Analysis

Figure 7 illustrates the total power and thrust comparison with and without the tower under surge motion. It can be observed that the fluctuation period of power and thrust is consistent with the harmonic surge. The equilibrium position divides the power and thrust curve into rising and falling parts, mainly because the power and thrust are proportional to the relative wind speed. For f = 0.05 Hz, As = 5 m, as shown in Figure 7b, the maximum power of the wind turbine without the tower is 6.98 MW, while the wind turbine with the tower is 6.85 MW. Both of these were larger than the rated power, while the existence of the tower reduced the maximum wind turbine power by 1.86%. The minimum power was 3.37 MW and 3.24 MW, respectively, and the power of the wind turbine with the tower was reduced by 3.86%. The average power generation was 5.12 MW and 5.01 MW, respectively; the latter was reduced by 2.15%. Further, the power fluctuated at a frequency thrice that of the rotation frequency under the combination of surge and tower shadow, while the surge motion played a leading role in the influence of power fluctuation. As shown in Figure 7c,d, the trend of the axial thrust fluctuation was similar to the power. The peak value of thrust without the tower was 888.3 KN; the wind turbine with the tower was 881.4 KN. Additionally, the valley value of thrust was 772.7 KN and 764.7 KN, respectively. It can be seen that the peak and valley values of thrust were basically the same with or without the tower. In addition, the average thrust was 772.7 KN and 764.7 KN, separately; the latter was reduced by 1.04%. It can be concluded that the influence of the tower shadow effect on thrust was less than that on power under the same condition of surge motion.
To further explore the variation mechanism of the aerodynamic load of the wind turbine under platform motion, the airfoil-induced velocity distribution under surge motion was analyzed, as shown in Figure 8. The surge motion of the platform produces an additional induced speed Vind to the wind turbine, which is obtained by superposing the surge speed with the free flow wind speed. When the platform moves forward, the Vind is opposite to the incoming wind speed, and the relative wind speed increases. When the platform moves backward, the Vind is in the same direction as the incoming wind speed, and the relative wind speed decreases. Vind can be decomposed into chord velocity Vc and radial velocity Vr on the rotating plane, the magnitude and direction of the relative velocity Vrel acting on the rotating plane of the airfoil changes and the angle of attack changes accordingly. This theoretically expounds the essence of the fluctuation of the aerodynamic performance of the wind turbine under surge motion.

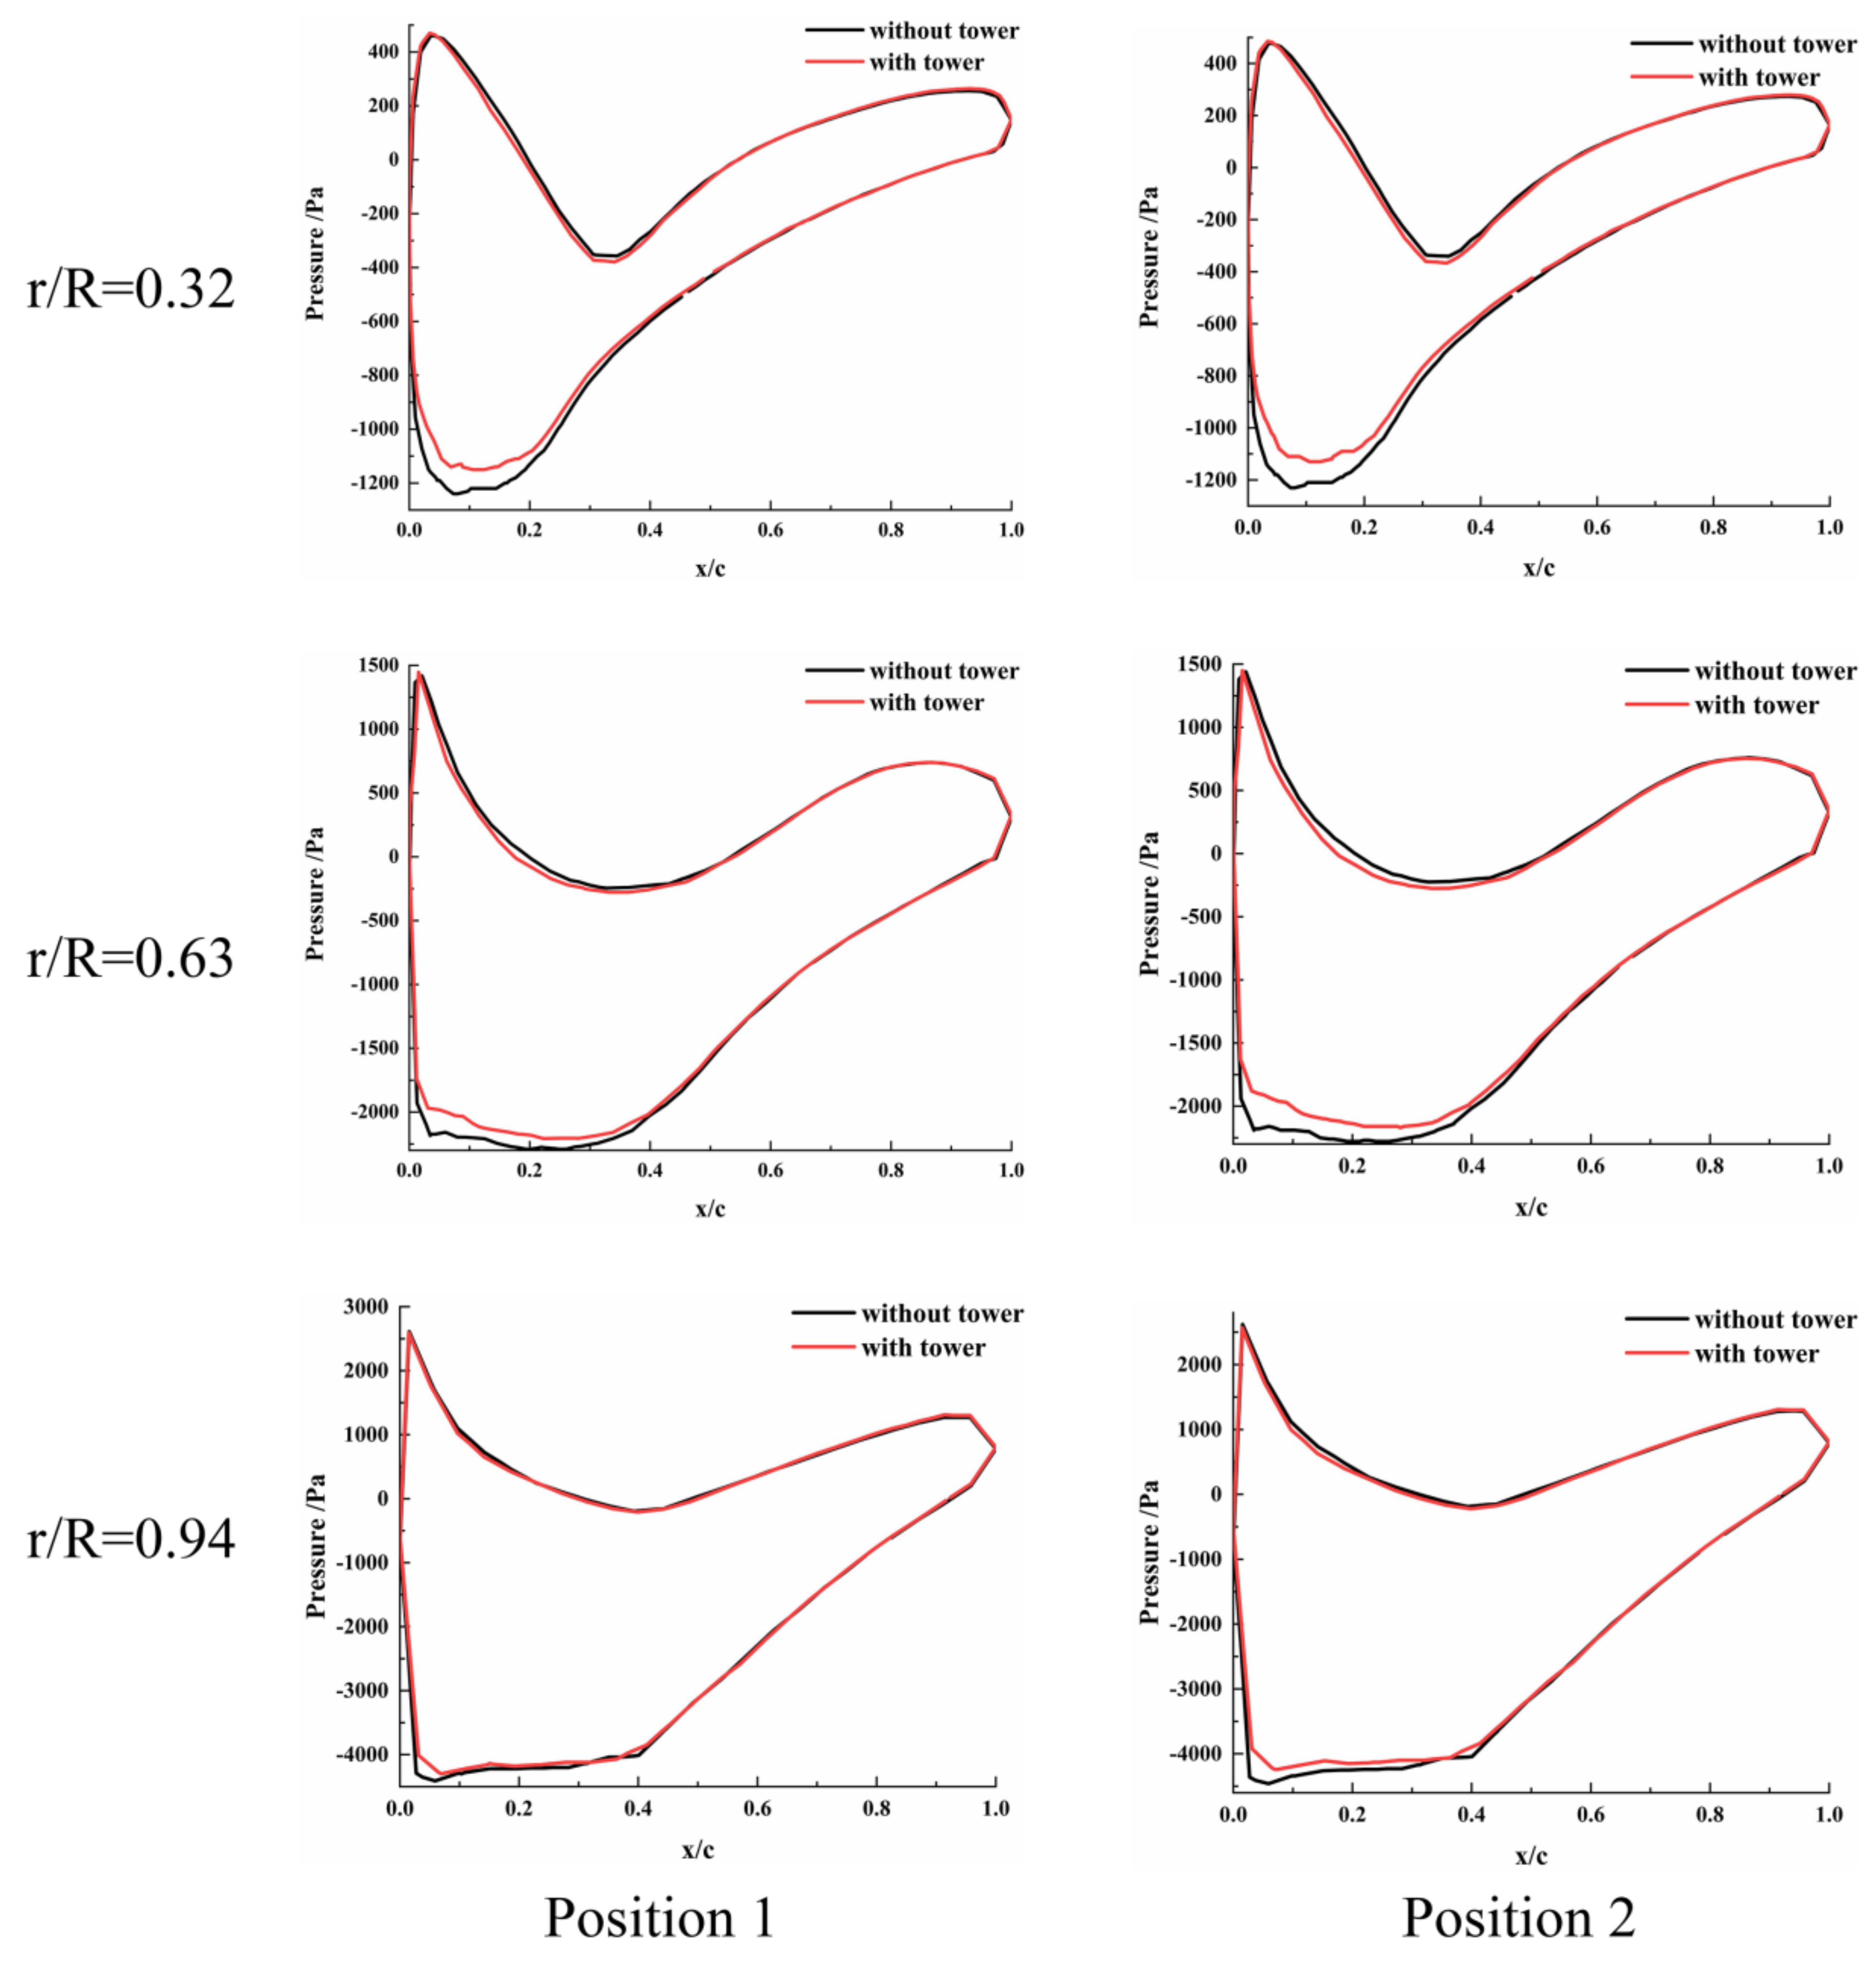
4.1.2. Distribution of Pressure on the Blade Surface

Figure 9 shows the surge amplitude of the platform motion with reference to time. The second period of stable surge motion of the wind turbine is selected as the research object. Two typical positions were selected to analyze the pressure distribution on the blade surface.
The most fundamental influence of the tower shadow effect on the aerodynamic performance of the wind turbine is the interference of the tower on the blade; the blade surface pressure is the basic parameter to characterize the aerodynamic performance of the blade. This section selects two typical positions in which the blade rotates to the front of the tower under surge motion, and analyzes the pressure distribution under the root (r/R = 0.32), middle (r/R = 0.63) and tip (r/R = 0.94) sections of the blade. The abscissa is dimensionless as x/c (the abscissas of different points on the section/chord length of the section).
Figure 10 shows the distribution of pressure in each section of the blade with and without the tower at two typical positions in a surge cycle. It can be found that the pressure difference distribution at position 1 at the corresponding section is greater than that at position 2. It can be explained that the Vrel at each blade section reaches larger values due to the forward surge velocity of the platform, while the Vrel decreases when the platform surges backward. From the numerical point of view, the maximum pressure difference of the wind turbine without the tower at 0.32 R, 0.63 R, 0.94 R section is 1952 Pa, 4240 Pa and 7910 Pa, respectively. It can be seen that the closer to the tip of the blade, the greater the pressure difference on the blade surface. In addition, the tower shadow effect mainly affects the negative pressure value of the suction leading edge and the absolute value of the maximum negative pressure difference in each section is reduced by 10.56%, 7.61% and 5.36%, respectively. It can be inferred that the closer to the tip of the blade, the less obvious the interference of the tower shadow effect on the negative pressure of the suction surface.

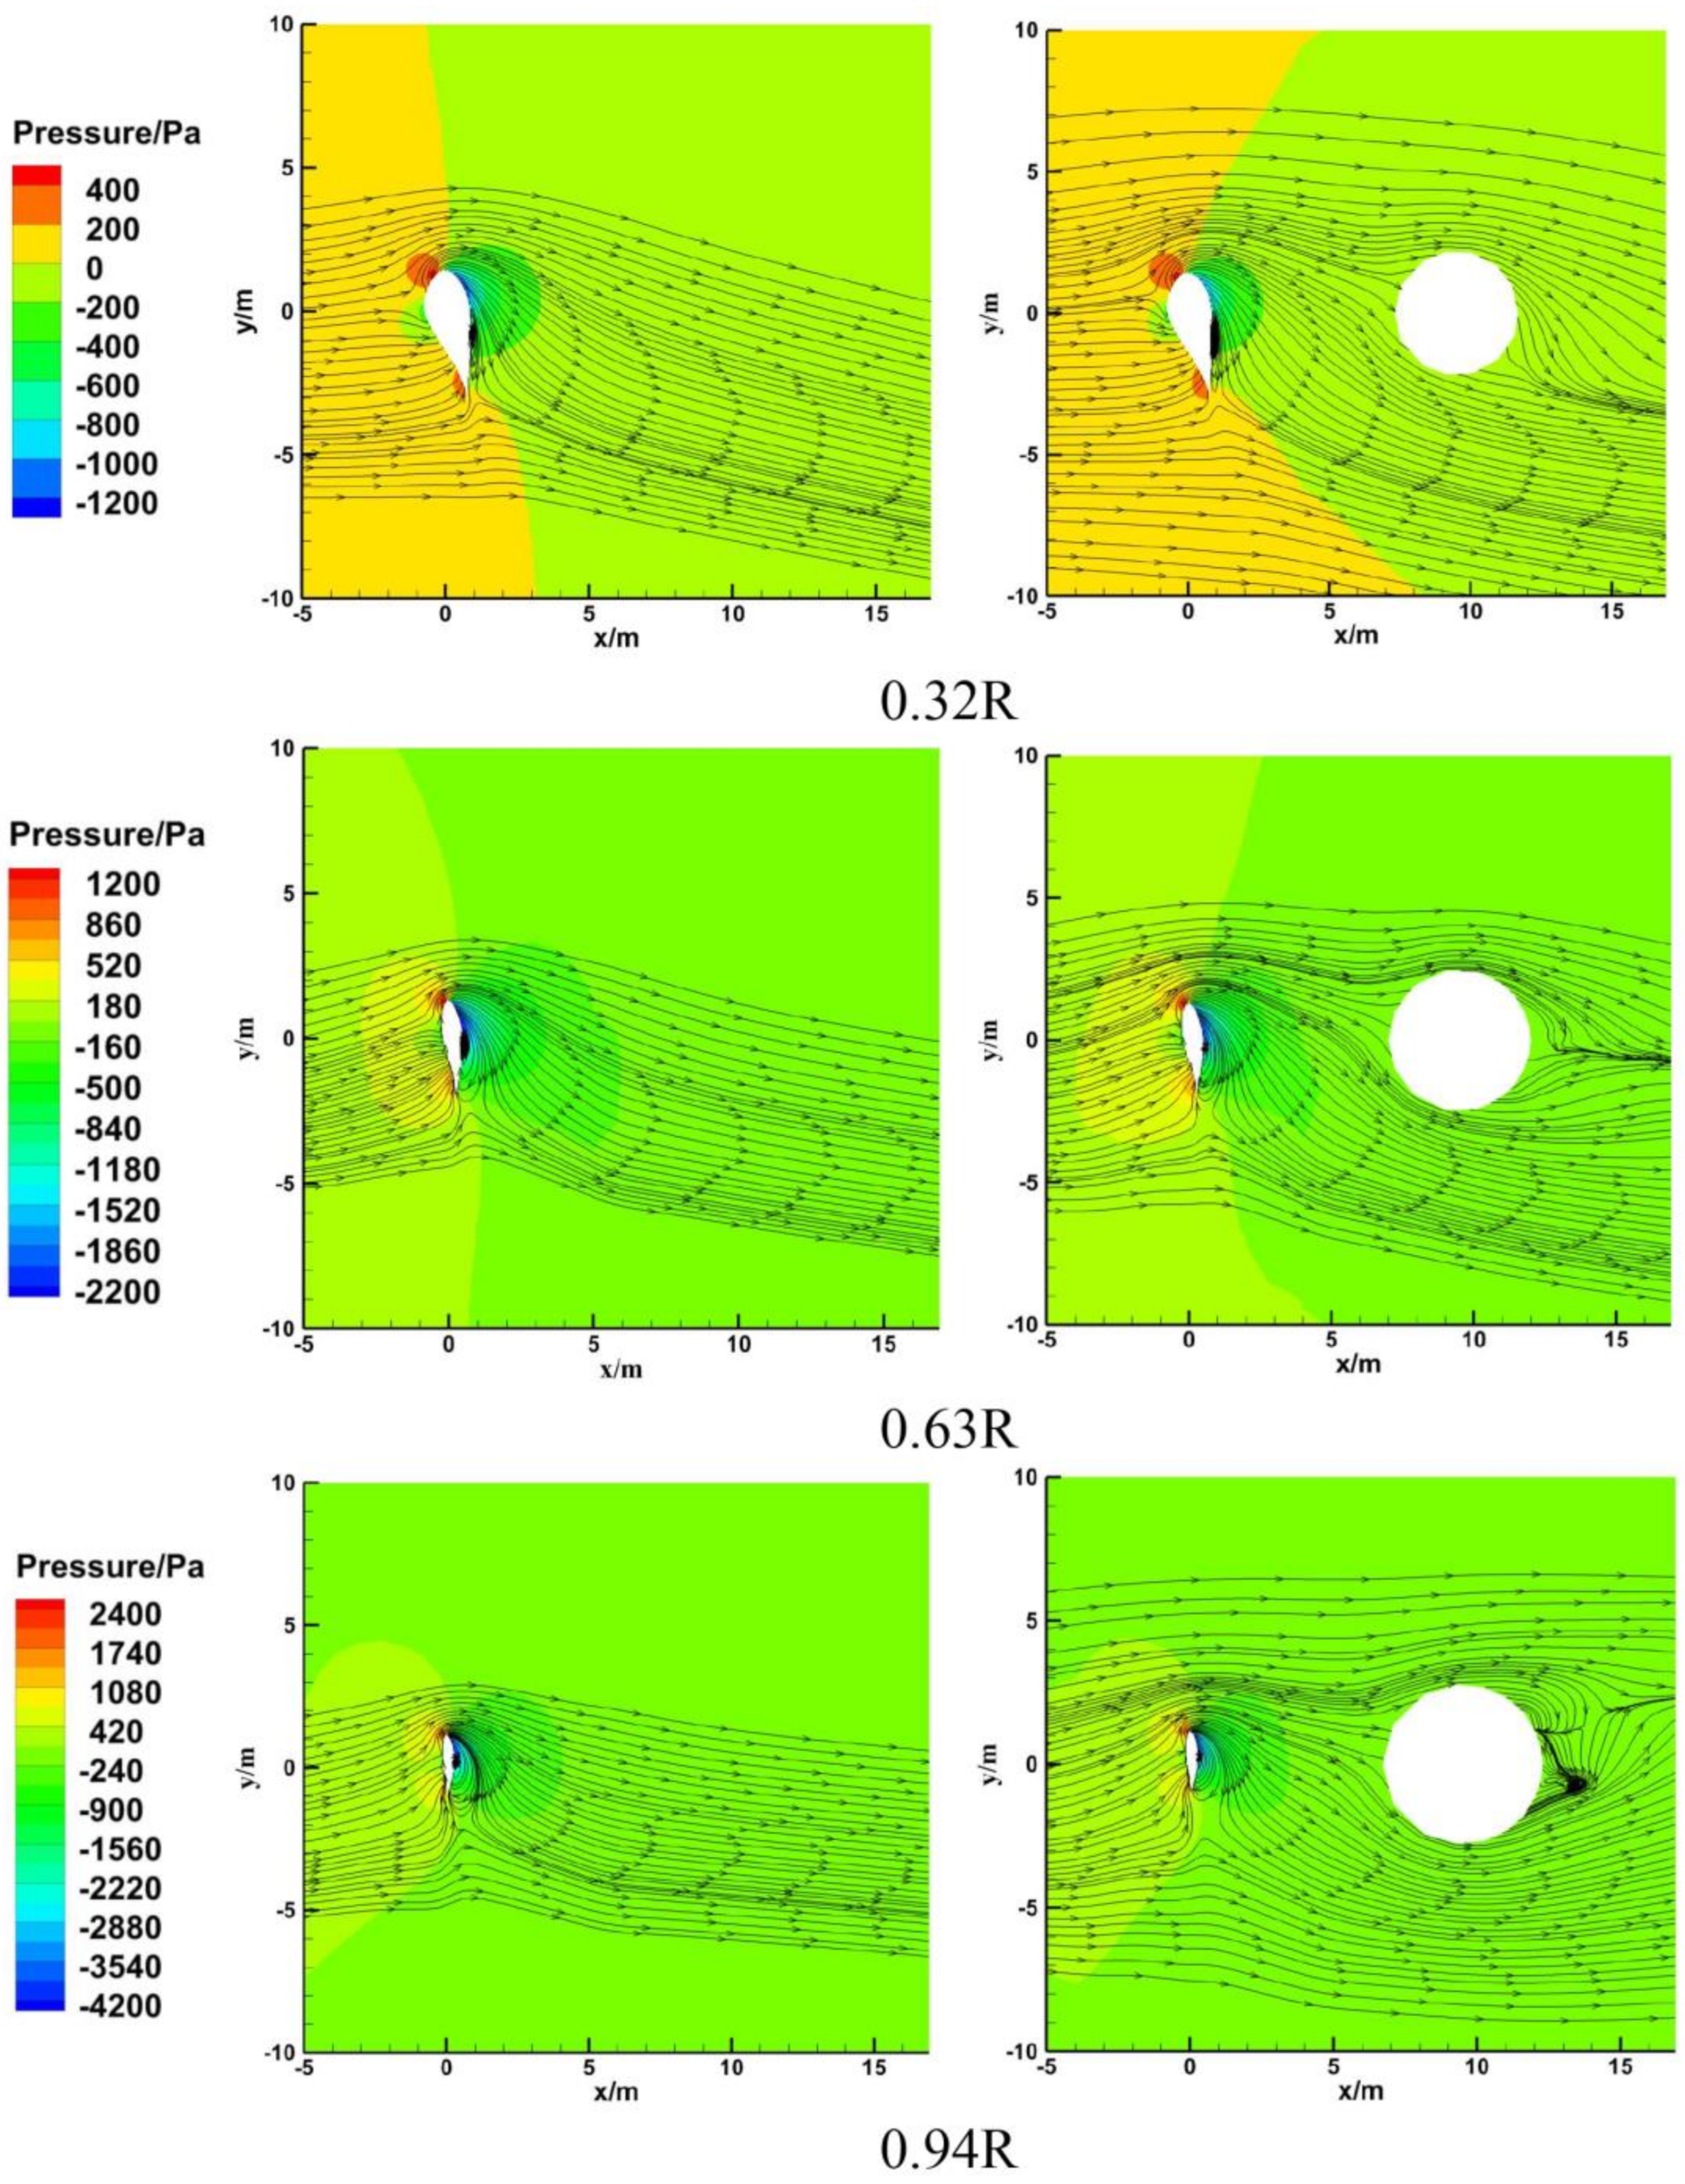
4.1.3. Near Flow Field of Each Section of Blade

Figure 11 shows the interaction between the different blade sections and the tower when the blade rotates to the shadow area of the tower under surge motion. Position 1 was selected for further analysis. For the convenience of analysis, the variation of pressure fields near the blade surface and the distribution of absolute velocity streamline are discussed, respectively.
By comparing the pressure field of the wind turbine with and without the tower at the same cross-section, it is seen that there is an obvious negative pressure field behind the suction surface of the blades. On the root and middle section of the blade, it can be observed that the suction leading edge negative pressure field of the wind turbine without the tower is larger and the negative pressure value is lower, while the pressure surface is basically the same, and the interference of the tower on the pressure field in the tip section is relatively small. These phenomena are in good agreement with the blade surface pressure distribution results described in the previous section. In addition, the whole negative pressure field at the root and middle section of the blade is obviously compressed due to the interference of the tower, which leads to a decrease in the pressure difference between the pressure surface and suction surface of the blade, thus reducing the overall work capacity of the blade. This further explains that the average power of the wind turbine decreases due to the influence of the tower shadow effect in the above results.
Meanwhile, the streamline change of the wind turbine with the tower is not obvious compared with the wind turbine without the tower under surge motion, and the main change is concentrated in the wake of the tower. In the 0.32 R section, the streamline behind the tower shifts greatly, and the tower shadow effect is the most obvious in the interference of the flow field. In the 0.63 R section, the streamline on both sides of the tower shifts, and the flow field in this section is affected by both the tower shadow effect and the enhanced blade rotation effect. In the 0.94 R section, there is an obvious stall separation in the flow field behind the tower, and the separation point shifts to the direction of blade rotation. The area near the root of the blade is the main area affected by the tower shadow effect under surge motion, and the effect of the tower shadow effect weakens on the near wake flow field with the increase of blade height.

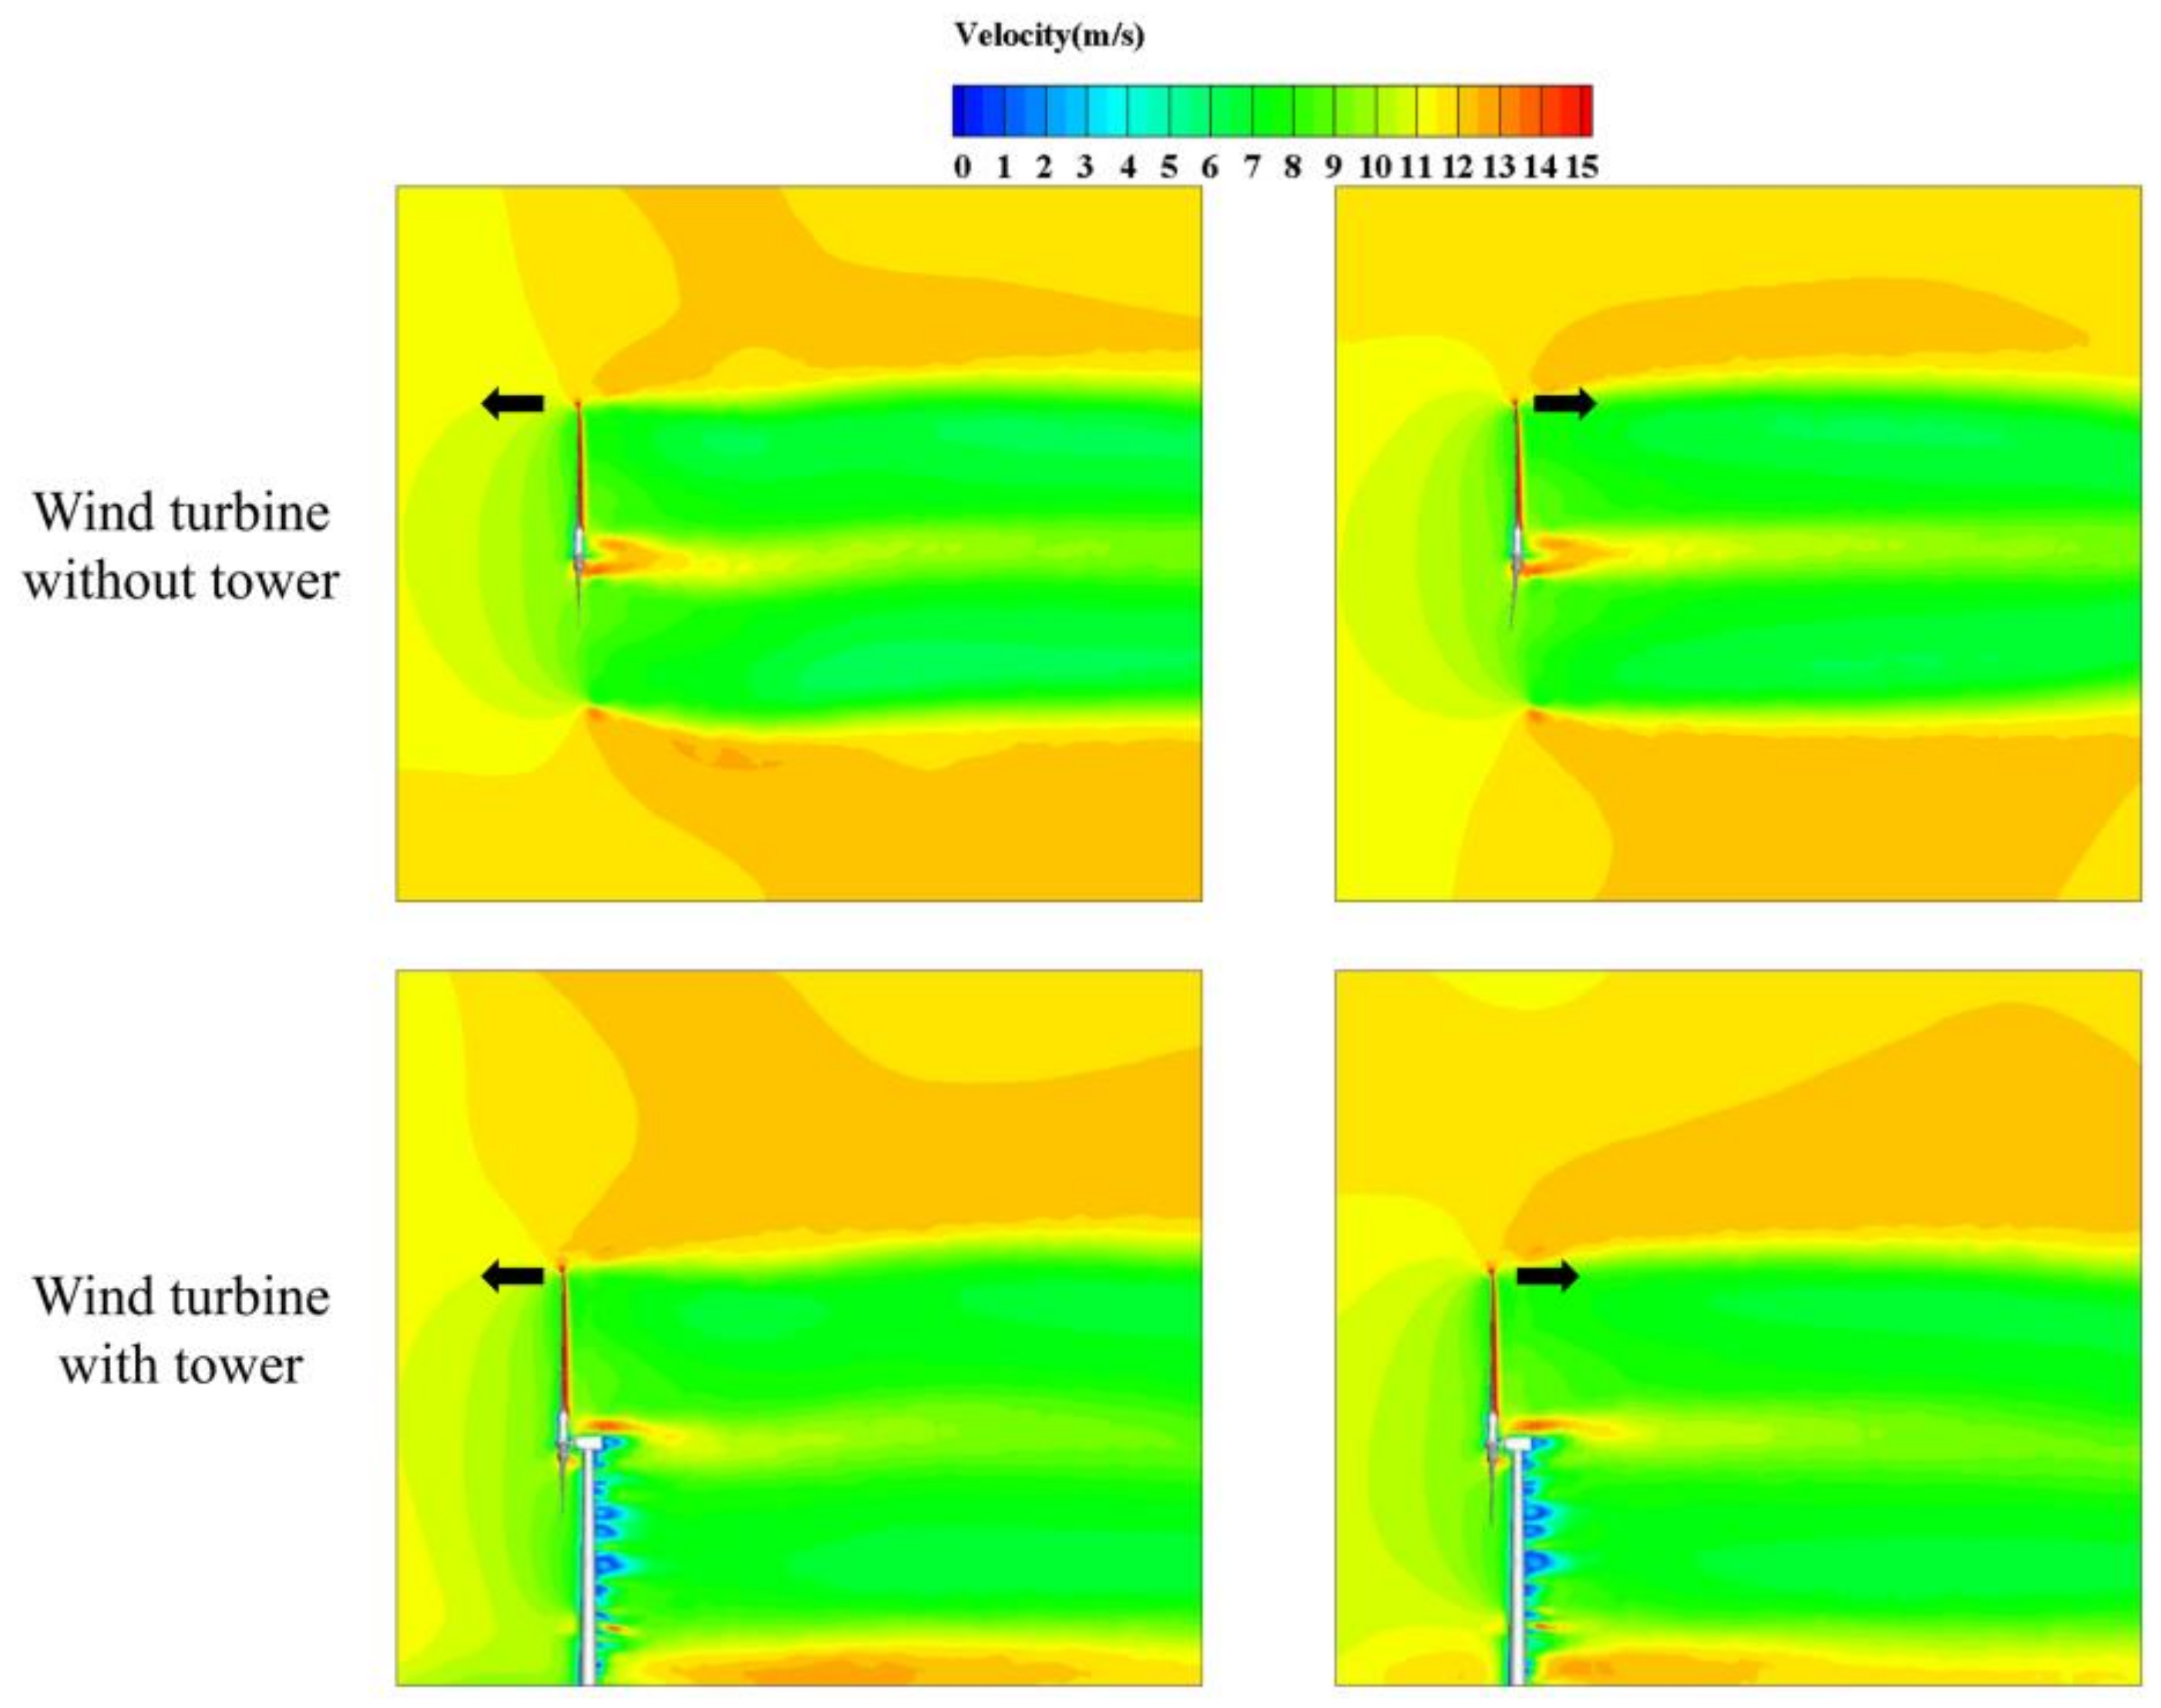
4.1.4. Wake Field behind the Wind Turbine

The main load source of the wind turbine is axial flow; the wake flow characteristics are particularly important for the analysis of wind turbine aerodynamics. By comparing the wake field with or without the tower, this section further illustrates the influence of platform motion on the aerodynamics of the wind turbine.
Figure 12 shows the velocity distribution of the wake field under platform surge motion. The symmetry of the wake field is disturbed and the flow field is slightly compressed. When the wind turbine moves forward, the average velocity of the wake field is greater than that of the backward motion. Considering the effect of the tower shadow, the influence range of the high-speed wake behind the hub expands, but it has little influence on the tip vortex, and the rear of the tower is accompanied by a large vortex shedding range and obvious vortex motion.

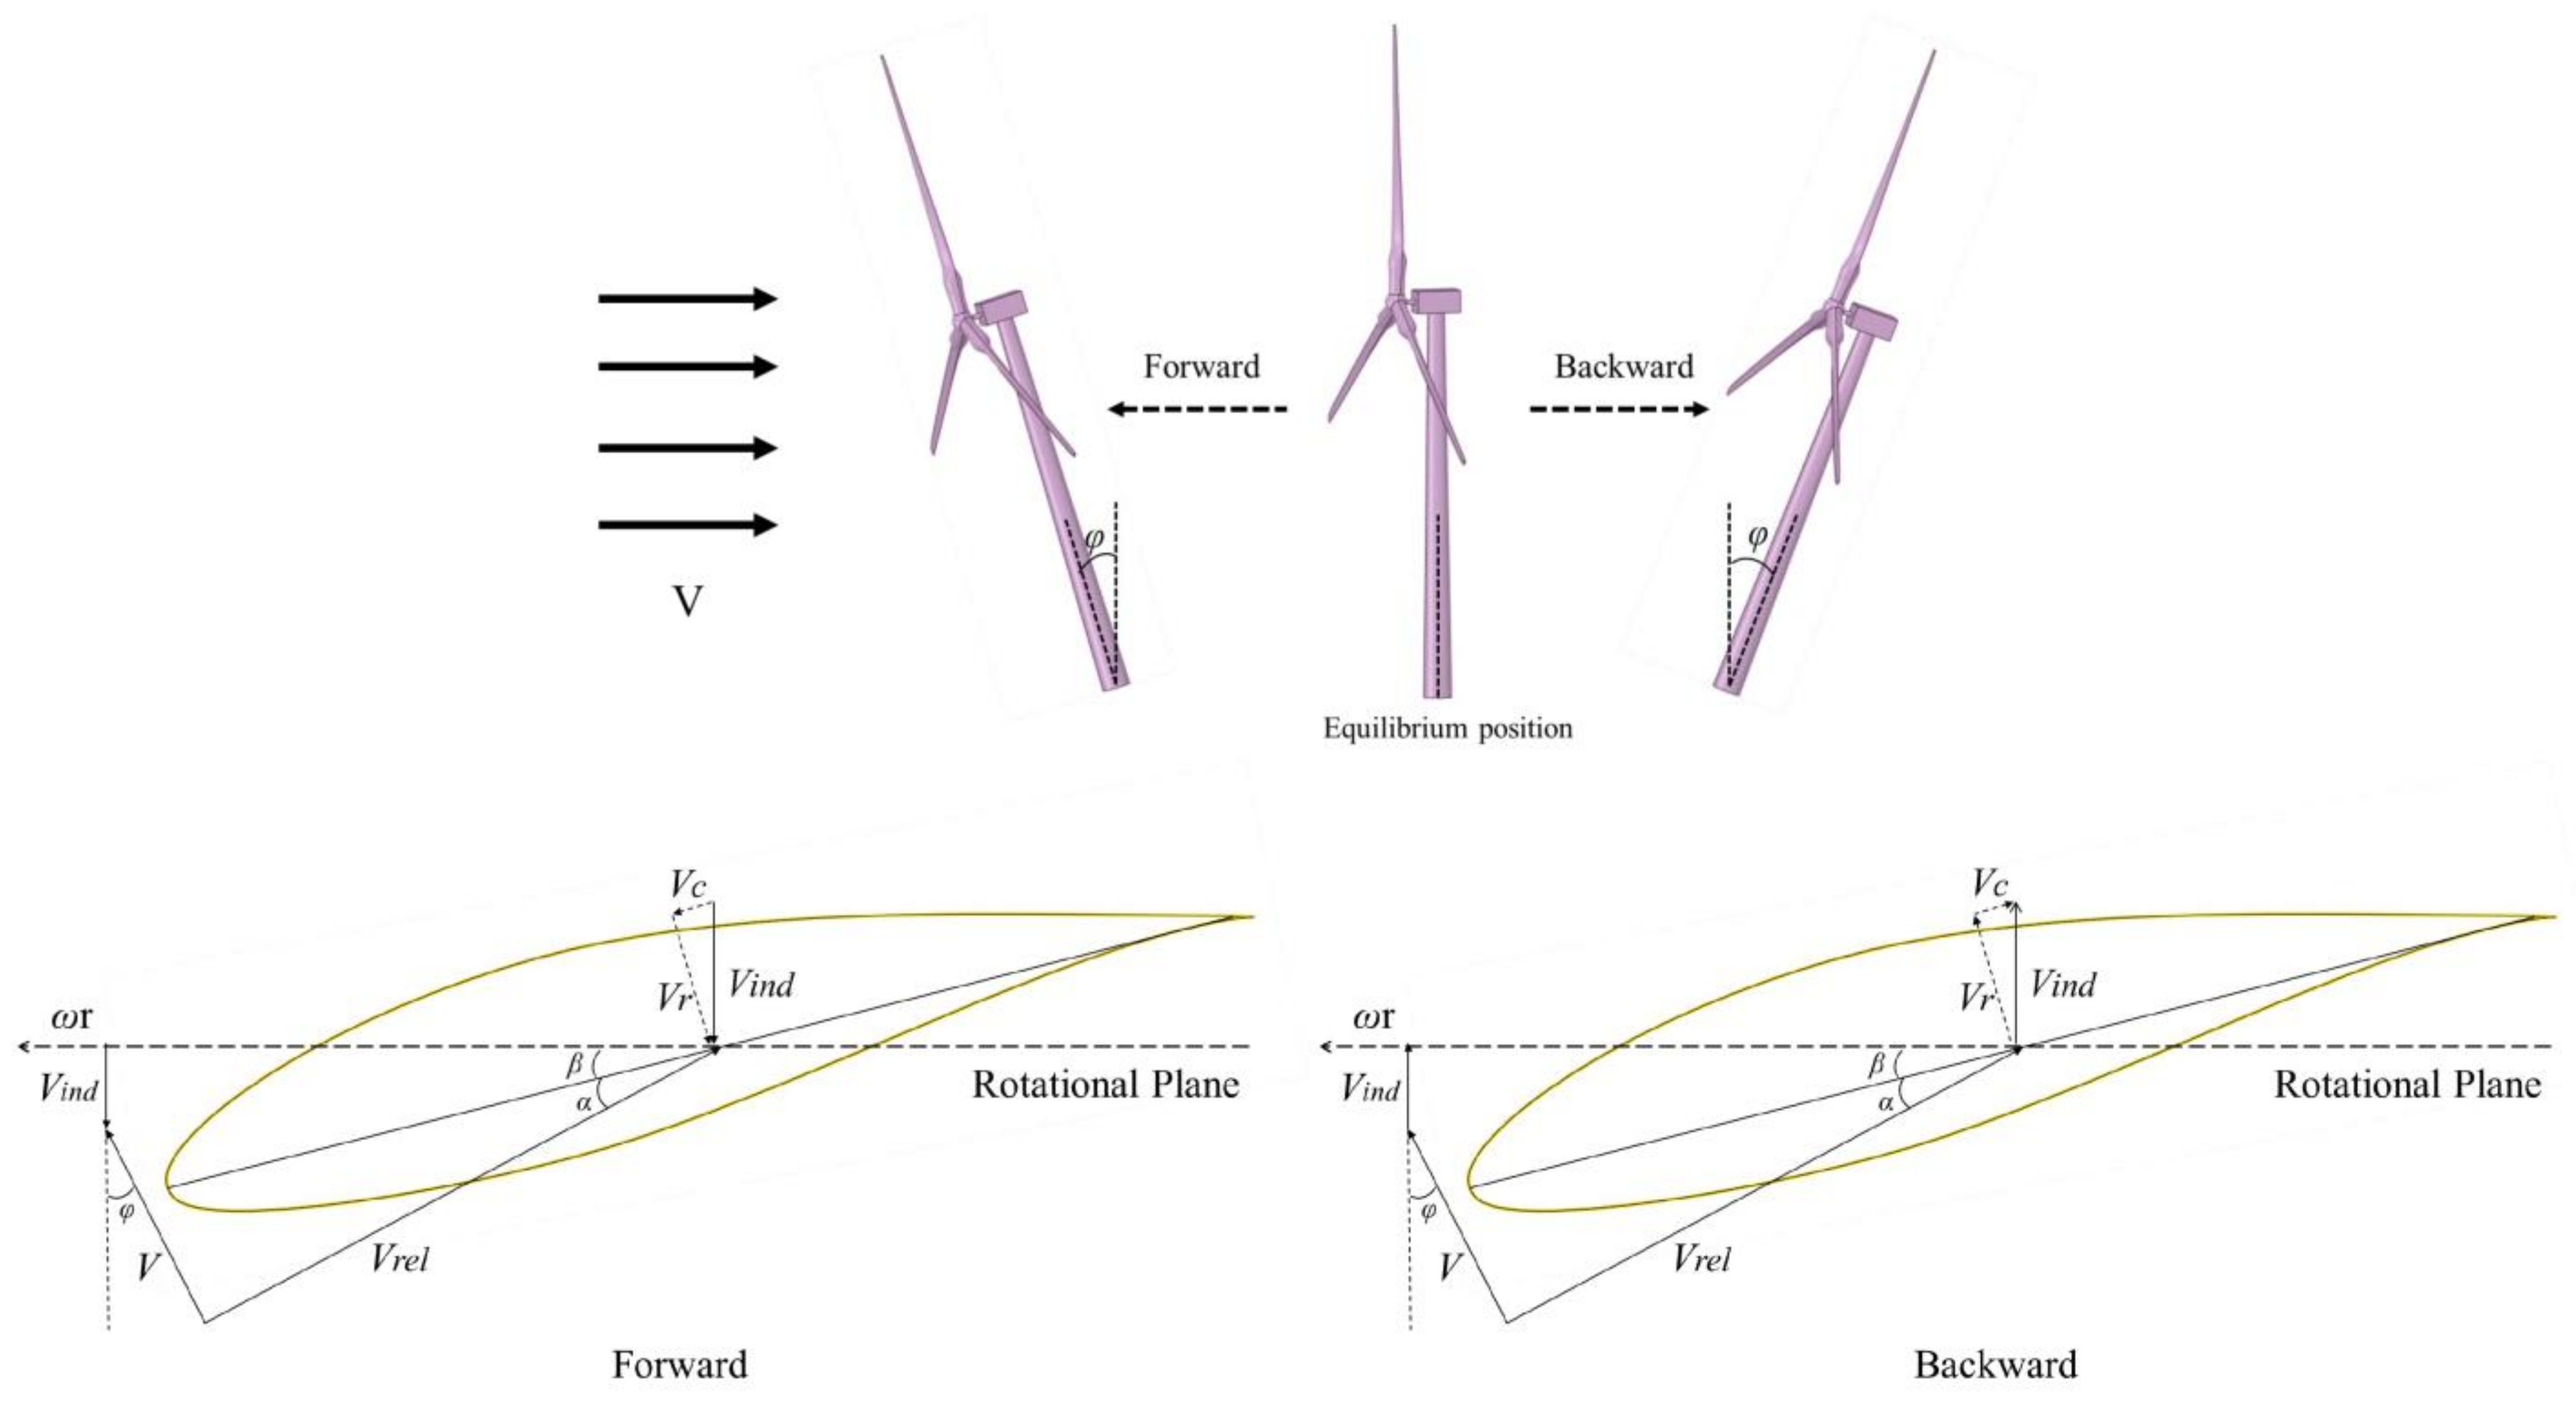
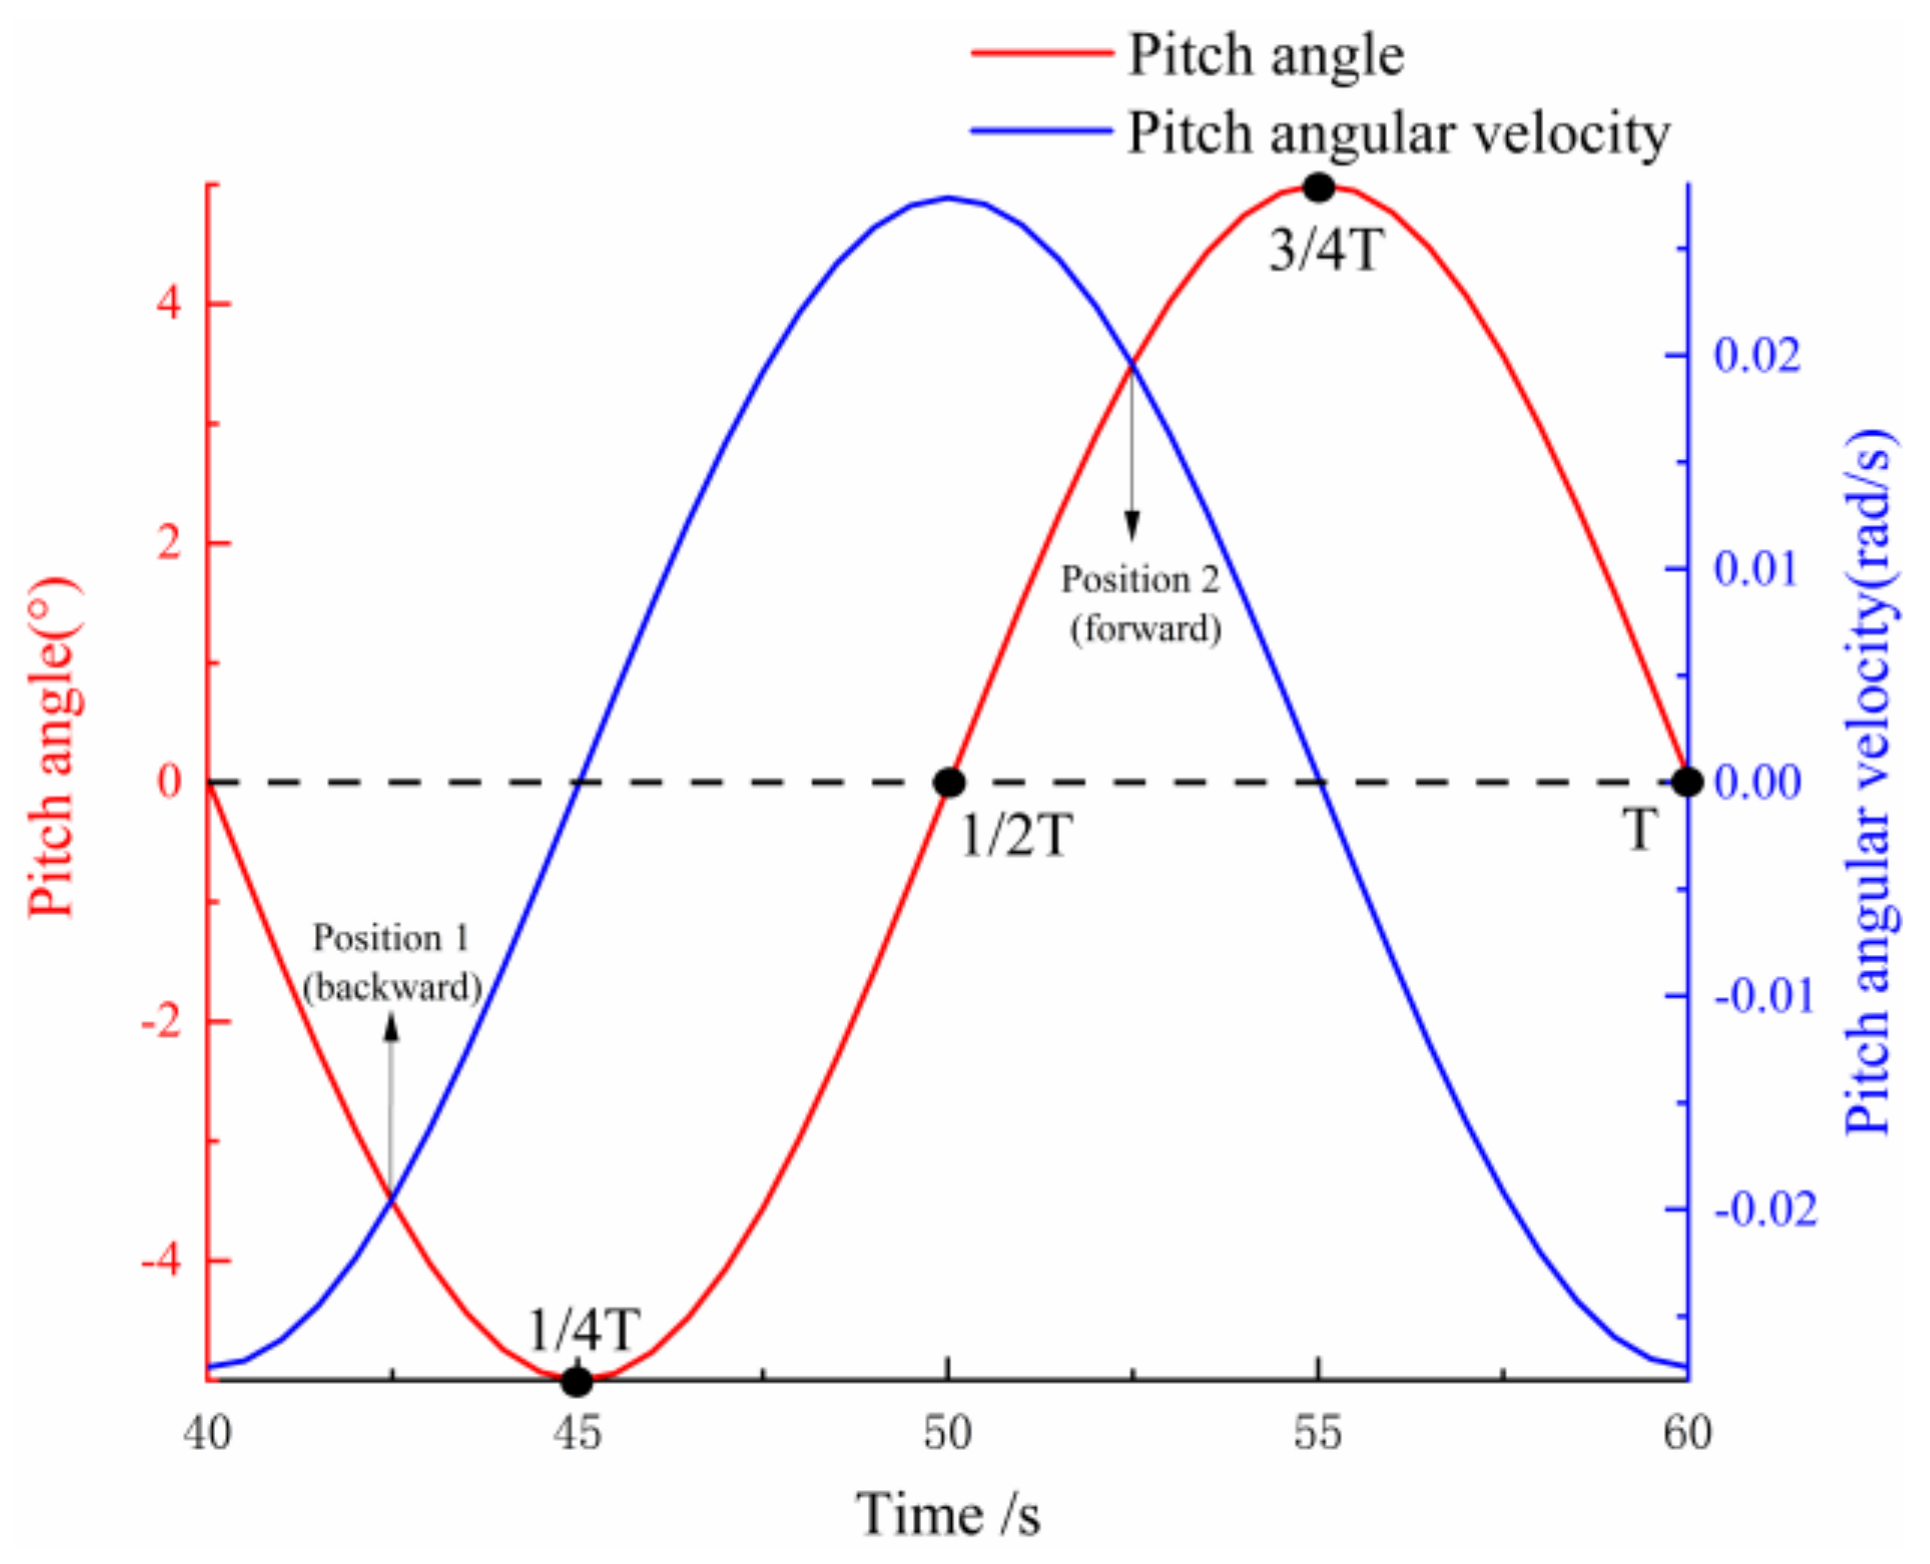
4.2. Unsteady Aerodynamic Analysis under Pitch Motion

4.2.1. Total Performance Analysis

Figure 13 shows the overall power and thrust variation of the wind turbine with and without the tower. The pitch amplitude corresponds to the fluctuation of power and thrust values. For f = 0.05 Hz, Ap = 5°, as shown in Figure 13a, the power of the wind turbine fluctuates violently due to the existence of the tower, and it decreases sharply three times in one rotation cycle of the wind turbine. As shown in Figure 13b, the maximum power of the wind turbine without the tower was 5.16 MW, while the wind turbine with the tower was 5.11 MW. The minimum power of the former was 5.01 MW, while that of the latter s 4.70 MW. It can be seen that pitch motion slightly increases the peak and valley values of power, but the extreme value of the wind turbine decreases due to the existence of the tower. The average power generation was 5.06 MW and 4.98 MW, respectively; the latter was reduced by 1.58%. It can be found that the pitch motion of the platform increases the power of the wind turbine, but under the combination of pitch and tower shadow effect, the power fluctuation is larger and the increase is smaller. As shown in Figure 13c,d, the fluctuation trend of axial thrust is similar to that of power. The peak thrust and valley thrust of the wind turbine without the tower are 780.7 KN and 771.6 KN, and those with the tower are 777.9 KN and 751.1 KN, respectively. The average thrust was 774.5 KN and 769.0 KN, separately; the latter was reduced by 0.71%. That is, in terms of numerical values, the tower shadow effect slightly reduces the average power, while the average thrust is almost unchanged under pitch motion.
Figure 14 shows the induced velocity distribution of airfoil under pitch motion. The pitch motion of the platform changes the angle between the incoming wind speed and the rotating plane of the wind turbine and produces an additional induced velocity Vind. Vind can be decomposed into chord velocity Vc and radial velocity Vr on the rotating plane, in which the direction of chord velocity component Vc depends on the positive or negative angle of pitch motion, which changes the relative velocity and direction of the rotating plane of the airfoil, and the angle of attack changes correspondingly. It leads to the fluctuation of the overall aerodynamic performance of the wind turbine under pitch motion.

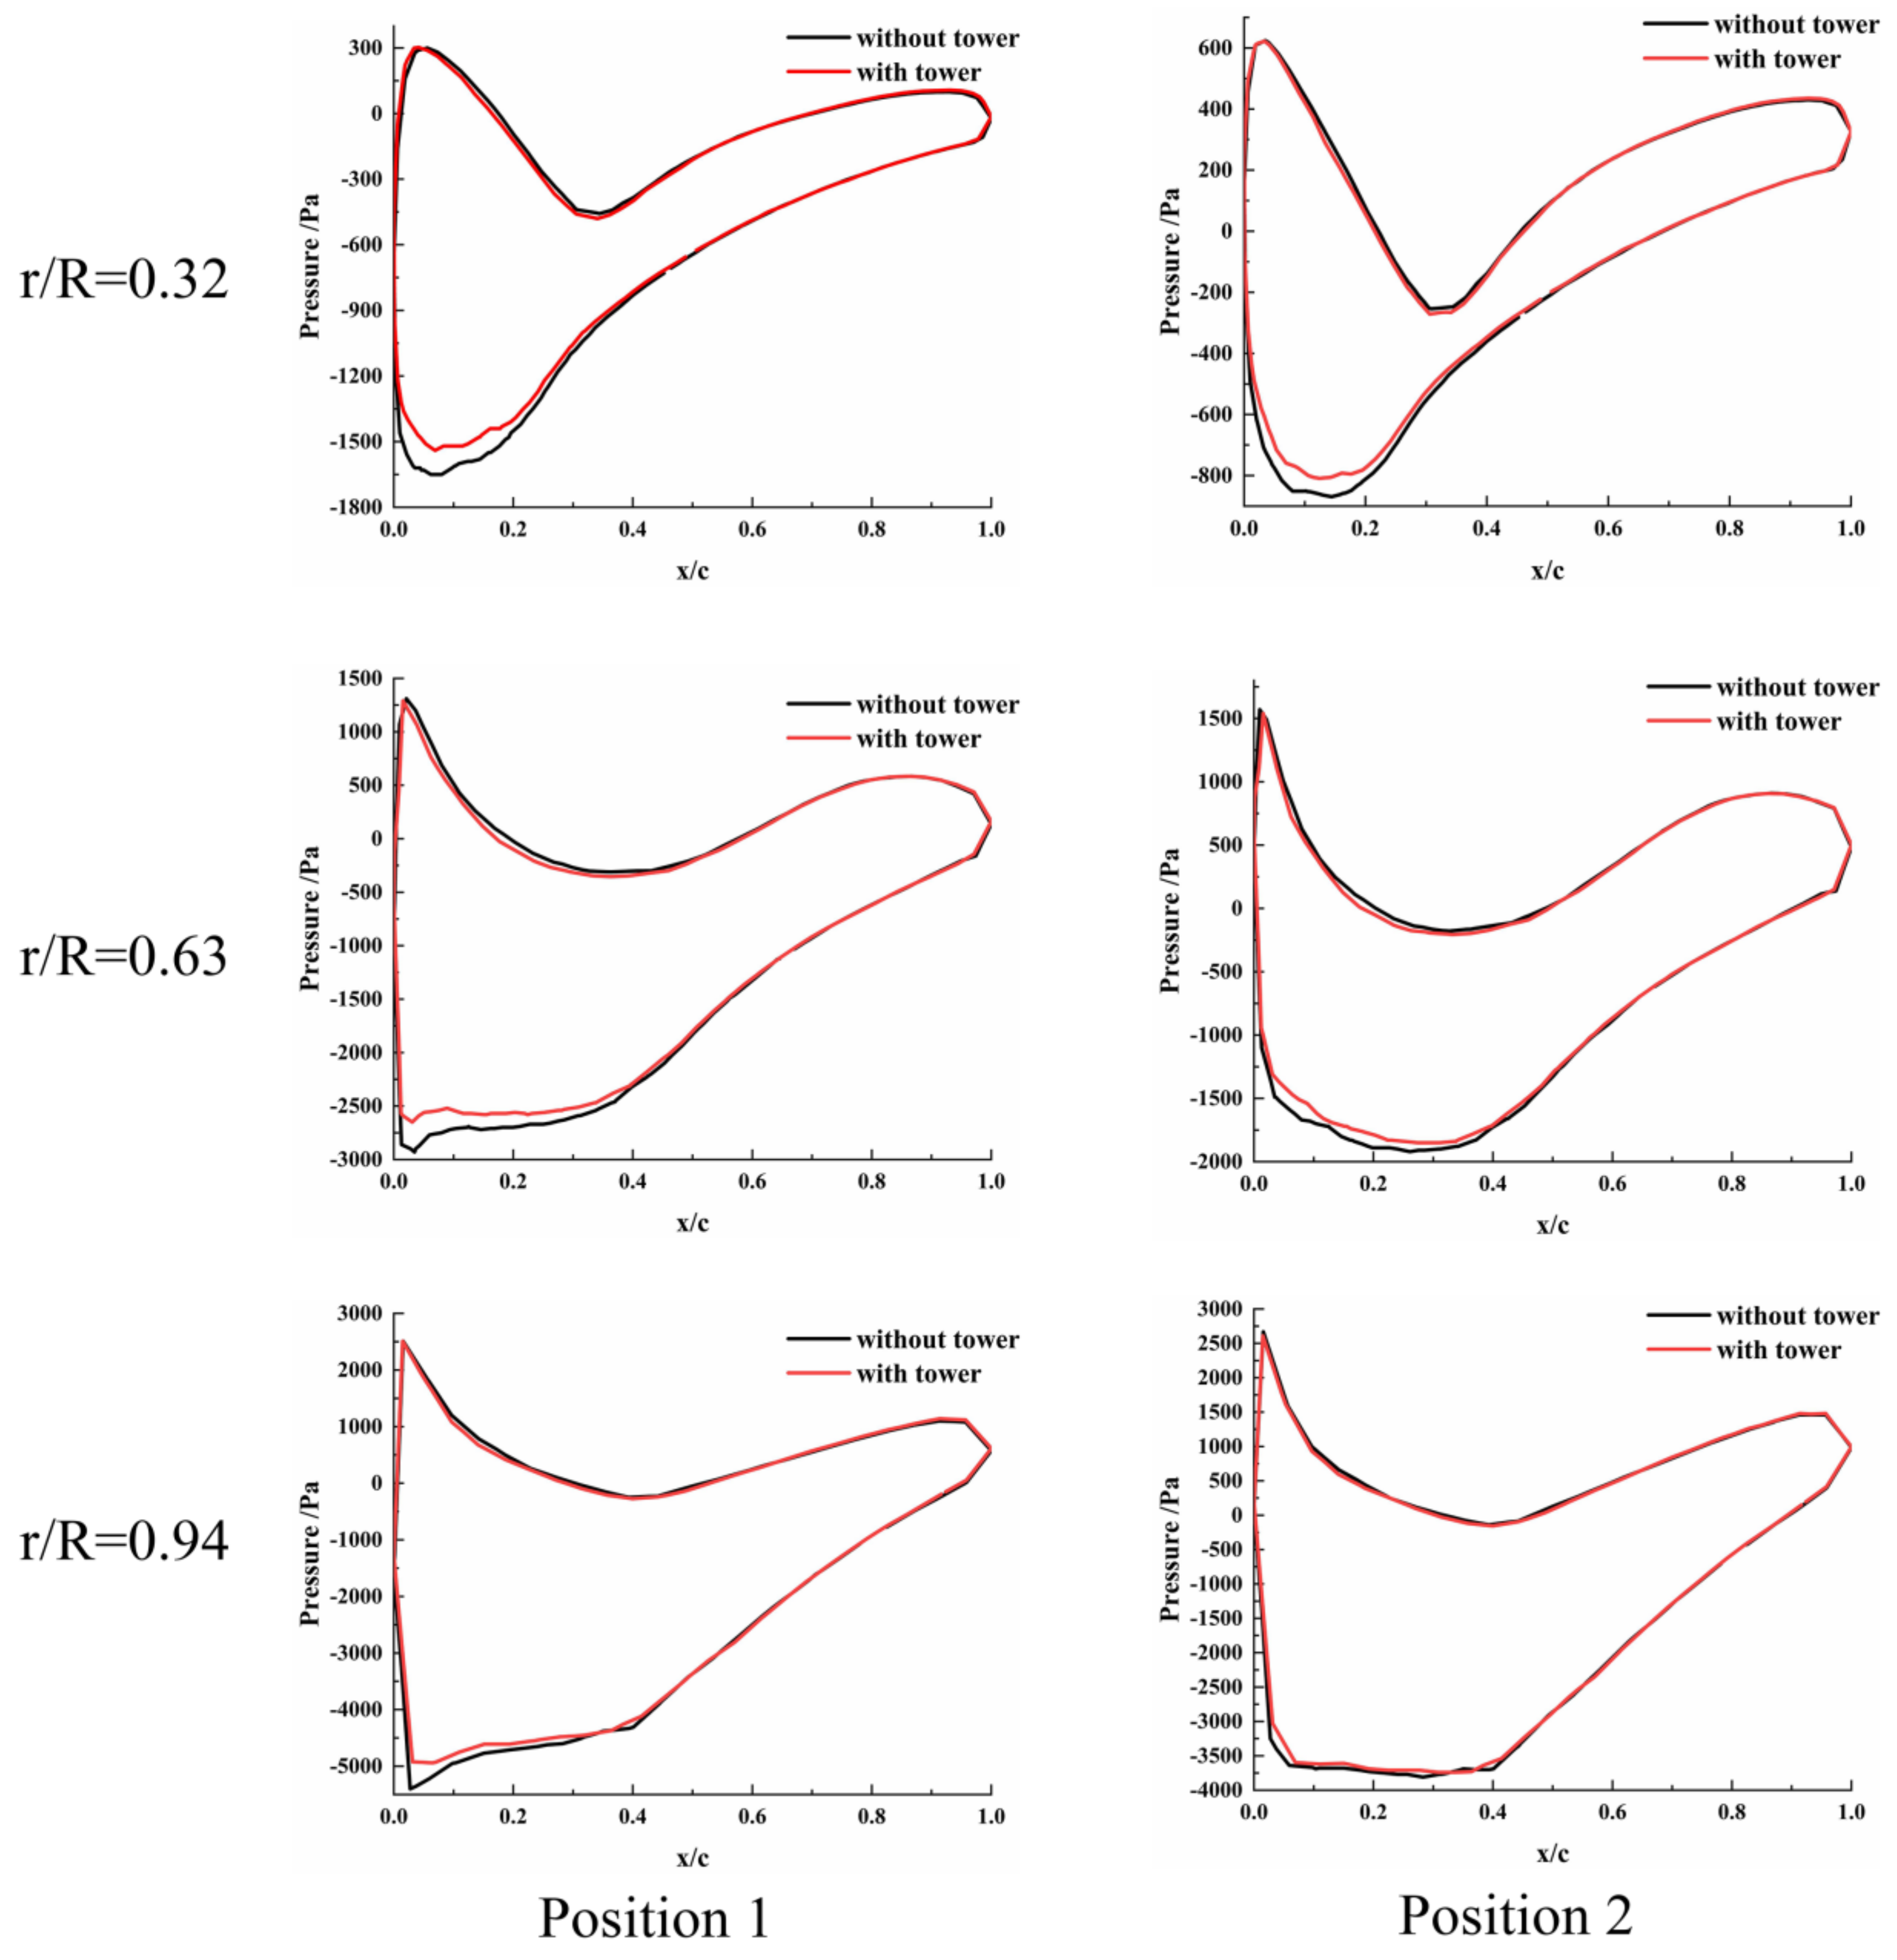
4.2.2. Distribution of Pressure on the Blade Surface

Figure 15 shows the pitch amplitude and angular velocity of the platform motion with reference to simulation time. The second period of stable pitch motion of the wind turbine was selected as the research object, and the two typical positions of the wind turbine moving forward and backward to the front of the tower were selected for further analysis.
Figure 16 shows the pressure distribution in each section of the blade with and without the tower at two typical positions in a pitch cycle. In terms of numerical values, the maximum pressure difference of the wind turbine without the tower at 0.32 R, 0.63 R and 0.94 R sections is 1711 Pa, 3630 Pa and 7030 Pa, respectively. It can be found that the pressure difference of each section of the blade under pitch motion is smaller than that of surge motion. Comparing the pressure difference distributions of different sections at two typical positions, it can be seen that the pressure difference distributions on the pressure surface and the suction surface are basically the same. The change of the pressure difference is not obvious under pitch motion. Besides, affected by the tower shadow effect, the absolute value of the maximum negative pressure difference at the leading edge of suction in each section of the blade decreases by 9.02%, 7.31% and 4.93%, respectively. Compared with surge motion, it can be seen that under pitch motion, the interference of the tower shadow effect on each section of the blade is also mainly concentrated in the root and tip of the blade, but the degree of interference is less than that of surge motion.

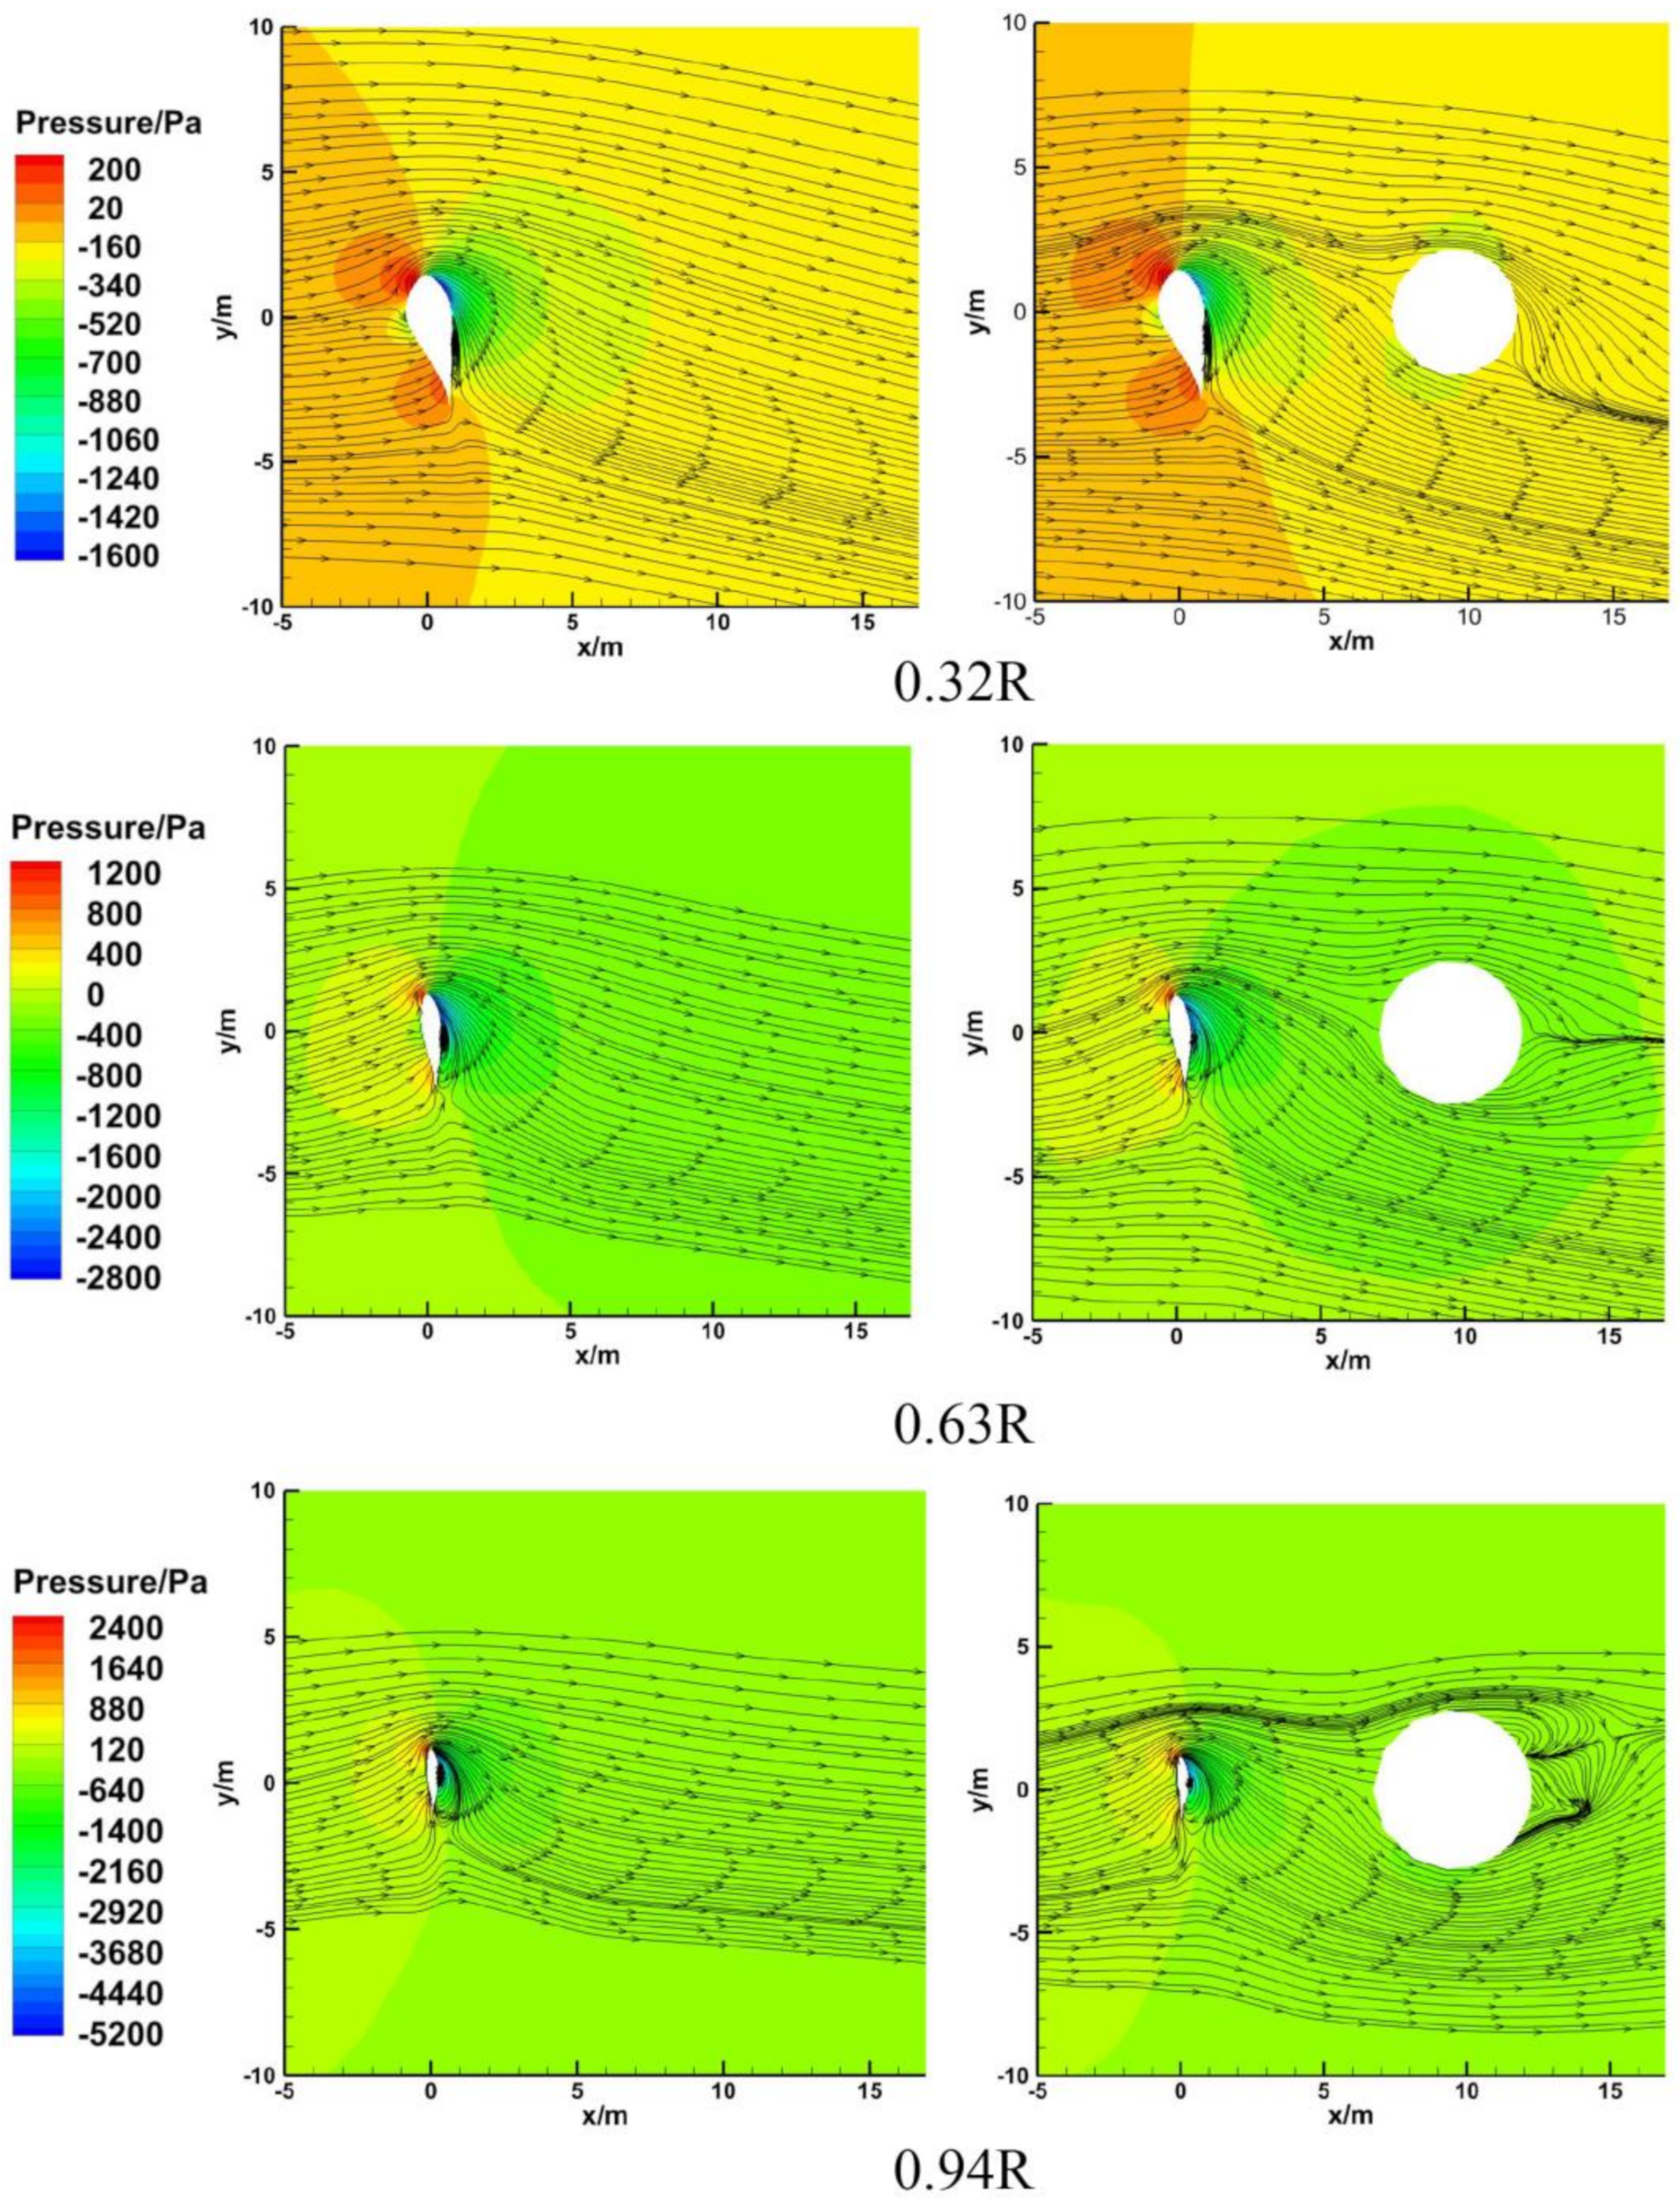
4.2.3. Near Flow Field of Each Section of Blade

Figure 17 shows the interaction between the different blade sections and the tower when the blade rotates to the shadow area of the tower under pitch motion. The pitch motion of the platform to the rear and the rotation of the wind turbine to position 1 directly in front of the tower are selected for further analysis.
Comparing the pressure field on different blade sections with or without the tower under pitch motion, it can be seen that the pressure difference distribution of the blade surface is still concentrated on the leading edge of the blade. Under the influence of the tower shadow effect, the range of the negative pressure field near the suction surface of 0.32 R section and 0.63 R section is reduced, and the absolute value of negative pressure is smaller, but the negative pressure field of the suction surface of 0.94 R section has no obvious change. This further shows that the influence of the tower shadow effect on the pressure field is mainly concentrated in the root and the middle of the blade.
Observing the streamline distribution shown in Figure 17, the main difference is still concentrated in the near wake flow field of the tower. It can be seen that the distribution of the streamline at 0.32 R section and 0.63 R section is similar under surge motion, but there is an obvious stall separation vortex under the pitch motion at 0.94 R section, because compared with the surge motion moving only in the horizontal direction, the pitch motion applies a relative partial velocity in the vertical direction to the wind turbine when the azimuth of the wind turbine changes. The angle between the direction of the incoming flow velocity and the rotating plane of the wind turbine is constantly changing, which makes the flow field more complex.

4.2.4. Wake Field behind the Wind Turbine

Figure 18 shows the velocity distribution of the wake field under platform pitch motion. The two moments when the wind turbine is in the balanced position and pitches forward and backward, respectively, are selected for further analysis. It can be seen that when the wind turbine without the tower is in the equilibrium position, the mutual interference between the blade and the wake flow field is small, and the wake is more stable compared with surge motion. Nevertheless, the symmetry of the flow field behind the same wind turbine with the tower is affected, and there is an obvious low-speed disturbance zone behind the tower, which increases the complexity of the wake.

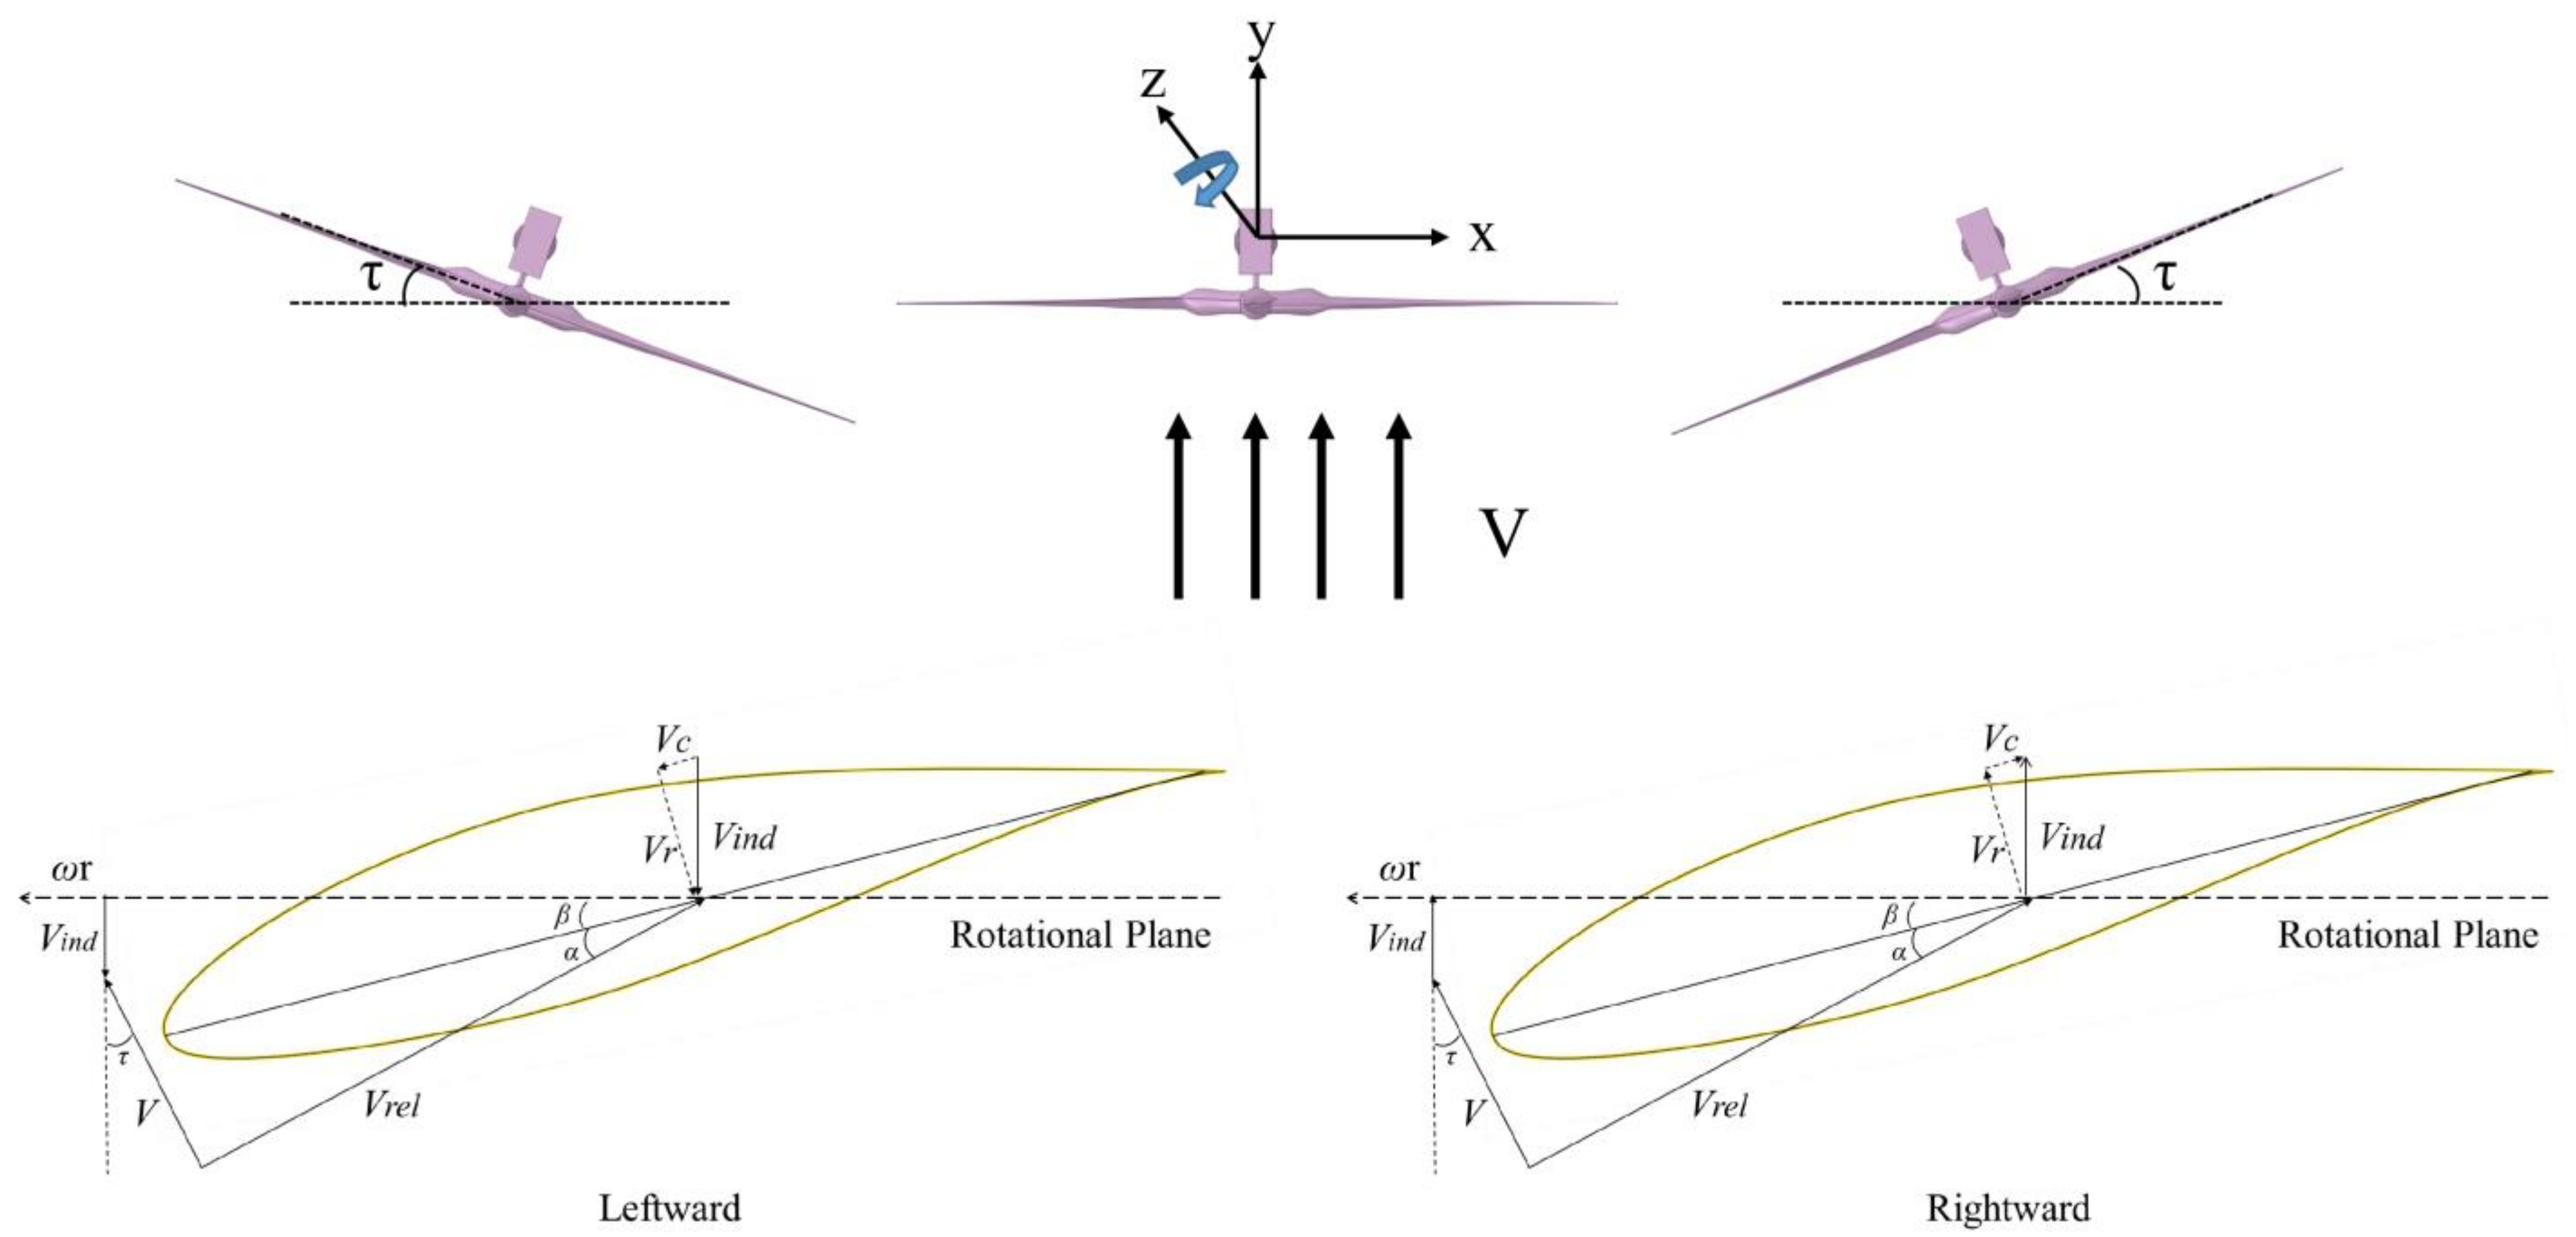
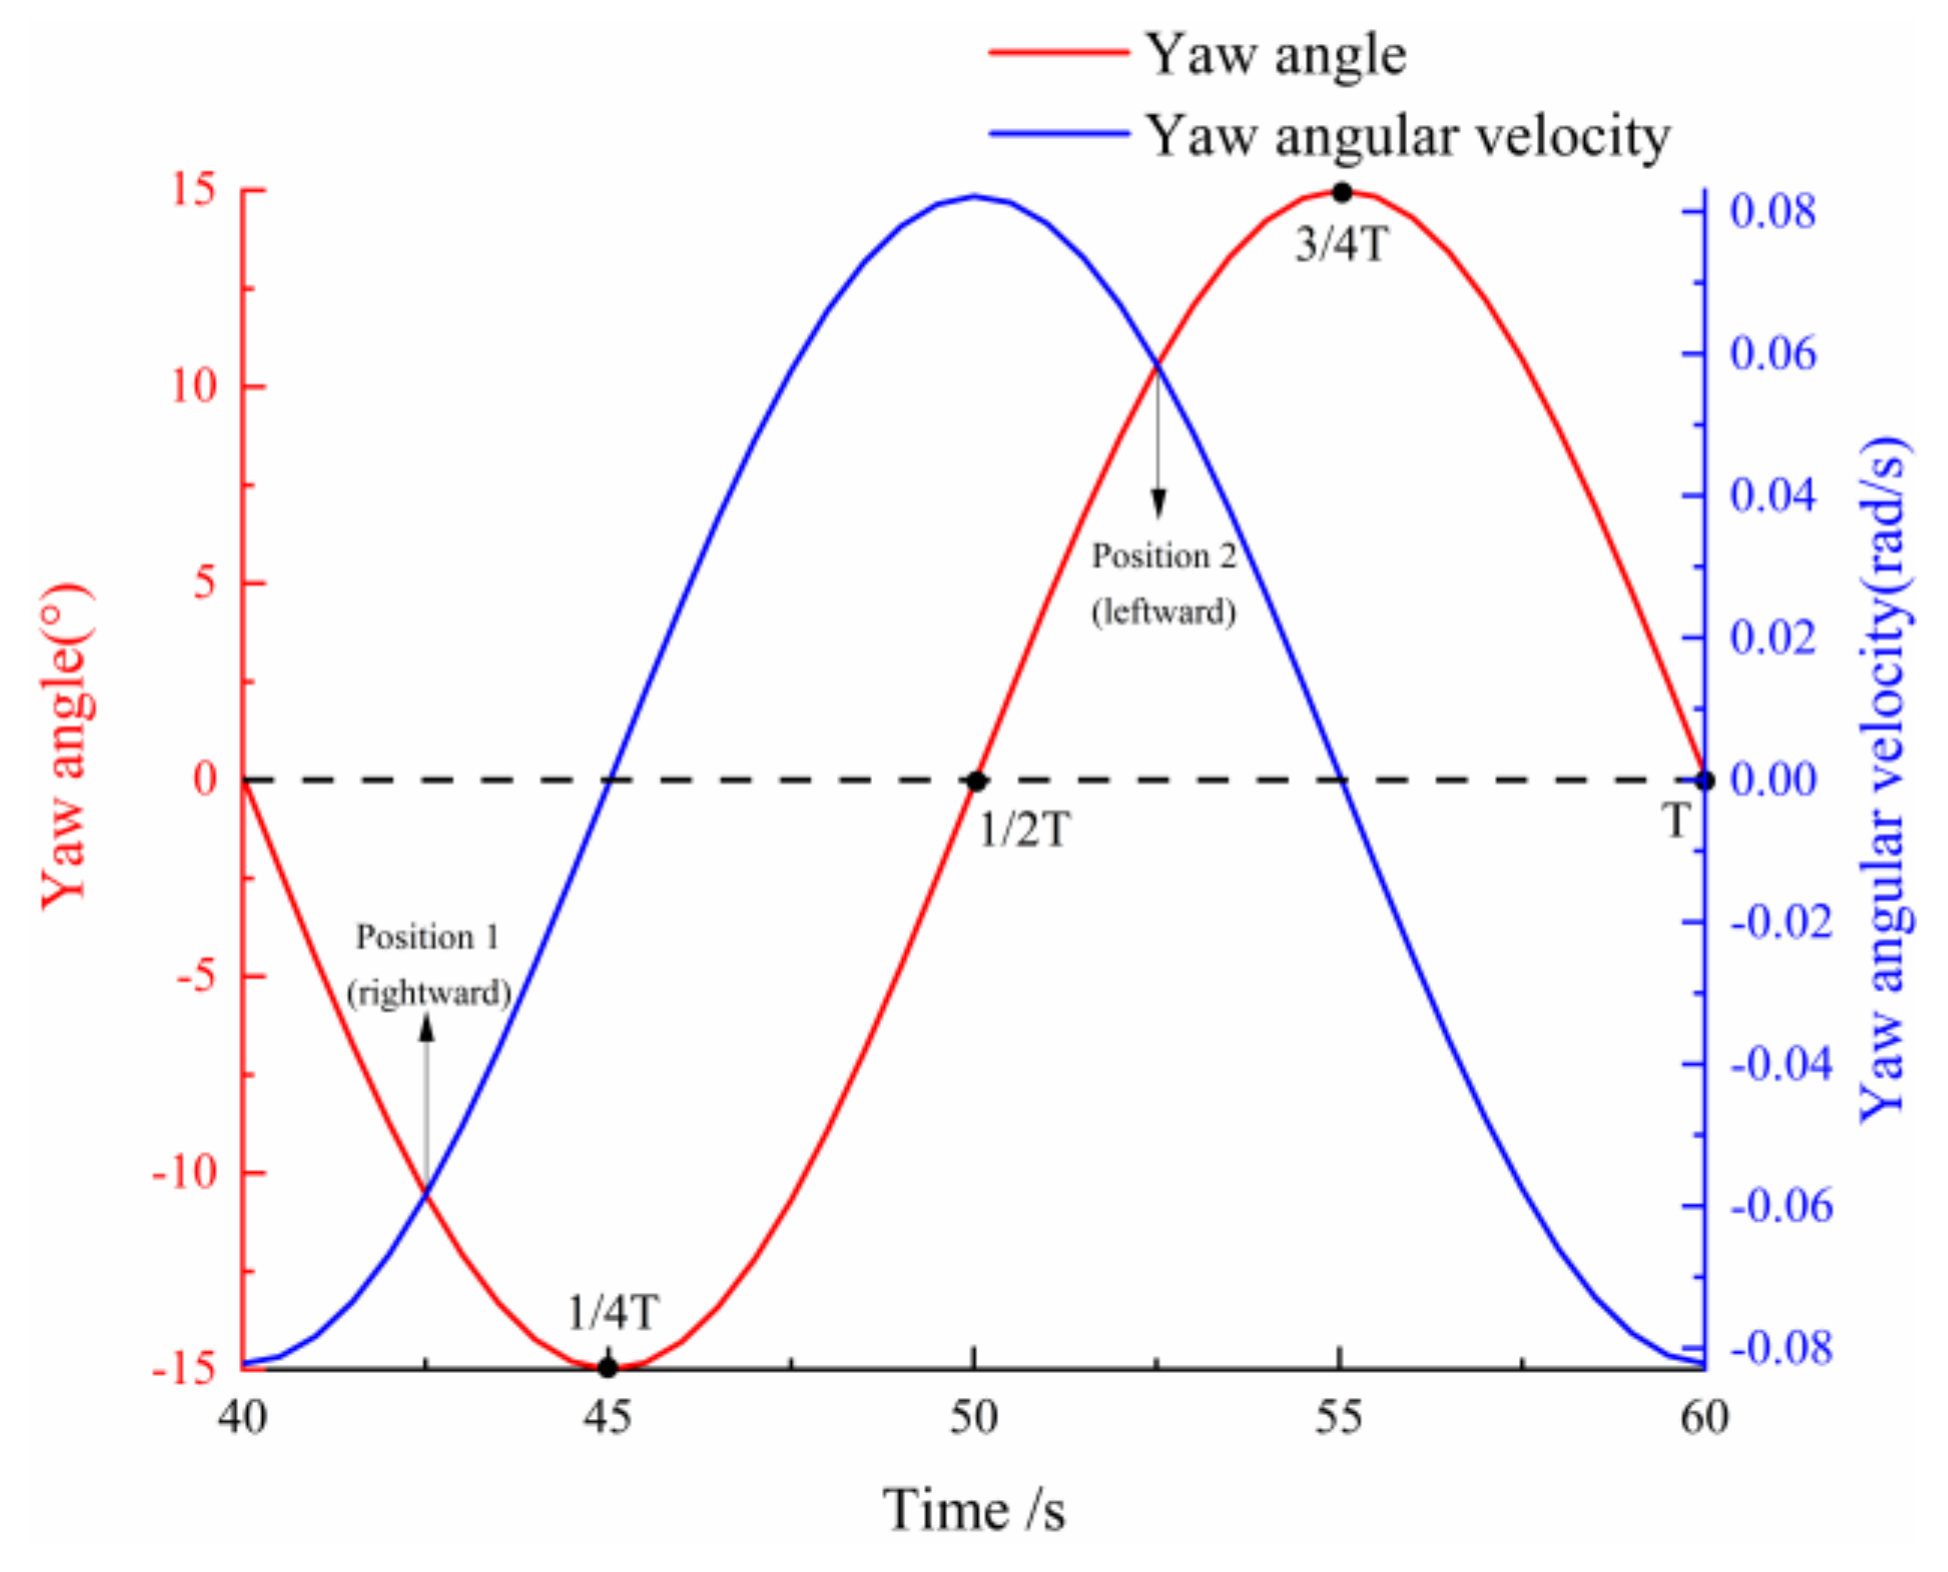
4.3. Unsteady Aerodynamic Analysis under Yaw Motion

4.3.1. Total Performance Analysis

Figure 19 shows the total power and thrust comparison with and without the tower under yaw motion. Similarly, the yaw amplitude corresponds to the fluctuation of power and thrust values. For f = 0.05 Hz, Ay = 15°, as shown in Figure 19a, it can be seen that the power of the wind turbine with the tower is always lower than that of the wind turbine without the tower under the same azimuth, and the power rises after three sharp drops in a wind turbine rotation cycle, which is the result of the combined action of the tower shadow effect and yaw motion. As shown in Figure 19b, under the effect of tower shadow, the maximum, average and minimum power of wind turbines are reduced by 1.94%, 2.47% and 4.16%, respectively. It can be concluded that the tower shadow effect aggravates the change of power extremum under yaw motion. As shown in Figure 19c,d, the fluctuation of the axial thrust value is consistent with that of the power value similarly; that is, they reach their respective extremes at the same azimuth. Under the effect of tower shadow, the maximum, average and minimum thrust of the wind turbine is reduced by 0.76%, 1.1% and 1.86%, respectively. It can be deduced that under yaw motion, the amplitude of the power drop is obviously affected by the tower shadow effect, while the thrust decreases slightly.
Figure 20 shows the induced velocity distribution of airfoil under yaw motion. The yaw motion of the platform produces an additional induced velocity perpendicular to the rotation plane, and the direction of the Vind can be determined according to the right-hand rule. When the platform rotates to the left, the angle between the direction of the inflow velocity and the direction of Vind is an obtuse angle, and its relative inflow velocity increases; on the contrary, when the platform rotates to the right, the angle between the direction of the inflow velocity and the direction of Vind is an acute angle, and its relative inflow velocity decreases. Vind can also be decomposed into chord velocity Vc and radial velocity Vr on the rotating plane. Vr changes the rotation effect of the blade, and Vc causes periodic fluctuations in the angle of attack and the sectional load of the blade.

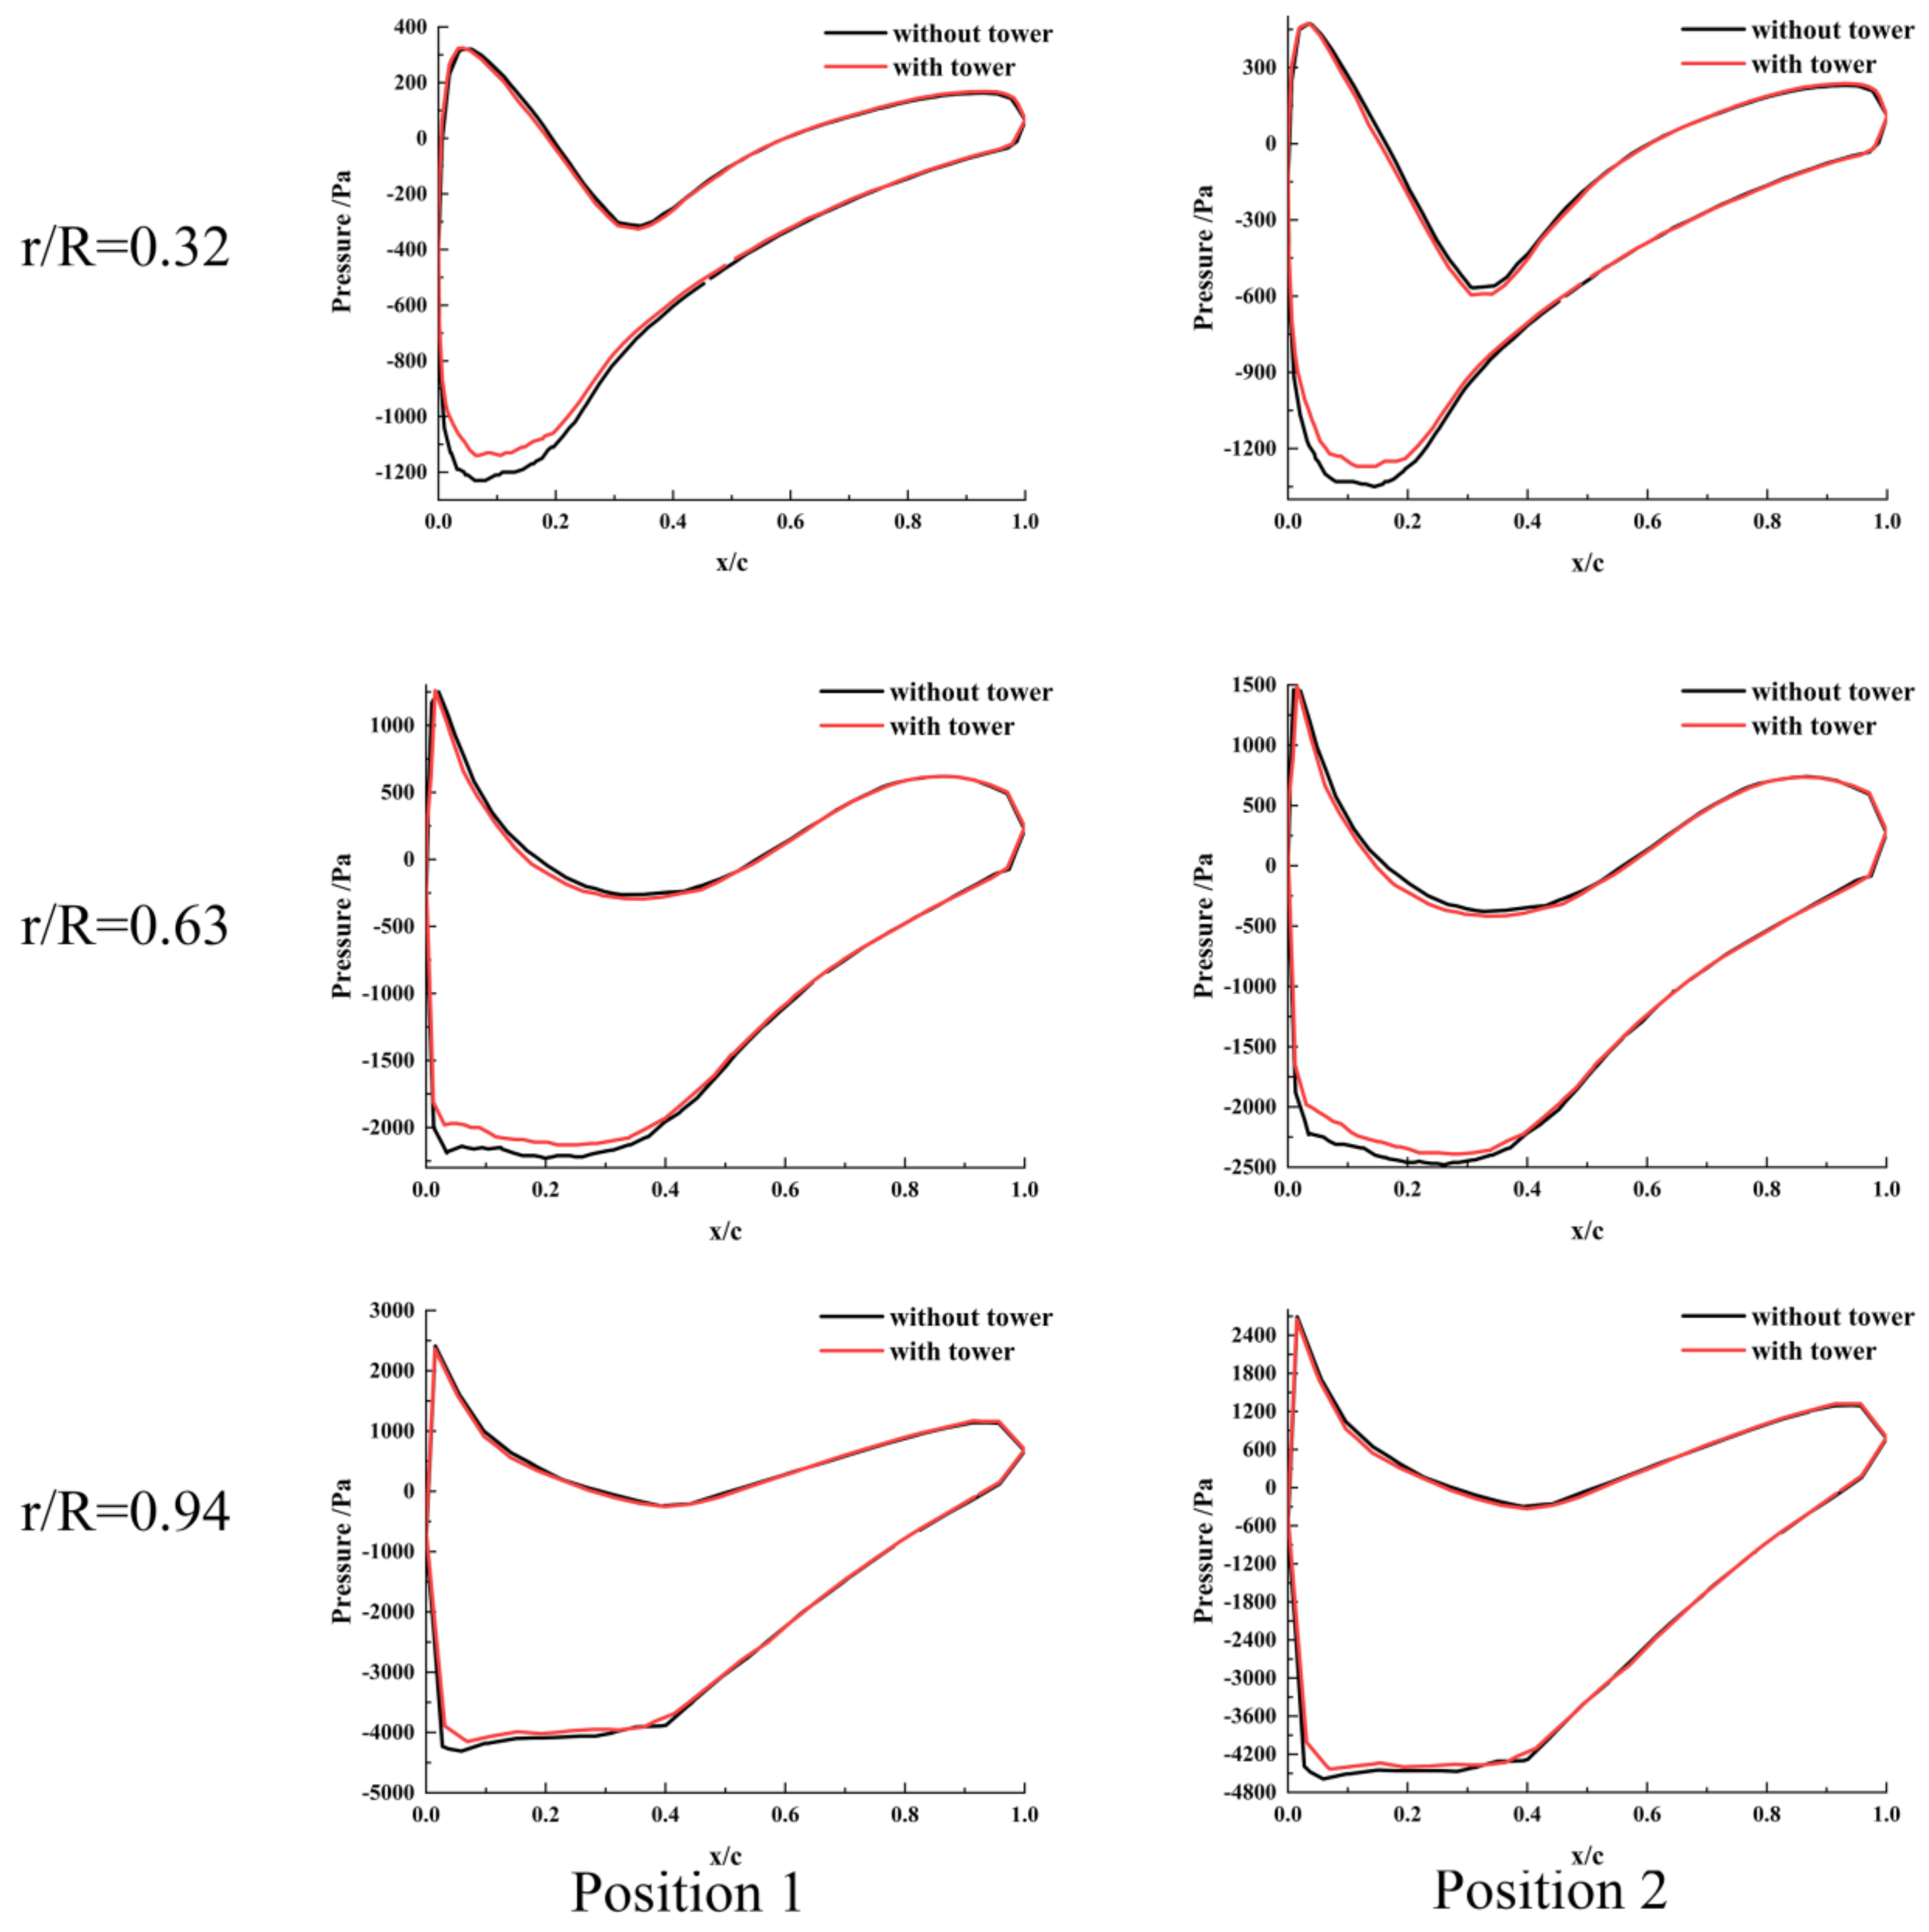
4.3.2. Distribution of Pressure on the Blade Surface

Figure 21 shows the yaw amplitude and angular velocity of the platform motion with reference to simulation time. The second period of stable yaw motion of the wind turbine and two typical positions in front of the tower were selected for further analysis.
Figure 22 shows the pressure distribution in each section of the blade with and without the tower at two typical positions in a yaw cycle. The azimuth moment of 180° and 900° rotation of the wind turbine is selected to study when the wind turbine is at a certain yaw angle to both sides and the wind turbine is directly in front of the tower. In terms of numerical values, the maximum pressure difference of the wind turbine without the tower at 0.32 R, 0.63 R, 0.94 R sections is 1620 Pa, 3455 Pa and 6890 Pa, respectively. It can be found that the pressure difference of each section of the blade under yaw motion is smaller than that of pitch motion. Comparing the pressure distributions of the two kinds of wind turbines at two typical positions, it can be found that the distributions are consistent. The change of pressure difference at the different positions of yaw motion is also not obvious; however, affected by the tower shadow effect, the absolute value of the maximum negative pressure difference at the leading edge of suction in each section of the blade decreases by 11.01%, 8.23% and 5.80%, respectively. It can be inferred that under yaw motion, the interference degree of the tower shadow effect on the negative pressure on the suction surface of the blade is greater than that of surge motion.

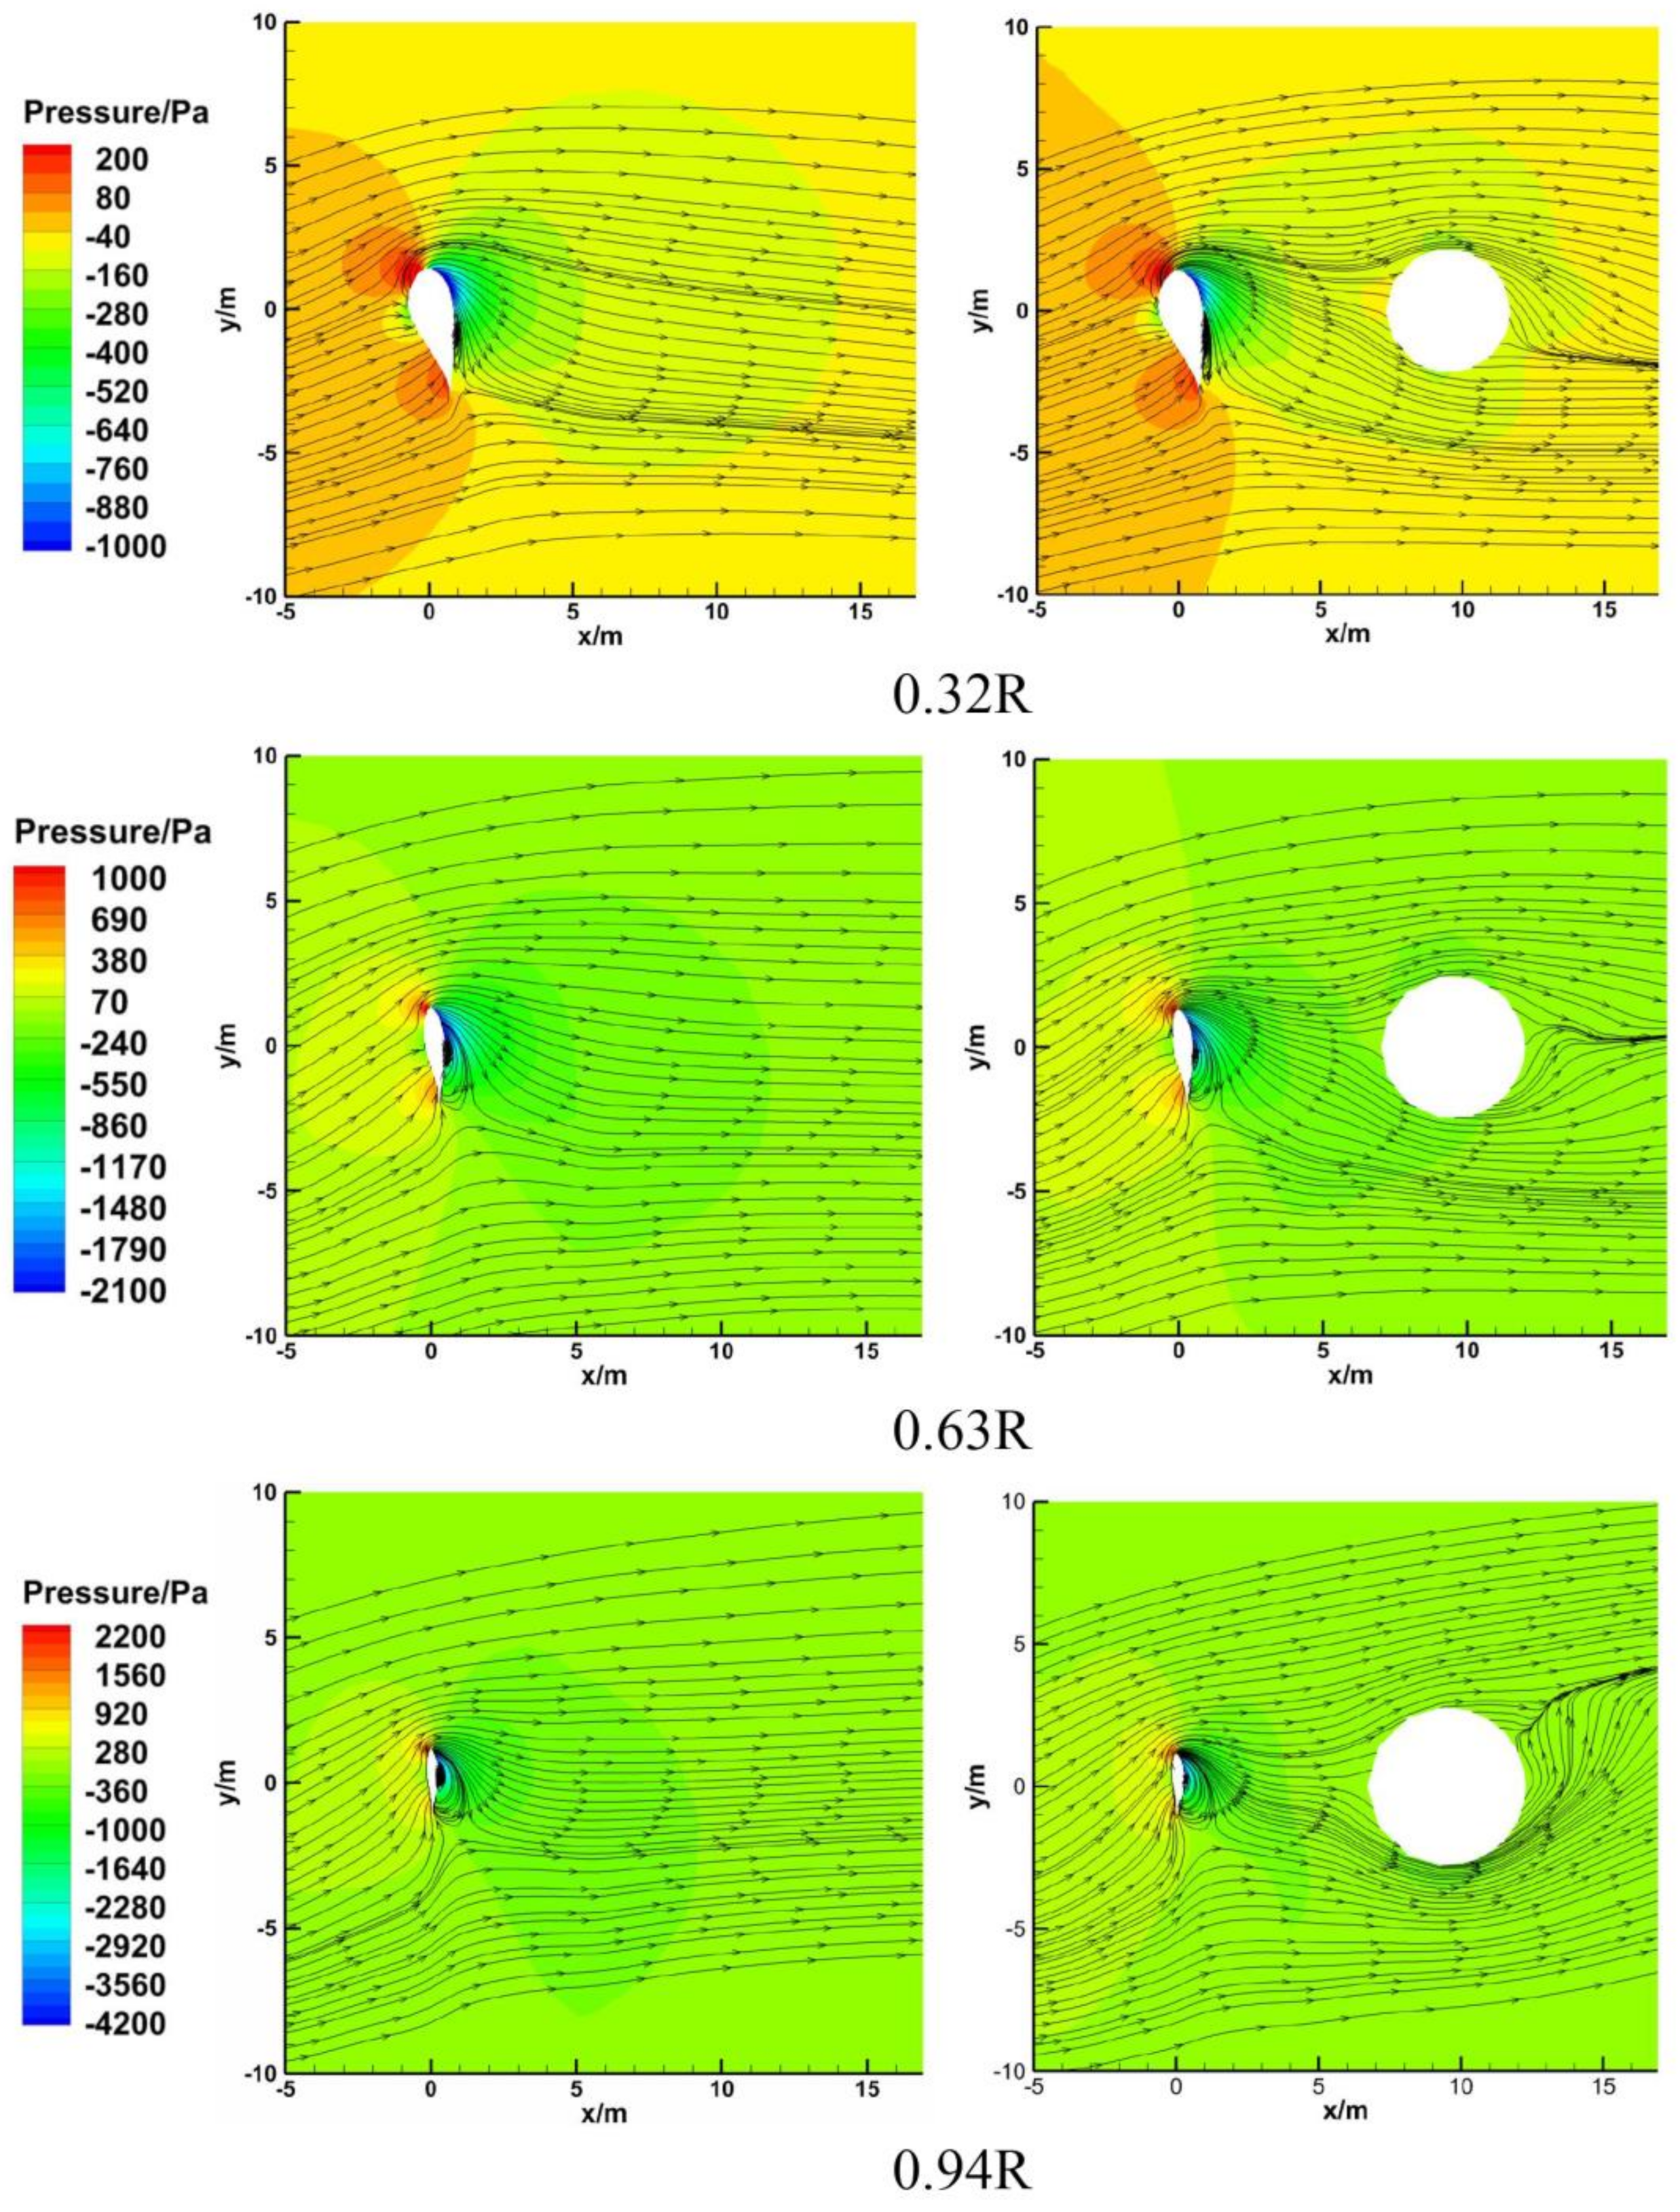
4.3.3. Near Flow Field of Each Section of Blade

Figure 23 shows the interaction between the different blade sections and the tower when the blade rotates to the shadow area of the tower under yaw motion. Position 1 was selected for further analysis.
Under yaw motion, the distribution trend of the pressure field in each section of the blade with or without the tower is similar to that of surge and pitch motions; the maximum negative pressure is still concentrated near the leading edge of the suction of the blade, and the tower compresses the negative pressure field and reduces the absolute value of the maximum negative pressure. The main influence range of the tower shadow effect is in the root and middle of the blade. From a numerical point of view, the blade surface pressure difference of the same section under yaw motion is lower than that of surge and pitch motions, which further shows that the work capacity of the wind turbine under yaw motion is the worst among the three motions.
By comparing the streamline of each section of the blade with or without the tower, the influence area of the tower shadow effect is still mainly concentrated in the wake flow field of the tower, and the streamline shifts behind the tower toward the trailing edge of the blade at 0.32 R section, which is mainly the interference of the tower. The streamline at 0.63 R section shifts in the opposite direction on both sides of the tower, which is the result of the joint action of the tower shadow effect and the enhanced rotation effect. At 0.94 R section, in addition to the weakening of the tower shadow effect and the enhancement of the rotation effect, the yaw motion changes the upwind area of the incoming flow and the rotating plane of the wind turbine, resulting in additional induced tangential velocity. The streamline behind the tower shifts to a greater extent along the rotation direction of the wind turbine.

4.3.4. Wake Field behind the Wind Turbine

Figure 24 shows the velocity distribution of the wake field under platform yaw motion. The two moments when the wind turbine is in the equilibrium position and begins to yaw to the left and right side was selected for further analysis. The wake area of the wind turbine without the tower shows a nearly symmetrical distribution under the balanced position of yaw motion. Meanwhile, the high-speed wake area near the hub is smaller than that under pitch motion; it can be concluded that the yaw motion could reduce the induced velocity behind the hub. Furthermore, under yaw motion, the tower shadow effect similarly leads to the asymmetric distribution of the wake field.

5. Conclusions

This paper investigated the aerodynamic performance of NREL 5 MW FOWT with a rigid blades turbine considering the tower shadow effect under surge, pitch and yaw motions, respectively. The motion form of the platform is equivalent to the change of relative velocity of the wind turbine. The dynamic inlet wind speed is compiled for unsteady numerical simulation using the UDF function. The accuracy of the numerical simulation was verified by proper computational grids. Three independent platform motions and two models with or without the tower were considered for calculation. The results illustrate the wind turbine’s aerodynamics, including power, thrust, pressure distribution and flow field. The conclusions can be drawn as follows:
(1) The fluctuation frequency of power and thrust is always consistent with the motion frequency of the platform. The power is more obviously affected by the tower shadow effect than the thrust, in which the decrease of power is the largest under yaw motion, second-largest under surge motion, and smallest under pitch motion, with a decreased range of 1.58–2.47%.
(2) The influence of the tower shadow effect on the pressure difference of the wind turbine is mainly concentrated at the suction leading edge of the blade under different platform motions, and the interference ability of the tower from the root to the tip of the blade weakens along the blade-spreading direction. The pressure difference under yaw motion is most obviously interfered with by the tower, and the average maximum negative pressure is reduced by 8.35%, which is not conducive to the output power of FOWTs.
(3) For the pressure field, the tower shadow effect obviously compresses the range of the negative pressure field of the root and middle sections of the blade, while the negative pressure field of the tip section is less affected. For the near wake flow field, the wake of the tower at the root section is the most seriously interfered by the tower; the influence of the tower shadow effect decreases with the increase of the blade height and the additional induced velocity produced by yaw and pitch motions makes the near wake flow field of the tower more complicated.
(4) The wake field changes most violently under surge motion; the wake flow field is relatively stable under pitch and yaw motions. Besides, the tower shadow effect leads to the increase of the velocity gradient near the hub, and the influence range of the high-speed wake of the tower wind turbine hub is the farthest under surge motion.
In view of these findings, the platform motion and the tower shadow effect have a great impact on the steady operation of FOWTs, and the combination of the two causes greater interference to the flow field. However, this paper only considers the aerodynamic characteristics of FOWTs under single-degree-of-freedom (surge, pitch and yaw) motion, and future research on factors such as heave, roll, sway and multi-degree-of-freedom coupling motions are worthy of more in-depth discussion.

Author Contributions

Conceptualization, L.D. and L.Z.; Formal analysis, L.D.; Investigation, L.D. and L.Z.; Methodology, L.D.; Project administration, D.H.; Software, L.D.; Supervision, D.H.; Validation, L.D.; Writing—original draft, L.D.; Writing—review and editing, L.D. All authors have read and agreed to the published version of the manuscript.

Funding

This research was funded by the Science and Technology Commission of Shanghai Municipality and the National Natural Science Foundation of China, grant number 18DZ1202302 and 50706025.

Institutional Review Board Statement

Not applicable.

Informed Consent Statement

Not applicable.

Data Availability Statement

The data are not publicly available.

Acknowledgments

This research work is sponsored by the Science and Technology Commission of Shanghai Municipality (18DZ1202302). Additionally, the support of the National Natural Science Foundation of China under project No. 50706025 is gratefully acknowledged.

Conflicts of Interest

The authors declare no conflict of interest.

Abbreviations

FOWTFloating Offshore Wind Turbine
CFDComputational Fluid Dynamic
6-DOFSix Degrees-of-Freedom
BEMBlade Element Momentum
FVMFree Vortex Method
UDFUser-Defined Function
RANSReynolds-Averaged Navier–Stokes equations
VIncoming Wind Speed

Nomenclature

VSthe relative inflow velocity under surge motion
VPthe relative inflow velocity under pitch motion
VYthe relative inflow velocity under yaw motion
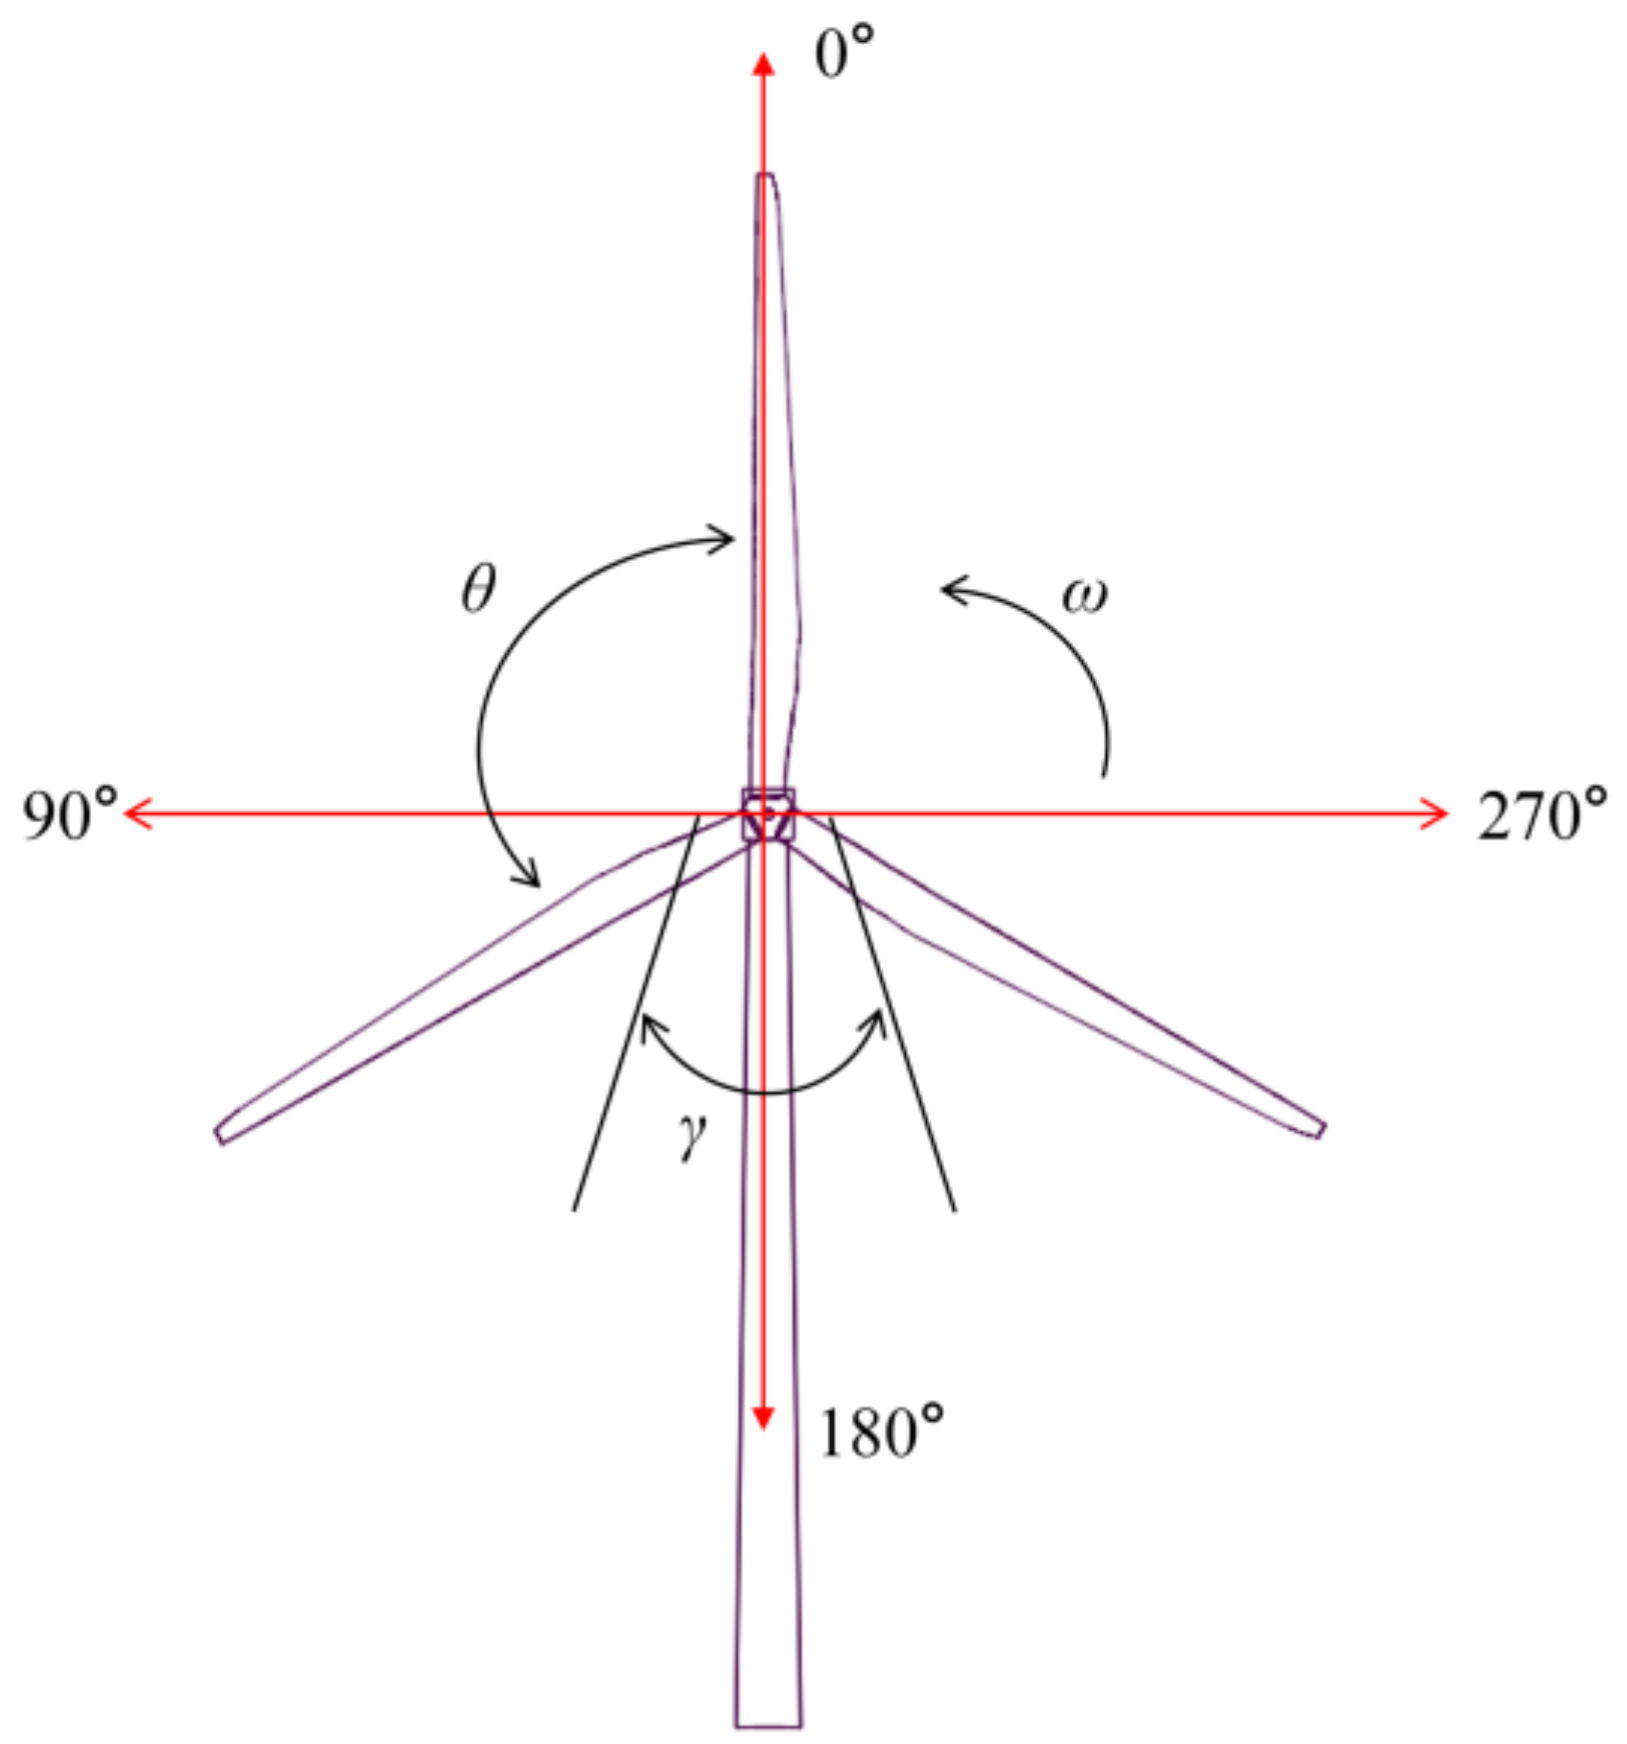
θthe angle between two blades
γthe influence area of the tower shadow effect
ωthe rotational speed of the wind turbine
Vindthe induced velocity of platform motion
Vrelthe relative velocity
Assurge amplitude
Appitch amplitude
Ayyaw amplitude

References

  1. Cheng, P.; Huang, Y.; Wan, D.C. A numerical model for fully coupled aero-hydrodynamic analysis of floating offshore wind turbine. Ocean Eng. 2019, 173, 183–196. [Google Scholar] [CrossRef]
  2. Shen, X.; Hu, P.; Chen, J.E.; Zhu, X.C.; Du, Z.H. The unsteady aerodynamics of floating wind turbine under platform pitch motion. Proc. Inst. Mech. Eng. Part A J. Power Energy 2018, 232, 1019–1036. [Google Scholar] [CrossRef]
  3. Wu, X.N.; Hu, Y.; Li, Y.; Yang, J.; Duan, L.; Wang, T.G.; Adcock, T.; Jiang, Z.Y.; Gao, Z.; Lin, Z.L.; et al. Foundations of offshore wind turbines: A review. Renew. Sustain. Energ. Rev. 2019, 104, 379–393. [Google Scholar] [CrossRef] [Green Version]
  4. Cai, X.; Gu, R.R.; Pan, P.; Zhu, J. Unsteady aerodynamics simulation of a full-scale horizontal axis wind turbine using CFD methodology. Energy Convers. Manag. 2016, 112, 146–156. [Google Scholar] [CrossRef]
  5. Sebastian, T.; Lackner, M. Analysis of the Induction and Wake Evolution of an Offshore Floating Wind Turbine. Energies 2012, 5, 968–1000. [Google Scholar] [CrossRef] [Green Version]
  6. De Vaal, J.B.; Hansen, M.O.L.; Moan, T. Effect of wind turbine surge motion on rotor thrust and induced velocity. Wind Energy 2014, 17, 105–121. [Google Scholar] [CrossRef]
  7. Ma, Z.; Li, W.; Ren, N.A.X.; Ou, J.P. The typhoon effect on the aerodynamic performance of a floating offshore wind turbine. J. Ocean Eng. Sci. 2017, 2, 279–287. [Google Scholar] [CrossRef]
  8. Farrugia, R.; Sant, T.; Micallef, D. A study on the aerodynamics of a floating wind turbine rotor. Renew. Energy 2016, 86, 770–784. [Google Scholar] [CrossRef]
  9. Wen, B.R.; Dong, X.J.; Tian, X.L.; Peng, Z.K.; Zhang, W.M.; Wei, K.X. The power performance of an offshore floating wind turbine in platform pitching motion. Energy 2018, 154, 508–521. [Google Scholar] [CrossRef]
  10. Wen, B.R.; Tian, X.L.; Dong, X.J.; Peng, Z.K.; Zhang, W.M. On the power coefficient overshoot of an offshore floating wind turbine in surge oscillations. Wind Energy 2018, 21, 1076–1091. [Google Scholar] [CrossRef]
  11. Salehyar, S.; Li, Y.; Zhu, Q. Fully-coupled time-domain simulations of the response of a floating wind turbine to non-periodic disturbances. Renew. Energy 2017, 111, 214–226. [Google Scholar] [CrossRef]
  12. Lin, L.; Wang, K.; Vassalos, D. Detecting wake performance of floating offshore wind turbine. Ocean Eng. 2018, 156, 263–276. [Google Scholar] [CrossRef]
  13. Tran, T.; Kim, D.; Song, J. Computational Fluid Dynamic Analysis of a Floating Offshore Wind Turbine Experiencing Platform Pitching Motion. Energies 2014, 7, 5011–5026. [Google Scholar] [CrossRef]
  14. Tran, T.T.; Kim, D.H. The aerodynamic interference effects of a floating offshore wind turbine experiencing platform pitching and yawing motions. J. Mech. Sci. Technol. 2015, 29, 549–561. [Google Scholar] [CrossRef]
  15. Tran, T.T.; Kim, D.H. The platform pitching motion of floating offshore wind turbine: A preliminary unsteady aerodynamic analysis. J. Wind Eng. Ind. Aerodyn. 2015, 142, 65–81. [Google Scholar] [CrossRef] [Green Version]
  16. Tran, T.T.; Kim, D.H. A CFD study into the influence of unsteady aerodynamic interference on wind turbine surge motion. Renew. Energy 2016, 90, 204–228. [Google Scholar] [CrossRef]
  17. Chen, J.H.; Hu, Z.Q.; Wan, D.C.; Xiao, Q. Comparisons of the dynamical characteristics of a semi-submersible floating offshore wind turbine based on two different blade concepts. Ocean Eng. 2018, 153, 305–318. [Google Scholar] [CrossRef] [Green Version]
  18. Wu, C.-H.K.; Vinh-Tan, N. Aerodynamic simulations of offshore floating wind turbine in platform-induced pitching motion. Wind Energy 2017, 20, 835–858. [Google Scholar] [CrossRef]
  19. Huang, Y.; Wan, D.C. Investigation of Interference Effects Between Wind Turbine and Spar-Type Floating Platform Under Combined Wind-Wave Excitation. Sustainability 2020, 12, 246. [Google Scholar] [CrossRef] [Green Version]
  20. Fang, Y.; Duan, L.; Han, Z.L.; Zhao, Y.S.; Yang, H. Numerical analysis of aerodynamic performance of a floating offshore wind turbine under pitch motion. Energy 2020, 192, 116621. [Google Scholar] [CrossRef]
  21. Fang, Y.; Li, G.; Duan, L.; Han, Z.L.; Zhao, Y.S. Effect of surge motion on rotor aerodynamics and wake characteristics of a floating horizontal-axis wind turbine. Energy 2021, 218, 119519. [Google Scholar] [CrossRef]
  22. Chen, Z.W.; Wang, X.D.; Guo, Y.Z.; Kang, S. Numerical analysis of unsteady aerodynamic performance of floating offshore wind turbine under platform surge and pitch motions. Renew. Energy 2021, 163, 1849–1870. [Google Scholar] [CrossRef]
  23. Chen, Z.W.; Wang, X.D.; Kang, S. Effect of the Coupled Pitch-Yaw Motion on the Unsteady Aerodynamic Performance and Structural Response of a Floating Offshore Wind Turbine. Processes 2021, 9, 290. [Google Scholar] [CrossRef]
  24. Sivalingam, K.; Martin, S.; Wala, A.A.S. Numerical Validation of Floating Offshore Wind Turbine Scaled Rotors for Surge Motion. Energies 2018, 11, 2578. [Google Scholar] [CrossRef] [Green Version]
  25. Kim, H.; Lee, S.; Lee, S. Influence of blade-tower interaction in upwind-type horizontal axis wind turbines on aerodynamics. J. Mech. Sci. Technol. 2011, 25, 1351–1360. [Google Scholar] [CrossRef]
  26. Quallen, S.; Tao, X. An Investigation of the Blade Tower Interaction of a Floating Offshore Wind Turbine. In Proceedings of the 25th International Offshore and Polar Engineering Conference, Big Island, HI, USA, 21 June 2015. [Google Scholar]
  27. Ke, S.T.; Wang, T.G.; Ge, Y.J.; Tamura, Y. Aerodynamic loads and aeroelastic responses of large wind turbine tower-blade coupled structure in yaw condition. Struct. Eng. Mech. 2015, 56, 1021–1040. [Google Scholar] [CrossRef]
  28. Noyes, C.; Qin, C.; Loth, E.; Schreck, S. Measurements and predictions of wind turbine tower shadow and fairing effects. J. Wind Eng. Ind. Aerodyn. 2018, 179, 297–307. [Google Scholar] [CrossRef]
  29. Zhang, J.; Zhen, G.; Xing, Z.; Liang, G.; Hu, D. Dynamic analysis of offshore wind turbine blades under the action of wind shear and fluctuating wind. J. Vibroeng. 2018, 20. [Google Scholar] [CrossRef]
  30. Li, Z.W.; Wen, B.R.; Dong, X.J.; Peng, Z.K.; Qu, Y.G.; Zhang, W.M. Aerodynamic and aeroelastic characteristics of flexible wind turbine blades under periodic unsteady inflows. J. Wind Eng. Ind. Aerodyn. 2020, 197, 104057. [Google Scholar] [CrossRef]
  31. Wu, W.M.; Liu, X.F.; Dai, Y.J.; Li, Q.Y. An in-depth quantitative analysis of wind turbine blade tip wake flow based on the lattice Boltzmann method. Environ. Sci. Pollut. Res. 2020, 13. [Google Scholar] [CrossRef]
  32. Regodeseves, P.G.; Morros, C.S. Unsteady numerical investigation of the full geometry of a horizontal axis wind turbine: Flow through the rotor and wake. Energy 2020, 202, 117674. [Google Scholar] [CrossRef]
  33. Burmester, S.; Vaz, G.; el Moctar, O. Towards credible CFD simulations for floating offshore wind turbines. Ocean Eng. 2020, 209, 107237. [Google Scholar] [CrossRef]
  34. Chen, D.; Gao, P.; Huang, S.S.; Fan, K.; Zhuang, N.; Liao, Y.D. Dynamic response and mooring optimization of spar-type substructure under combined action of wind, wave, and current. J. Renew. Sustain. Energy 2017, 9, 063307. [Google Scholar] [CrossRef]
  35. Wang, X.D.; Ye, Z.L.; Kang, S.; Hu, H. Investigations on the Unsteady Aerodynamic Characteristics of a Horizontal-Axis Wind Turbine during Dynamic Yaw Processes. Energies 2019, 12, 3124. [Google Scholar] [CrossRef] [Green Version]
  36. Jonkman, J.M. Dynamics Modeling and Loads Analysis of an Offshore Floating Wind Turbine; National Renewable Energy Lab. (NREL): Golden, CO, USA, 2007.
  37. Hu, D.M.; Ji, S.Q.; Wu, Z.X. Study on Aerodynamic Performance of Offshore Floating Wind Turbine with Fusion Winglets. J. Sol. Energy Eng. Trans. ASME 2020, 142, 051007. [Google Scholar] [CrossRef]
  38. Jonkman, J.M.; Butterfield, S.; Musial, W.; Scott, G. Definition of a 5MW Reference Wind Turbine for Offshore System Development; Office of Scientific & Technical Information Technical Reports; National Renewable Energy Lab. (NREL): Golden, CO, USA, 2009.
  39. Wen, B.R.; Wei, S.; Wei, K.X.; Yang, W.X.; Peng, Z.K.; Chu, F.L. Power fluctuation and power loss of wind turbines due to wind shear and tower shadow. Front. Mech. Eng. 2017, 12, 321–332. [Google Scholar] [CrossRef] [Green Version]
Figure 1. 6-DOF motions of a wind turbine floating foundation.
Processes 09 01047 g001
Figure 2. Computational domain of wind turbine flow field: (a) external domain; (b) rotational domain.
Processes 09 01047 g002
Figure 3. Computational mesh; (a) External domain; (b) Internal domain; (c) Hub surface mesh; (d) Blade surface mesh.
Processes 09 01047 g003
Figure 4. Power comparison of different wind speeds.
Processes 09 01047 g004
Figure 5. Power variation under unsteady rated condition.
Processes 09 01047 g005
Figure 6. Schematic diagram of wind turbine blade-rotation phase angle.
Processes 09 01047 g006
Figure 7. Total aerodynamic comparison of surge motion; (a) power versus azimuth angle; (b) extreme and average values of power; (c) thrust versus azimuth angle; (d) extreme and average values of thrust.
Processes 09 01047 g007
Figure 8. Schematic diagram of airfoil-induced velocity under surge motion.
Processes 09 01047 g008
Figure 9. The two typical positions during surge motion.
Processes 09 01047 g009
Figure 10. Distribution of pressure in each section of blade at position 1 and position 2.
Processes 09 01047 g010
Figure 11. Streamline and pressure contours on different blade sections under surge motion.
Processes 09 01047 g011
Figure 12. Velocity contours of wake field under surge motion.
Processes 09 01047 g012
Figure 13. Total aerodynamic comparison of pitch motion; (a) Power versus azimuth angle; (b) Extreme and average values of power; (c) Thrust versus azimuth angle; (d) Extreme and average values of thrust.
Processes 09 01047 g013
Figure 14. Schematic diagram of airfoil-induced velocity under pitch motion.
Processes 09 01047 g014
Figure 15. The two typical positions during pitch motion.
Processes 09 01047 g015
Figure 16. Distribution of pressure in each section of blade at position 1 and position 2.
Processes 09 01047 g016
Figure 17. Streamline and pressure contours on different blade sections under pitch motion.
Processes 09 01047 g017
Figure 18. Velocity contours of wake field under pitch motion.
Processes 09 01047 g018
Figure 19. Total aerodynamic comparison of yaw motion; (a) Power versus azimuth angle; (b) Extreme and average values of power; (c) Thrust versus azimuth angle; (d) Extreme and average values of thrust.
Processes 09 01047 g019
Figure 20. Schematic diagram of airfoil-induced velocity under yaw motion.
Processes 09 01047 g020
Figure 21. The two typical positions during yaw motion.
Processes 09 01047 g021
Figure 22. Distribution of pressure in each section of blade at position 1 and position 2.
Processes 09 01047 g022
Figure 23. Streamline and pressure contours on different blade sections under yaw motion.
Processes 09 01047 g023
Figure 24. Velocity contours of wake field under yaw motion.
Processes 09 01047 g024
Table 1. Floating foundation motion conditions.
ConditionsMotionDisplacementAmplitudeFrequency
1surge−5–5 m/0.05 Hz
2pitch/−5–5°0.05 Hz
3yaw/−15–15°0.05 Hz
Table 2. Torque of different gird sizes.
Cells Number (Million)2.864.776.718.5010.08Reference Value
Torque (N m)3.54 × 1063.82 × 1063.90 × 1063.98 × 1064.03 × 1064.01 × 106
Relative error (%)11.724.742.740.750.50
Publisher’s Note: MDPI stays neutral with regard to jurisdictional claims in published maps and institutional affiliations.

