Article

Time-Dependent Viscous Flow Behavior of a Hydrophobic Fumed Silica Suspension

by
Jorge H. Sánchez
1,
Francisco J. Rubio-Hernández
2,* and
Nicolás M. Páez-Flor
3
1
Department of Chemical Engineering, Universidad Pontificia Bolivariana, Medellín 050031, Colombia
2
Department of Applied Physics II, Universidad de Málaga, 29071 Málaga, Spain
3
DECEM, Universidad de las Fuerzas Armadas-ESPE, Sangolquí 171103, Ecuador
*
Author to whom correspondence should be addressed.
Processes 2021, 9(5), 807; https://doi.org/10.3390/pr9050807
Submission received: 30 March 2021 / Revised: 30 April 2021 / Accepted: 2 May 2021 / Published: 5 May 2021
(This article belongs to the Section Manufacturing Processes and Systems)

Abstract

:
The viscous flow behavior of a 12.5 vol% hydrophobic fumed silica (Aerosil® R816) suspension in polypropylene glycol of low molecular weight (PPG400) was studied in a stress-controlled rheometer. The steady flow curve showed shear thickening between two shear thinning regions. Time-dependent viscosity response provoked by step changes in shear stresses corresponding to the shear-thickening region apparently agrees with thixotropic behavior just after the very initial stages are surpassed. Almost instantaneous jamming can justify misinterpretation of the results.

1. Introduction

When shear steps are applied on time-dependent viscous (TDV) fluids, steady states are reached with some delay. In addition, it is experimentally observed that the time necessary for a TDV fluid to achieve the steady state depends on the magnitude of the imposed shear [1]. Inelastic thixotropic and anti-thixotropic fluids belong to the category of purely TDV fluids. In accordance with the accepted definitions, the viscosity of thixotropic materials decreases with time when they are sheared at constant shear, followed by gradual recovery when shear is removed [1,2]. On the other hand, anti-thixotropic materials must exhibit an increase of the viscosity with time under constant shear [3], followed by gradual decrease of the viscosity when shear is removed. It is worthy to note the necessity to confirm the reversibility condition in both cases. Alternative definitions of thixotropy and anti-thixotropy establish that for a step change in shear rate (stress), thixotropy leads to a gradual change in stress (shear rate) in the opposite direction of the jump, whereas anti-thixotropy leads to a gradual change in stress (shear rate) in the same direction [4]. Rheological behaviors are macroscopic manifestations of changes provoked by the action of external stresses on the microstructure of fluids. Specifically, the macroscopic viscous behavior of inelastic time-dependent fluids is associated with shear- and time-dependent changes in microstructures, such as was justified long ago by Ostwald when he studied the viscosity changes of colloidal dispersions [5]. In the case of TDV behaviors, shear work done on the material must lead to both breakdown and buildup of microstructure. Therefore, spontaneous buildup or breakdown due to Brownian motion must be respectively expected upon cessation of shear [6,7]. Note that the elastic deformation of microstructure is explicitly neglected in the definition of pristine TDV behaviors. A large number of products, such as foodstuff, personal care products, paints, fresh cement, adhesives, crude oils, natural and drilling muds, slurries, and various colloidal suspensions are some examples of fluids in which TDV behavior can be measured [8,9,10,11].
Suspensions of solid particles in Newtonian fluids have been widely used to model the rheological behavior of complex fluids [12,13]. The reason for this choice is founded on the fact that the addition of particles to liquid media can effectively change mechanical properties of the system thanks to the development of undefined microstructures [14]; i.e., a variety of non-Newtonian behaviors can be observed due to the presence of a solid dispersed phase in a Newtonian fluid [15], in particular, TDV behaviors. Colloidal forces, Brownian motion, and hydrodynamics interactions between particles are physical mechanisms that justify the microscopic origin of non-Newtonian behaviors in colloidal suspensions. At rest, particles tend to form aggregates when colloidal attractive forces (van der Waals) dominate, but they stay dispersed if colloidal repulsion (electrostatic or steric) dominates over attractive forces. In the quiescent state Brownian motion plays a double antagonistic role breaking aggregates but also favoring particle-particle contacts that can eventually lead to aggregation. In addition, particle aggregates can be broken (shear-thinning) or built (shear-thickening) by increasing shear [16]. It seems reasonable to assume that breaking processes should govern the evolution of the microstructure with increasing shear when, at rest, particles form aggregates. In this case, the viscosity will reach lower equilibrium values by increasing shear. On the other hand, when the suspension at rest is characterized by dispersed particles, increasing shear should lead to microstructure building. Then, in this last case, increasing shear should give place to the formation of particle aggregates and the corresponding increase of the steady viscosity. These mechanisms must result in shear-thinning and shear-thickening behaviors, respectively, as well as in thixotropy and anti-thixotropy if the changes experienced by the microstructure at each specific shear are reversible and relatively slow compared to the time necessary for the elastic recovery of the microstructure [17]. Even though the definitions of these four viscous behaviors (shear-thinning, shear-thickening, thixotropy, and anti-thixotropy) seem clear and unambiguous, some confusion is observed when they are experimentally checked. For instance, thixotropic or anti-thixotropic behavior observations are frequently assumed without clear confirmation of reversibility condition [18,19,20]. Moreover, shear-thinning/thixotropy and shear-thickening/anti-thixotropy assumed relationships [21,22] have been confirmed only in some systems [23]. Then, it is reasonable to expect that the study of TDV behaviors is nowadays an active research field despite being a classical branch in rheological science.
Silica nanofluids show a variety of non-Newtonian behaviors. Modifying the hydrophobic/hydrophilic nature of particle surface and the polarity of the liquid phase, shear-thinning and shear-thickening behaviors can be observed. Hydrophobic fumed silica suspensions in polypropylene glycol of low molecular weight (PPG400) show a complex viscous behavior, shear-thickening between two shear-thinning regions [23,24], which makes this system specifically interesting for the study of thixotropy/shear-thinning and anti-thixotropy/shear-thickening relationships [23]. Fumed silica are amorphous nonporous silica prepared by flame hydrolysis of SiCl4. This solid phase is hydrophilic in nature due to the presence of silanol groups (Si–OH) on its surface. However, a chemical post-treatment step can convert the particle surface into a hydrophobic one. Specifically, hydrophobic particle surfaces (Aerosil®R816, EVONIK, Germany) can be obtained when hexadecyl groups (–C16H33) are attached to the surface of hydrophilic silica particles (Aerosil®200, EVONIK, Germany). In this case, since alkyl groups appears to be straight and extended when they are immersed in PPG400 [25], silica particles repel one another by steric interactions. These repulsive interaction forces between particles can balance hydrodynamic forces during flow causing relatively slow changes in microstructure, which allows observing time-dependent viscosity with shear step tests.
In this work, transient viscous shear behavior (stepwise tests) of hydrophobic fumed silica (Aerosil®R816) suspensions in PPG400 were studied with the aim to check TDV behaviors relationships.

2. Materials and Methods

2.1. Materials and Sample Preparation

Commercially available hydrophobic fumed silica, Aerosil® R816 (EVONIK, Germany), were used as the solid phase. The specific surface area BET of the silica particles is 190 ± 20 m2/g and their primary spherical size is 12 nm. The continuous phase was polypropylene glycol (HO–(CH2–CH(CH3)–O)n–H) with an average molecular weight of 400 g/mol (PPG400) (Sigma-Aldrich Chemical GmbH, Germany). This is a low-viscosity Newtonian media having, under ambient conditions, a viscosity of 100 mPa⋅s.
The suspensions were prepared by adding the liquid to the silica and then mixing in a stirrer for 10 min at 796 rpm. These parameters were determined as the minimum mixing time and velocity required to ensure good dispersion. Samples with a solid volume fraction of φ = 0.125, which corresponds to 24 wt%, were placed in a vacuum and a sonication device at room temperature for about 1 h in order to remove air bubbles. Afterwards, samples were placed to rest for 12 h in an airtight plastic bottle.

2.2. Rheological Experiments

Rheological measurements were performed on a stress-controlled rheometer (HAAKE MARS, Thermo Fisher Scientific, Germany) using control stress shear mode (CS). This choice was based upon the fact that microstructure changes are due to stresses action rather than rate of deformation activity, and also due to the fact that for transitory studies it is advisable to use CS mode when the rheometer is a stress-controlled type [26]. A cone-plate (CP) geometry with a cone angle of 1° and a diameter of 20 mm was used for all experiments. A Peltier temperature control system was used to keep the temperature of the plate at 25.0 ± 0.1 °C.
Since wall slip can be specifically apparent in suspensions [27], the absence of these phenomena was first checked following the method proposed by Yoshimura and Prud’homme [28]. Results were compared with those obtained using a 25 mm diameter plate-plate (PP) geometry considering two different gap heights. According to the method, the slip velocity v s can be determined from the flow data for two different gaps,
v s = γ ˙ R 1 ( τ R ) γ ˙ R 2 ( τ R ) 2 ( 1 H 1 1 H 2 ) ,
where γ ˙ R 1 and γ ˙ R 2 are the shear rates at the rim of the plates separated by a height H1 and H2, respectively. Therefore, the absence of wall slip is established for the PP geometry if γ ˙ R 1 and γ ˙ R 2 are coincident in the whole interval of the stresses evaluated. As seen in Figure 1, flow curves coincide for all stress values, indicating that wall slip is absent.
All samples were pre-sheared in order to erase any previous shear history associated with the placement of the sample in the rheometer and ensuring the reproducibility of results. So, before each experiment a pre-shear of 50 Pa was applied up to an equilibrium state ( Δ η η 0.01 for 10 s ) was achieved. Then, the sample was kept at rest for 1600 s, which was the period of time for gaining the maximum equilibrium structure [29], as it is described below.

2.3. Resting Time

After the pre-shear stage and before rheological tests were performed, samples were kept at rest the minimum time interval that was necessary to obtain the most developed equilibrium structure. The minimum resting time was obtained by applying a small amplitude oscillation to samples and following the evolution with time of the elastic modulus (G’). According to Raghavan and Khan [29], the values of G’ during the recovery stage is characteristic of the strength of the microstructure present in the suspension. Using low amplitude oscillatory shear, the microstructure does not break appreciably during the measurement. Therefore, the results obtained in this way mainly express structural build up at rest.
It can be seen in Figure 2 that, for the R816/PPG400 suspension, around 1600 s are necessary to develop its maximum at-rest-microstructure. Beyond this time interval, the values of G’ remain approximately constant. In other words, the size of the agglomerates of Aerosil® R816 particles in PPG400 achieved the biggest value after 1600 s of rest. It is worthy to note that the difference between G’-values at t = 0 and t = 1600 s is less than 6 Pa, which is a clear indication of the low particle aggregation level that the suspension achieves at rest. This is, by the way, a well-established condition for the shear-thickening observation in concentrated suspensions [30]. It is also worthy to note that the solid volume concentration of R816/PPG400 suspensions used in this study is relatively small (12.5 vol%) when is calculated assuming that silica particles are Euclidean. However, it is well known that fumed silica particles form fractal opened loose aggregates [31], which means that the effective solid volume fraction must be higher than the Euclidean value [32].

2.4. Limit of Reversibility

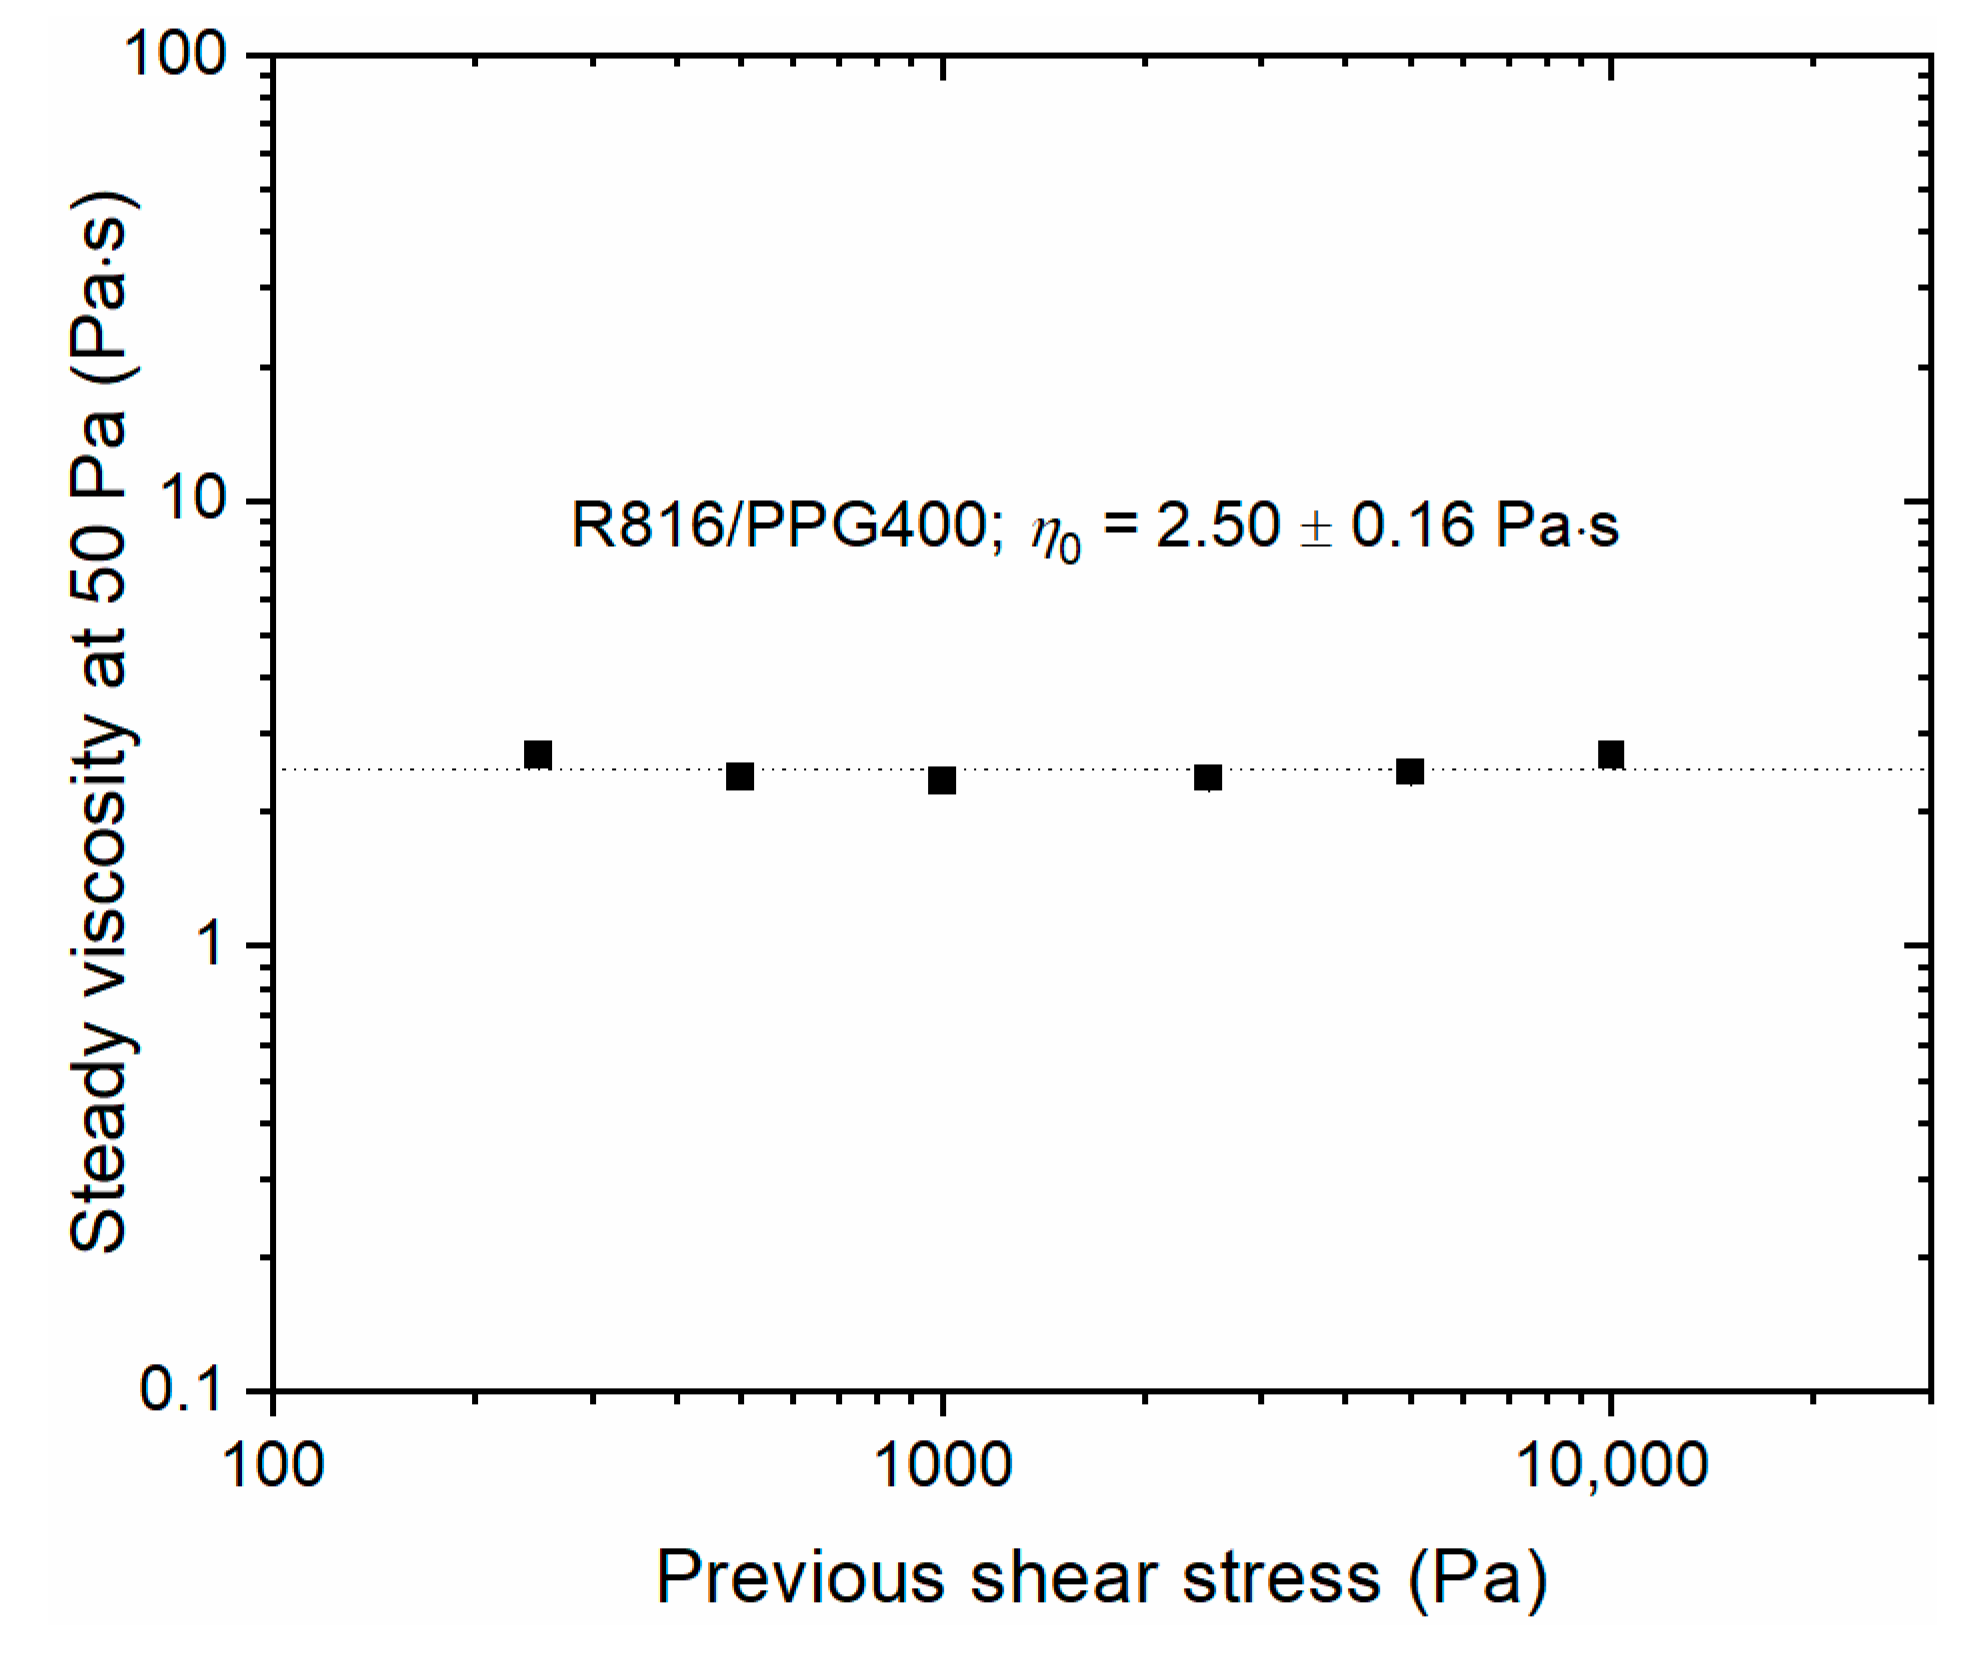
In order to determine the maximum stress value that suspension microstructure can support without showing irreversible variation of rheological parameters, the samples were sheared at 50 Pa until the steady value in the apparent viscosity ( η 0 ) was achieved and, after this, a stepwise in stress was applied at different shear stress values ( τ i = 250, 500, 1000, 2500, 5000, 10,000 Pa) during 180 s. Subsequently, samples were sheared at 50 Pa again until η 0 was finally reached. The limit of reversibility of samples was determined comparing the apparent viscosity steady values reached before and after being sheared at τ i . The maximum value of τ i after which samples were able to recover at least 90% of η 0 , was accepted as the limit of reversibility. Figure 3 shows that Aerosil® R816/PPG400 suspension was reversible at least up to 10,000 Pa. The limit of reversibility test also allows verifying the reversibility condition demanded for the thixotropy and antithixotropy behaviors studied in this work.
Summarizing, the protocol for the rheological experiments that we have performed consisted of three stages. The pre-shear was followed by a rest period and, finally, by the rheological test itself. In the next section, the results of steady and transient experiments are presented and discussed.

3. Results and Discussion

3.1. Steady Shear Experiments

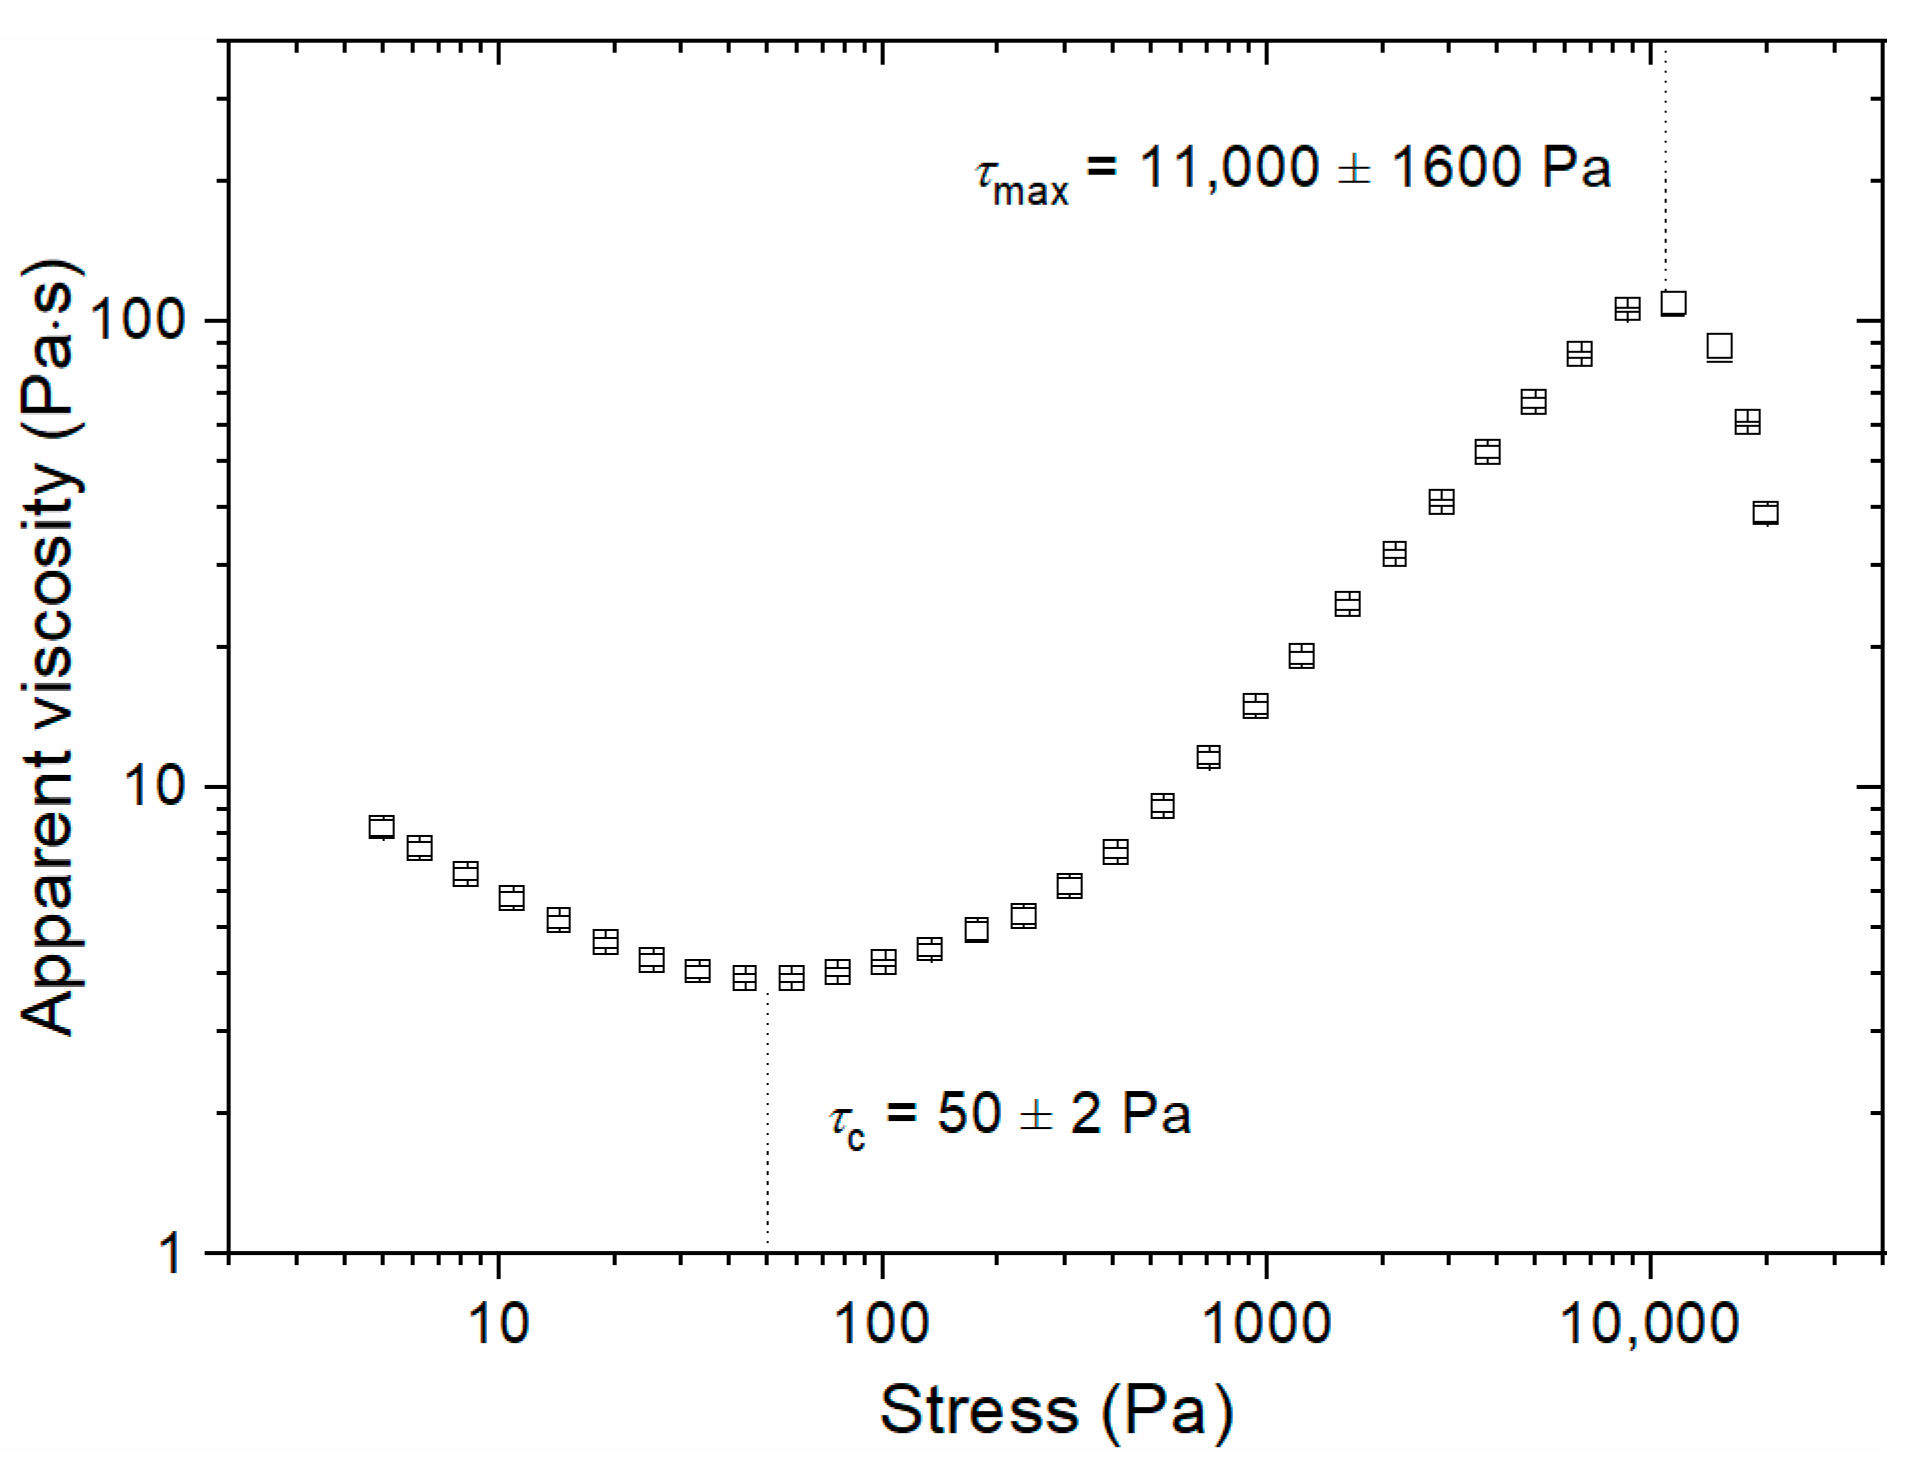
Steady flow curves were obtained by applying to samples a sweep of discrete shear stresses. The results are shown in Figure 4 as steady apparent viscosity vs. shear stress plot. Each experimental point is the average of three measurements and was recorded after the sample achieved steady state condition, i.e., Δ η η 0.01 for 10 s at each shear stress value. As it can be seen, the suspension exhibits shear-thickening behavior between two shear-thinning regions. This complex rheological behavior has been observed in suspensions of both, hydrophilic and hydrophobic fumed silica particles, dispersed in a variety of polar organic liquids such as polypropylene glycol and glycerol [24,33,34]. Although the second shear-thinning region could be in general the consequence of slip when the suspension shows solid-like behavior at the end of the shear-thickening region, this possibility was rejected in this particular case comparing results obtained with different geometric conditions (see materials and methods part). The onset of the shear-thickening behavior appears at a critical shear stress τ c = 50 ± 2 Pa and finishes at a maximum shear stress τ m = 11,000 ± 1600 Pa. The increase of the apparent viscosity over a critical shear stress would indicate that the dispersion was previously non-aggregated [30,32]. This idea could be confirmed by the fact that, as it has been pointed out [25], Aerosil® R816/PPG400 suspensions should be non-aggregated at rest because the chemical affinity of the alkyl chains covering the particles for solvents of low polarity, such as PPG400 is, allows the alkyl chains to be straightening, increasing thus the steric repulsion between particles. At stress values in the shear-thickening region ( τ c τ τ m ) the hydrodynamic drag force leads particles to approach one another, overcoming repulsive forces and forcing the formation of hydroclusters [35,36]. The difficulty of particles to move around each other in the clusters, because of lubrication forces, results in a higher energy dissipation and thus a marked increase of viscosity must be observed [36]. Confirming the existence of this mechanism for the observation of shear-thickening behavior in silica suspensions, hydroclusters formation has been directly observed with ultra-small angle neutron scattering (SANS) technique for colloidal suspensions of silica particles in polyethylene glycol [37] and with confocal microscopy for suspensions of silica spheres in water-glycerin mixtures [38]. In addition, an activation energy approach for viscous flow has confirmed the hydroclusters formation mechanism as the cause for the observation of shear-thickening behavior in R816/PPG400 suspensions [39].
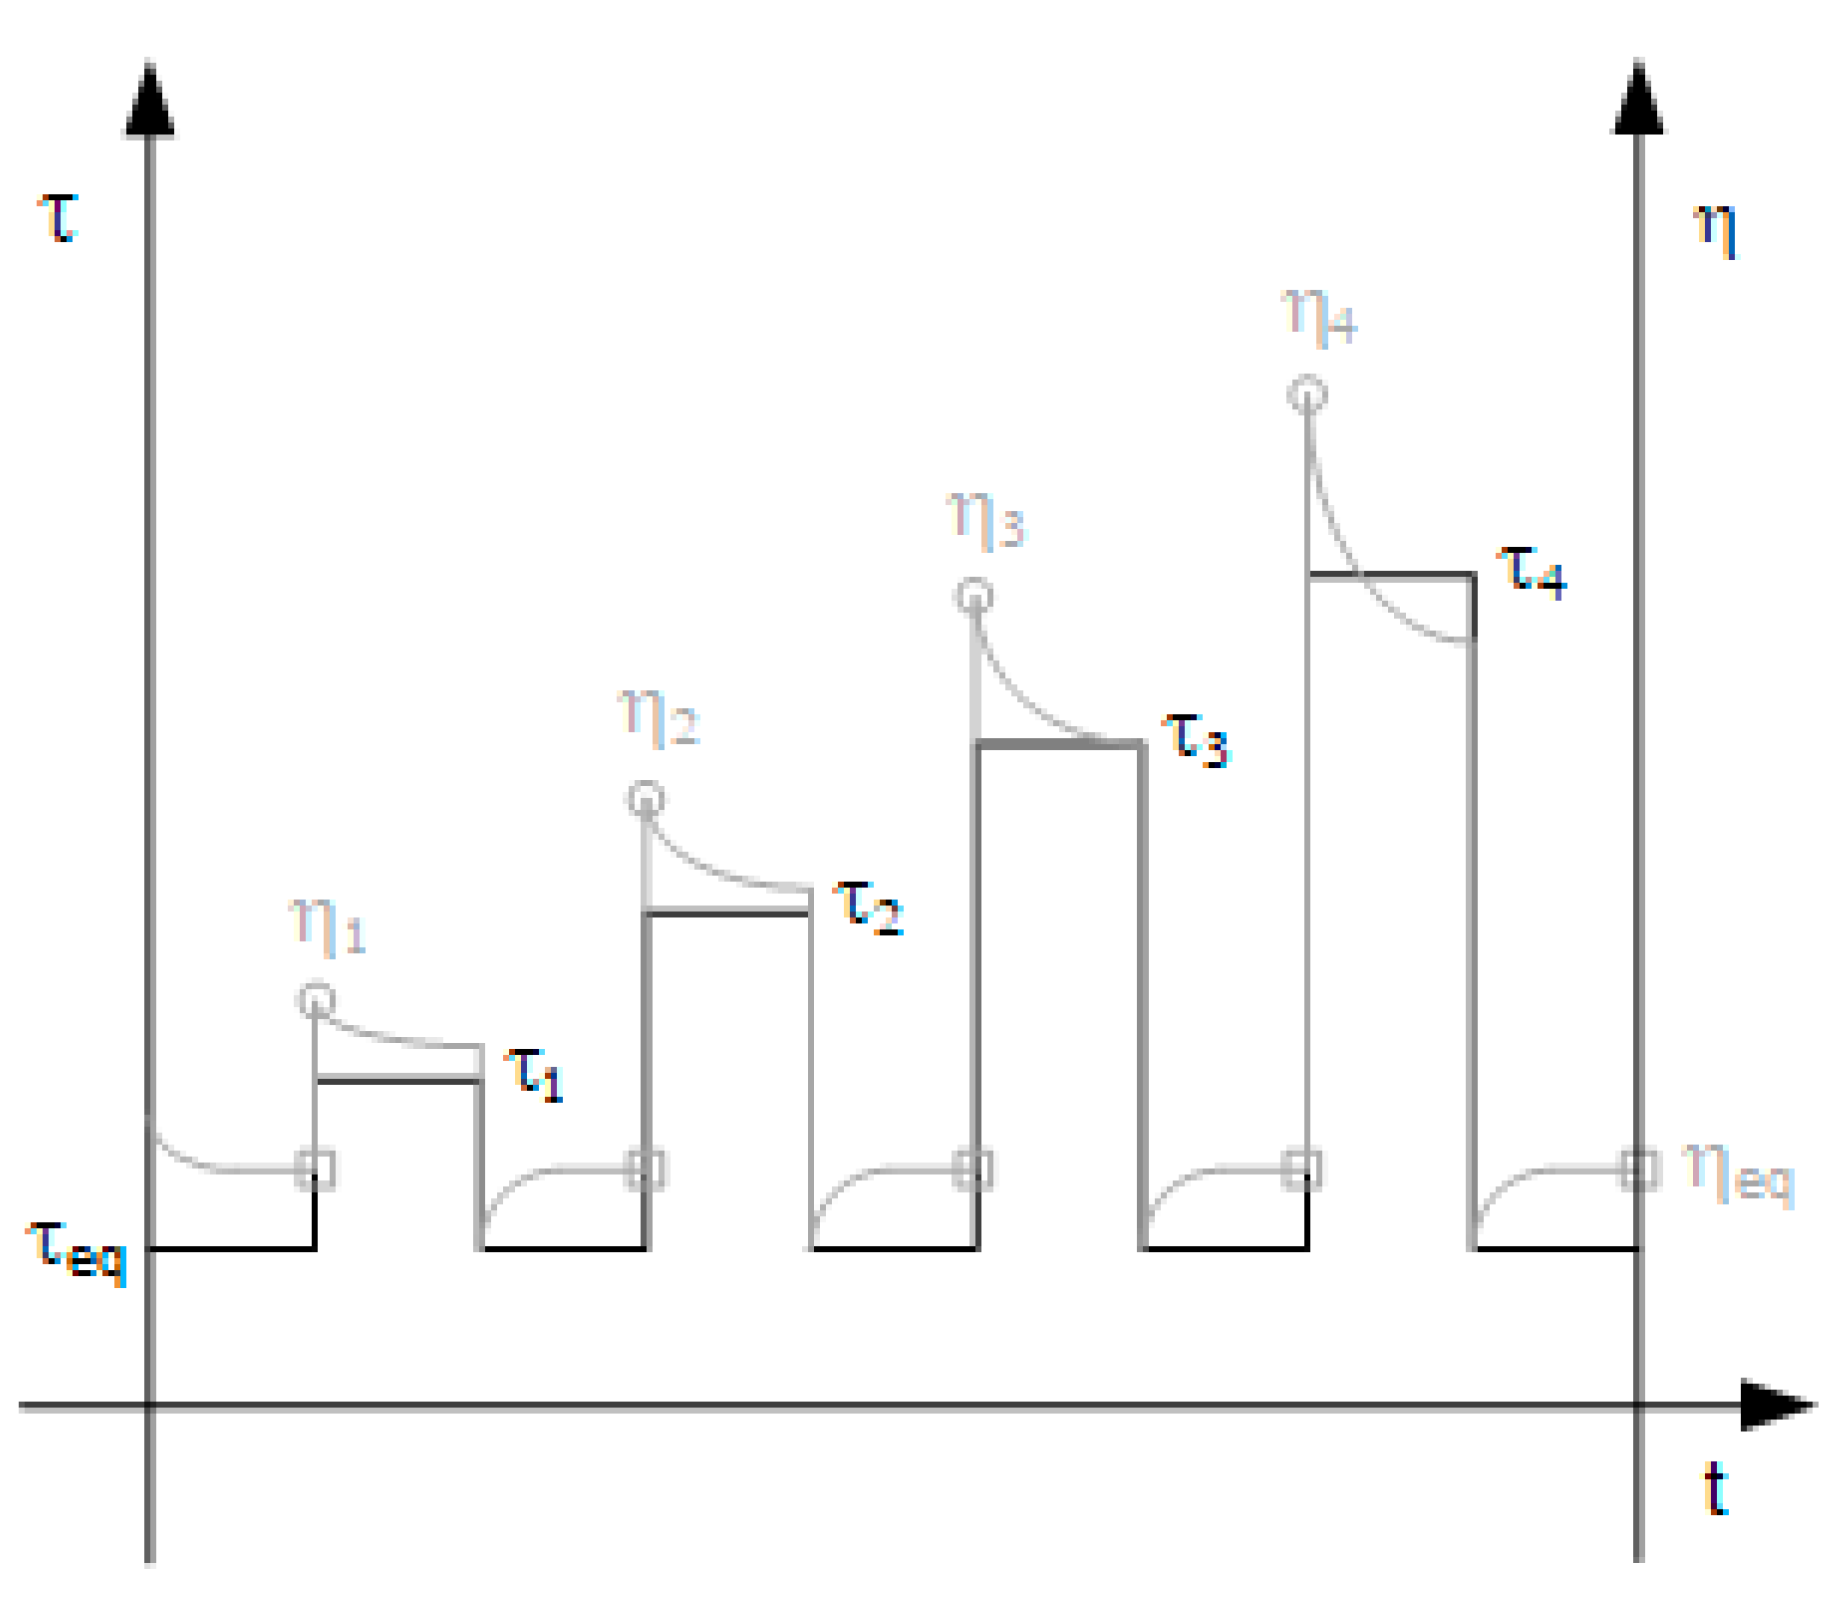
As it was pointed out before, the description of the viscous behavior of time-dependent fluids has been done in terms of the evolution of the internal microstructure that forms with the shear flow [5]. It is reasonable to expect that different structural levels be are achieved depending on the shear intensity. Cheng [40] proposed a rheological method to compare the microstructure strength achieved by the fluid at different shear stress values. As it is shown in Figure 5, Cheng’s method consists of applying consecutive step changes in stress from an equilibrium state ( τ e q ) to different stress values ( τ k , k = 1, …, n) and recording the peak values in viscosity ( η k , k = 1, …, n). In this way, the steady microstructure corresponding to different τ e q -values can be characterized. Each step must be applied just after the same reference steady viscosity value ( η e q ) is reached. In this way, initial viscosity values ( η k ) corresponding to each τ k refer to the same internal structure, which is formed when the steady state is achieved from the application of τ e q . Therefore, a series of different constant structure curves can be obtained by plotting η k versus τ k for several τ e q -values. Constant structure curves overlap when suspensions are non-aggregated. On the contrary, the dependence of the viscosity peak values with τ e q is an indication of the existence of aggregates [24,41,42].
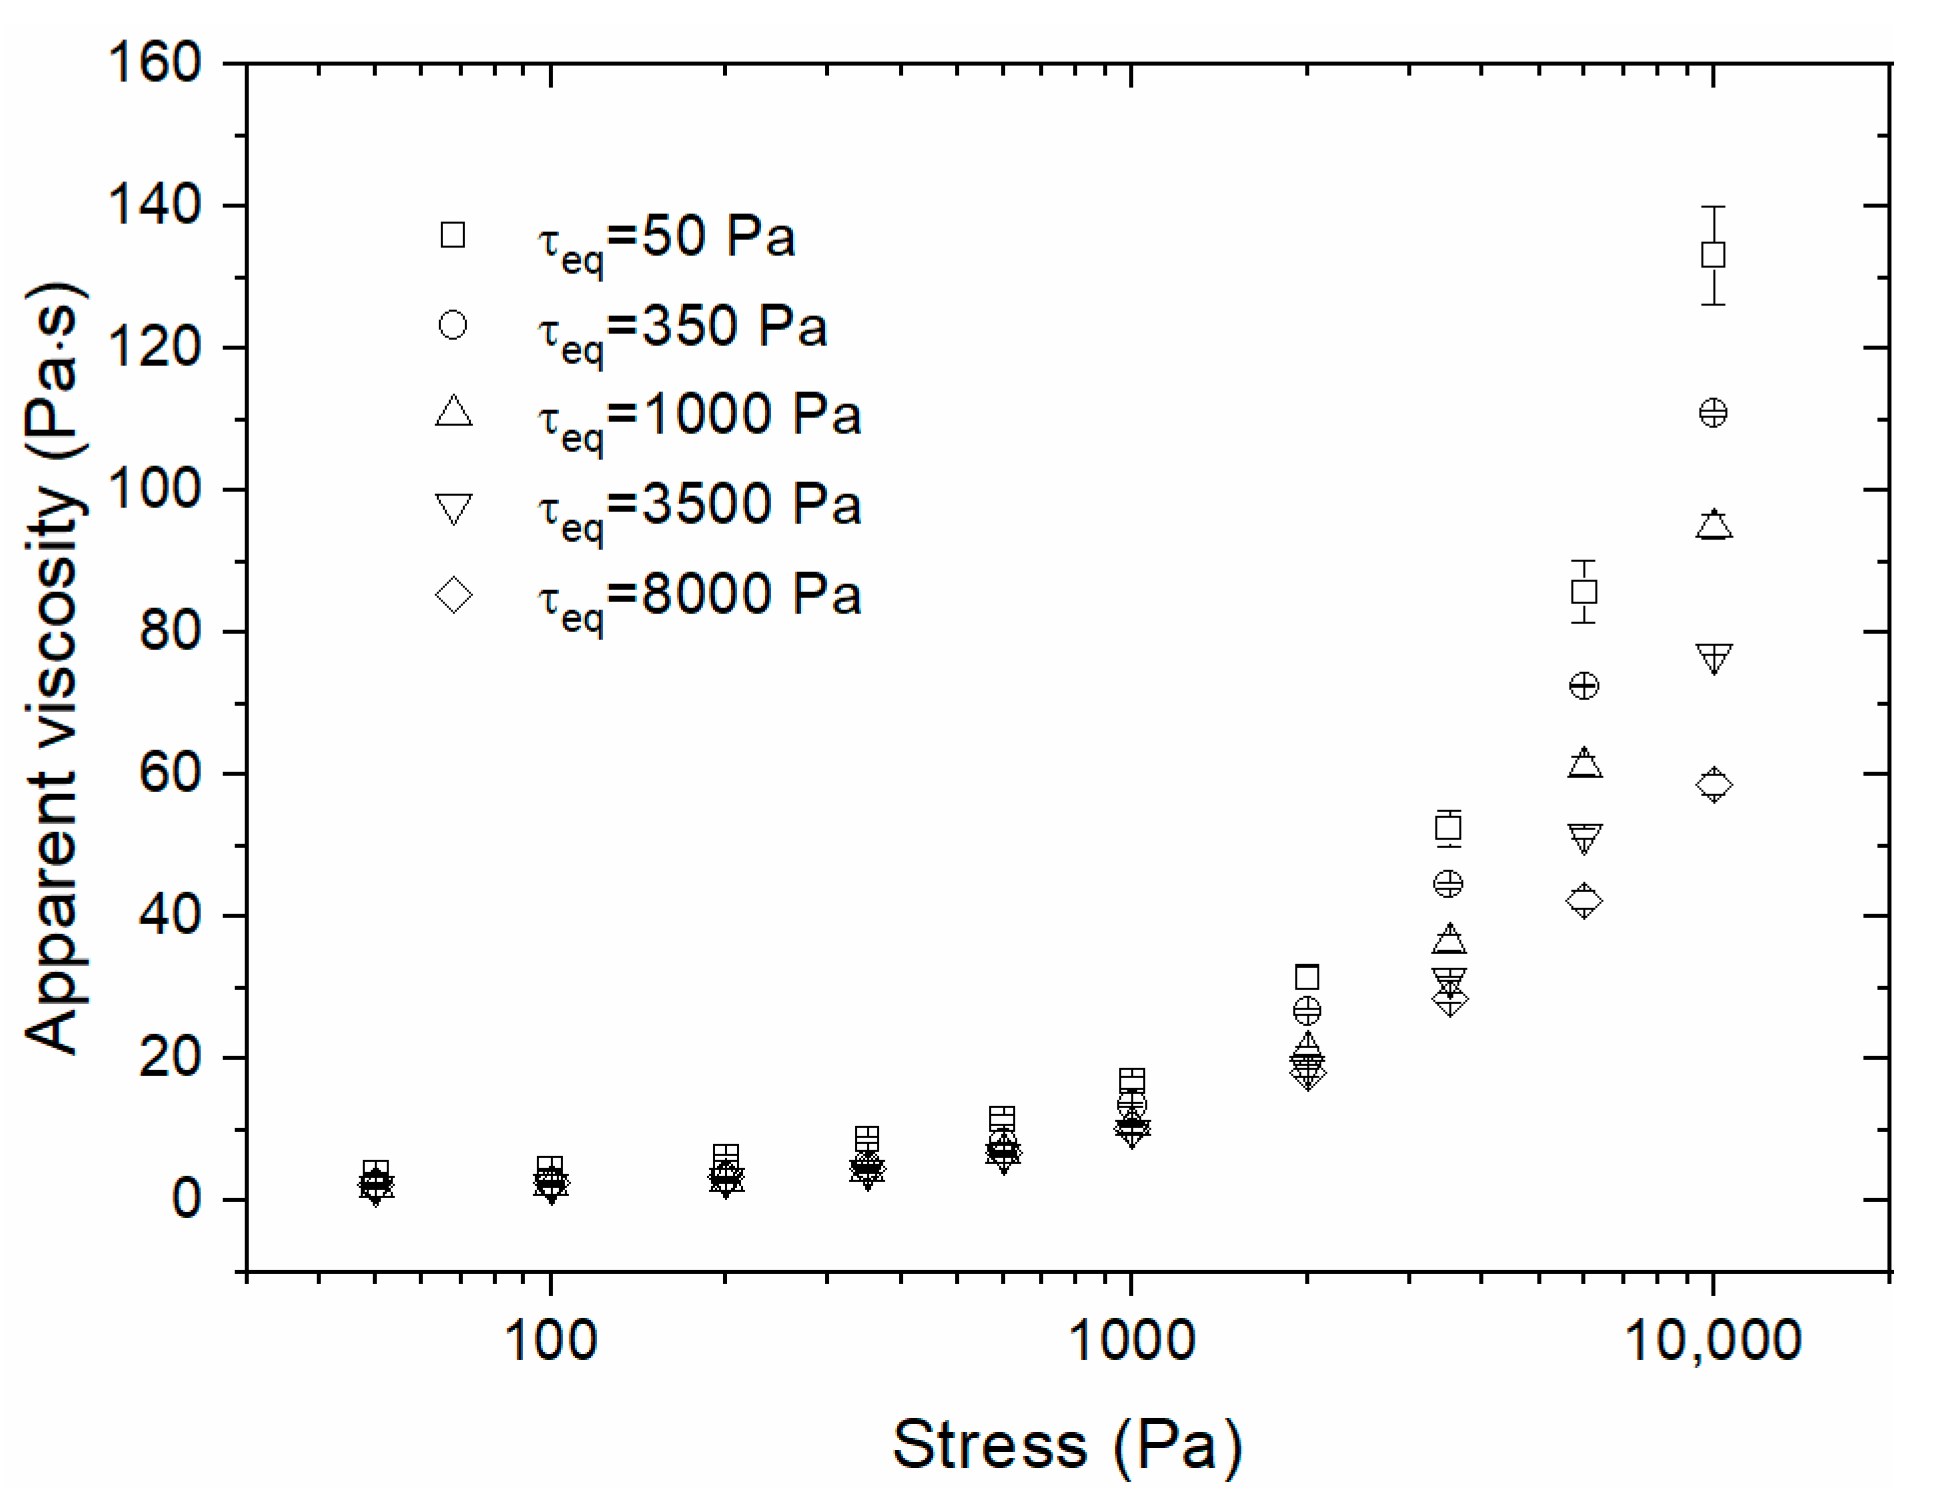
Figure 6 exhibits constant structure curves of R816/PPG400 suspension corresponding to the reversible shear-thickening region. As can be observed, there is a strong dependence of viscosity peak values with τ e q . This is evidenced by the non-concurrence of the curves after a perturbation stress of 1000 Pa (the apparently coincidence of the curves below 1000 Pa is due to the difficulty of discerning peak values of viscosity when relatively small stresses are applied). For low values of τ e q , Figure 6 shows high viscosity peak values. It is reasonable to think that at low values of τ e q , but belong to the shear-thickening region, the internal microstructure consists of hydroclusters small enough to give place to relatively low steady viscosity values (Figure 4). Thus, and according to which was postulated by Raghavan and Khan [29], once the stress is suddenly increased, starting from a state in which small hydroclusters are built, particle reorganization must lead to a higher number of links among the small hydroclusters. This fact results in the formation of comparative large new hydroclusters and, consequently, to the observation of a higher viscosity due to enhanced distortion of the flow field and more amount of liquid phase entrapped into the opened hydroclusters. Moreover, viscosity values (Figure 6) indicate that hydroclusters become bigger when τ k increases. Therefore, the structural state existing at each equilibrium state affect the subsequent formation or disruption of new hydroclusters, depending on whether the perturbation step is up or down. These results indicate that in R816/PPG400 suspension hydroclusters form with different sizes depending on the stress applied in the shear thickening region. This result agrees with what is expected [42] but is contrary to what was found by Galindo-Rosales et al. [24] (10 wt%). In that case, the control rate mode was used instead of the control stress mode, and the constant structure curves corresponding to the shear-thickening region overlapped. These results on dilute and concentrated R816/PPG400 suspensions suggest that the hydroclusters size in dilute suspensions did not vary significantly when the shear rate increased opposite to what happens in more concentrated suspensions.

3.2. Step experiments

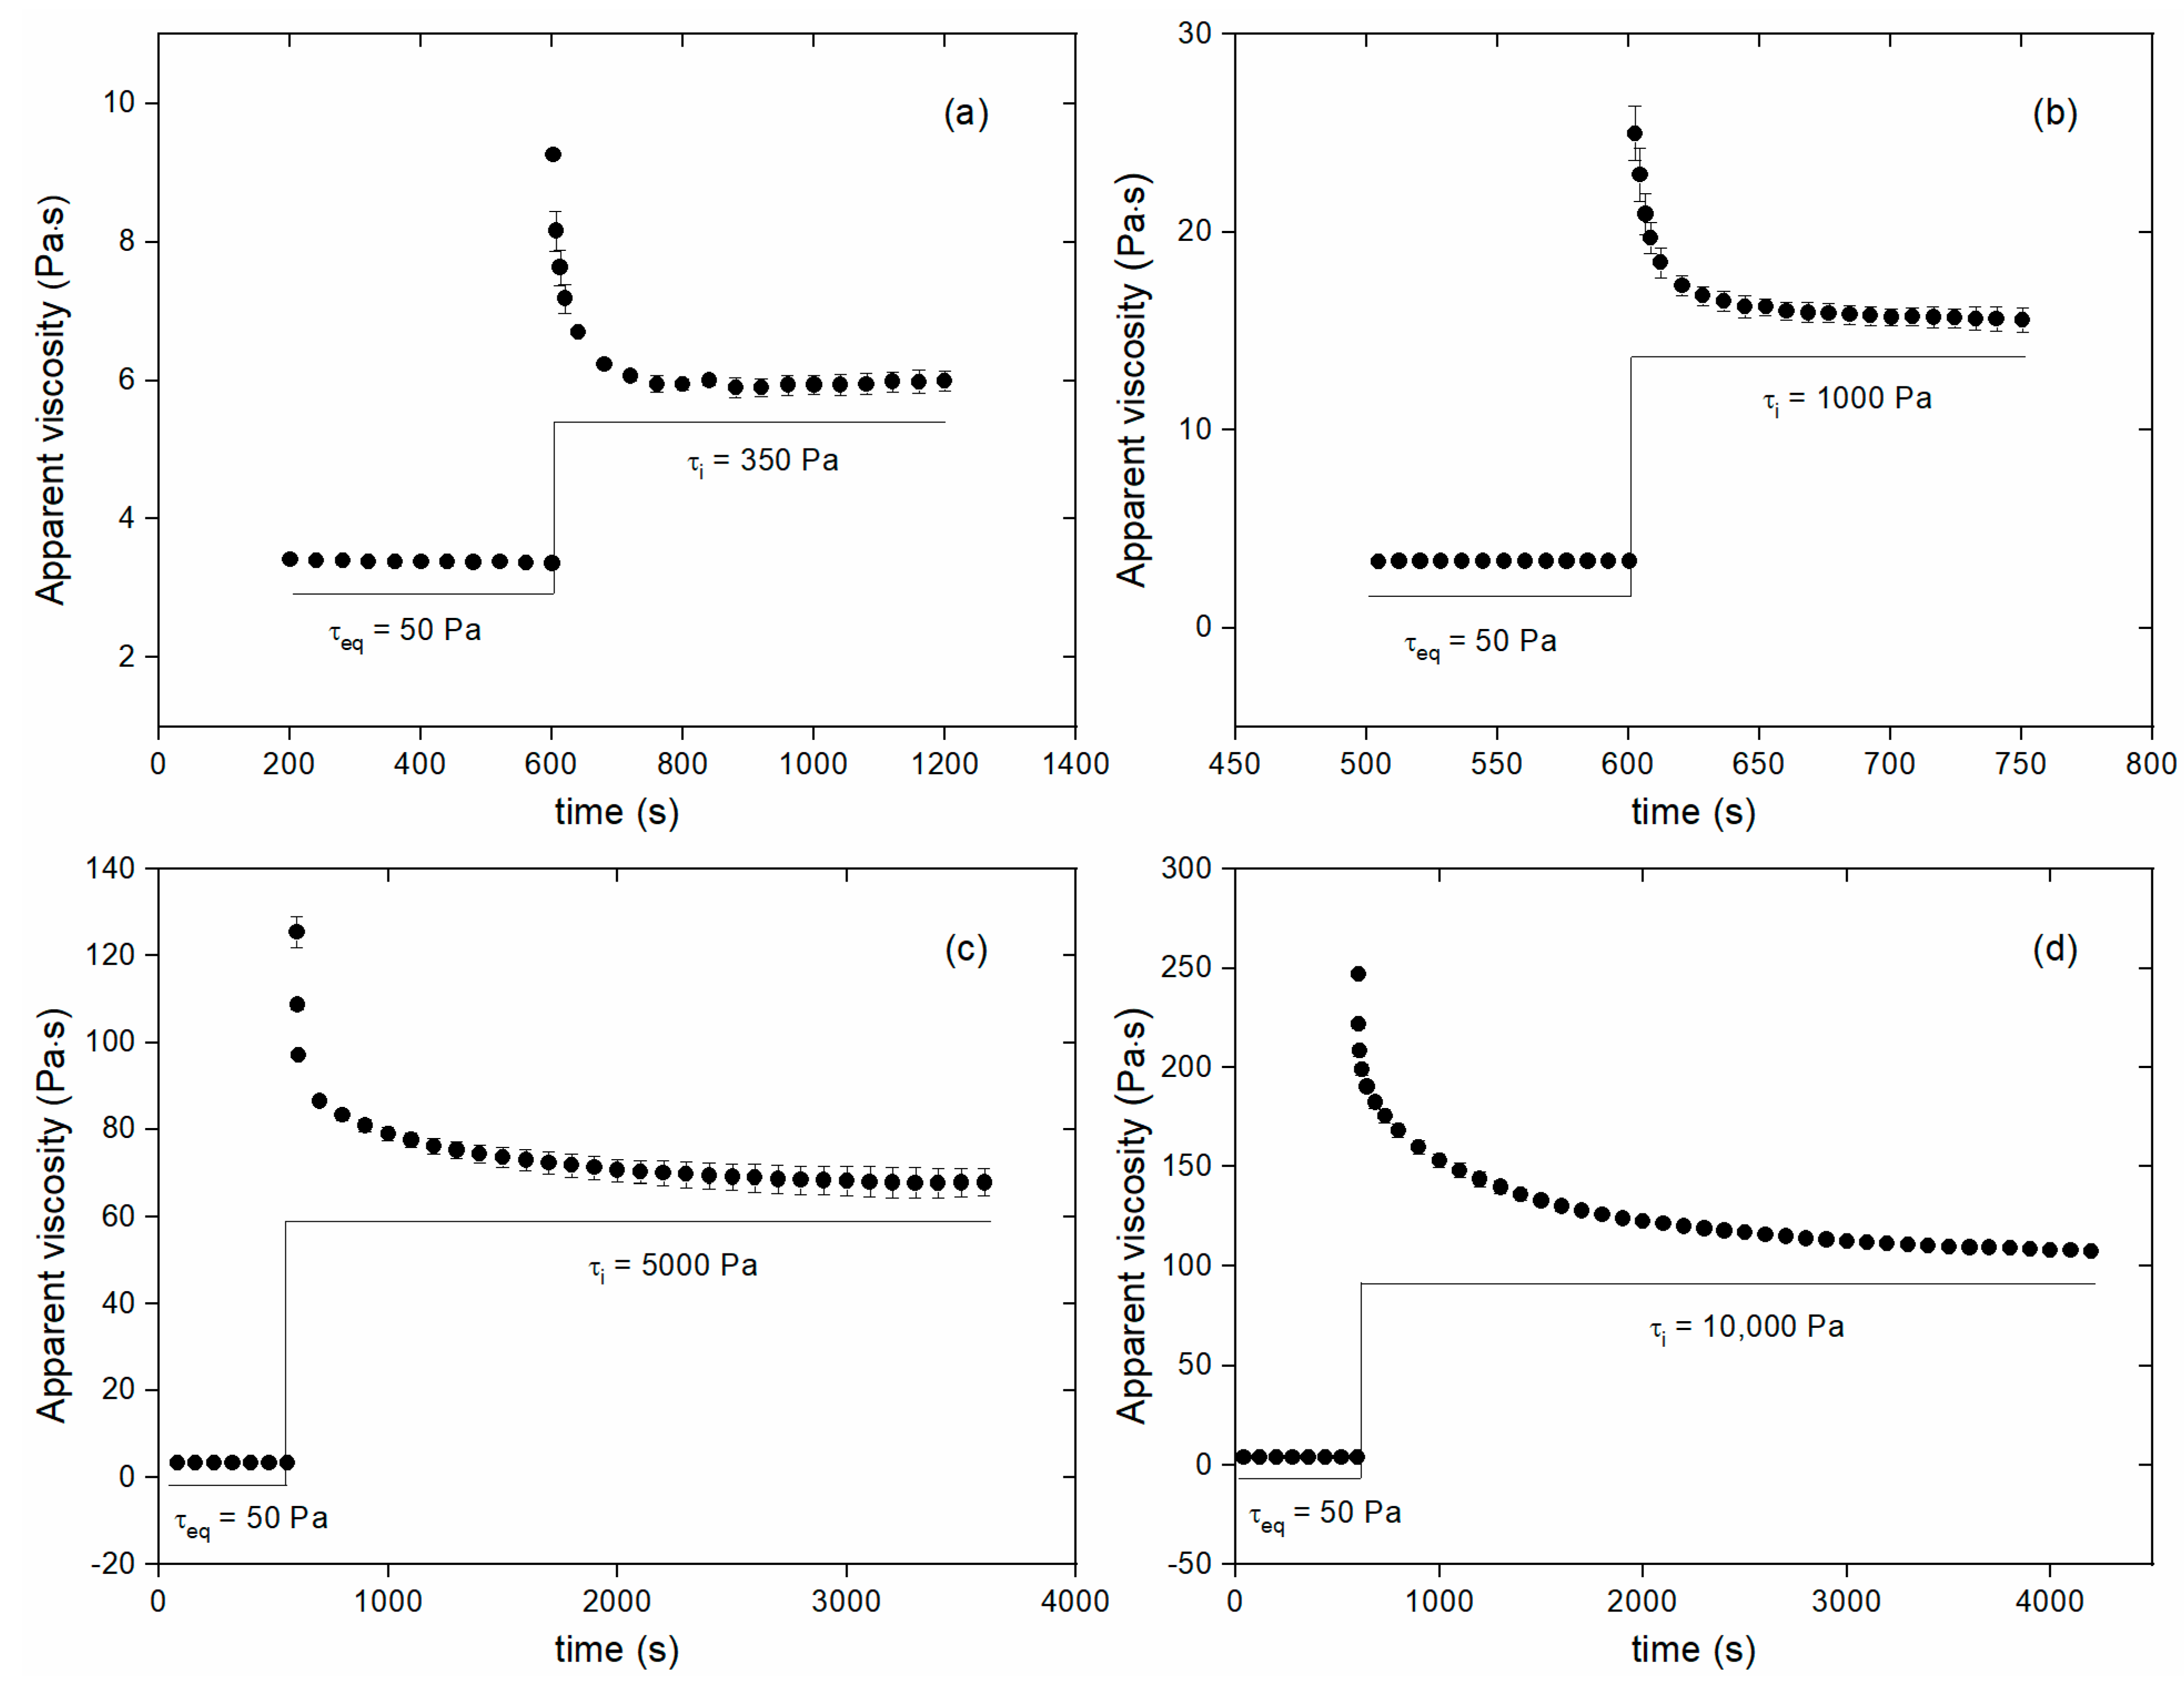
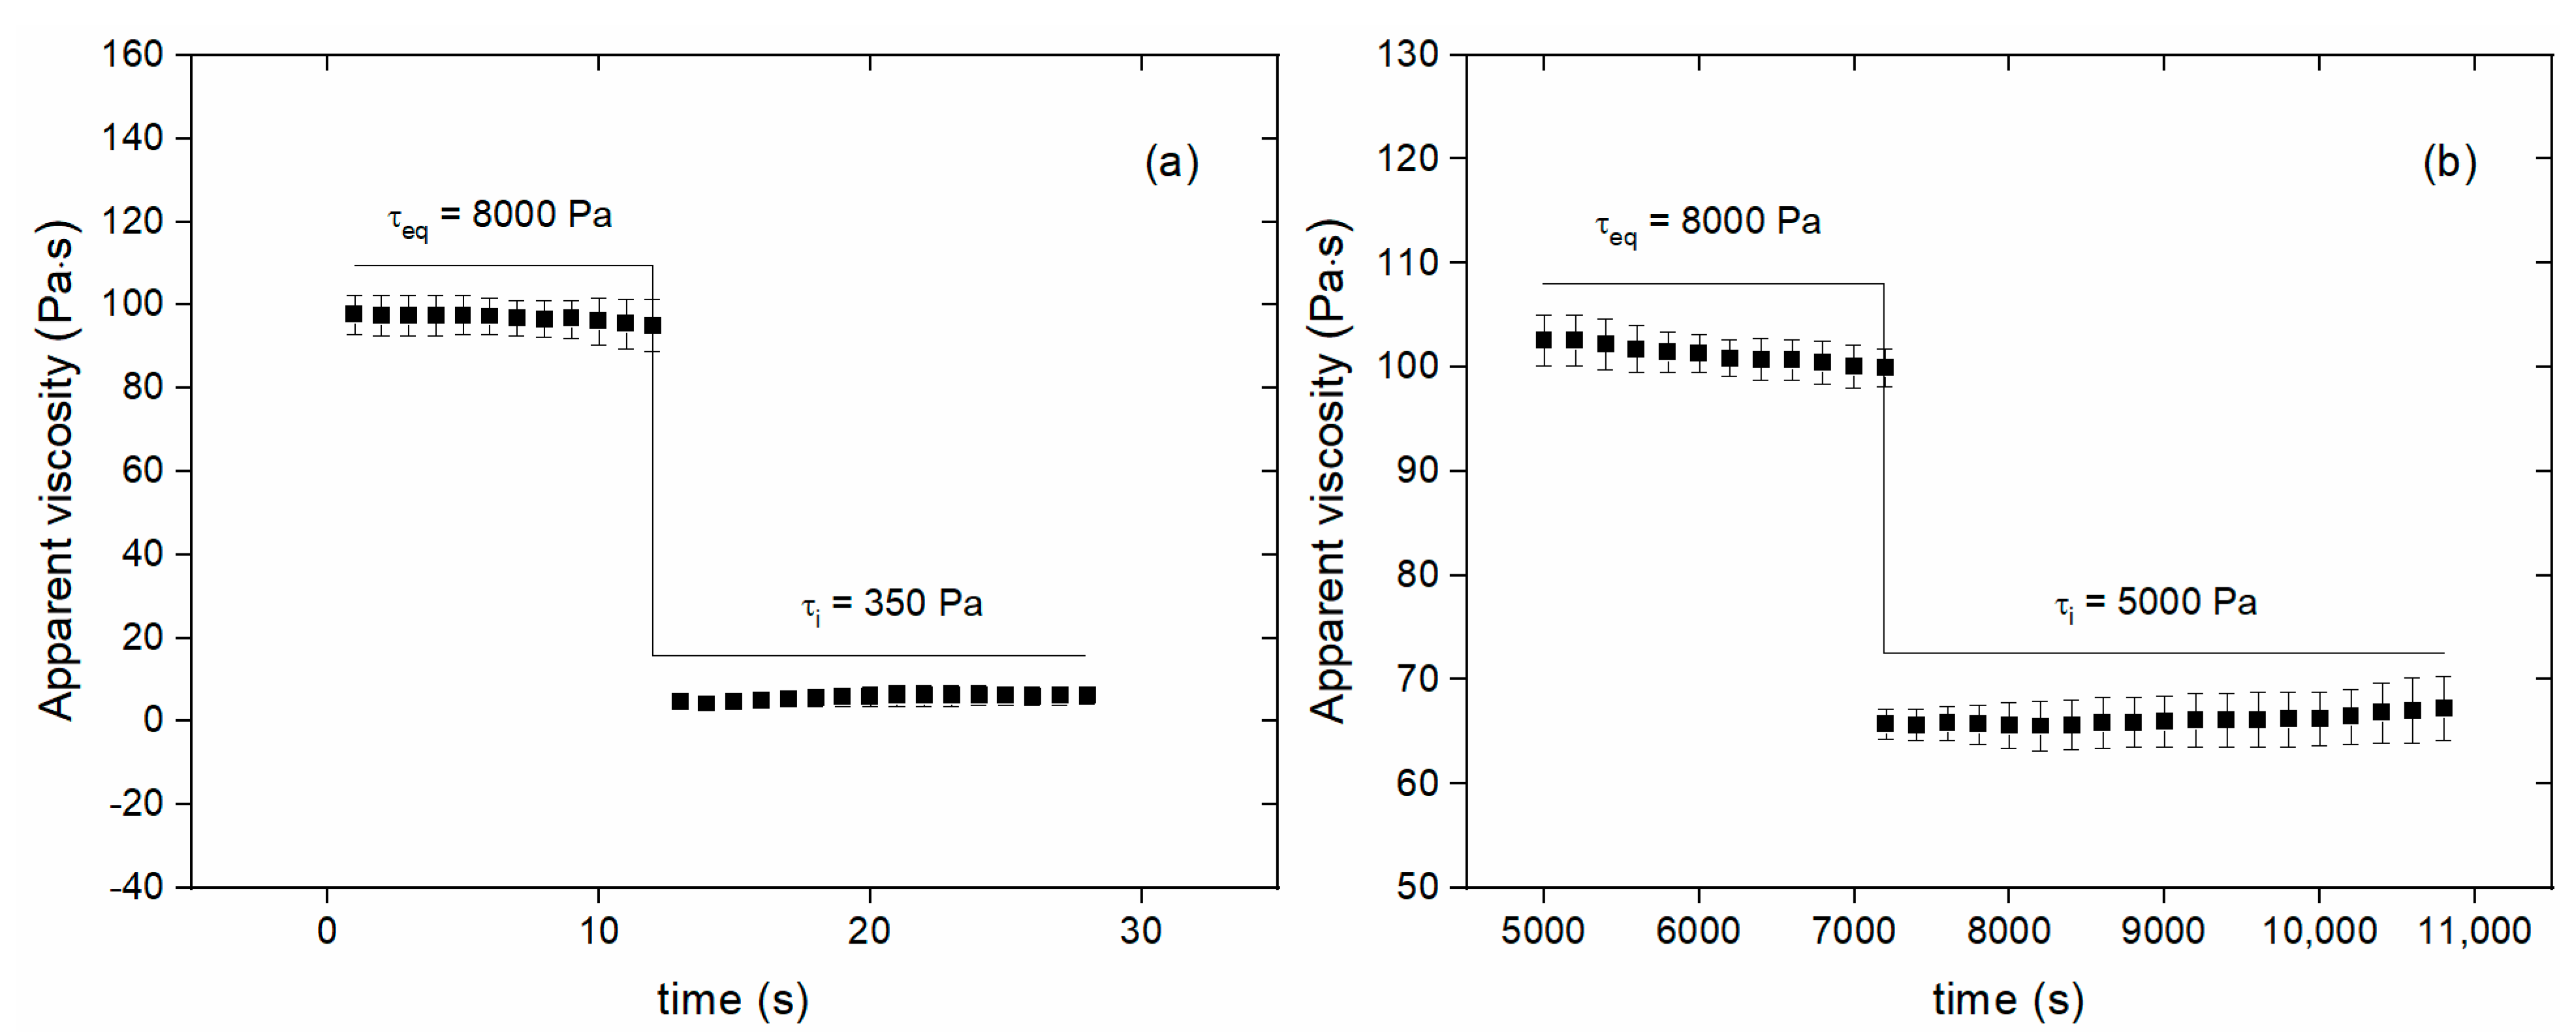
It is widely known that suspensions of fumed silica show thixotropic behavior [43,44,45] due to percolation of particles. Since Aerosil® R816 in PPG400 exhibits shear thickening behavior, we were motivated to think that this suspension would exhibit anti-thixotropic behavior in the shear-thickening region, according with what has been explicitly suggested, for example, by Barnes et al. [17]. Anti-thixotropy or negative thixotropy implies a reversible and gradual increase with time of the viscosity when the shear rate (or shear stress) is suddenly increased [2]. We have studied viscous time-dependent behavior by tracking the response of sample resulting from stepwise changes. This procedure has already been used in earlier rheological studies on anti-thixotropy [46,47] because adapt right-well to the definition. The rheological test consisted of two consecutive shear stress steps within the reversible shear-thickening region. This is the best option for this kind of studies when a control stress rheometer is used [26]. The sample was initially sheared at the critical shear stress ( τ c = 50 Pa) with the aim of completely breaking the structure, considering the fact that this stress value is not only the onset of shear-thickening behavior but also the end of the first shear-thinning region. Once the steady state was achieved with enough application of this initial shear stress, a shear step was applied at higher stresses ( τ i = 350, 1000, 5000 and 10,000 Pa). It is expected that this mechanical test gives place to a more structured material, what can be evidenced noting an increase with time of the apparent viscosity of the suspension. Therefore, during step-up tests, the suspension should progressively evolve from a completely disaggregated structure, provoked by shearing the sample with the stress value corresponding to the end of the first shear-thinning region, to an aggregated structural state due to the formation of hydroclusters. Additionally, step-down experiments were also performed. The sample was initially sheared at τ = 8000 Pa until reaching an equilibrium state consisting of a remarkably structured state due to the relatively big size the hydroclusters reach when shear stresses of the shear-thickening region are applied. Afterwards, steps to lower stresses ( τ i = 350, 1000 and 5000 Pa) were applied to the sample. In this case, it is expected that the suspension evolves toward a less aggregated state because the size of the hydroclusters logically should decrease.
However, opposite to what has been described, results for step-up experiments in the shear-thickening region, Figure 7, show a decrease in the viscosity response to a new equilibrium value, which is typical of a thixotropic behavior. As it can be seen, the difference between the steady viscosity value at the end of the initial shearing (50 Pa) and the first measured viscosity value when the step-up is applied, is higher when the final shear stress is higher. Additionally, it was observed that the steady shear viscosity value is achieved later the higher the shear step-up is. The continuous decrease of viscosity with time when stress increases is apparently contrary to what is assumed for shear-thickening materials and was confirmed elsewhere for this material [23]. An explanation for this unexpected result is proposed as follow. The “instantaneous” increase of the viscosity could be possibly due to an extremely fast hydroclusters formation (jamming) just when a step-up in shear stress, corresponding to the shear-thickening region, is applied. On the other hand, an erosion process that makes the initial hydroclusters size, could justify the subsequent viscosity decreases with time. In other words, the initial large size of hydroclusters that result for the action of the step-up in shear stress, trends to maintain while the constant shear stress is continued. However, they progressively erode by the action of Brownian forces until reaching its final equilibrium size, exhibiting the suspension a monotonic decrease with time of the viscosity, that can be erroneously interpreted as a thixotropic behavior. To evaluate the duration of the jamming process, the characteristic time ( t s ) representing the shear action that provokes the fast (“instantaneous”) hydroclusters initial formation has been estimated with the inverse of the shear rate,
t s = 1 γ ˙ = η τ .
Using initial viscosity values shown in Figure 7, an extremely low average shear time value t s = 23 ± 3   ms was obtained, i.e., the jamming process is very fast. The question still opened is to find reasons for such a fast particle jamming or initial hydroclusters formation. Elsewhere [23] we could confirm that the viscosity continuously increases with time (anti-thixotropy) when measurements of the viscosity were recorded at times lower than 1 or 2 s. The subsequent decrease of the viscosity with time, which, on the other hand, can be confused with the thixotropic behavior of shear-thickening suspensions, put in evidence that TDV measurements should be scrupulously designed to avoid misinterpretations.
The characteristic time for the Brownian effect in the variation of the microstructure, which is the cause for the erosion of hydroclusters according with our hypothesis, must results from the combination of mean displacement and Stokes-Einstein equation for particle diffusion [48],
t B = 3 π η d 3 2 k T ,
where η is the viscosity of the suspension, k is the Boltzmann constant, d is the particle diameter, and T is the absolute temperature. A useful expression can be obtained from the ratio of both characteristic times as it explicitly depends on the final shear stress value imposed with a step-up test,
t B t s = 3 π τ d 3 2 k T .
For the case of 100 nm fumed silica particles at 25 °C, we get:
t B t S = 1.15 τ
where τ is expressed in Pa. Therefore, substituting the values τ i = 350, 1000, 5000, and 10,000 Pa in Equation (5), it is obtained ( t B / t s = 403, 1150, 5750, and 11,500, respectively) that the higher the shear stress value applied with the step-up test the slower the diffusion of particles, according with was experimentally observed.
On the other hand, step-down experiments showed a discontinuity in the response followed by a gradual, although slight, increase in the viscosity value (Figure 8), which also reminds of thixotropic behavior. Note again that the data were recorded as per usual, after lapsing high time intervals compared to the characteristic time for shear action (Equation (2)). When shear stress abruptly decreases (step-down), repulsive steric forces must overcome hydrodynamic ones, which should lead to hydroclusters disaggregation and the decrease of viscosity (anti-thixotropy). This was observed elsewhere [23] when the variation of the viscosity was recorded during the first-time intervals of a few seconds. However, according to the observations (Figure 8) and opposed to what was expected, hydroclusters’ size slightly increased towards a final equilibrium size just when the step-down test was applied. Therefore, it was observed that Brownian thermal diffusion was not relevant in the variation of hydroclusters size.
The overall conclusion of these experiments is that shear-thickening suspensions can show apparent thixotropic behavior due to the fact that the formation of hydroclusters is virtually “instantaneous” (jamming) when a sudden step-up shear stress is applied, and it is followed by a progressive erosion of the hydroclusters due to Brownian thermal diffusion until the steady hydroclusters size is finally achieved. Apparent thixotropic behavior is also observed with step-down tests, although the effect is less visible because the final size of the hydroclusters is almost instantaneously reached.

4. Conclusions

In this work, we studied the transient viscous behavior of 24 wt% (12.5 vol%) Aerosil® R816 suspensions in polypropylene glycol (400 g/mol) at 25 °C, using stress-controlled rotational rheometry. Steady experiments show shear thickening behavior over a critical shear stress (50 Pa) and until a maximum shear stress value (11,000 Pa).
Referring to the reversible shear-thickening region, the application of stepwise in stress tests, allowed us to conclude that:
  • The steady viscosity response depends on the previous state of aggregation, indicating the existence of aggregates (hydroclusters) in the suspension at rest;
  • The suspension showed apparent thixotropic behavior in the shear-thickening region, contrary to what has been usually assumed. This result can be justified by the fast hydroclusters formation due to step-up in shear stress followed by the erosion of these aggregates caused by Brownian thermal diffusion of silica particles.

Author Contributions

Conceptualization, J.H.S. and F.J.R.-H.; methodology, J.H.S., F.J.R.-H. and N.M.P.-F.; formal analysis, J.H.S. and F.J.R.-H.; investigation, J.H.S., F.J.R.-H. and N.M.P.-F.; resources, F.J.R.-H.; data curation, J.H.S. and F.J.R.-H.; writing—original draft preparation, J.H.S.; writing—review and editing, J.H.S. and F.J.R.-H.; funding acquisition, J.H.S. All authors have read and agreed to the published version of the manuscript.

Funding

This research received no external funding.

Institutional Review Board Statement

Not applicable.

Informed Consent Statement

Not applicable.

Data Availability Statement

Data is contained within the article.

Acknowledgments

The authors thank EVONIK A.G. for kindly supplying Aerosil® R816. J.H. Sánchez expresses his gratitude for the grant (Becas Movilidad para Estancias Postdoctorales en Universidades Andaluzas) received from the Asociación Universitaria Iberoamericana de Postgrado (AUIP, España) for the postdoctoral internship.

Conflicts of Interest

The authors declare no conflict of interest.

References

  1. Barnes, H.A. Thixotropy-a review. J. Non-Newton Fluid 1997, 70, 1–33. [Google Scholar] [CrossRef]
  2. Mewis, J.; Wagner, N.J. Thixotropy. Adv. Colloid Interface 2009, 147–148, 214–227. [Google Scholar] [CrossRef] [PubMed]
  3. Buitenhuis, J.; Pönitsch, M. Negative thixotropy of polymer solutions. 1. A model explaining time-dependent viscosity. Colloid Polym. Sci. 2003, 281, 253–259. [Google Scholar] [CrossRef]
  4. Larson, R.G. Constitutive equations for thixotropic fluids. J. Rheol. 2015, 59, 595–611. [Google Scholar] [CrossRef]
  5. Ostwald, W. Ueber die Geschwindigkeitsfunktion der Viskositat Disperser Systeme. I. Kolloid Z. 1925, 36, 99–117. [Google Scholar] [CrossRef]
  6. De Kee, D.; Chan Man Fong, C.F. Rheological properties of structured fluids. Polym. Eng. Sci. 1994, 34, 438–445. [Google Scholar] [CrossRef]
  7. Fredrickson, A.G. A model for the thixotropy of suspensions. AIChE J. 1970, 16, 436–441. [Google Scholar] [CrossRef]
  8. Alvarez, M.; Canet, W. Time-independent and time-dependent rheological characterization of vegetable-based infant purees. J. Food Eng. 2013, 114, 449–464. [Google Scholar] [CrossRef] [Green Version]
  9. Jarny, S.; Roussel, N.; Rodts, S.; Bertrand, F.; Le Roy, R.; Coussot, P. Rheological behavior of cement pastes from MRI velocimetry. Cement. Concr. Res. 2005, 35, 1873–1881. [Google Scholar] [CrossRef]
  10. Klein, B.; Hallbom, D.J. Modifying the rheology of nickel laterite suspensions. Miner Eng. 2002, 15, 745–749. [Google Scholar] [CrossRef]
  11. Roseley, A.S.M.; Rojo, E.; Ansell, M.P.; Smedley, D. Creep response of thixotropic ambient temperature cure adhesives measured by DMTA in static tension and shear. Int. J. Adhes. Adhes. 2011, 31, 575–582. [Google Scholar] [CrossRef]
  12. Keshtkar, M.; Heuzey, M.C.; Carreau, P.J. Rheological behavior of fiber-filled model suspensions: Effect of fiber flexibility. J. Rheol. 2009, 53, 631–650. [Google Scholar] [CrossRef]
  13. Quemada, D. Rheological modelling of complex fluids. I. The concept of effective volume fraction revisited. Eur. Phys. J. Appl. Phys. 1998, 1, 119–127. [Google Scholar] [CrossRef]
  14. Murshed, S.M.S.; Leong, K.C.; Yang, C. Investigations of thermal conductivity and viscosity of nanofluids. Int. J. Therm. Sci. 2008, 47, 560–568. [Google Scholar] [CrossRef]
  15. Mueller, S.; Llewellin, E.W.; Mader, H.M. The rheology of suspensions of solid particles. Proc. R. Soc. A 2010, 466, 1201–1228. [Google Scholar] [CrossRef] [Green Version]
  16. Mewis, J.; Wagner, N.J. Colloidal Suspension Rheology; Cambridge University Press: New York, NY, USA, 2012. [Google Scholar]
  17. Barnes, H.A.; Hutton, J.F.; Walters, K. An Introduction to Rheology; Elsevier: Amsterdam, The Netherlands, 1989. [Google Scholar]
  18. Abu-Jdayil, B. Modelling the time-dependent rheological behavior of semisolid foodstuffs. J. Food Eng. 2003, 57, 97–102. [Google Scholar] [CrossRef]
  19. Bekkour, K.; Scrivener, O. Time-Dependent and Flow Properties of Foams. Mech. Time-Depend Mat. 1998, 2, 171–193. [Google Scholar] [CrossRef]
  20. Sha, J.; Zhang, F.; Zhang, H. Thixotropic flow behavior in chemical pulp fibre suspensions. Bioresources 2016, 11, 3481–3493. [Google Scholar] [CrossRef] [Green Version]
  21. Calero, N.; Santos, J.; Muñoz, J. Methodology to estimate the yield stress applied to ultraconcentrated detergents as model systems. Chem. Eng. Sci. 2017, 166, 115–121. [Google Scholar] [CrossRef]
  22. Chen, Q.; Xuan, S.; Jiang, W.; Cao, S.; Gong, X. Shear time dependent viscosity of polystyrene-ethylacrylate based shear thickening fluid. Smart Mater. Struct. 2016, 25, 045005. [Google Scholar] [CrossRef]
  23. Rubio-Hernández, F.J.; Sánchez-Toro, J.H.; Páez-Flor, N.M. Testing shear thinning/thixotropy and shear thickening/antithixotropy relationships in a fumed silica suspension. J. Rheol. 2020, 64, 785–797. [Google Scholar] [CrossRef]
  24. Galindo-Rosales, F.J.; Rubio-Hernández, F.J.; Velázquez-Navarro, J.F. Shear-thickening behavior of Aerosil® R816 nanoparticles suspensions in polar organic liquids. Rheol. Acta 2009, 48, 699–708. [Google Scholar] [CrossRef]
  25. Rubio-Hernández, F.J.; Gómez-Merino, A.I.; Páez-Flor, N.M.; Velázquez-Navarro, J.F. On the steady shear behavior of hydrophobic fumed silica suspensions in PPG and PEG of low molecular weight. Soft Mater. 2017, 15, 55–63. [Google Scholar] [CrossRef]
  26. Rubio-Hernández, F.J.; Páez-Flor, N.M.; Velázquez-Navarro, J.F. Why monotonous and non-monotonous steady-flow curves can be obtained with the same non-Newtonian fluid? A single explanation. Rheol. Acta 2018, 57, 389–396. [Google Scholar] [CrossRef]
  27. Chryss, A.G.; Bhattacharya, S.N.; Pullum, L. Rheology of shear thickening suspensions and the effects of wall slip in torsional flow. Rheol. Acta 2005, 45, 124–131. [Google Scholar] [CrossRef]
  28. Yoshimura, A.; Prud’homme, R.K. Wall Slip Corrections for Couette and Parallel Disk Viscometers. J. Rheol. 1988, 32, 53–67. [Google Scholar] [CrossRef]
  29. Raghavan, S.R.; Khan, S.A. Shear-induced microstructural changes in flocculated suspensions of fumed silica. J. Rheol. 1995, 39, 1311–1325. [Google Scholar] [CrossRef]
  30. Barnes, H.A. Shear-thickening (“dilatancy”) in suspensions of nonaggregating solid particles dispersed in Newtonian liquids. J. Rheol. 1989, 33, 329–366. [Google Scholar] [CrossRef]
  31. Eisenlauer, J.; Killmann, E. Stability of colloidal silica (aerosil) hydrosols. I. Preparation and characterization of silica (aerosil) hydrosol. J Colloid Interface Sci. 1980, 74, 108–119. [Google Scholar] [CrossRef]
  32. Raghavan, S.R.; Khan, S.A. Shear-thickening response of fumed silica suspensions under steady and oscillatory shear. J. Colloid Interface Sci. 1997, 185, 57–67. [Google Scholar] [CrossRef] [Green Version]
  33. Amiri, A.; Øye, G.; Sjöblom, J. Stability and flow-induced flocculation of fumed silica suspensions in mixture of water-glycerol. J. Disper. Sci. Technol. 2012, 33, 1247–1256. [Google Scholar] [CrossRef]
  34. Asija, N.; Chouhan, H.; Gebremeskel, S.A.; Bhatnagar, N. Influence of particle size on the low and high strain rate behavior of dense colloidal dispersions of nanosilica. J. Nanopart. Res. 2017, 19, 21. [Google Scholar] [CrossRef]
  35. Brown, E.; Jaeger, H.M. Shear thickening in concentrated suspensions: Phenomenology, mechanisms and relations to jamming. Rep. Prog. Phys. 2014, 77, 046602. [Google Scholar] [CrossRef] [PubMed] [Green Version]
  36. Wagner, N.J.; Brady, J.F. Shear thickening in colloidal dispersions. Phys. Today 2009, 62, 27–32. [Google Scholar] [CrossRef] [Green Version]
  37. Kalman, D.P.; Wagner, N.J. Microstructure of shear-thickening concentrated suspensions determined by flow-USANS. Rheol. Acta 2009, 48, 897–908. [Google Scholar] [CrossRef]
  38. Cheng, X.; McCoy, J.H.; Israelachvili, J.N.; Cohen, I. Imaging the microscopic structure of shear thinning and thickening colloidal suspensions. Science 2011, 333, 1276–1279. [Google Scholar] [CrossRef] [PubMed] [Green Version]
  39. Rubio-Hernández, F.J.; Gómez-Merino, A.I.; Delgado-García, R.; Páez-Flor, N.M. An activation energy approach for viscous flow: A complementary tool for the study of microstructural evolutions in sheared suspensions. Powder Tech. 2017, 308, 318–323. [Google Scholar] [CrossRef]
  40. Cheng, D.C.H. Yield stress: A time-dependent property and how to measure it. Rheol. Acta 1986, 25, 542–554. [Google Scholar] [CrossRef]
  41. Galindo-Rosales, F.J.; Rubio-Hernández, F.J.; Velázquez-Navarro, J.F.; Gómez-Merino, A.I. Structural level of silica-fumed aqueous suspensions. J. Am. Ceram. Soc. 2007, 90, 1641–1643. [Google Scholar] [CrossRef]
  42. Raghavan, S.R.; Hou, J.; Baker, G.L.; Khan, S.A. Colloidal interactions between particles with tethered nonpolar chains dispersed in polar media:  Direct correlation between dynamic rheology and interaction parameters. Langmuir 2000, 16, 1066–1077. [Google Scholar] [CrossRef]
  43. Barthel, H.; Dreyer, M.; Gottschalk-Gaudig, T.; Litvinov, V.; Nikitina, E. Fumed silica—Rheological additive for adhesives, resins, and paints. Macromol. Symp. 2002, 187, 573–584. [Google Scholar] [CrossRef]
  44. Dullaert, K.; Mewis, J. A structural kinetics model for thixotropy. J. Non-Newton Fluid 2006, 139, 21–30. [Google Scholar] [CrossRef]
  45. Galindo-Rosales, F.J.; Rubio-Hernandez, F.J. Static and dynamic yield stresses of Aerosil® 200 suspensions in polypropylene glycol. Appl. Rheol. 2010, 20, 22787. [Google Scholar]
  46. Ilyin, S.O.; Pupchenkov, G.S.; Krasheninnikov, A.I.; Kulichikhin, V.G.; Malkin, A.Y. Rheology of aqueous poly(ethylene oxide) solutions reinforced with bentonite clay. Colloid J. 2013, 75, 267–273. [Google Scholar] [CrossRef]
  47. Manion, S.J.; Johnson, L.L.; Fernando, R.H. Shear-thickening in aqueous surfactant-associative thickener mixtures. J. Coat Technol. Res. 2011, 8, 299–309. [Google Scholar] [CrossRef]
  48. Krishnamurthy, S.; Battacharya, P.; Phelan, P.E. Enhanced mass transport in nanofluids. Nano Lett. 2006, 6, 419–423. [Google Scholar] [CrossRef]
Figure 1. Steady flow curve of 24 wt% hydrophobic fumed silica R816 in PPG400 suspensions obtained using CP (20 mm/1°) and PP (25 mm and two gaps, 0.5 and 1 mm) geometries. The coincidence of shear rates at the different shear stress values imposed to the sample is an indication of absence of wall-slip according to the prediction of Equation (1).
Processes 09 00807 g001
Figure 2. Structural recovery of the suspension at rest after pre-shearing. Oscillatory test at low strain (0.5%) and a frequency of 1.0 Hz.
Processes 09 00807 g002
Figure 3. Steady viscosity at 50 Pa of the R816/PPG400 suspension after sheared at different stresses. The figure shows the microstructure of the sample maintains reversible when is stressed at τ i ≤ 10,000 Pa.
Processes 09 00807 g003
Figure 4. Variation of steady apparent viscosity with shear stress of the R816/PPG400 suspension.
Processes 09 00807 g004
Figure 5. Schematic representation of step changes in a shear stress experiment to obtain constant structure curves of the suspension.
Processes 09 00807 g005
Figure 6. Apparent viscosity as a function of steps in shear stress. The figure shows a series of non-overlapped constant structure curves of R816/PPG400 suspension.
Processes 09 00807 g006
Figure 7. Time response of apparent viscosity to steps-up in shear stress. The initial shear stress corresponds to 50 Pa. (a) τ i = 350 Pa; (b) τ i = 1000 Pa; (c) τ i = 5000 Pa; (d) τ i = 10,000 Pa.
Processes 09 00807 g007
Figure 8. Time response of apparent viscosity to a step down in shear stress. The initial shear stress corresponds to 8000 Pa. (a) τ i = 350 Pa; (b) τ i = 5000 Pa.
Processes 09 00807 g008
Publisher’s Note: MDPI stays neutral with regard to jurisdictional claims in published maps and institutional affiliations.