Article

Numerical Analysis on Enhancing Spray Performance of SCR Mixer Device and Heat Transfer Performance Based on Field Synergy Principle

1
School of Mechanical and Marine Engineering, Beibu Gulf University, Qinzhou 535011, China
2
Research Center of Guangxi Industrial High-Quality Development, Guangxi University of Science and Technology, Liuzhou 545006, China
*
Author to whom correspondence should be addressed.
Processes 2021, 9(5), 786; https://doi.org/10.3390/pr9050786
Submission received: 23 March 2021 / Revised: 19 April 2021 / Accepted: 26 April 2021 / Published: 29 April 2021
(This article belongs to the Special Issue Clean Combustion and Emission in Vehicle Power System)

Abstract

:
The NH3 uniformity and conversion rate produced by the urea–water solution spray system is an essential factor affecting de-NOx efficiency. In this work, a three-dimensional simulation model was developed with the CFD software and was employed to investigate the effects of two typical injection methods (wall injection and center injection) and three distribution strategies (pre-mixer, post-mixer, pre-mixer, and post-mixer) of two typical mixers on the urea conversion rate and uniformity. The field synergy principle was employed to analyze the heat transfer of different mixer flow fields. The results show that the single mixer has instability in optimizing different injection positions due to different injection methods and injection positions. The dual-mixer is stable in the optimization of the flow field under different conditions. The conclusion of the field synergy theory of the single mixer accords with the simulation result. The Fc of the dual-mixer cases is low, but the NH3 conversion and uniformity index rate are also improved due to the increase in the residence time of UWS.

1. Introduction

Diesel engines have obtained widespread application in vessels and vehicles due to the superior efficiency, performance, and emission characteristics [1]. However, people have noticed that the particulate matter (PM) and nitrogen oxides (NOx) emitted by diesel engines can cause irreversible health hazards [2]. In order to meet the emission regulations of all countries in the world [3], the emissions of diesel engines should be limited. However, it has been challenging to achieve the current emission regulations by a purification technology or exhaust gas after-treatment technology in-machine purification technology alone to meet the currently prescribed limits [4]. Thus, in-machine purification technology and exhaust gas after-treatment technology were proposed by scholars [5].
The after-treatment technologies for NOx mainly include the lean-NOx trap [6], selective catalytic reduction (SCR) [7], non-thermal plasma catalytic reduction [8], and so on. Due to the excellent economy and reliability [9], SCR technology has become the mainstream method for treating NOx in exhaust gas [10]. However, the SCR system’s spray module is the only channel for the urea–water solution (UWS) to enter the pipe. The spread of spray in the pipeline significantly influences ammonia escape and de-NOx efficiency [11]. Because the actual experimental process is complicated and costly, the computational fluid dynamics (CFD) method is often used in design and improvement schemes with limited resources.
In general, the simulation software provides integrated modules [12]. Many scholars use numerical simulation software to explore methods for optimizing spray quality. For instance, Sung et al. [13] had developed a CFD model of mixer and mix chamber and investigated the effects of SCR mixer on SCR system. They found that the mixer and mixing chamber can effectively improve the de-NOx efficiency. Similarly, Cho et al. [14] had investigated the effects of different mixer structures on the atomization characteristic. The results showed that using a mixer increased uniformity and effectively improved the reduction efficiency of nitrogen oxides. In addition, Sik et al. [15] had conducted a numerical study on the urea decomposition chamber of a low-pressure SCR system and obtained a locally optimal solution through parameter optimization.
In the above studies, it is feasible to use simulation methods to investigate the pyrolysis of UWS and the role provided by the mixer in the pipeline. However, the lack of thermodynamic research on UWS in the mixer’s flow field makes the behavior of UWS in the flow field of the mixer challenging to predict. Thus, the thermodynamic method, used to study the mixer’s flow field, is of great significance. Recently, numerous studies of SCR spray performance have been carried out under different conditions in numerical simulation. On the other hand, the studies mainly focused on critical factors and thermodynamic analysis. As a more practical design methodology, the field synergy principle (FSP) is becoming more popular in many research fields such as heat dissipation, micro combustion, the water jet, and fluid flow [16]. Thus, it provides a new way to improve atomization characteristics and de-NOx efficiency of SCR system based on field synergy optimization. For instance, Guo et al. [17] numerically analyzed the spiral coil from the perspective of the FSP and proposed the entropy increase dissipation number to evaluate heat transfer. Li et al. [18] studied the heat transfer effect of microchannels, analyzed the FSP, and proposed a heat dissipation optimization configuration with no pressure drop in the laminar flow state. Deng et al. [19] provided an optimal design for diesel particulate filters by optimizing temperature distribution based on field synergy theory. E et al. [20] explored the field synergy degree of diesel particulate filter by changing the inlet pressure, and the degree of coordination reached the optimum when the inlet pressure was 0.08 MPa. Therefore, the FSP method is considered feasible to analyze the heat transfer state of UWS in the flow field of the mixer [21].
In the paper, a three-dimensional CFD model was first established to investigate three-position distributions (pre-mixer, post-mixer, pre-mixer, and post-mixer) of two mixer models on the atomization characteristic of the SCR system. Two different injections (wall injection and center injection) were then compared and analyzed in seven different mixer flow fields. Finally, based on the FSP, different nozzles’ heat transfer characteristics in different mixer flow fields are compared.

2. Methods and Model Validation

To simplify the simulation process, the inlet and exhaust are considered as the ideal gas. The main mathematical models are as follows.

2.1. Physical Model

The physical model is developed, including two mixers, an exhaust pipe, and the nozzle. The exhaust gas of the diesel engine flows through the pipe and goes through the mixer. Simultaneously, the UWS is injected by the nozzles and hydrolyzed, and then the NOx is reduced to N2 by ammonia in the SCR system. The injection geometrical structure of the SCR system is shown in Figure 1a. The exhaust gas pipe diameter is 80 mm, and the injector position is 180 mm from the inlet. In addition, the central nozzle is located at the center of the pipe and is composed of six injection holes. Each injection hole forms a solid cone with a half-angle of atomization of 5° and a spatial angle of 70° with the pipe’s length.
Similarly, the wall nozzle is composed of a single injection hole with a half-angle of atomization of 22° and a spatial angle of 45° with the length of the pipe. The flow rate of different nozzles containing 32.5 wt% urea is constant at 1.8 cc/min [22,23]. The particle size of the droplets emitted by the wall injector and the center injector conforms to the same Rosin-Rommler distribution. The distance between the mixer and the nozzle is 1D, the pre-mixer is closer to the inlet, and the post-mixer is closer to the outlet. The mixer structures are shown in Figure 1b. The E-type mixer is composed of eight identical flat plates to form a “propeller” structure; each rectangular plate (31 mm long and 10 mm wide) has an inclination angle of 45° with the gas flow direction. The T-type mixer flow-guiding plate adopts the design of rectangle (15 mm long and 13 mm wide), which are made up of 12 rectangular plates arranged in a staggered arrangement. In addition, all mixer plates exist in the flow field in the form of the “thicknessless plate.”
In order to simplify the calculation, some assumptions are as follows:
  • The mixer’s influence on the flow field is constant, and the influence of UWS on the wall film formed on the mixer is ignored [24].
  • The initial turbulence intensity of exhaust gas from the diesel engine is 5%, and the impact of chemical reactions on the flow state is ignored [25].
  • The exhaust pipe is filled with hot exhaust gas and treats the thermal waste as an incompressible fluid.

2.2. Mathematical Models

(1)
Balance equation of the exhaust gas
The balance equations of exhaust gas include the law of conservation of mass, the law of conservation of momentum, and the law of conservation of energy:
Mass conservation equation based on infinitesimal cluster model with fixed spatial position can be expressed as follows:
ρ t + ρ v = 0 ,
where ρ is the fluid density, kg/m3; t represents time, s; and v is velocity vector, m/s.
In addition, the Momentum conservation law for infinitesimal, incompressible Newtonian fluid element can be stated as:
ρ v t = ρ f + Ρ ,
where f is vector volume force, N, and Ρ is stress tensor, N/m2.
The energy of the hot exhaust gas during the flow of the pipe is kept in balance. The expression can be expressed as:
ρ U t = Ρ : v f F + ρ q ,
where f F is heat flow vector, m/s; U is internal energy, J; and q is radiant heat distribution function.
(2)
Turbulence model of the exhaust gas
The turbulence field is an unsteady and nonlinear system, whereas the vortex structure in the flow field continuously interacts, which makes the description of turbulence complicated. The k–ε model is a classic closed model for describing turbulence problems. Yakhot et al. [20] used the renormalization-group (RNG) method to optimize the standard k–ε model to obtain the RNG k–ε model. The turbulent viscosity in the RNG k–ε model can be expressed as:
v T = C u k 2 ε ,
where Cu is the closing coefficient, k is the turbulent kinetic energy, ε is the turbulent dissipation number. The formula for the turbulent diffusion coefficient DT can be obtained by the turbulent viscosity coefficient v T :
D T = v T S c ,
where Sc is the turbulent Schmidt number. In this model, DT is set to 0.0845 and Sc was set to 0.3.
The RNG k–ε model is more suitable for solving non-eddy current models. Large eddy simulation (LES) is a more accurate method for vortex simulation, the largest scale eddies are resolved directly in the simulation. The species transport equation can be expressed in the following form:
t ρ Y m + ρ u Y m = D m ρ Y m ,
where Ym is the mass fraction of the species m, Dm is the diffusion coefficient of the species m in the gas phase.
However, the small-scale eddies are less dependent on the geometry and tend to be more isotropic. According to the sub-grid scale (SGS) model, which represented the dissipative effect of the small-scale eddies, the turbulent viscosity term VT is described as follows:
V T 0.1 Δ 2 S ¯ ,
where S ¯ is the characteristic filtered rate of strain and Δ is the filter width.
(3)
The spray model of UWS spray particles
The UWS stream passes through the nozzle to form a liquid film [21]. Due to the unstable state of the liquid film, droplets are formed in a short time. These droplets can be approximated as tiny observable spheres. The spray behavior of UWS being injected into the tube by the nozzle is described by the discrete phase model (DPM). UWS is atomized by the nozzle to many small droplets, using an average diameter to indicate that all droplets are not sufficient to describe the droplets’ behavior fully. Some scholars have observed the particle size of spray particles and found that the particle diameter distribution can be roughly expressed by the Rosin-Rammler distribution [22,23]. However, due to the different nozzles used by different scholars, the particle size distribution obtained is also different in the author’s investigation. Tian [24] et al. found that the time gap for converting spray particles of different sizes into NH3 is noticeable.
The Taylor Analogy Breakup (TAB) model is a classic method for calculating droplet breakup [25]. TAB model is suitable for the spray model with a low Weber number, which considers the breakup of the droplets to be induced by the relative velocity between the gas and liquid phases [26]. The Weber number is dimensionless-number in CFD [27]:
W = ρ v c 2 l c σ ,
where ρ is the fluid density, kg / m 3 ; v c is the characteristic velocity, m / s ; l c is the characteristic length, m ; and σ is the surface tension coefficient of the fluid.
(4)
Evaporation model of UWS spray particles
Evaporation of UWS droplets is a complex process, and many scholars have suggested this. This research uses the theory of Birkhold et al. [28] to divide the evaporation process of UWS droplets into two parts. First, when the UWS droplets are injected into the pipeline, the temperature of the droplets rises, and the water is evaporated:
( N H 2 ) 2 C O ( a q ) ( N H 2 ) 2 C O ( l ) + H 2 O ( g )
The urea is then thermally decomposed into equimolar amounts of ammonia and isocyanic acid and hydrolysis of isocyanic acid into ammonia and carbon dioxide:
( N H 2 ) 2 C O ( l ) N H 3 ( g ) + HNCO ( g )
HNCO ( g ) + H 2 O ( g ) N H 3 ( g ) + CO 2 ( g )
Considering the effect of mass transfer in the evaporation stage, the differential equation of the droplet mass can be expressed as [29]:
d m p d t = A p Sh ρ ln [ 1 + B M ] ,
where B M is the mass transfer number and Sh * is improved Sherwood number, as defined by [30]:
B M = Y v a p , s Y v a p , g 1 Y v a p , s
Sh * = 2 + B M ( Sh 0 2 ) 1 + B M 7 10 log 1 + B M ,
where Y v a p , s is the dimensionless surface concentration of water vapor and Y v a p , g is the gas volume concentration. The Sherwood number S h 0 can be expressed as:
Sh 0 = 2 + 0 . 6 Re 1 2 Sc 1 3 ,
where Sherwood number S h 0 is a dimensionless scalar that describes the simultaneous diffusion of momentum and mass.
(5)
Field synergy model
The field synergy theory evaluates the heat transfer capability through the cosine angle of the velocity vector and the temperature gradient [31]. The better the synergy of velocity and temperature gradient, the higher the convective heat transfer rate under the same other conditions. It can be expressed as [32]:
v T = v T cos θ
Fc = N u Re P r ,
where v is the velocity vector, m/s; T is the temperature gradient; θ is the included angle between the velocity vector and the temperature gradient; N u is the Nusselt number; Pr is the Planck number; and Re is the Reynold number. As defined by:
Re = ρ v c l c μ
Pr = c p μ λ
Nu = 0.332 Pr 1 3 Re 1 2 .
For the three-dimensional model used in this article, the angle between the velocity vector and the temperature gradient can be expressed as:
θ = arccos T x u + T y v + T z w T x 2 + T y 2 + T z 2 u 2 + v 2 + w 2 ,
where T x , T y , and T z are the temperature gradients in x, y, and z directions, respectively.
(6)
Evaluation method of spray quality
Uniformity of NH3 produced by the injection system before entering the catalyst has a significant influence on reducing NOx in the SCR system. The NH3 concentration is uniform in the spray outlet, and the catalytic reaction is prone to occur in the catalyst [33]. To more accurately evaluate the uniformity of NH3 concentration, the field variable uniformity index γ a based on area weighting is calculated using the following equation:
γ a = 1 A ϕ a ϕ a ¯ d A 2   ϕ a ¯ A d A × 100 % ,
where ϕ a ¯ is the average value of the field variable over the surface and A is the surface area.
(7)
Evaluation method eddy
In order to evaluate the effect of the mixer on the flow field comprehensively, the normalized Q criterion number is employed to investigate the eddy current in the flow field. The Q in the three-dimensional flow field can be expressed as [34]:
Q = 1 2 u x 2 + v y 2 + w z 2 u y v z u z w x u z w y ,
where u, v, and w are the speeds in the x, y, and z directions, respectively.

2.3. Design of Simulation Cases

Previous studies have proved that the atomization quality parameters of the atomization system include temperature [34] and nozzle angle [35]. In this study, only the combined influence of the mixer mode and the specific nozzle position on the atomization quality is considered. The parameters remain unchanged in different cases according to the control variable method. Table 1 shows the selected simulation cases according to the two nozzle positions and the two kinds of mixers’ three arrangement positions.

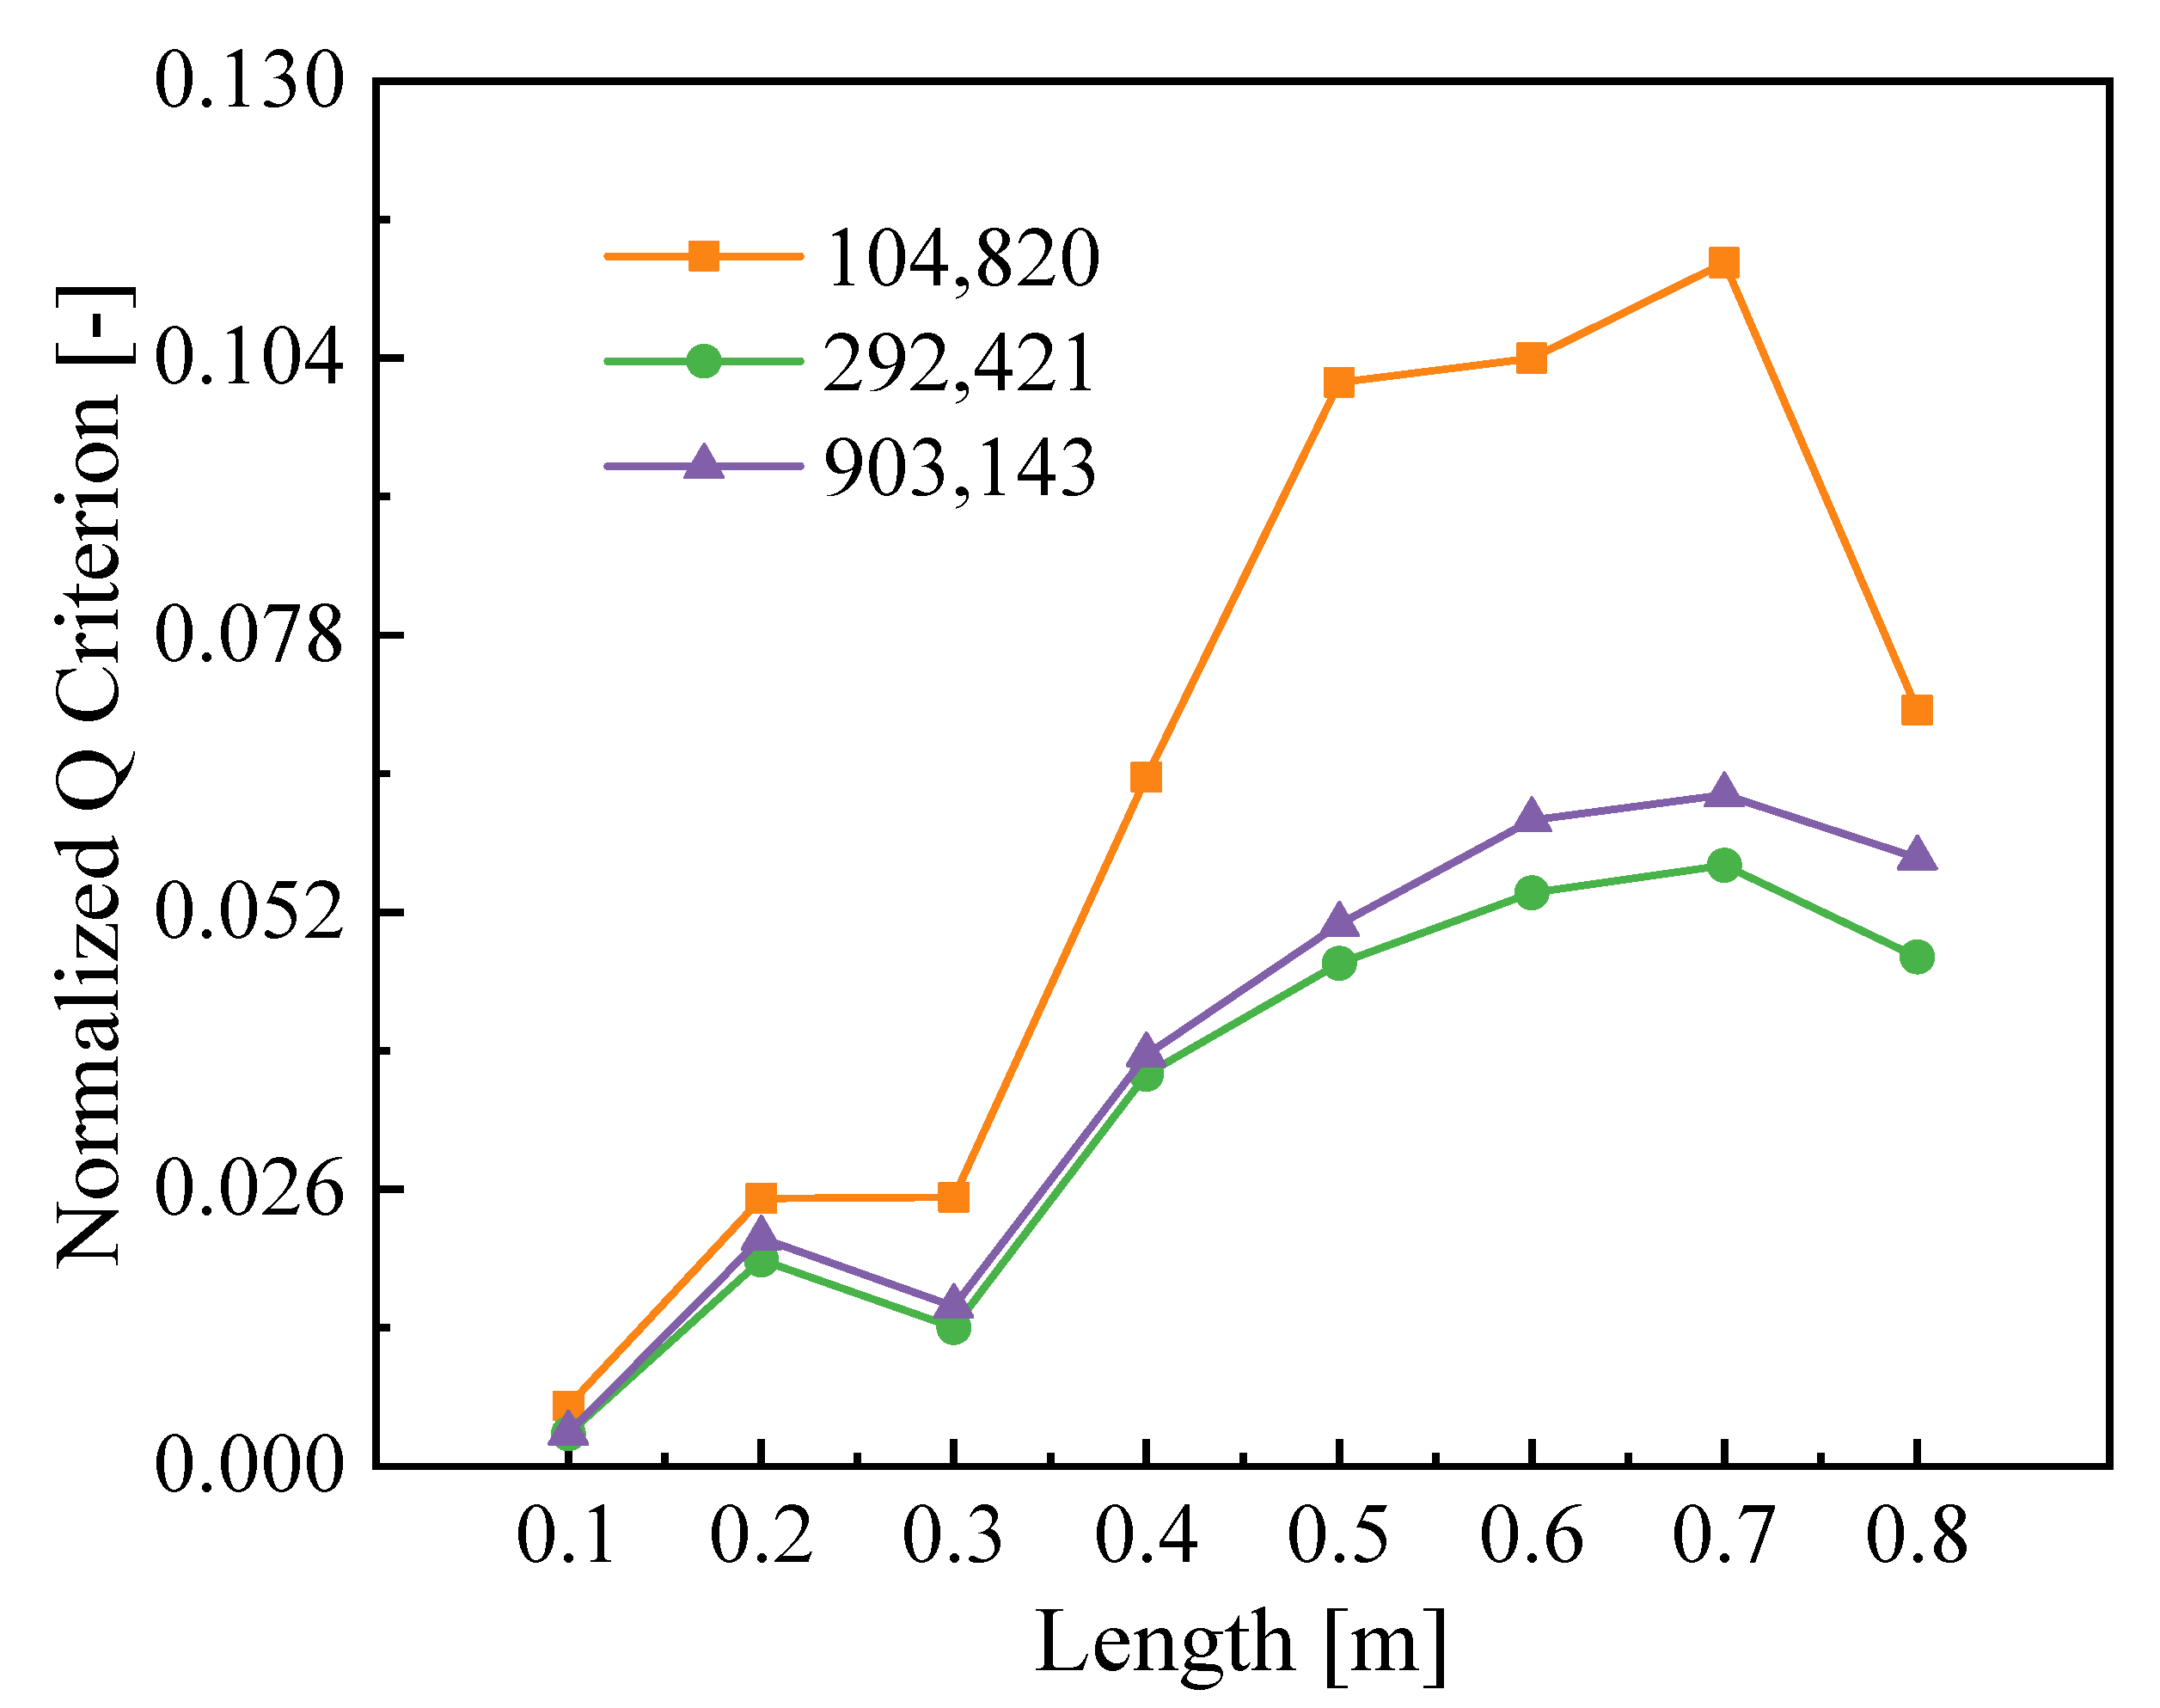
2.4. Gird Independence

In order to shorten the calculation time and improve sufficient accuracy, the mesh independent of produced dynamic grids should be checked [36]. The problem of coarse grids size at wall boundaries should be overcome. All meshes have very fine meshes near the UWS spray path, injector nozzle, and mixer regions. The fine meshes can make sure that the model accurately predicts the droplet breakup and droplet evaporation. Thus, three grids with different densities were used to study the mixer’s influence on the pipeline flow. The coarse grid has 104,820 cells, the medium grid has 292,421 cells, and the fine grid has 903,143 cells. Figure 2 shows the comparisons of Q in the three kinds of grids under standard operating conditions. The difference in Q between the fine grid and the middle grid is within an acceptable range. Thus, the medium grid can make ensure precision and save computational time [37,38,39]. Thus, the optimal medium grid is considered to be the best solution in the study.

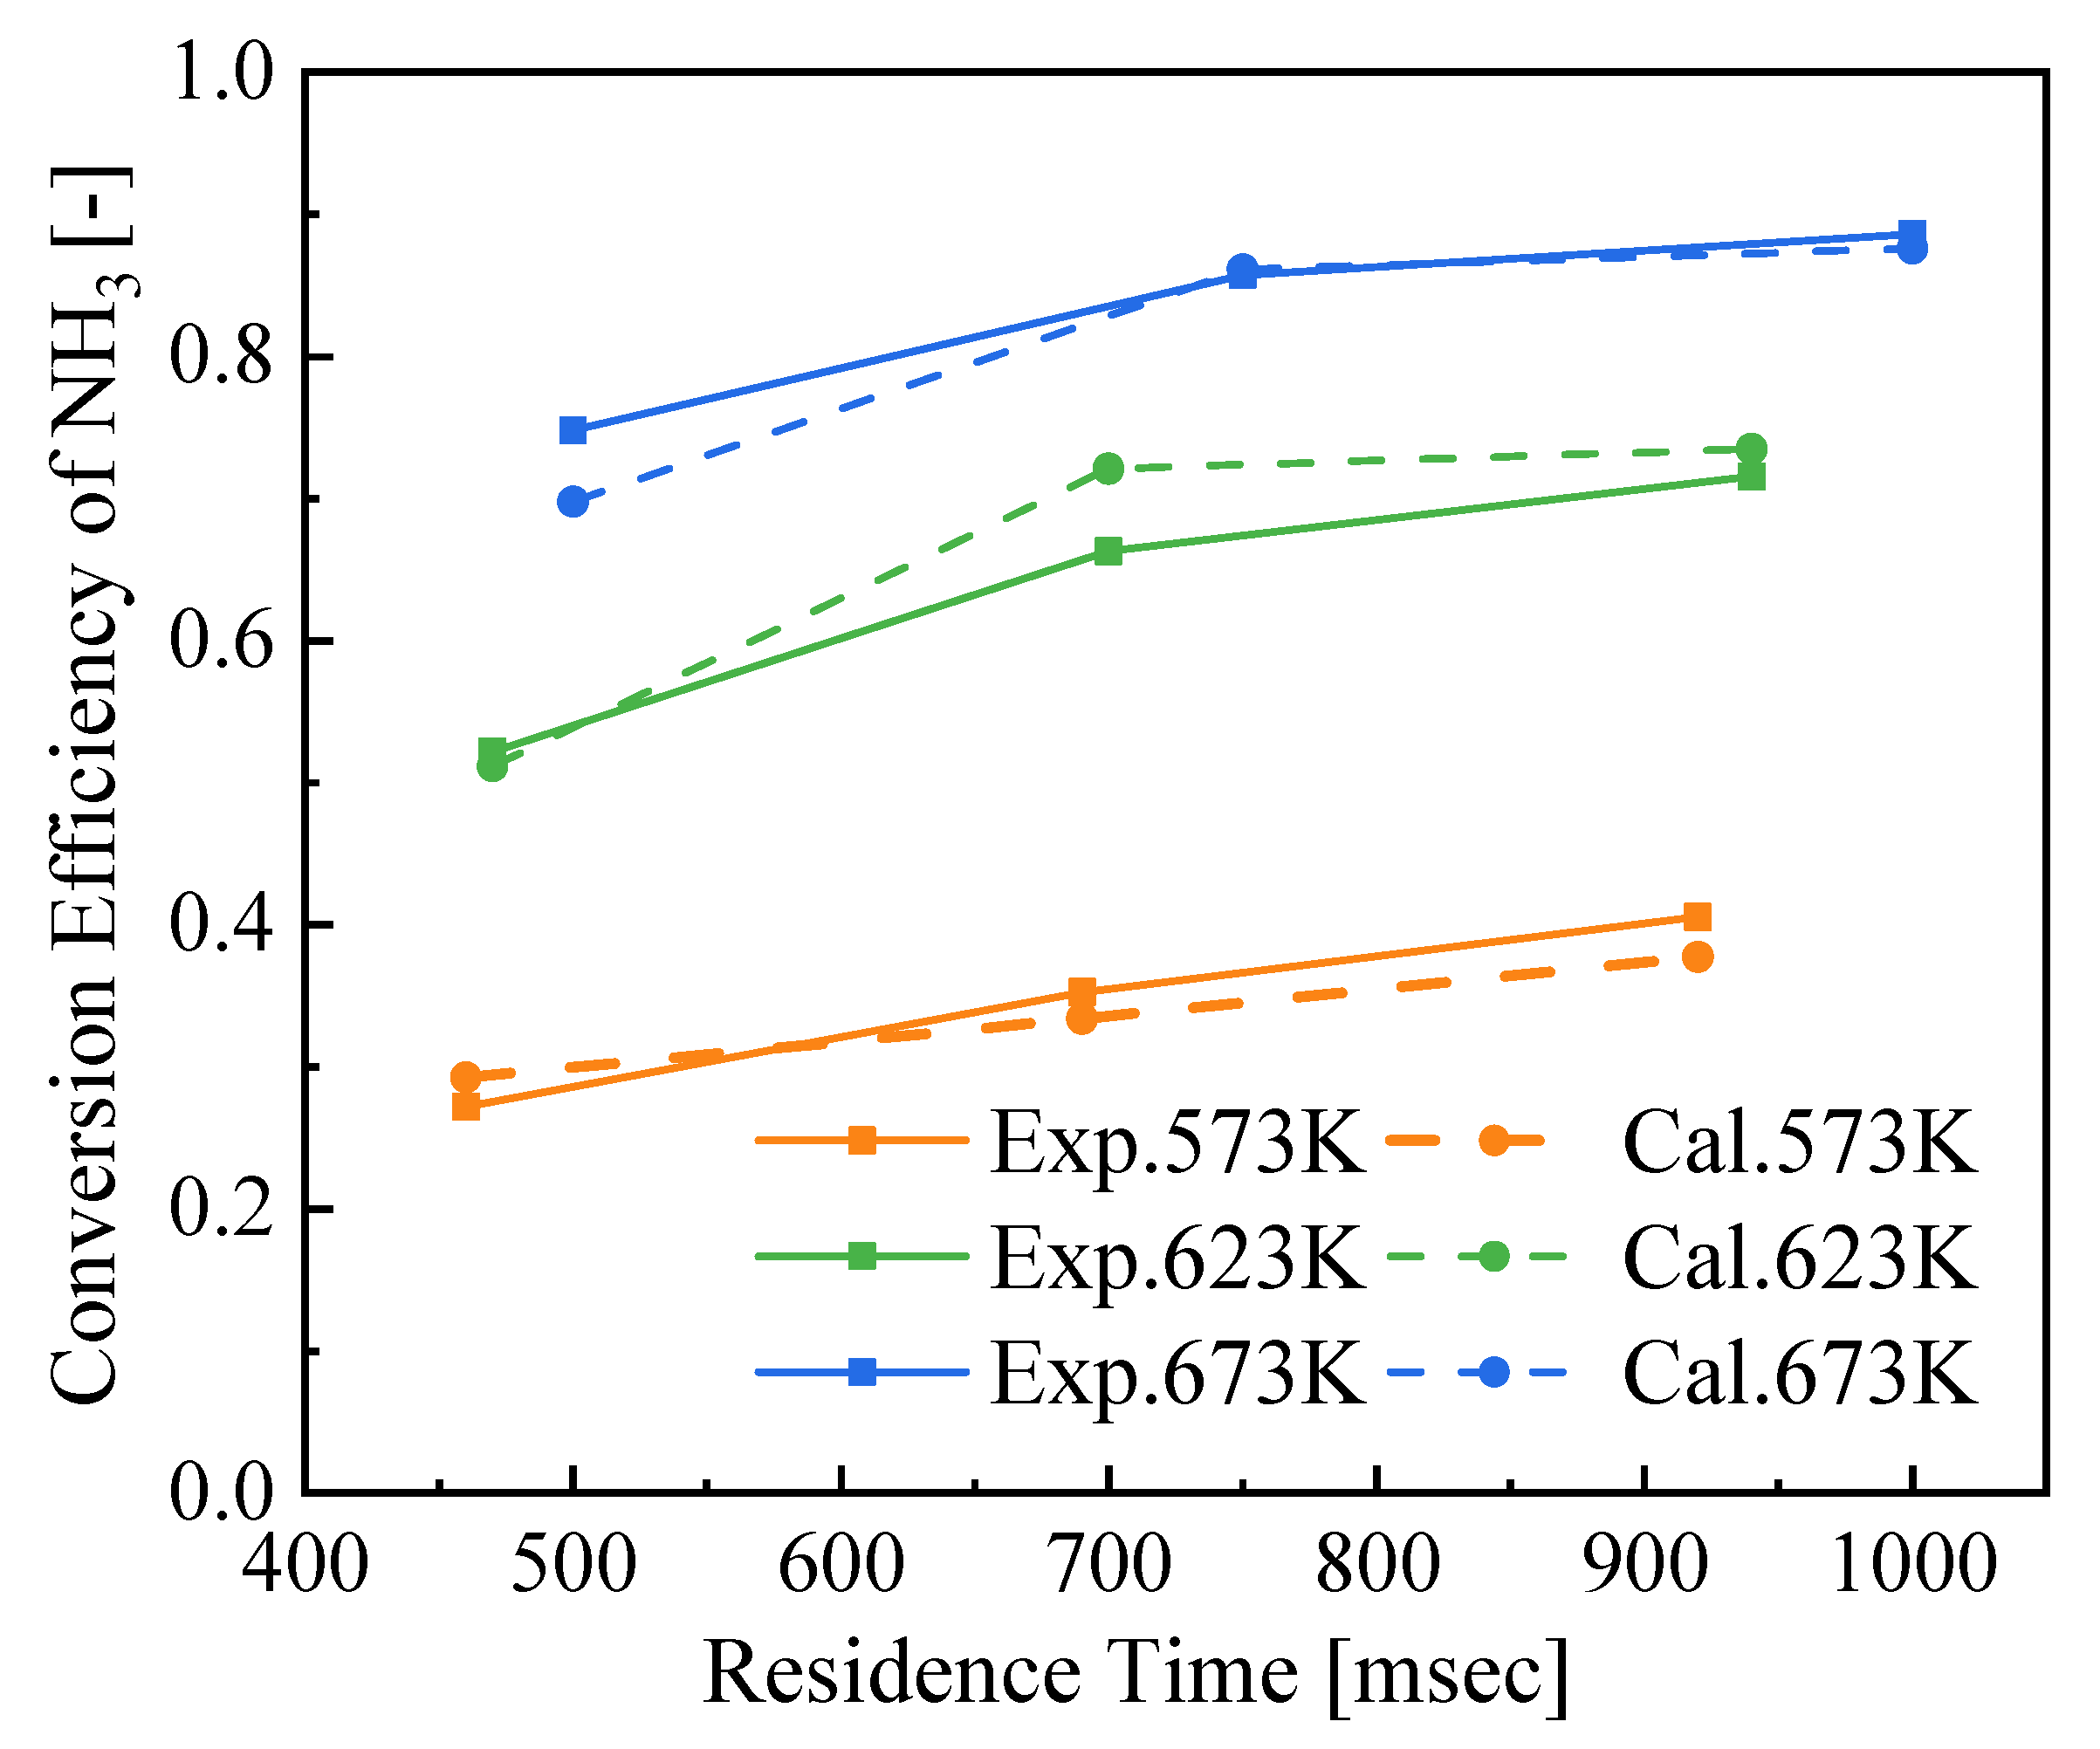
2.5. Model Verification

In this study, some boundary conditions were redefined. The inlet boundary conditions are determined by the inlet velocity and inlet temperature of the exhaust gas. It is assumed that the intake velocity without the radial component is uniform, and the temperature is stable and uniform. The initial inlet velocity is 6 m/s, the initial exhaust temperature is 583 K, the initial inlet velocity component is 0 m/s, and the initial turbulence intensity is 5%. The outlet boundary condition is determined by the outlet pressure, and the outlet pressure is 0 MPa. In addition, the boundary conditions of the wall are mainly determined by the heat release rate, which is 5 w/m3. The mixer is designated as a flat plate without thickness in the model, and heat transfer on the mixer’s wall is not considered. The time step is set to 0.01 s, and the number of iterations per time step is 500.
In order to evaluate the reliability of the numerical model, a numerical simulation was carried out and verified by the experimental measurement of the urea decomposition rate achieved by Kim et al. [36]. The conversion efficiency of urea is directly related to the residence time and size distribution of urea droplets. The numerical model is relatively reliable for predicting the behavior of spray-wall interaction. Thus, the NH3 conversion rate of the injected UWS is calculated based on the same geometry and operating conditions as in Kim’s experiment. The gas temperature range is 573–673 K, and the velocity range is 6–6.4 m/s. The comparisons of the experimental and simulated NH3 conversion efficiency at different exhaust gas temperatures are shown in Figure 3. It can be found that the amount of ammonia produced increases with the increase in the droplet residence time, and the computation results are in good agreement with the experimental results in all cases.

3. Results and Discussion

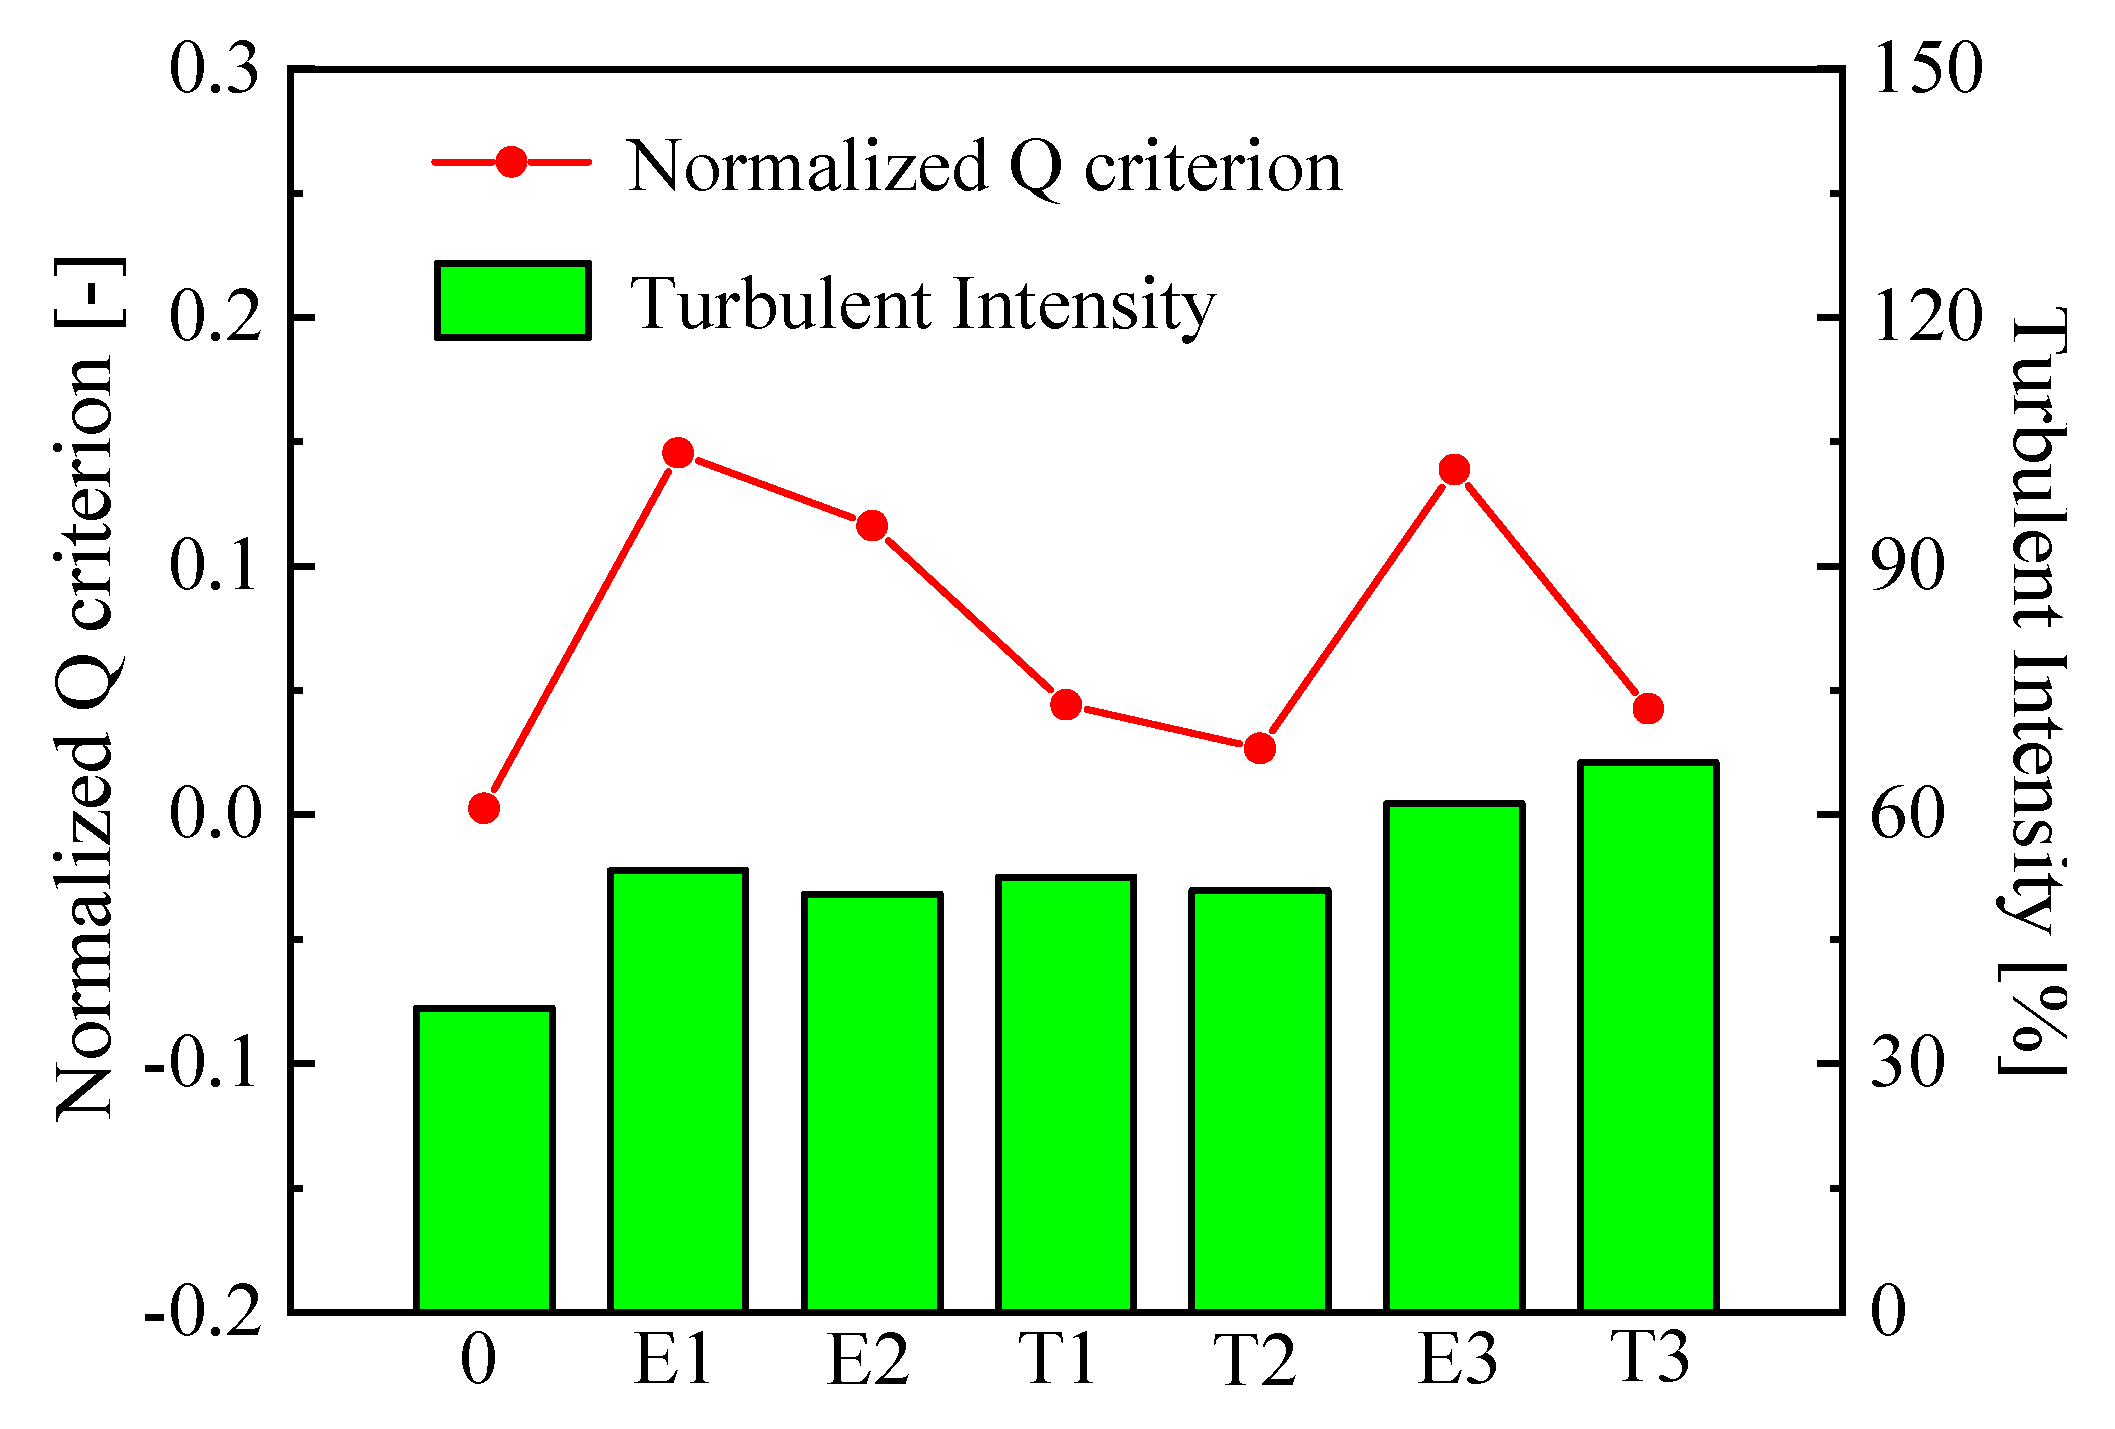
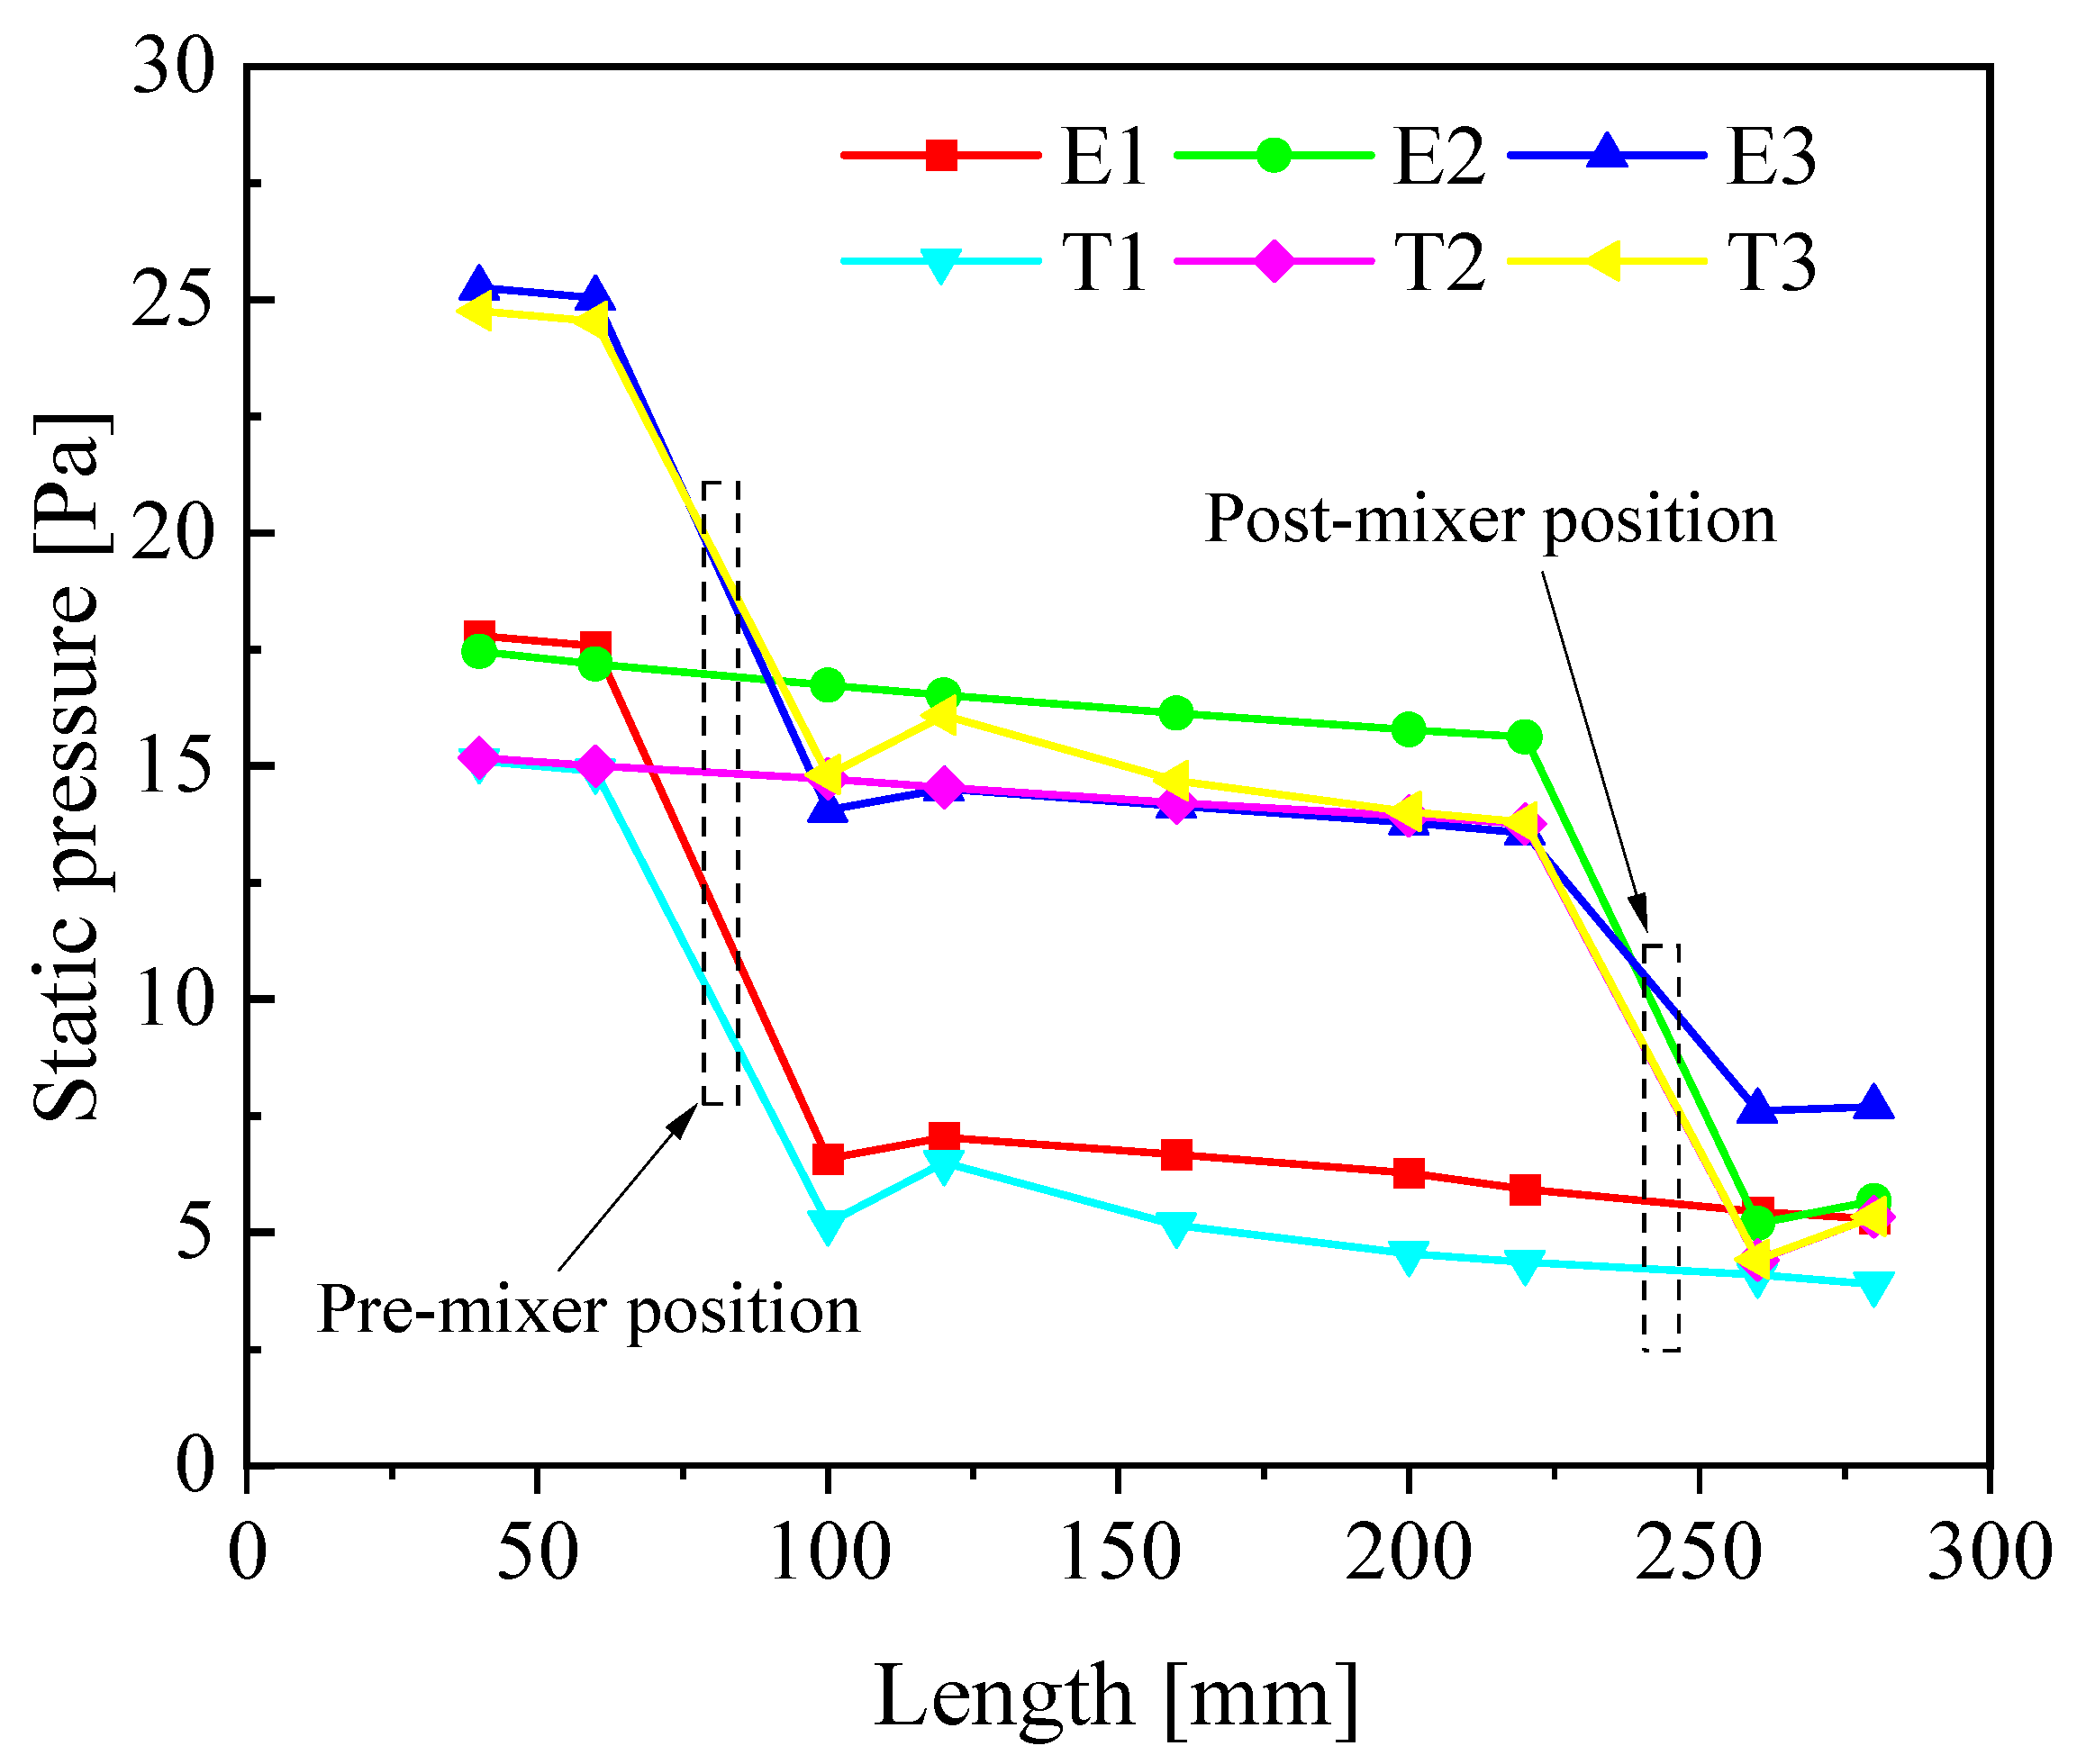
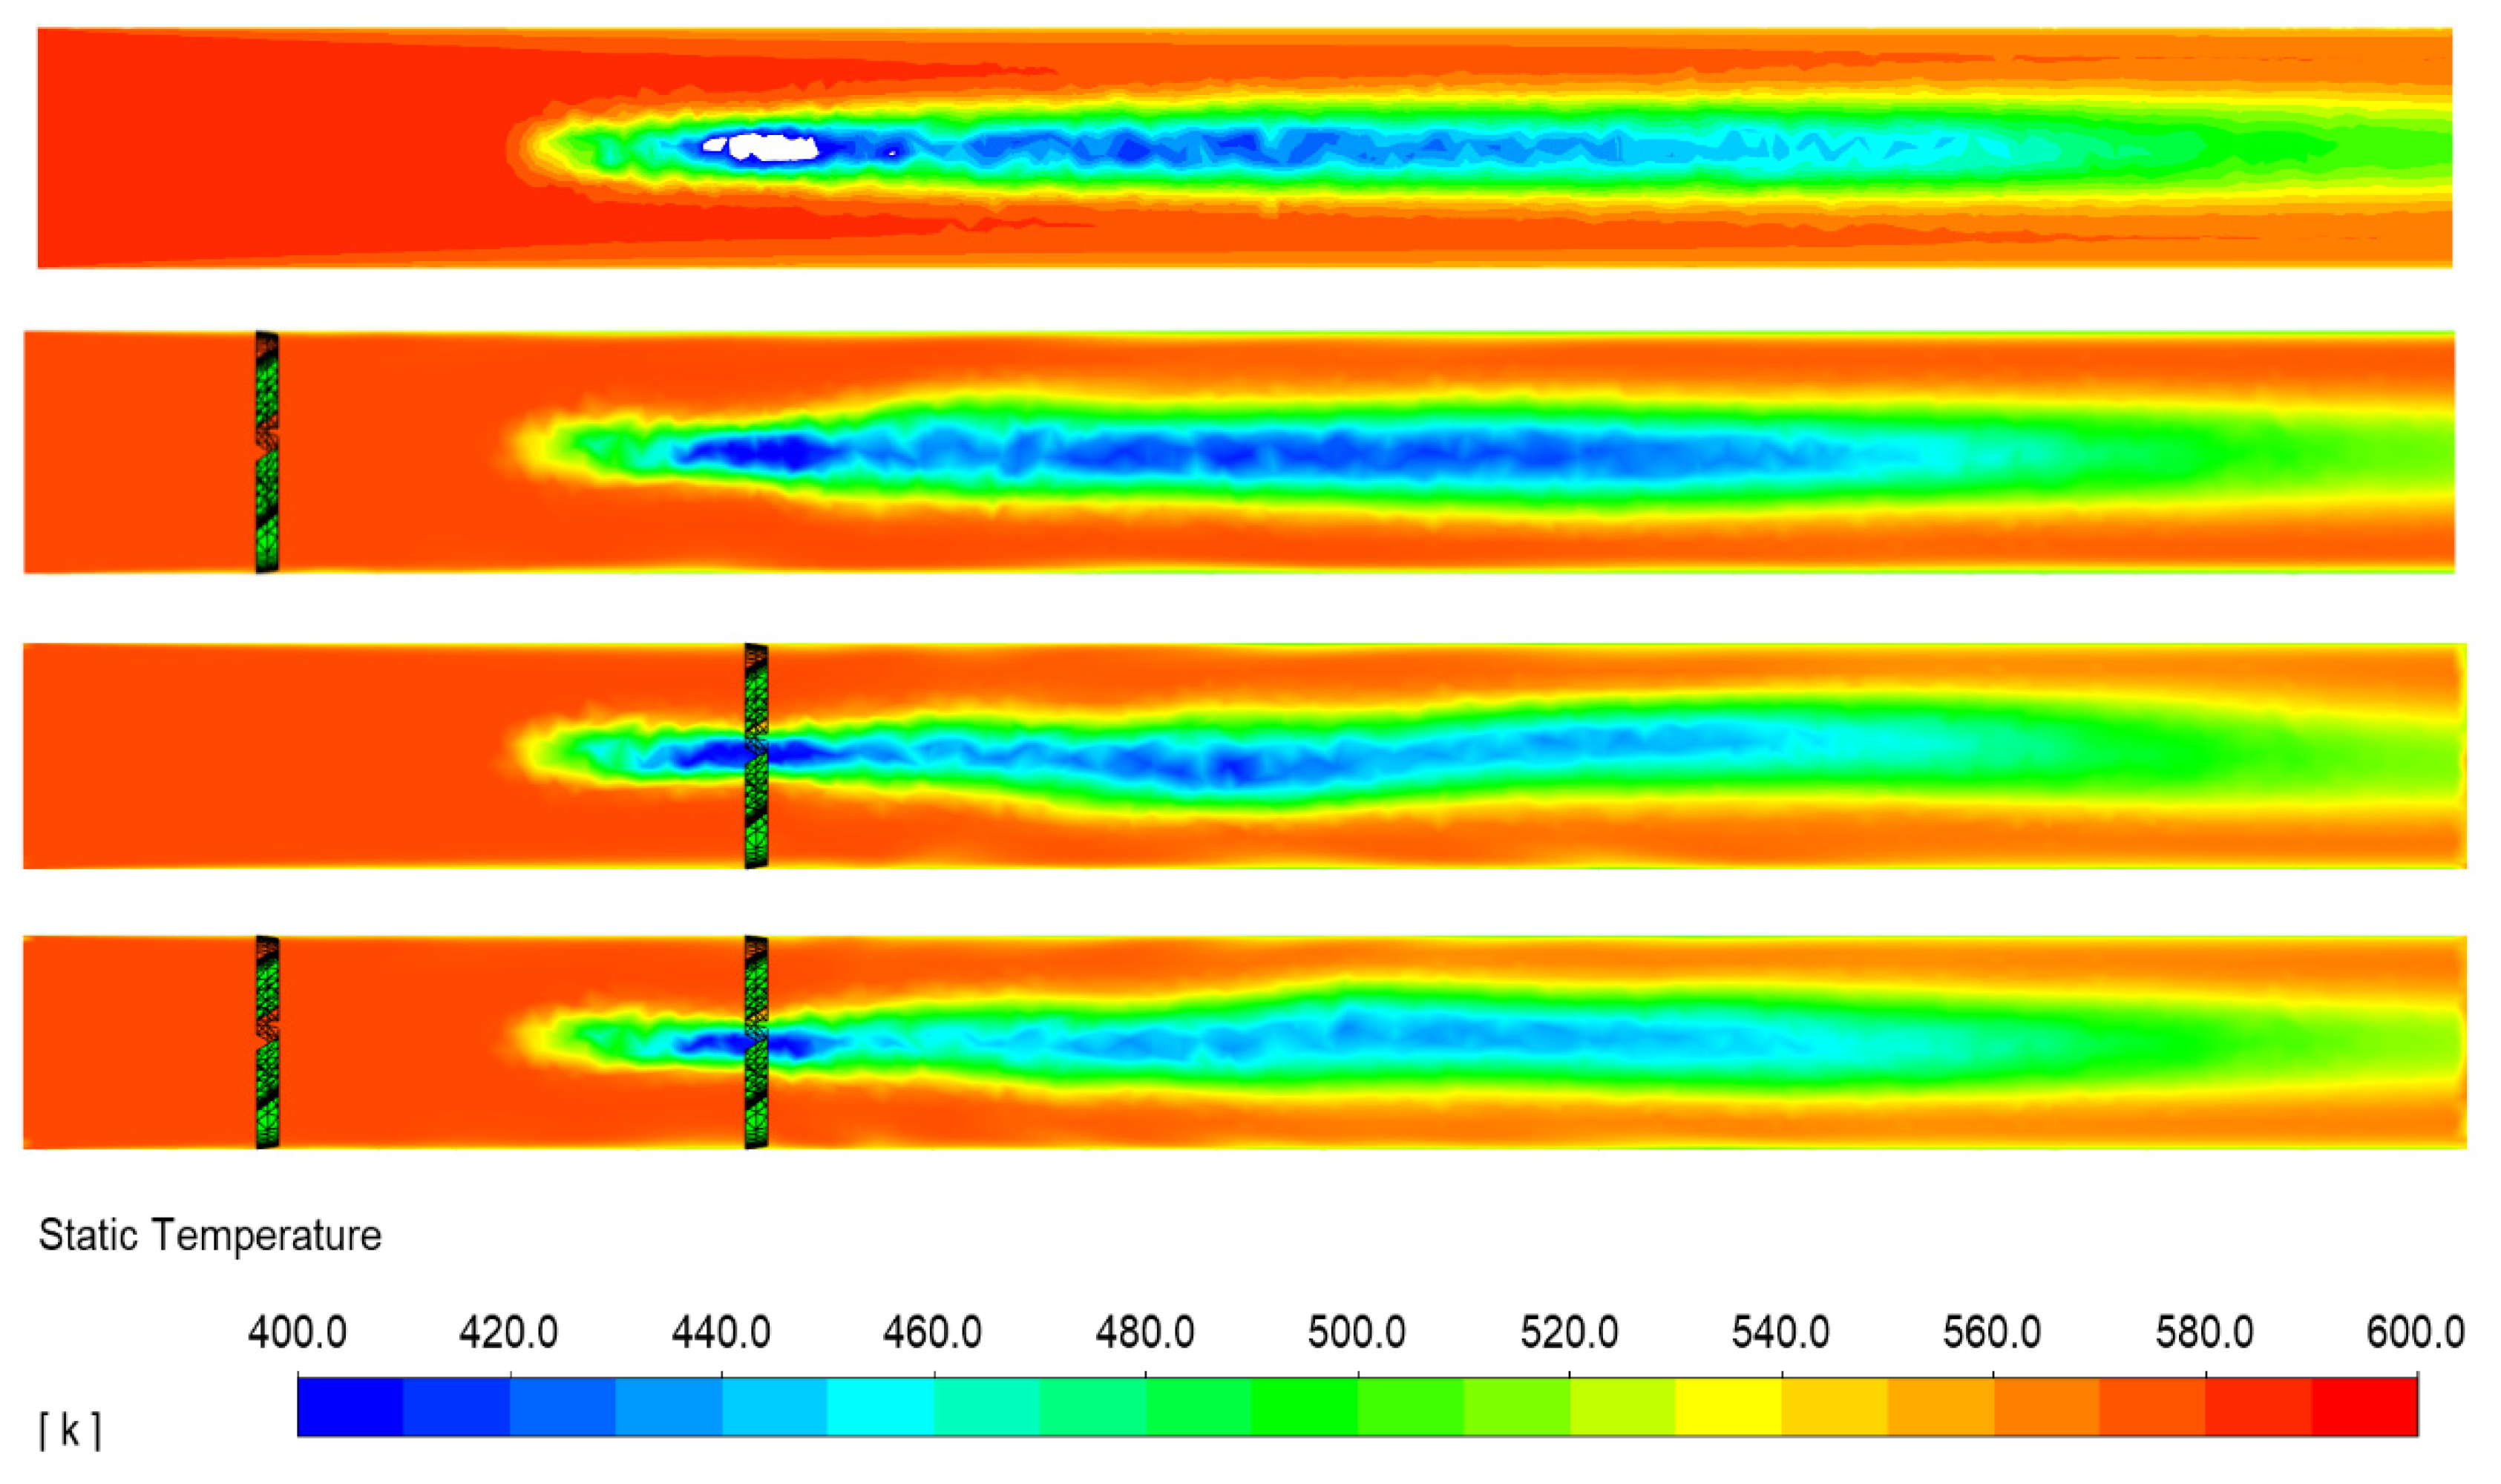
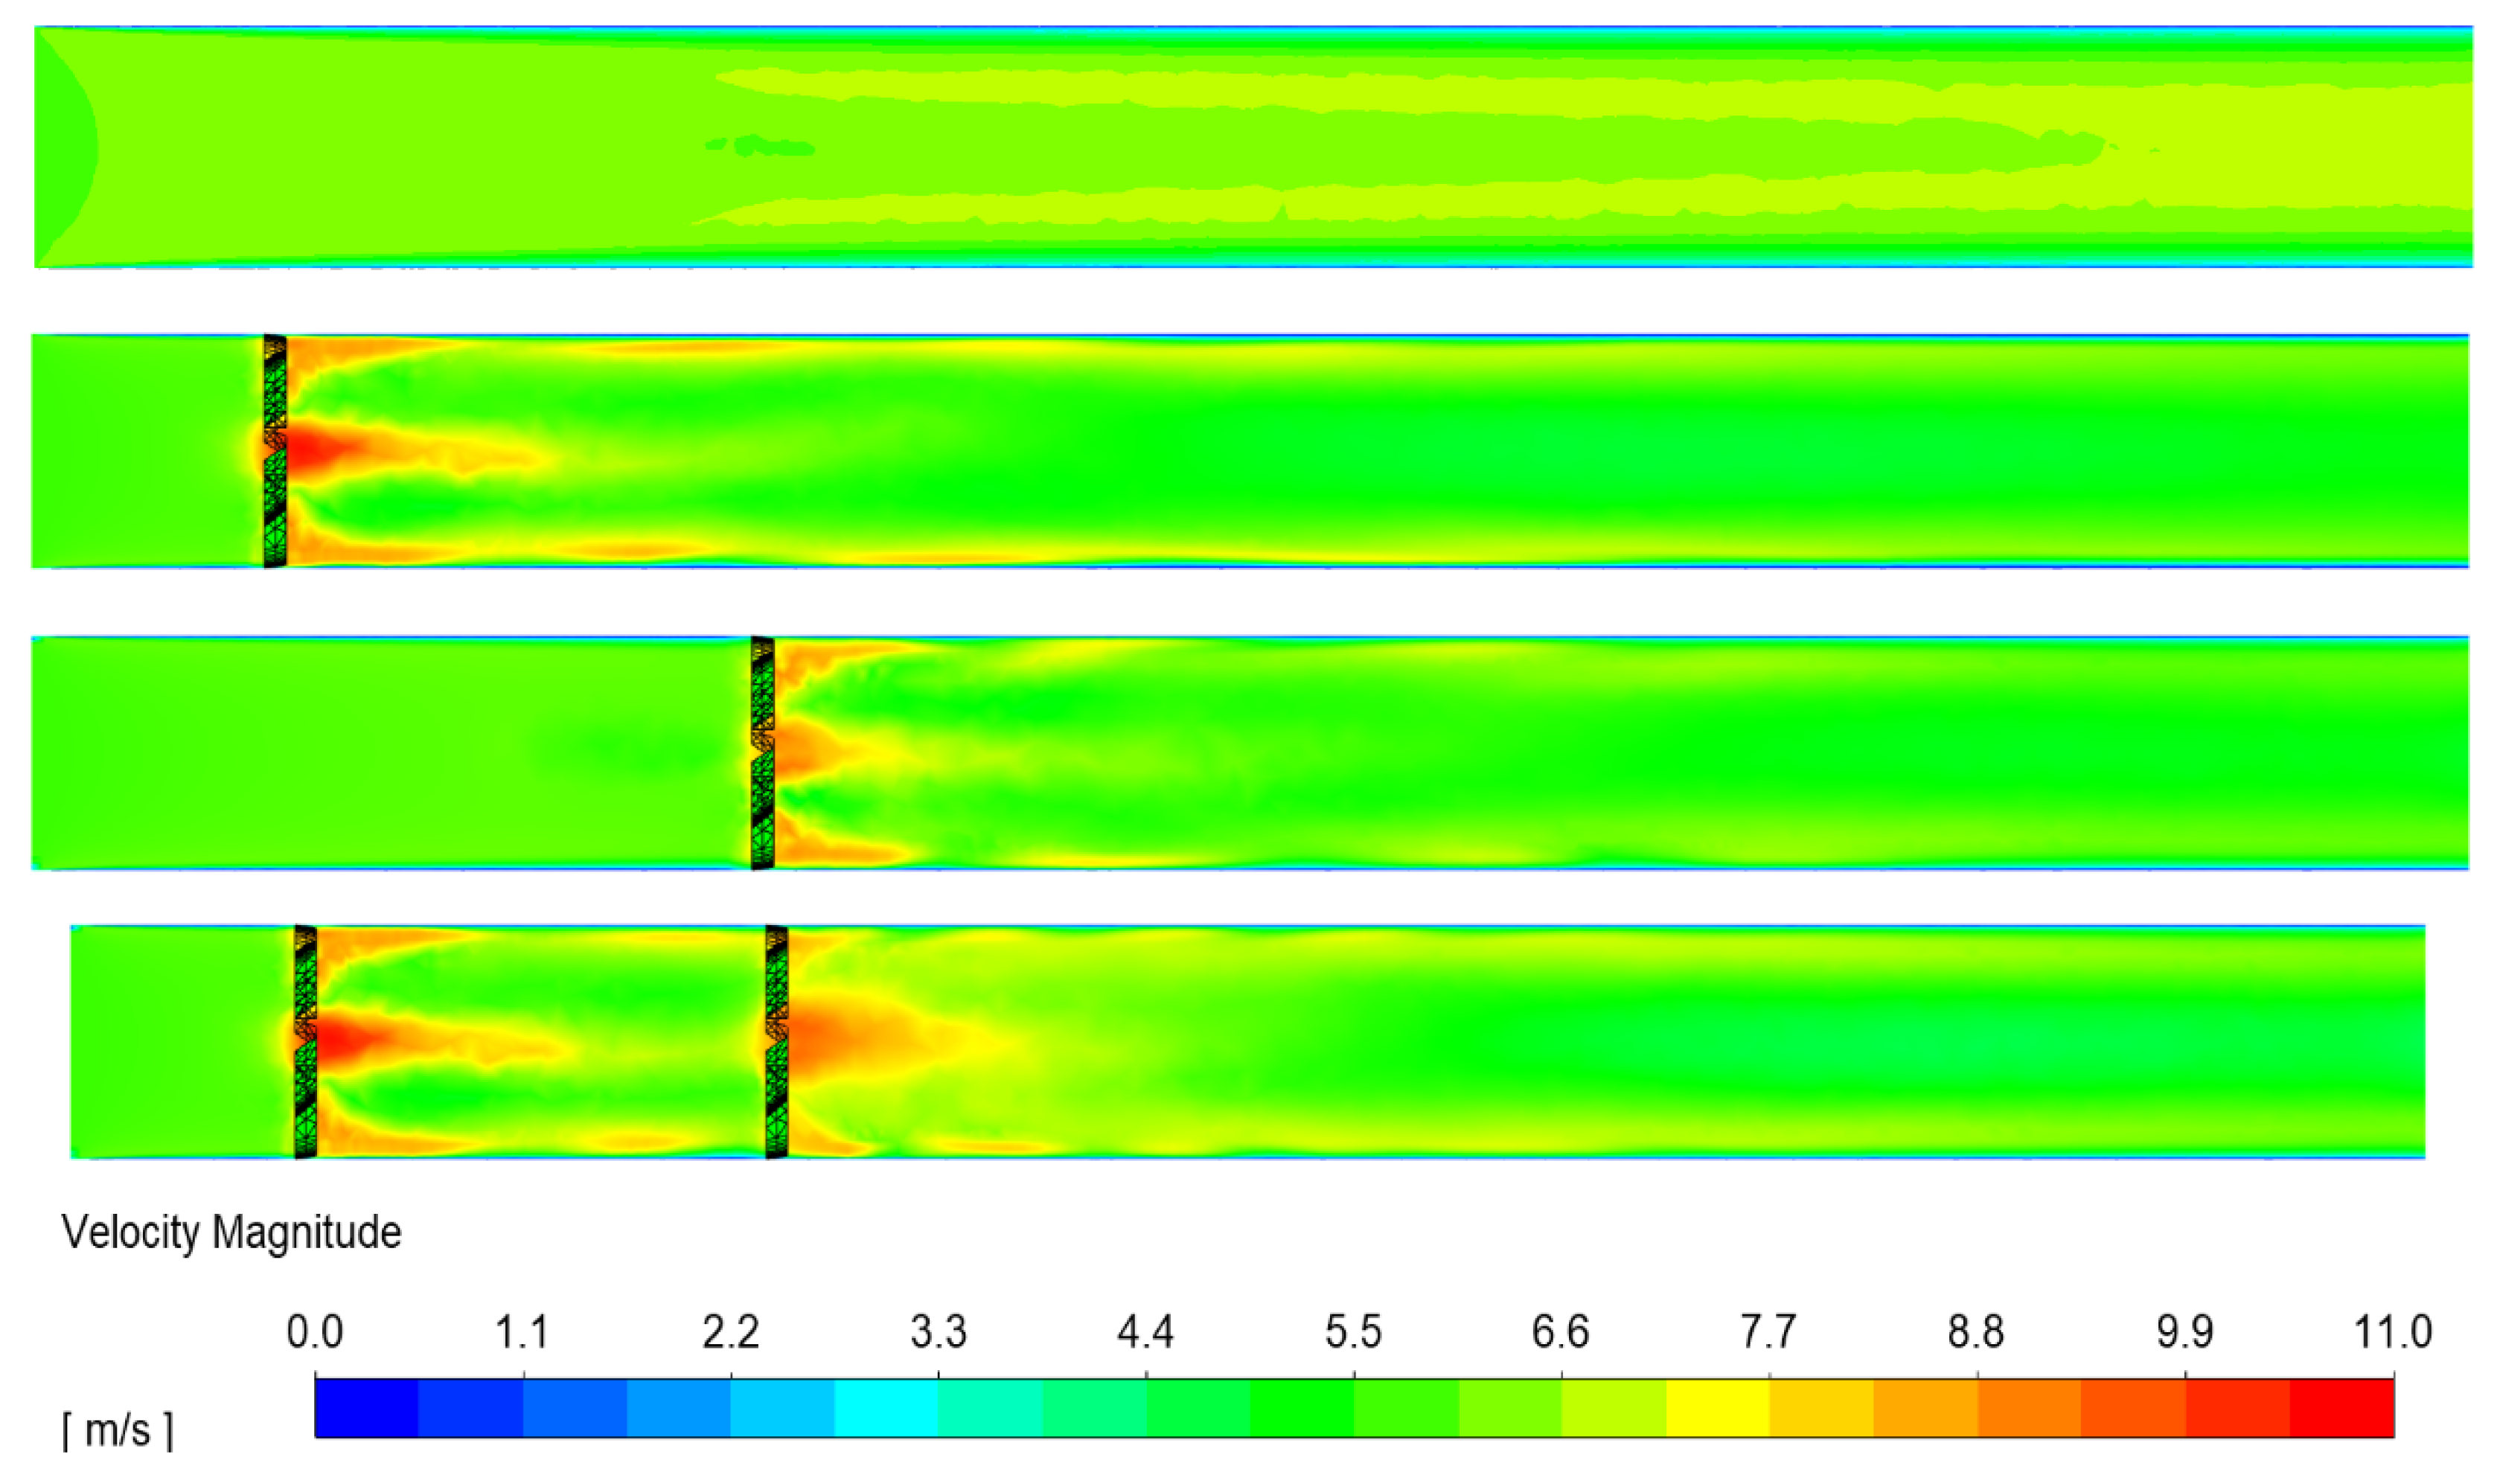
3.1. The Flow Characteristics for Static Mixer

The comparisons of Q and turbulence intensity in different flow fields are shown in Figure 4. The pre-mixer can act on longer pipelines, so the Q of the pre-mixer is higher than the post-mixer. Because the post-mixer generates the vortex in the same direction to maintain the vortex generated by the pre-mixer, the Q of the dual-mixer is similar to that of the pre-mixer. The average Q of the E-type mixer cases is 3.89 times of the T-type mixer cases. It is because the T-type mixer provides mixes by the local velocity components generated by the plates in different directions. Single mixer enhances the turbulence intensity of the flow field by 15.1% on average, and the enhancement effect of the dual-mixer is 1.8 times that of the single mixer. It is because the pre-mixer improves the flow field earlier than the post-mixer. In addition, the vortex formed by the dual-mixer is almost the consistent type as the vortex formed by the pre-mixer, but the turbulence intensity of the flow field of the dual-mixer is improved.
In the three arrangements of the two mixers, the pressure changes caused by the mixers are shown in Figure 5. In single mixer cases, the average inlet pressure of the E-mixer is 17.6 Pa higher than the T-mixer is 15.1 Pa. The effect of a single mixer on the pipe is similar, but the affected area also changes depending on the location. The effect of the E-type mixer is slightly greater than the T-type mixer. The dual-mixer arrangement is a larger overall pressure loss for the system. To compare the single mixer cases, the average inlet pressure of the E-mixer increased 7.7 Pa, and the T-mixer increased 9.7 Pa. In addition, the vortex direction of the pre-mixer is the same as the post-mixer, so the post-mixer in the E-type dual-mixer causes less pressure loss. From the overall design of SCR, the lower inlet pressure is better.

3.2. Urea Conversion

Figure 6 compares the NH3 concentration of cross-section in different positions at 0.1 s. The NH3 concentration of the wall injection cases is higher than the center injection cases. In the cases of pre-mixer and wall injection, the maximum concentration of Case A-T1 is 328 ppm higher than Case A-E1(see Figure 6a). When the injection method is center injection, the maximum concentration of NH3 at 0.6 m in Case B-T1 is 556 ppm higher than that of Case B-E1(see Figure 6b). The results show that T-type mixer as a pre-mixer is more beneficial to NH3 generation than E-type mixer. In the post-mixer cases, the NH3 concentration of the wall injection is higher than the center injection, and the average NH3 concentration in T-type cases is higher than E-type cases. The T-type post-mixer significantly increases the NH3 concentration of different injections and promotes the breaking of spray particles while also providing a larger velocity component and makes some spray particles collide with the pipe wall. In addition, the post-mixer is better for the improvement of particle atomization than the pre-mixer. More specifically, the larger particle size is broken into small particle size, which promotes the hydrolysis of UWS and the formation of ammonia. The same conclusion also appeared by Tan et al. [38]. The NH3 concentration of Case B-E3 is 985 ppm higher than Case B-E2 and 1643 ppm higher than Case B-E1. The results show that the dual-mixer is more conducive to the production of NH3 than the single mixer in center injection cases. However, the gain of the dual-mixer is diminished in the wall injection cases.
Figure 7 compares the NH3 volume-averaged concentration. The dual-mixer has the most significant influence on the NH3 concentration, followed by post-mixer and pre-mixer. The results show that the advantages of dual-mixer are most evident in the cases of center injection, which shows that the effect of dual-mixer promoting NH3 is better than single mixers in the exhaust field.

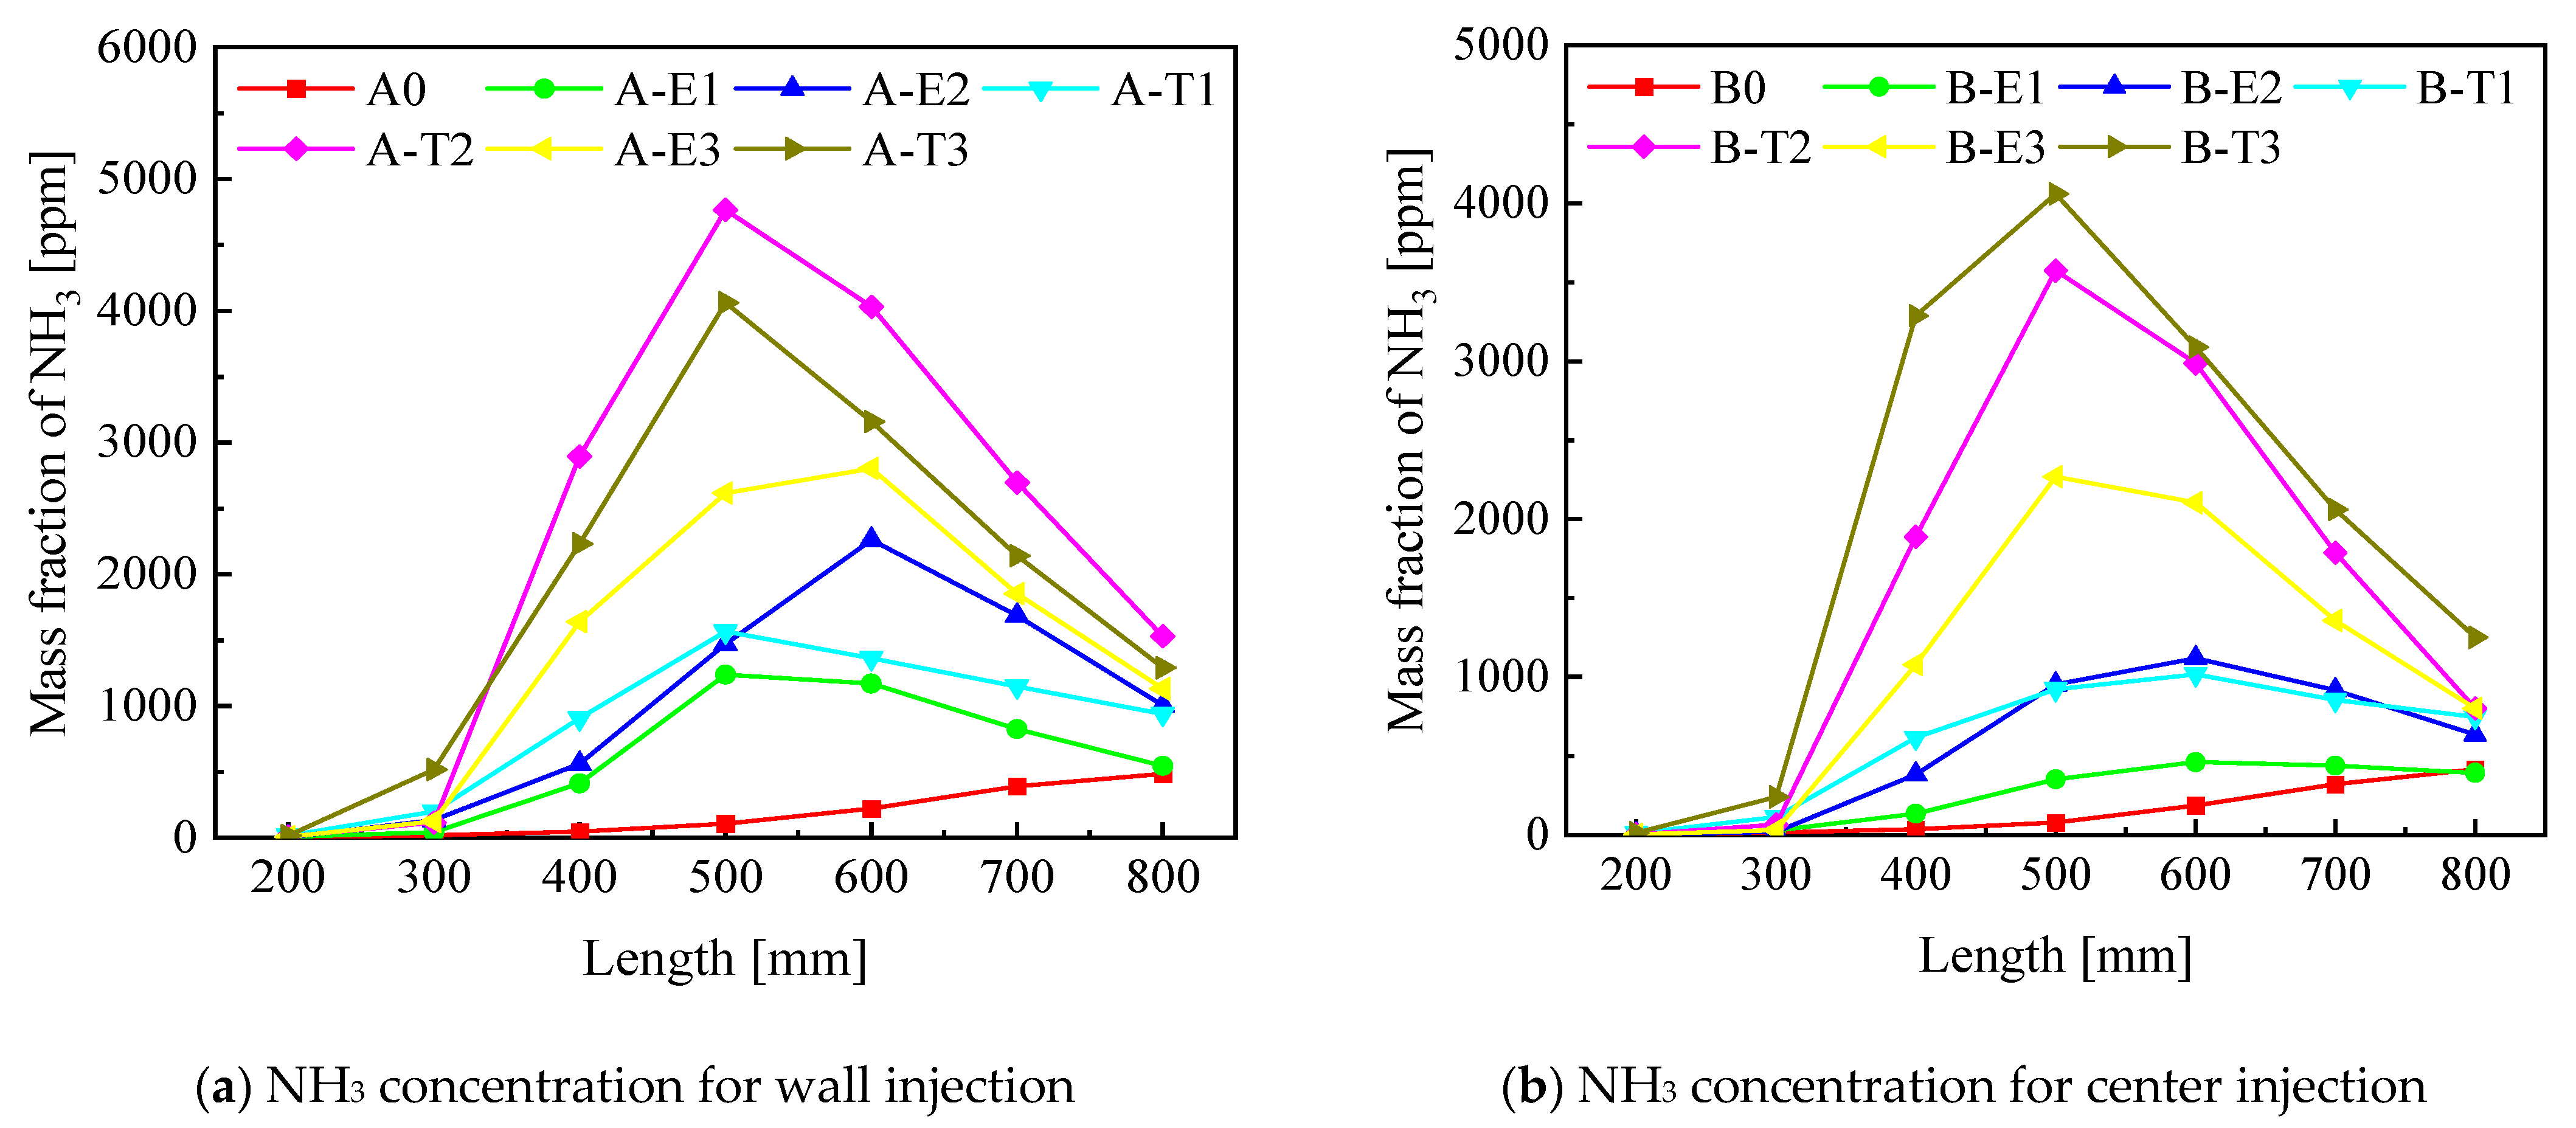
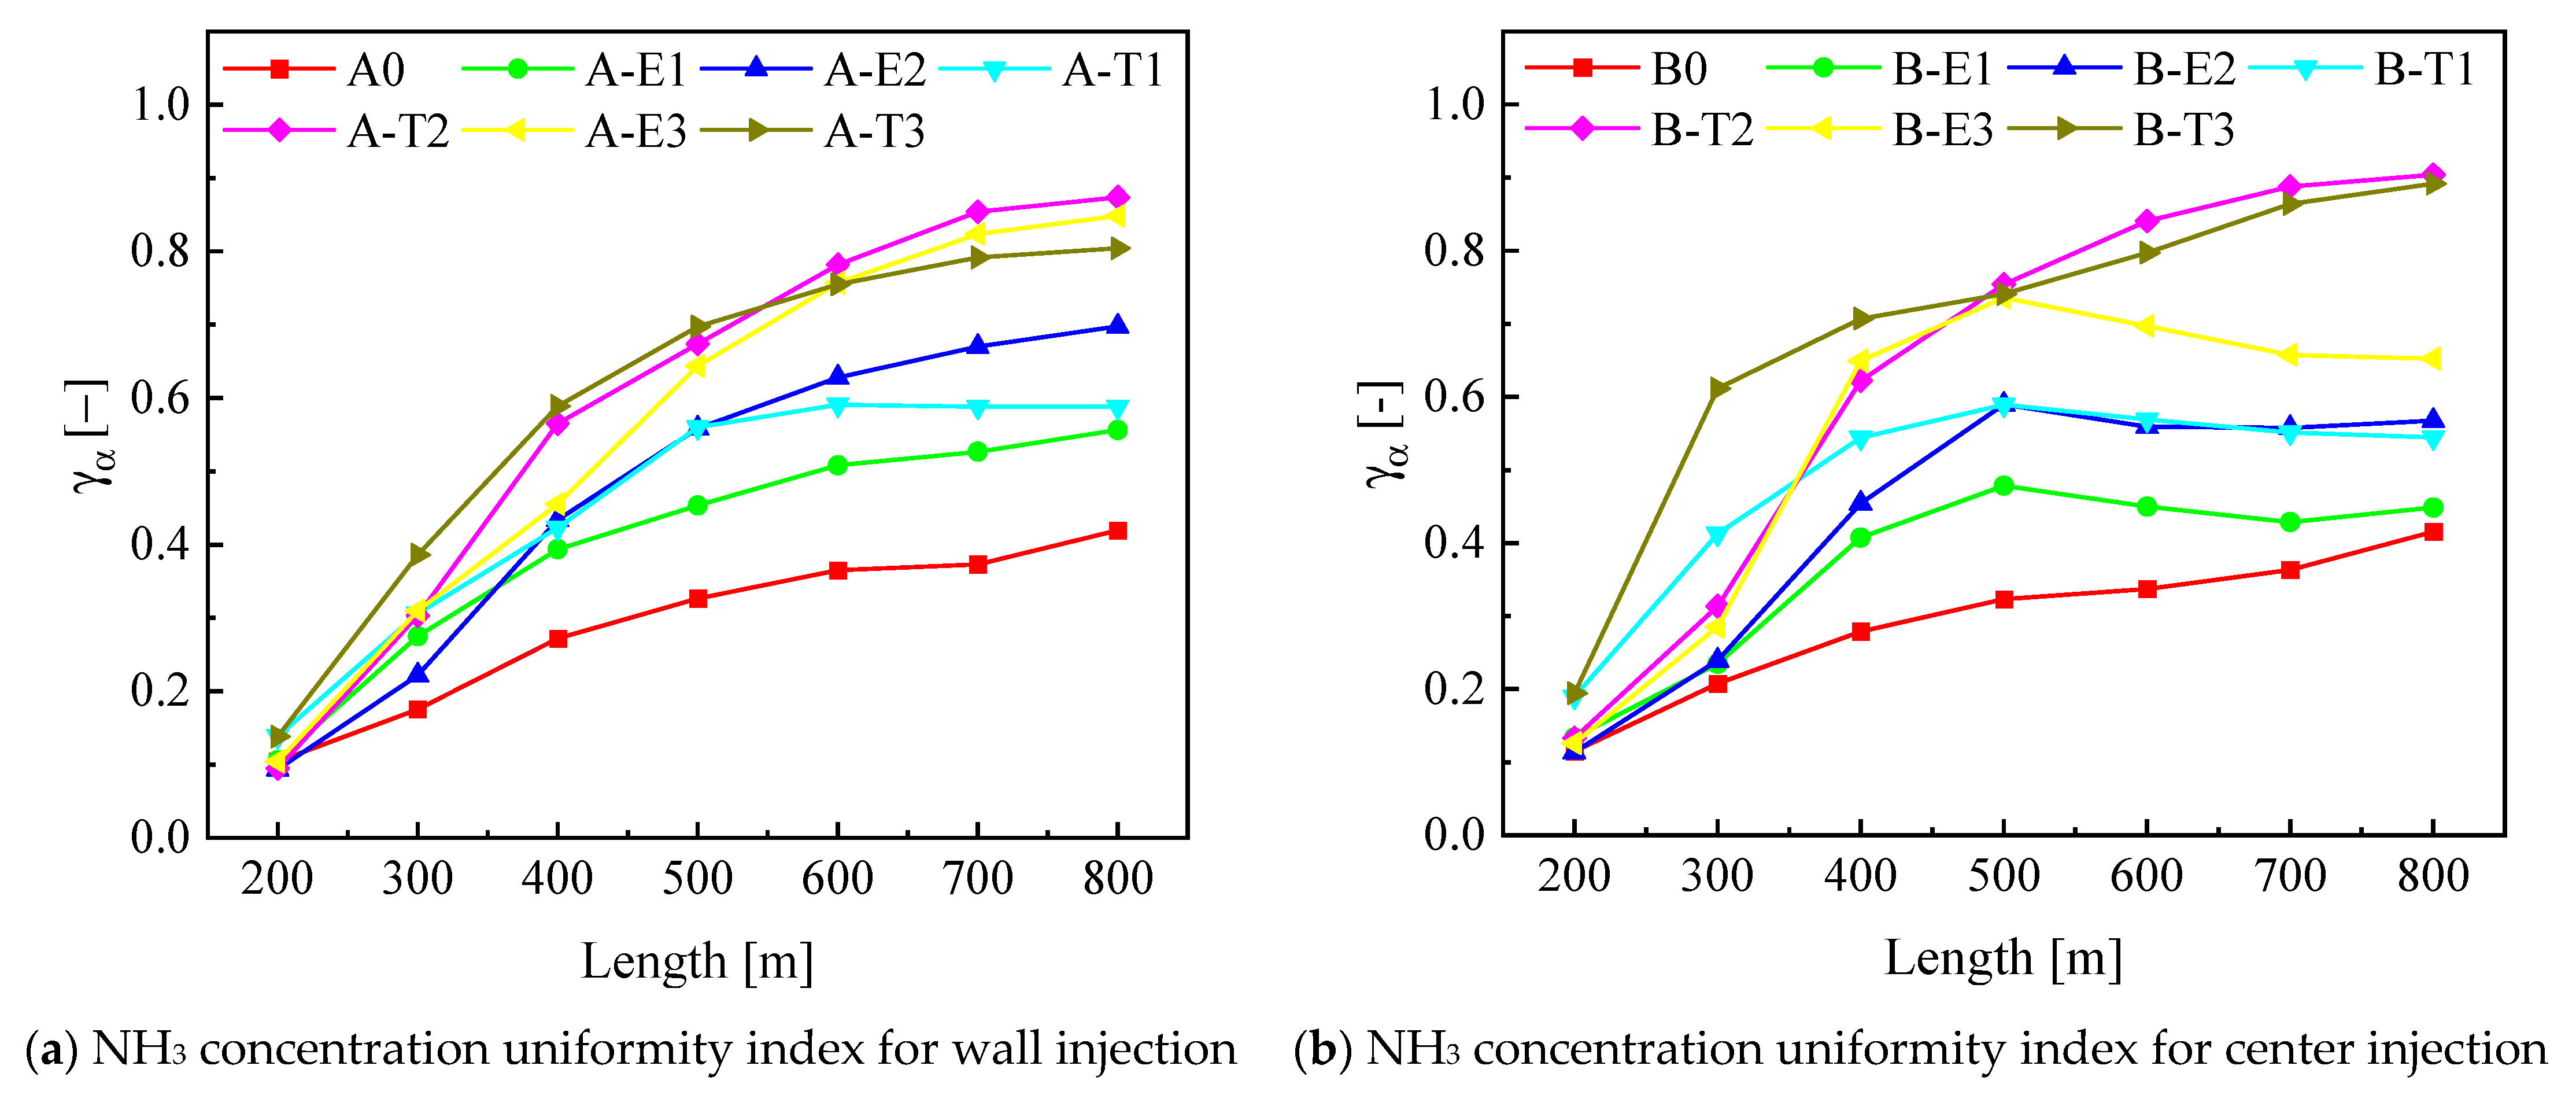
3.3. NH3 Distribution Uniformity

The increase in NH3 concentration is not evenly distributed. The ammonia produced may not react fully with NOx and escape. Thus, the uniformity of NH3 concentration in the SCR system should be considered.
Figure 8 shows the NH3 concentration uniformity index at 0.1 s. In contrast to Case A0 and Case B0, using mixer cases has improved uniformity at various positions in the pipeline to varying degrees. As for wall injection in the E-type mixer, the pre-mixer, post-mixer, and dual-mixer cases improve the uniformity index by 38.5%, 62.2%, and 104.3%, respectively. However, in center injection, the pre-mixer, post-mixer, and dual-mixer cases improve the uniformity index by 26.7%, 51.2%, and 86.7%, respectively(see Figure 8a). As for wall injection in the T-type mixer, the pre-mixer, post-mixer, and dual-mixer cases improve the uniformity index by 56.9%, 103.6%, and 104.4%, respectively. However, in center injection, the pre-mixer, post-mixer, and dual-mixer cases improve the uniformity index by 66.9%, 118.7%, and 135.9%, respectively(see Figure 8b).
Since the center injection sprays outward from the center of the pipe, the spray is relatively uniform on the circumference, and as the wall injection sprays UWS from near the wall, the spray is uneven on the circumference. Besides, the speed component provided by the T-type post-mixer makes spray particles close the wall and the NH3 concentration decreases from close to the wall to the pipe center. The speed component provided by the E-type post-mixer is small, which makes the NH3 concentration decrease from the pipe center to the wall. Therefore, the E-type mixer optimizes the wall injection better than the center injection, but the T-type mixer optimizes the center injection better.

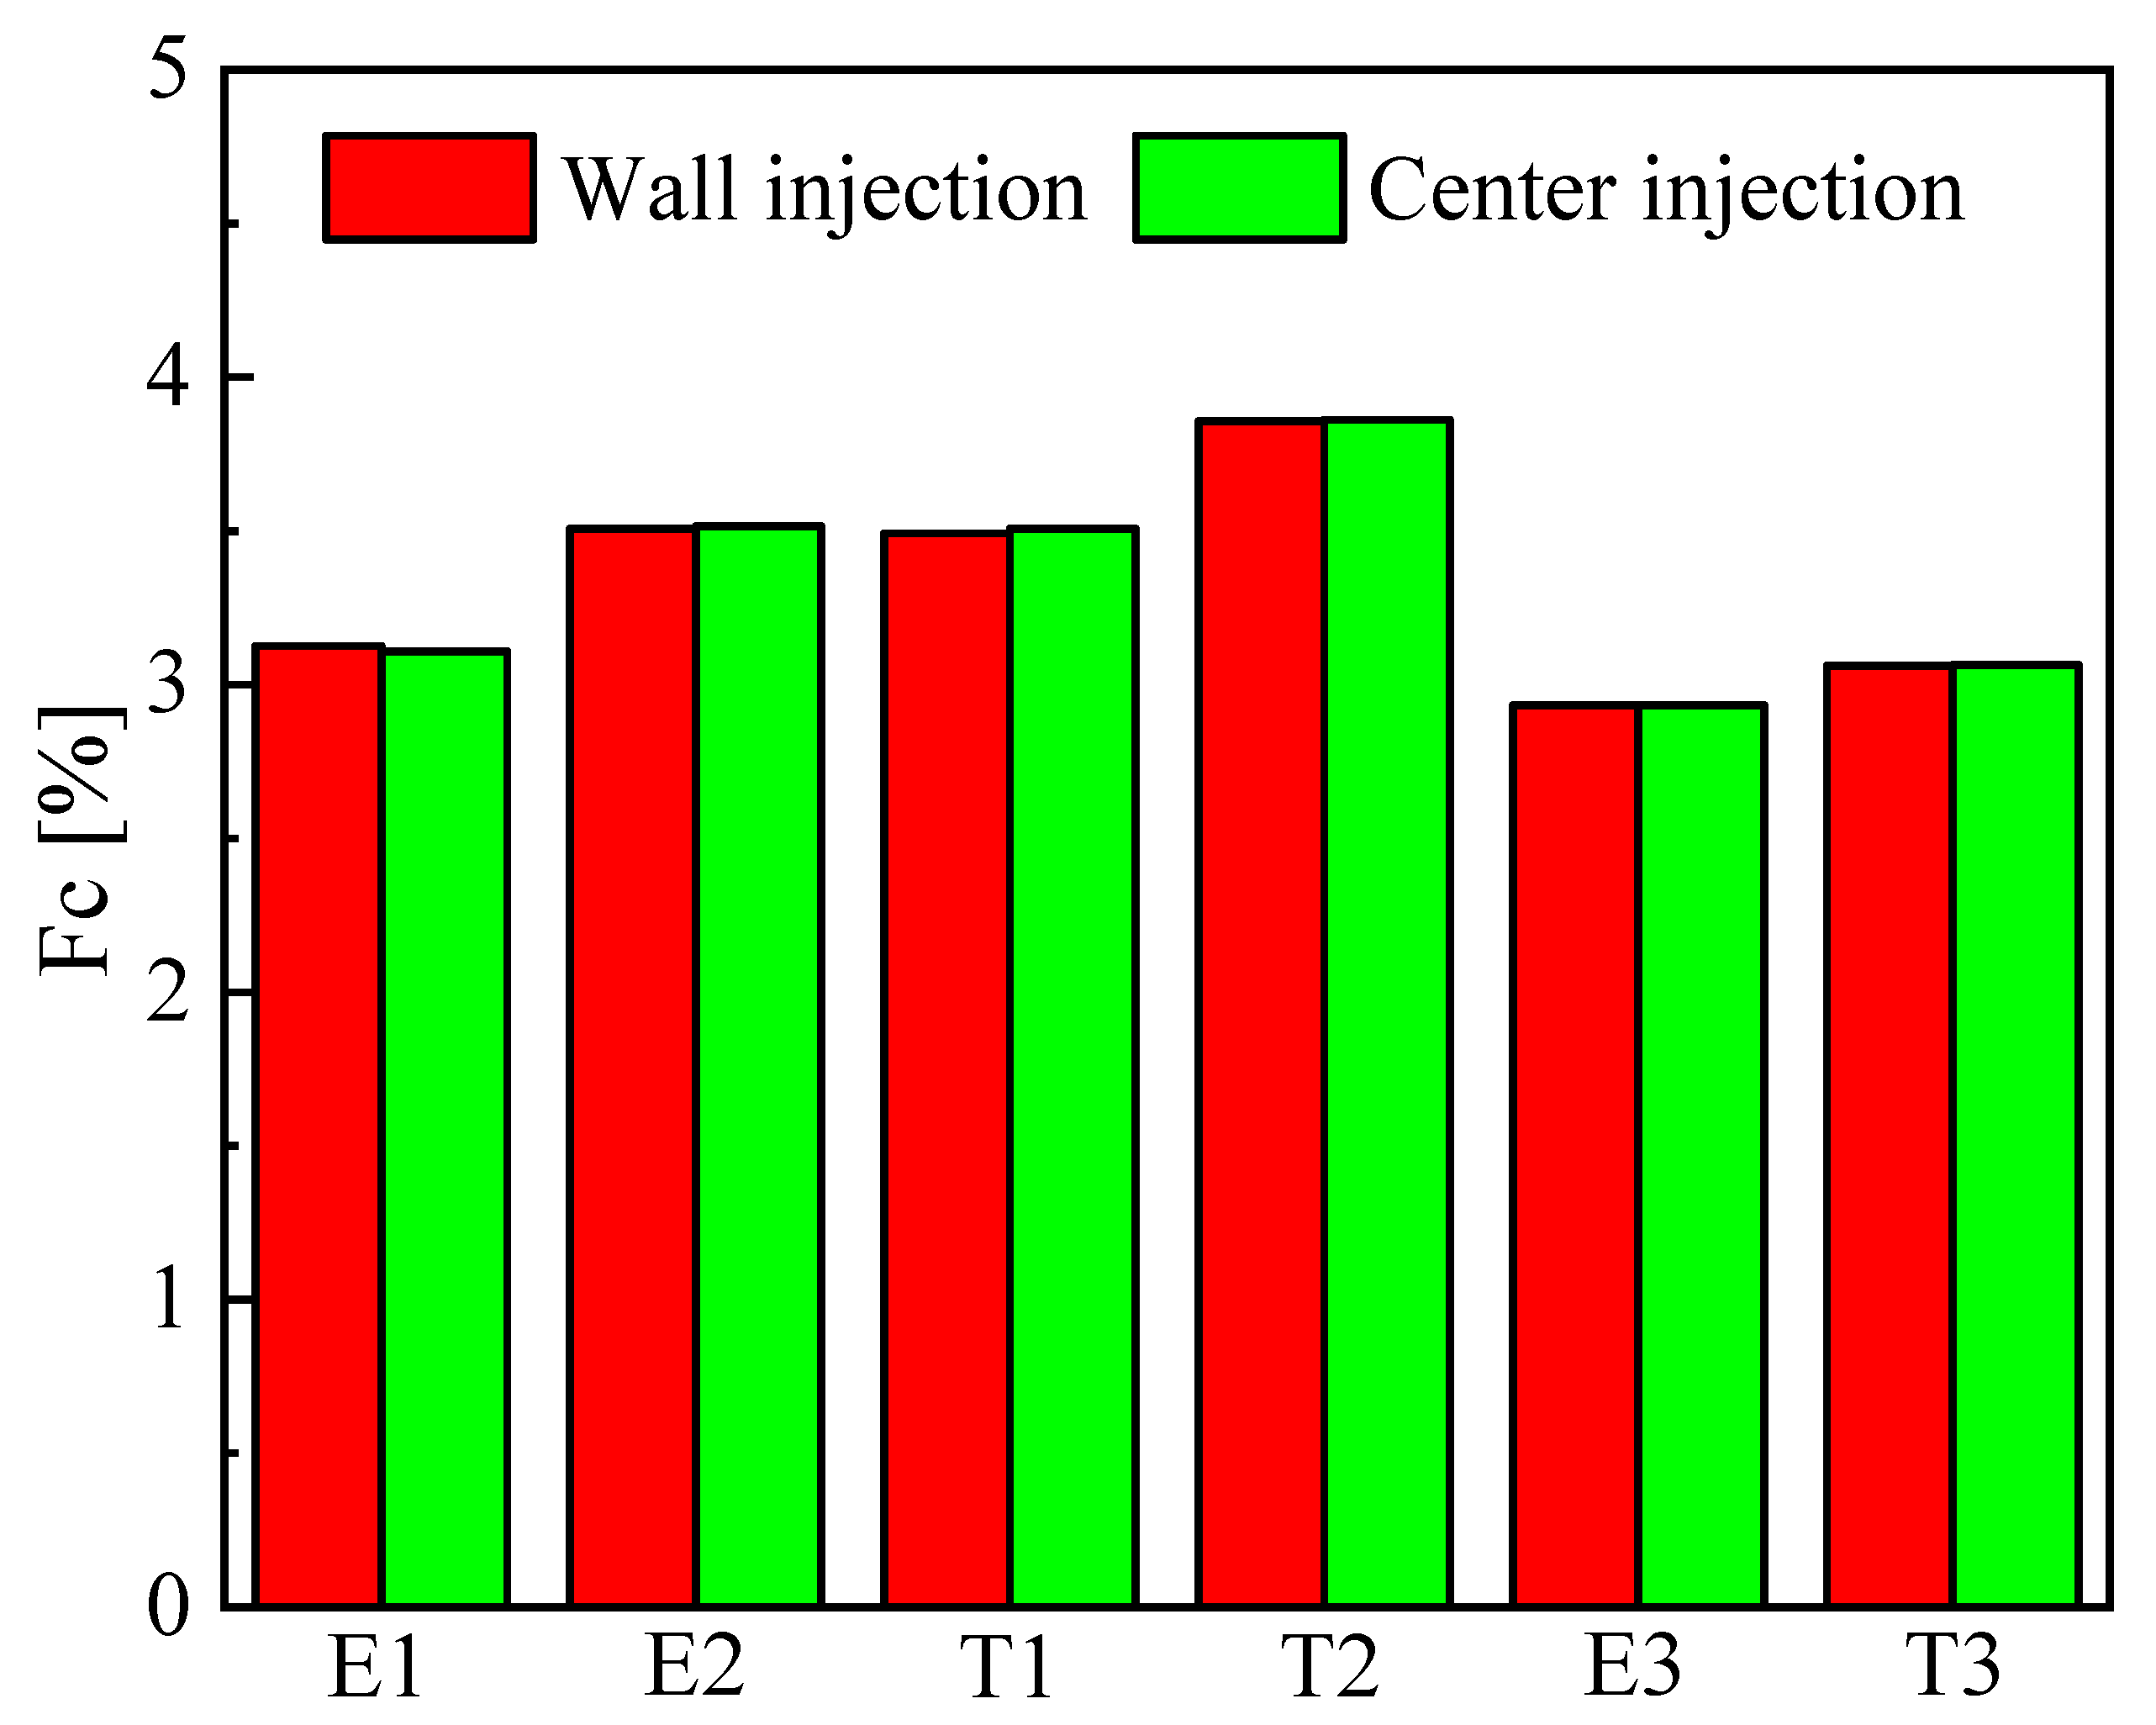
3.4. Field Synergy Analysis

Figure 9 compares the average reduced temperature caused by UWS. The results show that the wall injection has a more significant effect on UWS heat loss than the central injection in single mixer cases. For instance, the average reduced temperature of Case A-E2 reached 19.3 K at 0.1 s, but the average reduced temperature of Case B-E2 with the same mixer distribution was only 17.4 K at 0.1 s. As a result, NH3 production has increased, as can be seen in Figure 7. Different injection positions affect the average temperature drop caused by the UWS in every cases. It can be found that energy absorption has a positive effect on the production of NH3, but the effect on the uniformity index is indirect. In addition, in non-mixer, single mixer, and dual-mixer, the stay time of UWS is increasing. Longer stays help the UWS to absorb heat. In the single mixer, the stay time is almost the same, the mixer structure, which is beneficial to UWS heat absorption, is more beneficial to the SCR system. That is what we care about. Therefore, the field synergy principle (FSP) is used for analyzing the temperature field and velocity field coordination.
Take four cases of the flow field of the E-type mixer with a different arrangement of the center nozzle as an example. Figure 10 shows the temperature distribution of different mixers at 0.1 s. The mixer’s flow field temperature distribution is more uniform than the flow field without the mixer, and the blue area in the pipeline center is decreased. Among them, the temperature distribution in the rear section of the exhaust pipe under the dual-mixer flow field is the most uniform.
Figure 11 shows the velocity distribution of different mixers at 0.1 s. The velocity change area after the pre-mixer is larger than the post-mixer in the single mixer flow field. It is due to the inlet effect [18]. In addition, the role of the pre-mixer increases the range of the flow field disturbed after the post-mixer in the flow field of the dual-mixer. The post-mixer flow field has been affected by the similar vortex generated by the pre-mixer, and the transition flow field before and after the post-mixer in the dual-mixer is smooth.
Figure 12 shows the variation of the situation field synergy degree (Fc) in different mixers’ flow fields. The results show that the influence of different mixer positions on field synergy degree is similar, and the effect of the injector position is feeble. Different injector positions can only affect the temperature field and velocity field in a small range. The field synergy number in dual-mixer cases is lower than the single mixer because the dual-mixer increases the flow resistance and increases Pr. In general, the field synergy performance of the T-type mixer is better than the E-type mixer when the T-type mixer distributes in the same position. It is again verified that the flow field of the T-type mixer can promote the UWS heat transfer and is more stable than the flow field caused by the E-type mixer.

4. Conclusions

With the global economic development, the environmental problems [39,40,41] and energy crisis [42,43,44,45,46] are getting worse nowadays. The improvements of safety, stability, and de-nitration efficiency have been the research direction of scholars. Many scholars have found that ammonia is critical for improving catalytic efficiency. Therefore, simulation models were established in the three-dimensional simulation software Fluent to study the urea conversion and uniformity of different nozzles. Two typical injection methods and three distribution strategies of two kinds of mixers are proposed. The field synergy theory is employed to analyze the influence of the flow field of each mixer on the urea conversion, and the following conclusions are drawn:
(1)
From the flow field, the flow characteristics of mixers in different arrangement methods were evaluated. The mixer increases the vortex or turbulence strength of the entire flow field, while also increasing the inlet pressure. The average inlet pressure of the single mixer is 16.5 Pa, and in the dual-mixer, the average inlet pressure increases by 8.7 Pa.
(2)
In terms of concentration field, urea conversion rate and NH3 distribution were evaluated. The result shows that the effect of mixer is significant, and the dual-mixer can improve urea conversion rate and NH3 uniformity index by 169.5% and 136.4%, respectively.
(3)
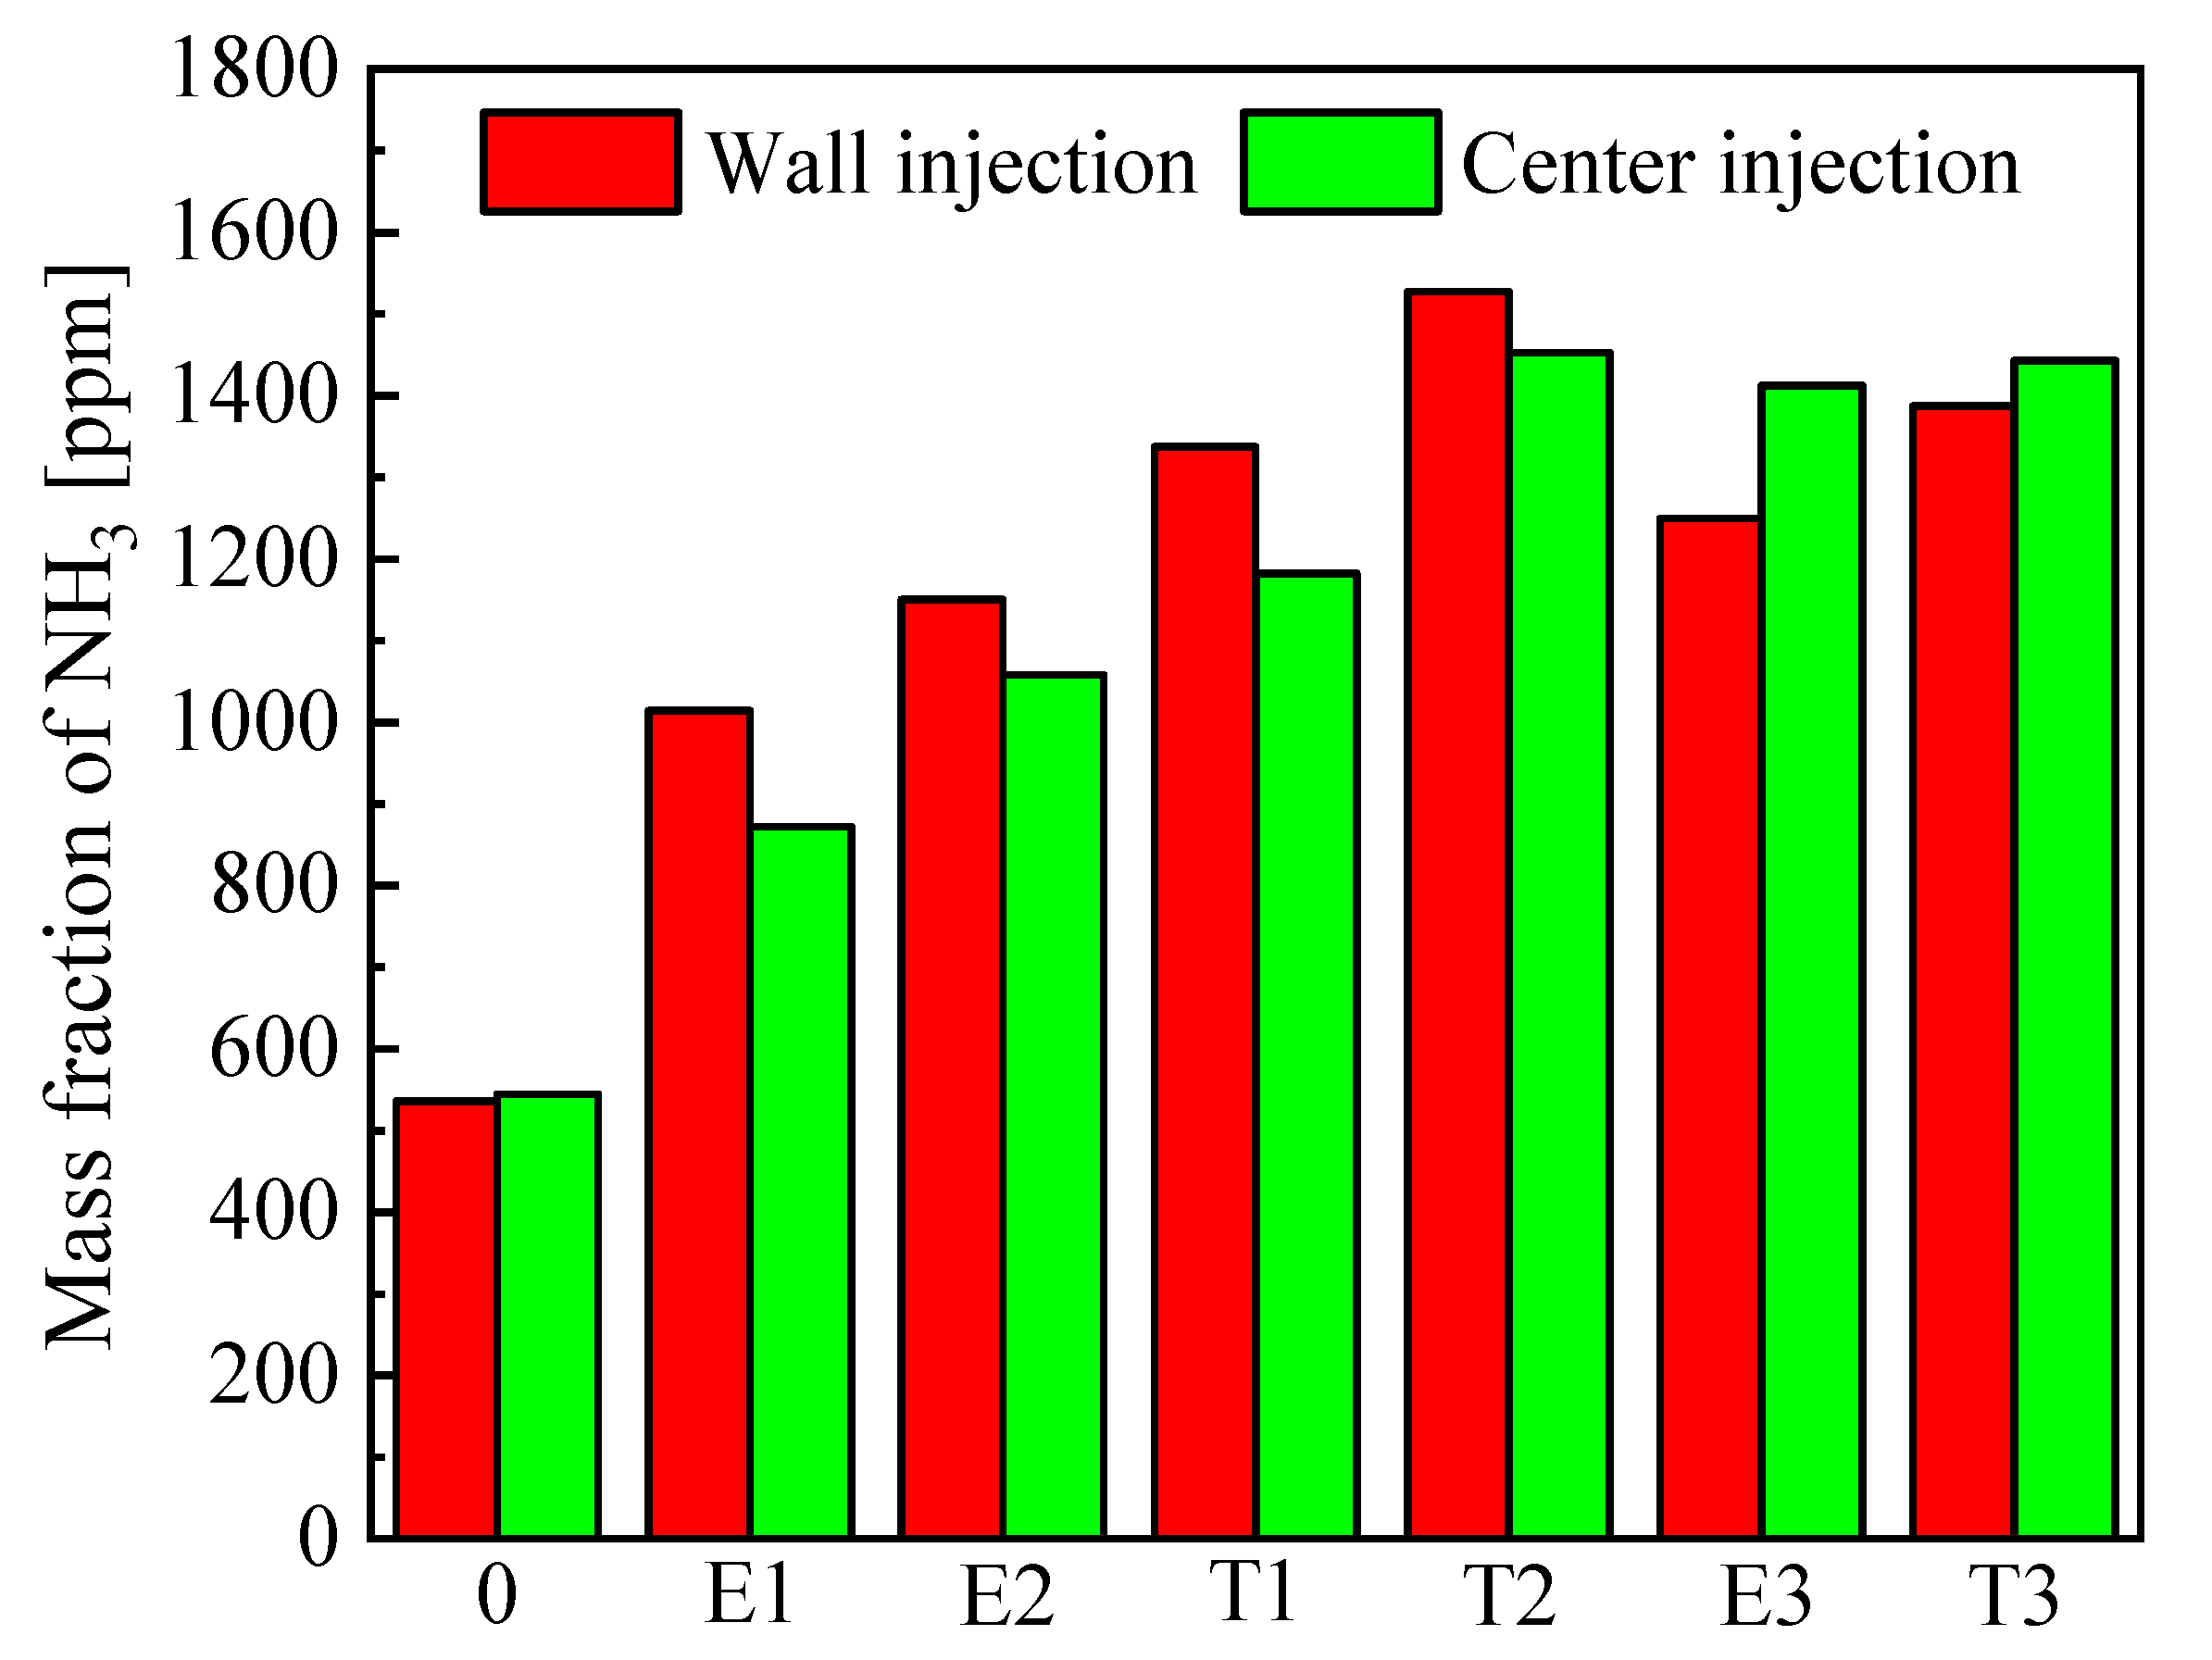
Based on the field synergy principle, the synergy degree between the temperature field and velocity field was evaluated. The result shows that when the stay time of the UWS in the exhaust pipe is consistent (the same number of mixers), higher field synergy is more conducive to the generation of NH3. In single mixer cases, Case A-T2 had a maximum field synergy of 3.86%t and the corresponding NH3 volume concentration of 1528 ppm.

Author Contributions

Conceptualization, D.T. and Z.A.; methodology, Z.A.; software, J.Y. and J.L.; validation, J.Y., J.L., D.T., Z.A, Z.F.; formal analysis, J.Y. and Z.A.; investigation, J.Y., D.T. and Z.A.; resources, D.T. and Z.A.; data curation, J.Y., J.L. and Z.A.; writing—original draft preparation, J.Y., J.L., D.T., Z.A., Z.F.; writing—review and editing, J.Y., J.L., D.T., Z.A., Z.F.; visualization, J.Y. and Z.F.; supervision, D.T. and Z.A.; project administration, Z.A.; funding acquisition, D.T.. All authors have read and agreed to the published version of the manuscript.

Funding

The work was supported by the Natural Science Foundation of Guangxi under the research grant NOs. 2018GXNSFAA281267 and 2018GXNSFAA294072.

Conflicts of Interest

The authors declare no conflict of interest.
Nomenclature
A The area of the surface ( m 2 )
A p Droplet surface area ( m 2 )
B M Spalding mass number
C u Closing coefficient
c p Specific Heat at Constant Pressure ( J / kg K )
D A The distance between the pre-mixer and the nozzle ( mm )
D B The distance between the common-mixer and the nozzle ( mm )
D T Turbulent diffusivity ( m 2 / s )
d u Spray droplet diameter ( μ m )
f Vector volume force ( N )
f F Heat flow vector ( m / s )
k Turbulent kinetic energy ( m 2 / s 2 )
l c Characteristic length ( m )
m p Droplet mass ( kg )
P ˜ Stress tensor ( N / m 2 )
Q Normalized Q criterion number
q Radiant heat distribution function
T i Hot exhaust gas temperature ( K )
t Represents time ( s )
U Internal energy ( J )
u x directional velocity vector
v y directional velocity vector
v Velocity vector ( m / s )
v c Characteristic velocity ( m / s )
v T Turbulent viscosity ( m 2 / s )
w z directional velocity vector
x Three-dimensional direction x
Y vap , g Vapor mass fraction in the bulk gas
Y vap , s Vapor mass fraction at the surface
y Three-dimensional direction y
z Three-dimensional direction z
T The temperature gradient ( K )
Greek Letters
γ a Uniformity index
ε Turbulent dissipation number
μ Dynamic viscosity ( Pa s )
ϕ a Field variable a
ϕ a ¯ The average value of the field variable over the surface
λ Heat transfer coefficient ( W / m K )
ρ Fluid density ( kg / m 3 )
ρ Density of bulk gas ( kg / m 3 )
σ Fluid surface tension coefficient
Dimensionless Numbers
Fc Synergy degree
Nu Nusselt number
Pr Prandtl number
Re Reynolds number
Sc Schmidt number
Sh Sherwood number corrected
Sh 0 Sherwood number
Abbreviations
CFDComputational fluid dynamics
FSPField synergy principle
NOxNitrogen oxides
OEDOrthogonal experimental design
PMParticulate matter
RNGRenormalization-group
SCRSelective catalytic reduction
UWSUrea–water solution

References

  1. Jiaqiang, E.; Zuo, W.; Gao, J.; Peng, Q.; Zhang, Z.; Hieu, P.M. Effect analysis on pressure drop of the continuous regeneration-diesel particulate filter based on NO2 assisted regeneration. Appl. Therm. Eng. 2016, 100, 356–366. [Google Scholar]
  2. Jiaqiang, E.; Liu, G.; Zhang, Z.; Han, D.; Chen, J.; Wei, K.; Gong, J.; Yin, Z. Effect analysis on cold starting performance enhancement of a diesel engine fueled with biodiesel fuel based on an improved thermodynamic model. Appl. Energy 2019, 243, 321–335. [Google Scholar]
  3. Cai, T.; Zhao, D.; Li, X.; Shi, B.; Li, J. Mitigating NO emissions from an ammonia-fueled micro-power system with a perforated plate implemented. J. Hazard. Mater. 2021, 401, 123848. [Google Scholar] [CrossRef] [PubMed]
  4. Wu, G.; Wu, D.; Li, Y.; Meng, L. Effect of Acetone-n-Butanol-Ethanol (ABE) as an Oxygenate on Combustion, Performance, and Emission Characteristics of a Spark Ignition Engine. J. Chem. 2020, 2020, 1–11. [Google Scholar] [CrossRef] [Green Version]
  5. Zhang, Z.; Ye, J.; Tan, D.; Feng, Z.; Luo, J.; Tan, Y.; Huang, Y. The effects of Fe2O3 based DOC and SCR catalyst on the combustion and emission characteristics of a diesel engine fueled with biodiesel. Fuel 2021, 290, 120039. [Google Scholar] [CrossRef]
  6. Cai, T.; Zhao, D. Effects of fuel composition and wall thermal conductivity on thermal and NOx emission performances of an ammonia/hydrogen-oxygen micro-power system. Fuel Process. Technol. 2020, 209, 106527. [Google Scholar] [CrossRef]
  7. Cai, T.; Zhao, D.; Wang, B.; Li, J.; Guan, Y. NOx emission and thermal performances studies on premixed ammonia-oxygen combustion in a CO2-free micro-planar combustor. Fuel 2020, 280, 118554. [Google Scholar] [CrossRef]
  8. Jiaqiang, E.; Zhang, Z.; Chen, J.; Pham, M.; Zhao, X.; Peng, Q.; Zhang, B.; Yin, Z. Performance and emission evaluation of a marine diesel engine fueled by water biodiesel-diesel emulsion blends with a fuel additive of a cerium oxide nanoparticle. Energy Convers. Manag. 2018, 169, 194–205. [Google Scholar]
  9. Zhang, Z.; Jiaqiang, E.; Deng, Y.; Pham, M.; Zuo, W.; Peng, Q.; Yin, Z. Effects of fatty acid methyl esters proportion on combustion and emission characteristics of a biodiesel fueled marine diesel engine. Energy Convers. Manag. 2018, 159, 244–253. [Google Scholar] [CrossRef]
  10. Zhang, Z.; Jiaqiang, E.; Chen, J.; Zhao, X.; Zhang, B.; Deng, Y.; Peng, Q.; Yin, Z. Effects of boiling heat transfer on the performance enhancement of a medium speed diesel engine fueled with diesel and rapeseed methyl ester. Appl. Therm. Eng. 2020, 169, 114984. [Google Scholar] [CrossRef]
  11. Jiaqiang, E.; Zhang, Z.; Tu, Z.; Zuo, W.; Hu, W.; Han, D.; Jin, Y. Effect analysis on flow and boiling heat transfer performance of cooling water-jacket of bearing in the gasoline engine turbocharger. Appl. Therm. Eng. 2018, 130, 754–766. [Google Scholar]
  12. Zhang, B.; Zuo, H.; Huang, Z.; Tan, J.; Zuo, Q. Endpoint forecast of different diesel-biodiesel soot filtration process in diesel particulate filters considering ash deposition. Fuel 2020, 272, 117678. [Google Scholar] [CrossRef]
  13. Han, D.; Jiaqiang, E.; Deng, Y.; Chen, J.; Leng, E.; Liao, G.; Zhao, X.; Feng, C.; Zhang, F. A review of studies using hydrocarbon adsorption material for reducing hydrocarbon emissions from cold start of gasoline engine. Renew. Sustain. Energy Rev. 2021, 135, 110079. [Google Scholar] [CrossRef]
  14. Cho, Y.S.; Lee, S.W.; Choi, W.C.; Yoon, Y.B. Urea-SCR system optimization with various combinations of mixer types and decomposition pipe lengths. Int. J. Automot. Technol. 2014, 15, 723–731. [Google Scholar] [CrossRef]
  15. Um, H.S.; Kim, D.; Kim, K.H. Numerical study on the design of urea decomposition chamber in LP SCR system. Int. J. Nav. Arch. Ocean Eng. 2019, 11, 307–313. [Google Scholar] [CrossRef]
  16. Chen, Q.; Meng, J.-A. Field synergy analysis and optimization of the convective mass transfer in photocatalytic oxidation reactors. Int. J. Heat Mass Transf. 2008, 51, 2863–2870. [Google Scholar] [CrossRef]
  17. Guo, J.; Huai, X. Numerical investigation of helically coiled tube from the viewpoint of field synergy principle. Appl. Therm. Eng. 2016, 98, 137–143. [Google Scholar] [CrossRef]
  18. Li, F.; Zhu, W.; He, H. Numerical optimization on microchannel flow and heat transfer performance based on field synergy principle. Int. J. Heat Mass Transf. 2019, 130, 375–385. [Google Scholar] [CrossRef]
  19. Jiaqiang, E.; Zhao, X.; Xie, L.; Zhang, B.; Chen, J.; Zuo, Q.; Han, D.; Hu, W.; Zhang, Z. Performance enhancement of microwave assisted regeneration in a wall-flow diesel particulate filter based on field synergy theory. Energy 2019, 169, 719–729. [Google Scholar] [CrossRef]
  20. Van Gils, R.W.; Speetjens, M.F.M.; Zwart, H.J.; Nijmeijer, H. Output-based modal control of three-dimensional pool-boiling systems. Int. J. Therm. Sci. 2014, 82, 34–46. [Google Scholar] [CrossRef]
  21. Kang, M.G. Effects of the location of side inflow holes on pool boiling heat transfer in a vertical annulus. Int. J. Heat Mass Transf. 2008, 51, 1707–1712. [Google Scholar] [CrossRef]
  22. Das, S.; Saha, B.; Bhaumik, S. Experimental study of nucleate pool boiling heat transfer of water by surface functionalization with crystalline TiO2 nanostructure. Appl. Therm. Eng. 2017, 113, 1345–1357. [Google Scholar] [CrossRef]
  23. Marelli, S.; Marmorato, G.; Capobianco, M. Evaluation of heat transfer effects in small turbochargers by theoretical model and its experimental validation. Energy 2016, 112, 264–272. [Google Scholar] [CrossRef]
  24. Mohammadi, A.; Hashemi, H.; Jazayeri, A.; Ahmadi, M. Two Phase Flow Simulation for Film Boiling Heat Transfer Calculation in Water-jacket of Diesel Engine. In Proceedings of the Seventh International Conference on Internal Combustion Engines, Tehran, Iran, 24–29 July 2011; pp. 1721–1729. [Google Scholar]
  25. Kang, M.G. Effects of pool subcooling on boiling heat transfer in a vertical annulus with closed bottom. Int. J. Heat Mass Transf. 2005, 48, 255–263. [Google Scholar] [CrossRef]
  26. Payri, F.; Olmeda, P.; Arnau, F.J.; Dombrovsky, A.; Smith, L. External heat losses in small turbochargers: Model and experiments. Energy 2014, 71, 534–546. [Google Scholar] [CrossRef]
  27. Zhang, Z.; Jiaqiang, E.; Chen, J.; Zhu, H.; Zhao, X.; Han, D.; Zuo, W.; Peng, Q.; Gong, J.; Yin, Z. Effects of low-level water addition on spray, combustion and emission characteristics of a medium speed diesel engine fueled with biodiesel fuel. Fuel 2019, 239, 245–262. [Google Scholar] [CrossRef]
  28. Ong, H.C.; Masjuki, H.; Mahlia, T.; Silitonga, A.; Chong, W.; Leong, K. Optimization of biodiesel production and engine performance from high free fatty acid Calophyllum inophyllum oil in CI diesel engine. Energy Convers. Manag. 2014, 81, 30–40. [Google Scholar] [CrossRef]
  29. Tan, D.; Chen, Z.; Li, J.; Luo, J.; Yang, D.; Cui, S.; Zhang, Z. Effects of Swirl and Boiling Heat Transfer on the Performance Enhancement and Emission Reduction for a Medium Diesel Engine Fueled with Biodiesel. Processes 2021, 9, 568. [Google Scholar] [CrossRef]
  30. Zuo, Q.; Xie, Y.; Jiaqiang, E.; Zhu, X.; Zhang, B.; Tang, Y.; Zhu, G.; Wang, Z.; Zhang, J. Effect of different exhaust parameters on NO conversion efficiency enhancement of a dual-carrier catalytic converter in the gasoline engine. Energy 2020, 191, 116521. [Google Scholar] [CrossRef]
  31. Giakoumis, E.G.; Rakopoulos, D.C.; Rakopoulos, C.D. Combustion noise radiation during dynamic diesel engine operation including effects of various biofuel blends: A review. Renew. Sustain. Energy Rev. 2016, 54, 1099–1113. [Google Scholar] [CrossRef]
  32. Ozsezen, A.N.; Canakci, M.; Turkcan, A.; Sayin, C. Performance and combustion characteristics of a DI diesel engine fueled with waste palm oil and canola oil methyl esters. Fuel 2009, 88, 629–636. [Google Scholar] [CrossRef]
  33. Catania, A.E.; Finesso, R.; Spessa, E. Predictive zero-dimensional combustion model for DI diesel engine feed-forward control. Energy Convers. Manag. 2011, 52, 3159–3175. [Google Scholar] [CrossRef]
  34. Yang, Y.; Dec, J.E.; Dronniou, N.; Sjöberg, M. Tailoring HCCI heat-release rates with partial fuel stratification: Comparison of two-stage and single-stage-ignition fuels. Proc. Combust. Inst. 2011, 33, 3047–3055. [Google Scholar] [CrossRef]
  35. Watson, N.; Janota, M.S. Turbocharging the Internal Combustion Engine; Springer Science and Business Media LLC: Berlin/Heidelberg, Germany, 1982. [Google Scholar]
  36. Baldi, F.; Theotokatos, G.; Andersson, K. Development of a combined mean value–zero dimensional model and application for a large marine four-stroke Diesel engine simulation. Appl. Energy 2015, 154, 402–415. [Google Scholar] [CrossRef] [Green Version]
  37. Yu, W.; Zhang, Z.; Liu, B. Effect Analysis on the Performance Enhancement and Emission Reduction of Diesel Engine Fueled with Biodiesel Fuel Based on an Improved Model. Int. J. Aerosp. Eng. 2020, 2020, 1–14. [Google Scholar] [CrossRef]
  38. Heywood, J.N. Internal Combustion Engine Fundamentals; McGraw-Hill: New York, NY, USA, 1988. [Google Scholar]
  39. Yu, W.; Zhang, Z.; Liu, B. Investigation on the Performance Enhancement and Emission Reduction of a Biodiesel Fueled Diesel Engine Based on an Improved Entire Diesel Engine Simulation Model. Processes 2021, 9, 104. [Google Scholar] [CrossRef]
  40. Zhang, B.; Jiaqiang, E.; Gong, J.; Yuan, W.; Zuo, W.; Li, Y.; Fu, J. Multidisciplinary design optimization of the diesel particulate filter in the composite regeneration process. Appl. Energy 2016, 181, 14–28. [Google Scholar] [CrossRef]
  41. Feng, C.; Jiaqiang, E.; Han, W.; Deng, Y.; Zhang, B.; Zhao, X.; Han, D. Key technology and application analysis of zeolite adsorption for energy storage and heat-mass transfer process: A review. Renew. Sustain. Energy Rev. 2021, 144, 110954. [Google Scholar] [CrossRef]
  42. Wang, S.; Fan, A. Combustion regimes of syngas flame in a micro flow reactor with controlled temperature profile: A numerical study. Combust. Flame. 2021, 230, 111457. [Google Scholar] [CrossRef]
  43. Zuo, H.; Tan, J.; Wei, K.; Huang, Z.; Zhong, D.; Xie, F. Effects of different poses and wind speeds on wind-induced vibration characteristics of a dish solar concentrator system. Renew. Energy 2021, 168, 1308–1326. [Google Scholar] [CrossRef]
  44. Peng, Q.; Yang, W.; Jiaqiang, E.; Li, Z.; Xu, H.; Fu, G.; Li, S. Investigation on H2/air combustion with C3H8 addition in the combustor with part/full porous medium. Energy Convers. Manag. 2021, 228, 113652. [Google Scholar] [CrossRef]
  45. Peng, Q.; Yang, W.; Jiaqiang, E.; Li, S.; Li, Z.; Xu, H.; Fu, G. Effects of propane addition and burner scale on the combustion characteristics and working performance. Appl. Energy 2021, 285, 116484. [Google Scholar] [CrossRef]
  46. Wei, K.; Yang, Y.; Zuo, H.; Zhong, D. A review on ice detection technology and ice elimination technology for wind turbine. Wind Energy 2020, 23, 433–457. [Google Scholar] [CrossRef]
Figure 1. The injection geometrical structure of the selective catalytic reduction (SCR) system.
Processes 09 00786 g001
Figure 2. The normalized Q criterion number (Q) of three kinds of grids.
Processes 09 00786 g002
Figure 3. The comparisons of the experimental and simulated NH3 conversion efficiency at different exhaust gas temperatures.
Processes 09 00786 g003
Figure 4. The Q and turbulence intensity in different flow fields.
Processes 09 00786 g004
Figure 5. The Q and turbulence intensity in different flow fields.
Processes 09 00786 g005
Figure 6. The NH3 concentration.
Processes 09 00786 g006
Figure 7. The NH3 volume-averaged concentration.
Processes 09 00786 g007
Figure 8. The NH3 concentration uniformity index.
Processes 09 00786 g008
Figure 9. The average reduced temperature of exhaust gas.
Processes 09 00786 g009
Figure 10. The temperature distribution of different mixers at 0.1 s.
Processes 09 00786 g010
Figure 11. The velocity distribution of different mixers at 0.1 s.
Processes 09 00786 g011
Figure 12. The variation of the situation field synergy degree.
Processes 09 00786 g012
Table 1. Simulation cases.
CaseInjector PositionMixer NumberMixer Type
A0Pipe wall0- ; -
A-E11E ; -
A-E2- ; E
A-T1T ; -
A-T2- ; T
A-E32E ; E
A-T3T ; T
B0Pipe center0- ; -
B-E11E ; -
B-E2- ; E
B-T1T ; -
B-T2- ; T
B-E32E ; E
B-T3T ; T
Publisher’s Note: MDPI stays neutral with regard to jurisdictional claims in published maps and institutional affiliations.

