
A Molecular Dynamics Study of Heat Transfer Enhancement during Phase Change from a Nanoengineered Solid Surface


Abstract
1. Introduction
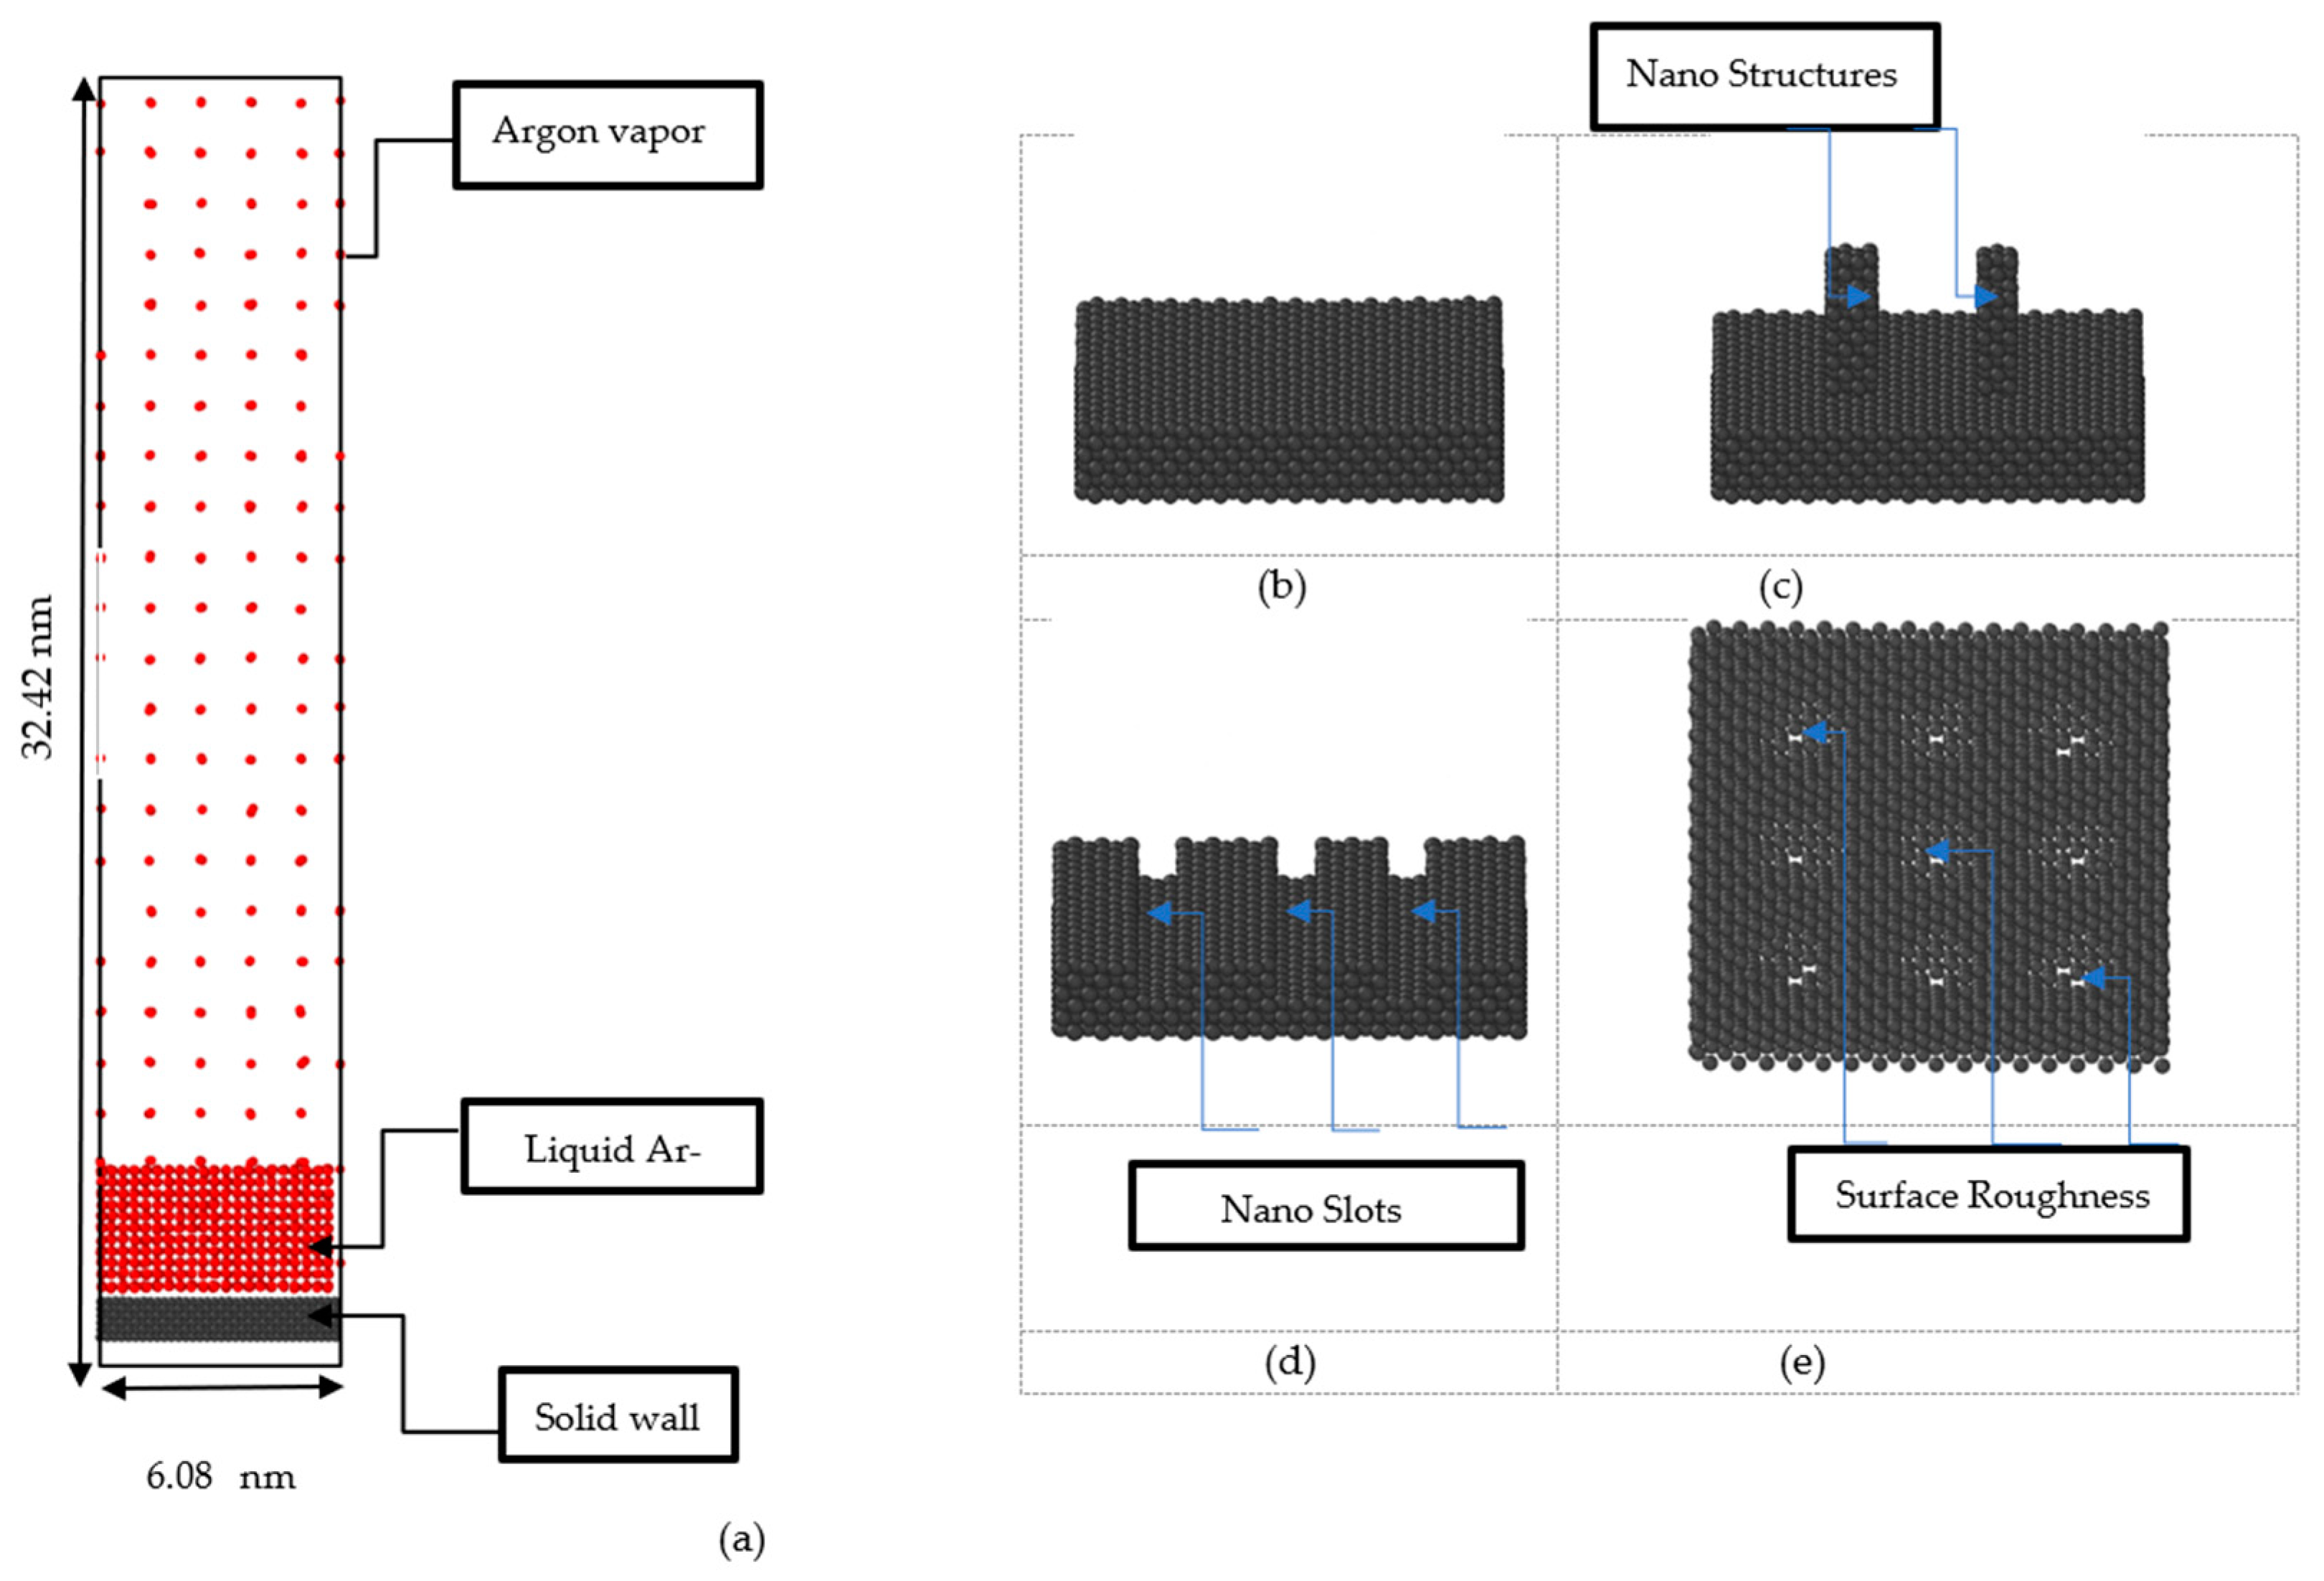
2. Methodology
Reason for Using Liquid Argon and Extension to Complex Fluid
3. Results and Discussion
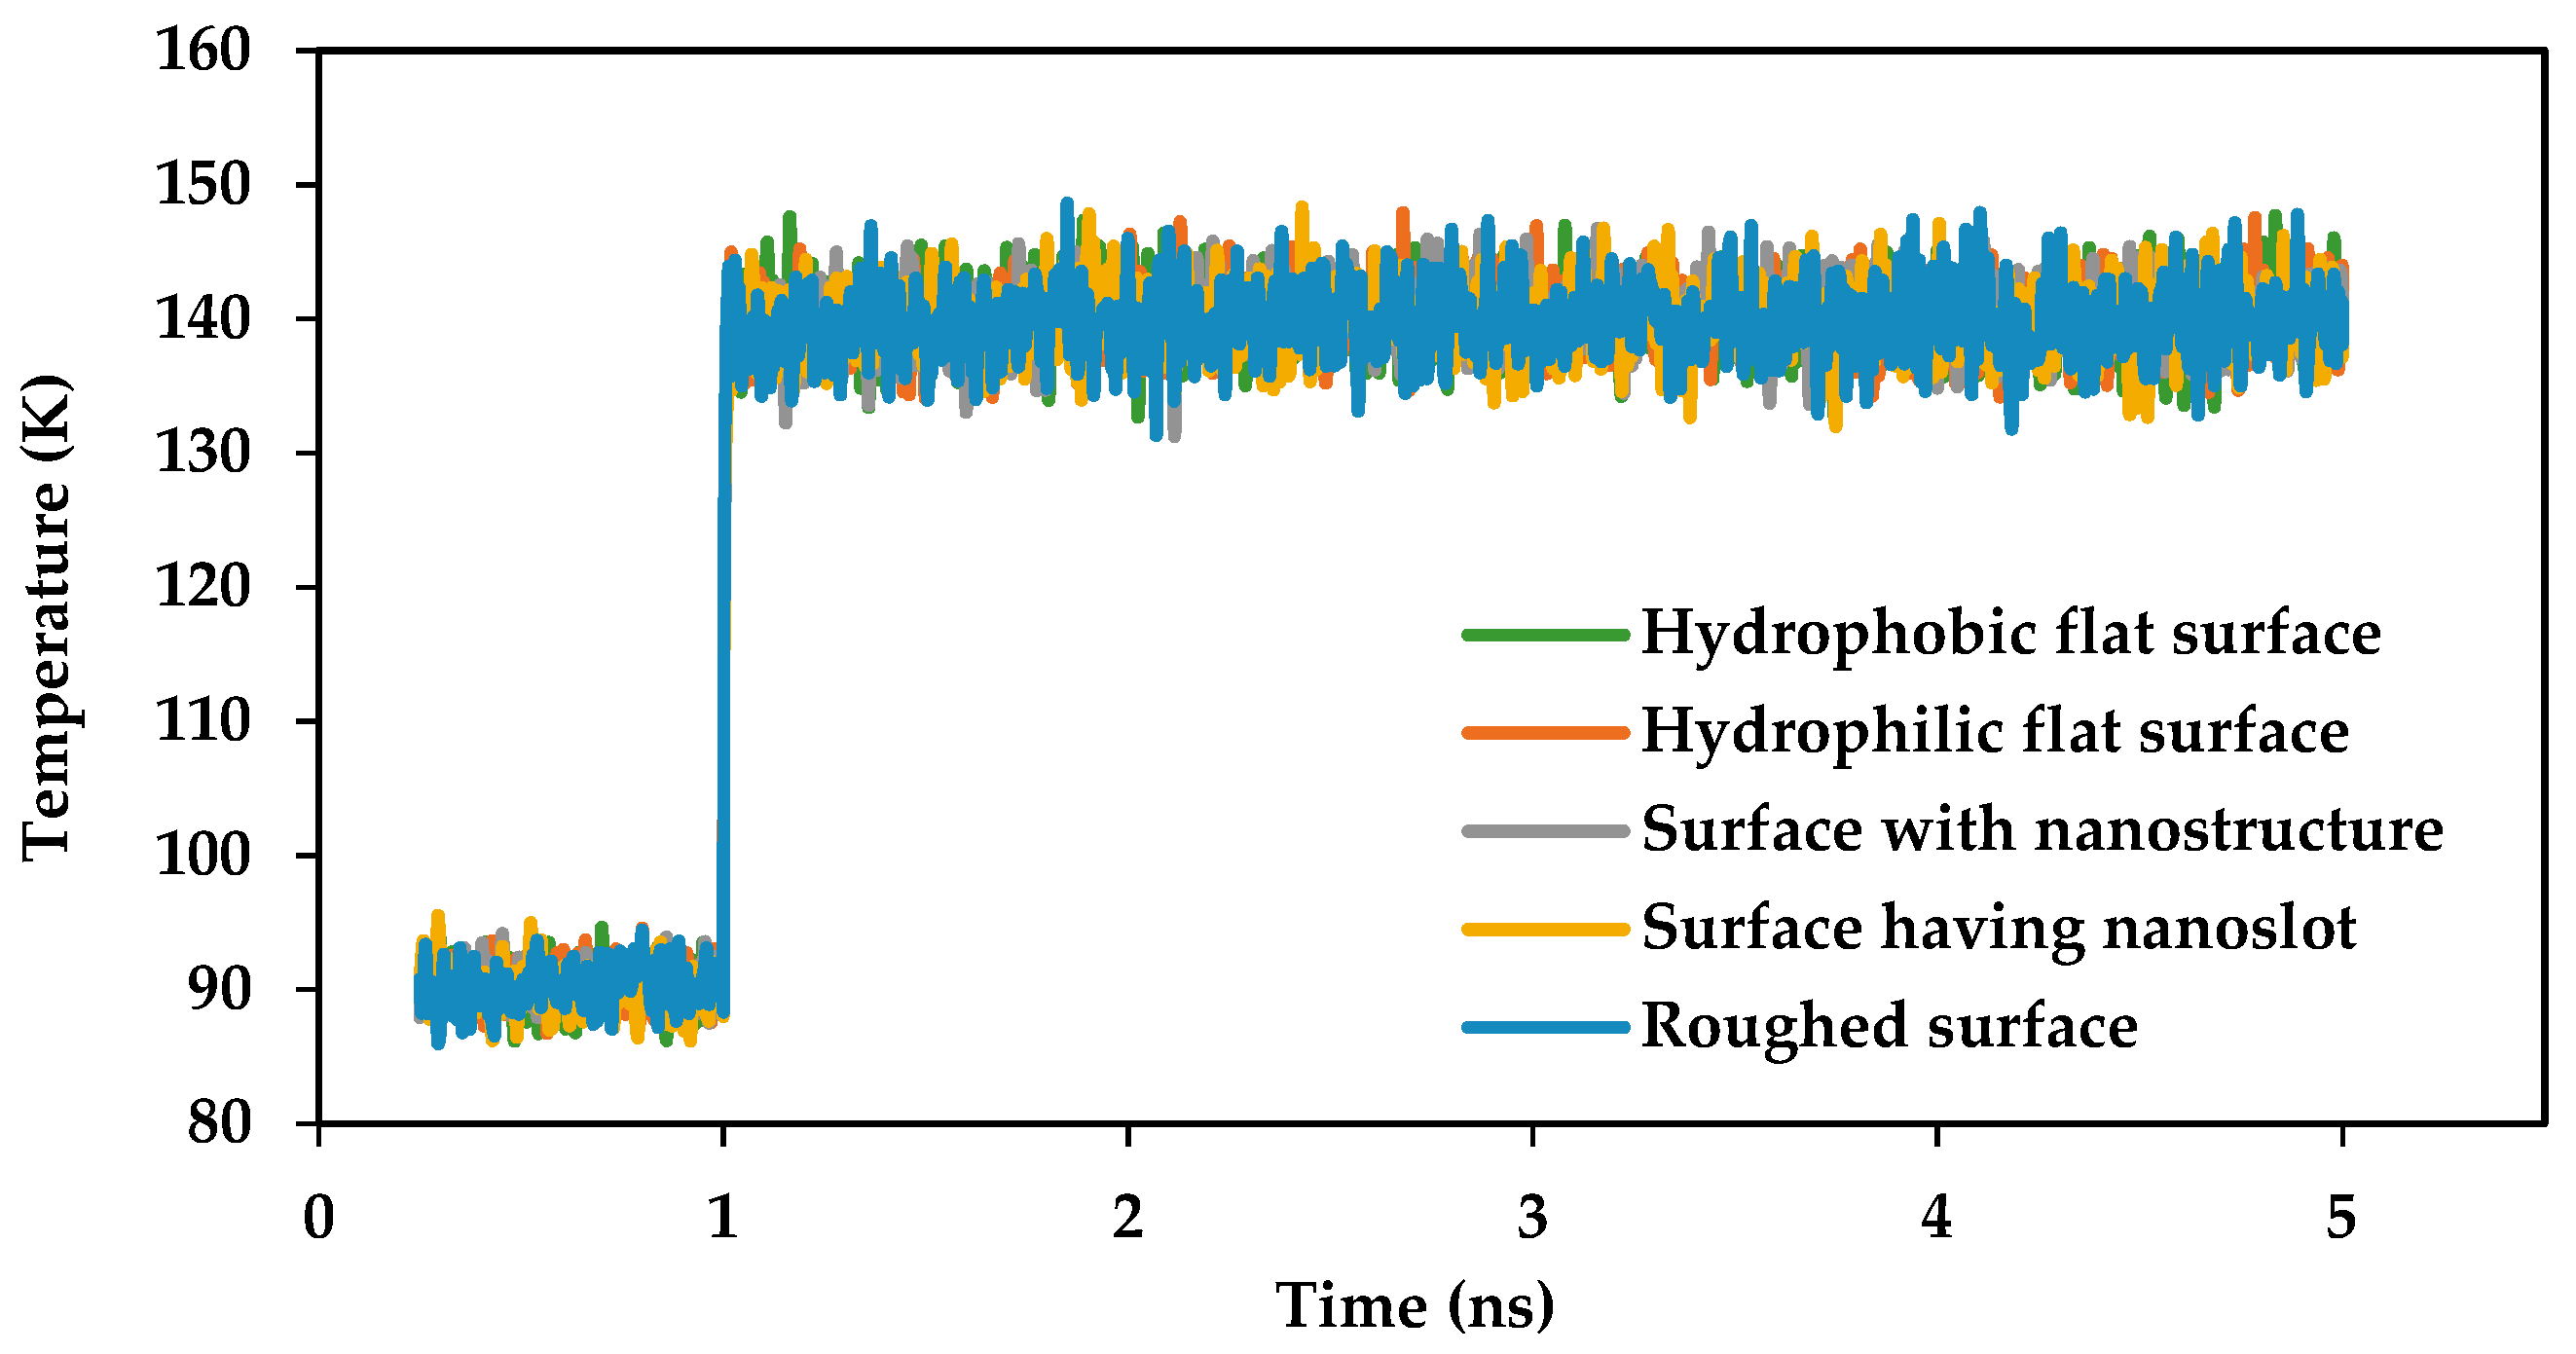
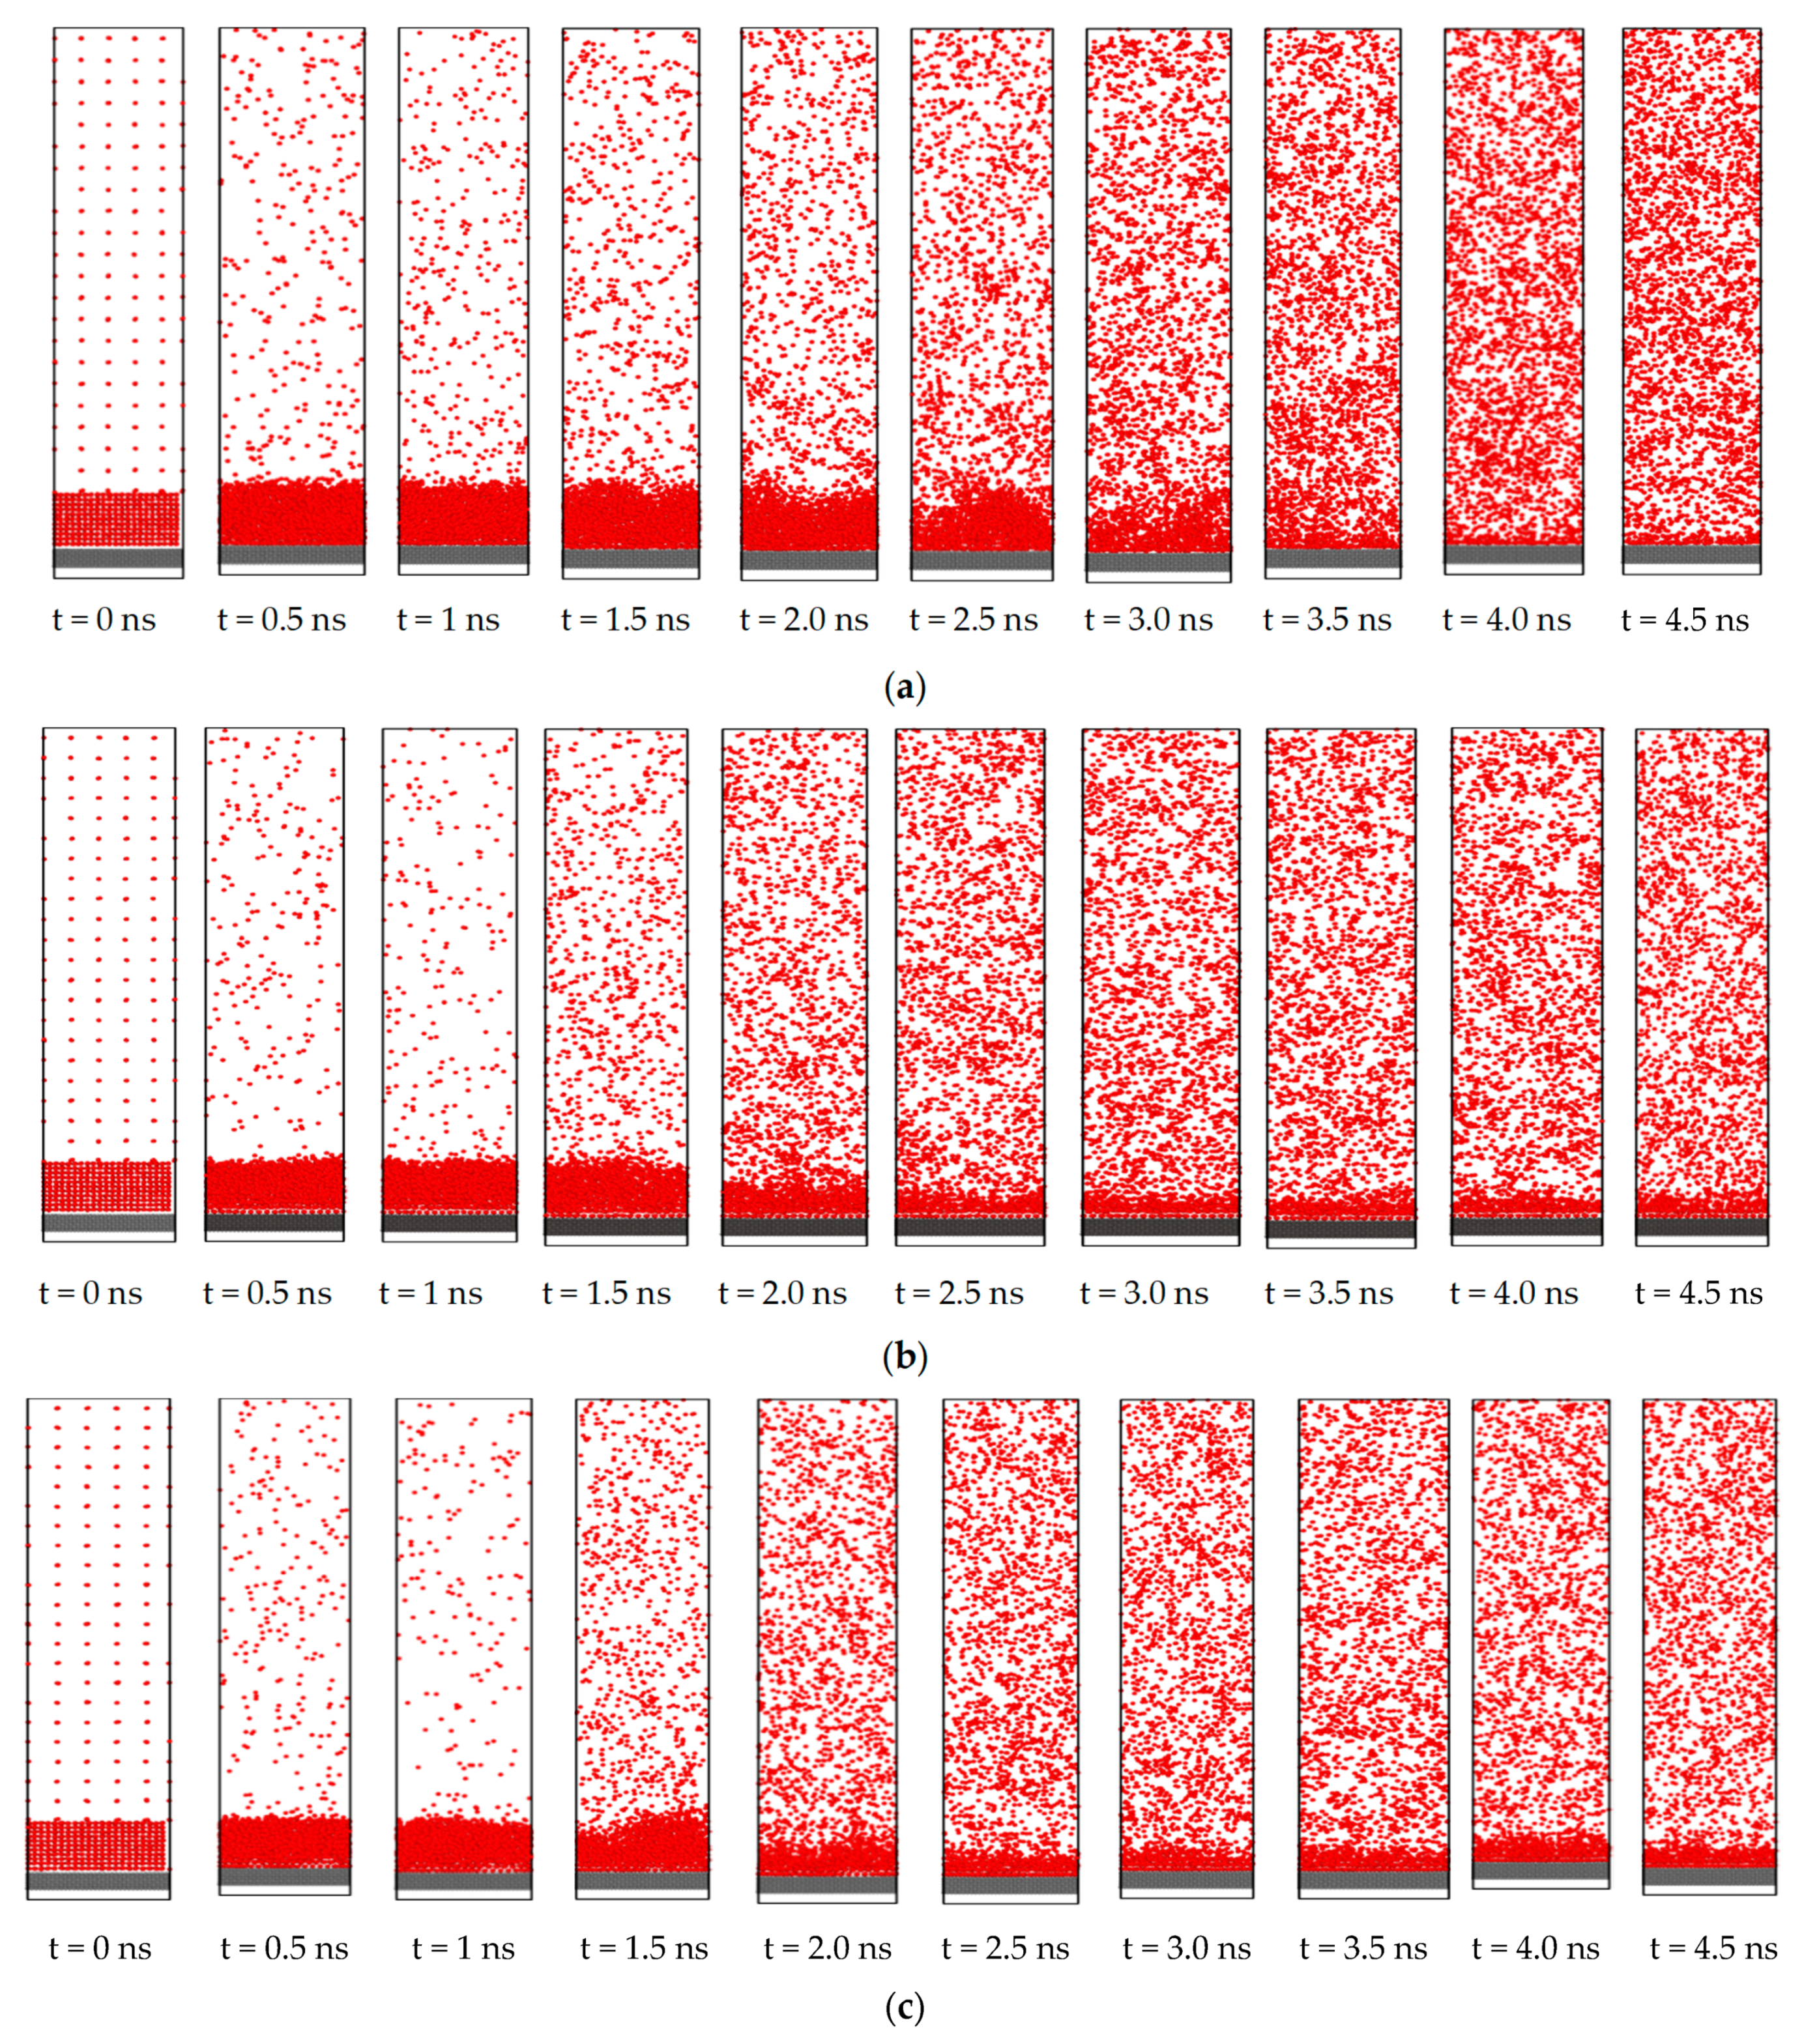
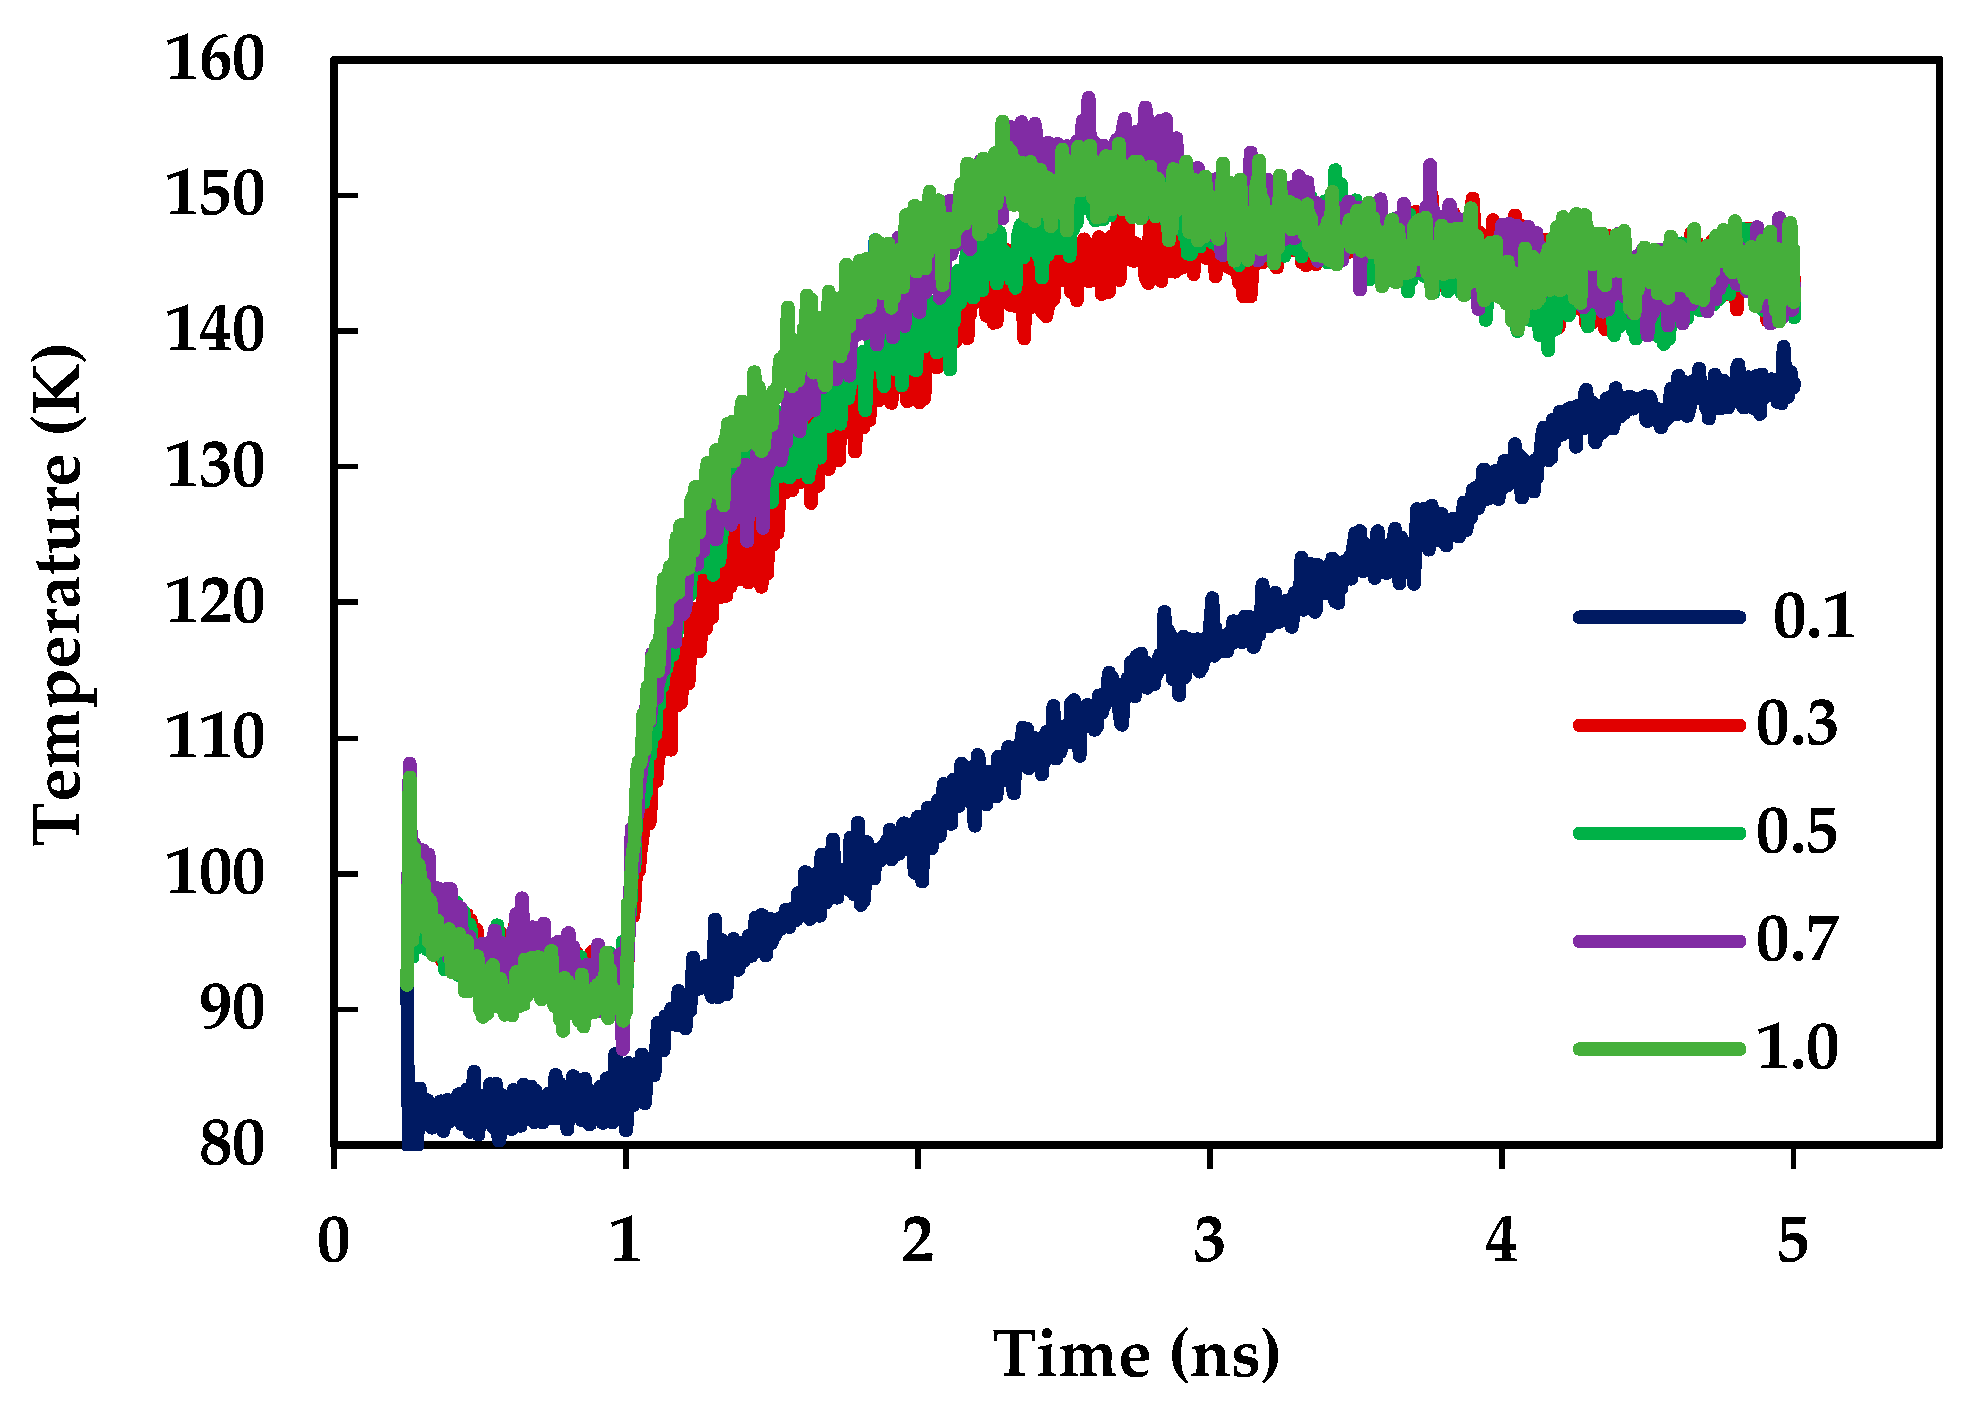
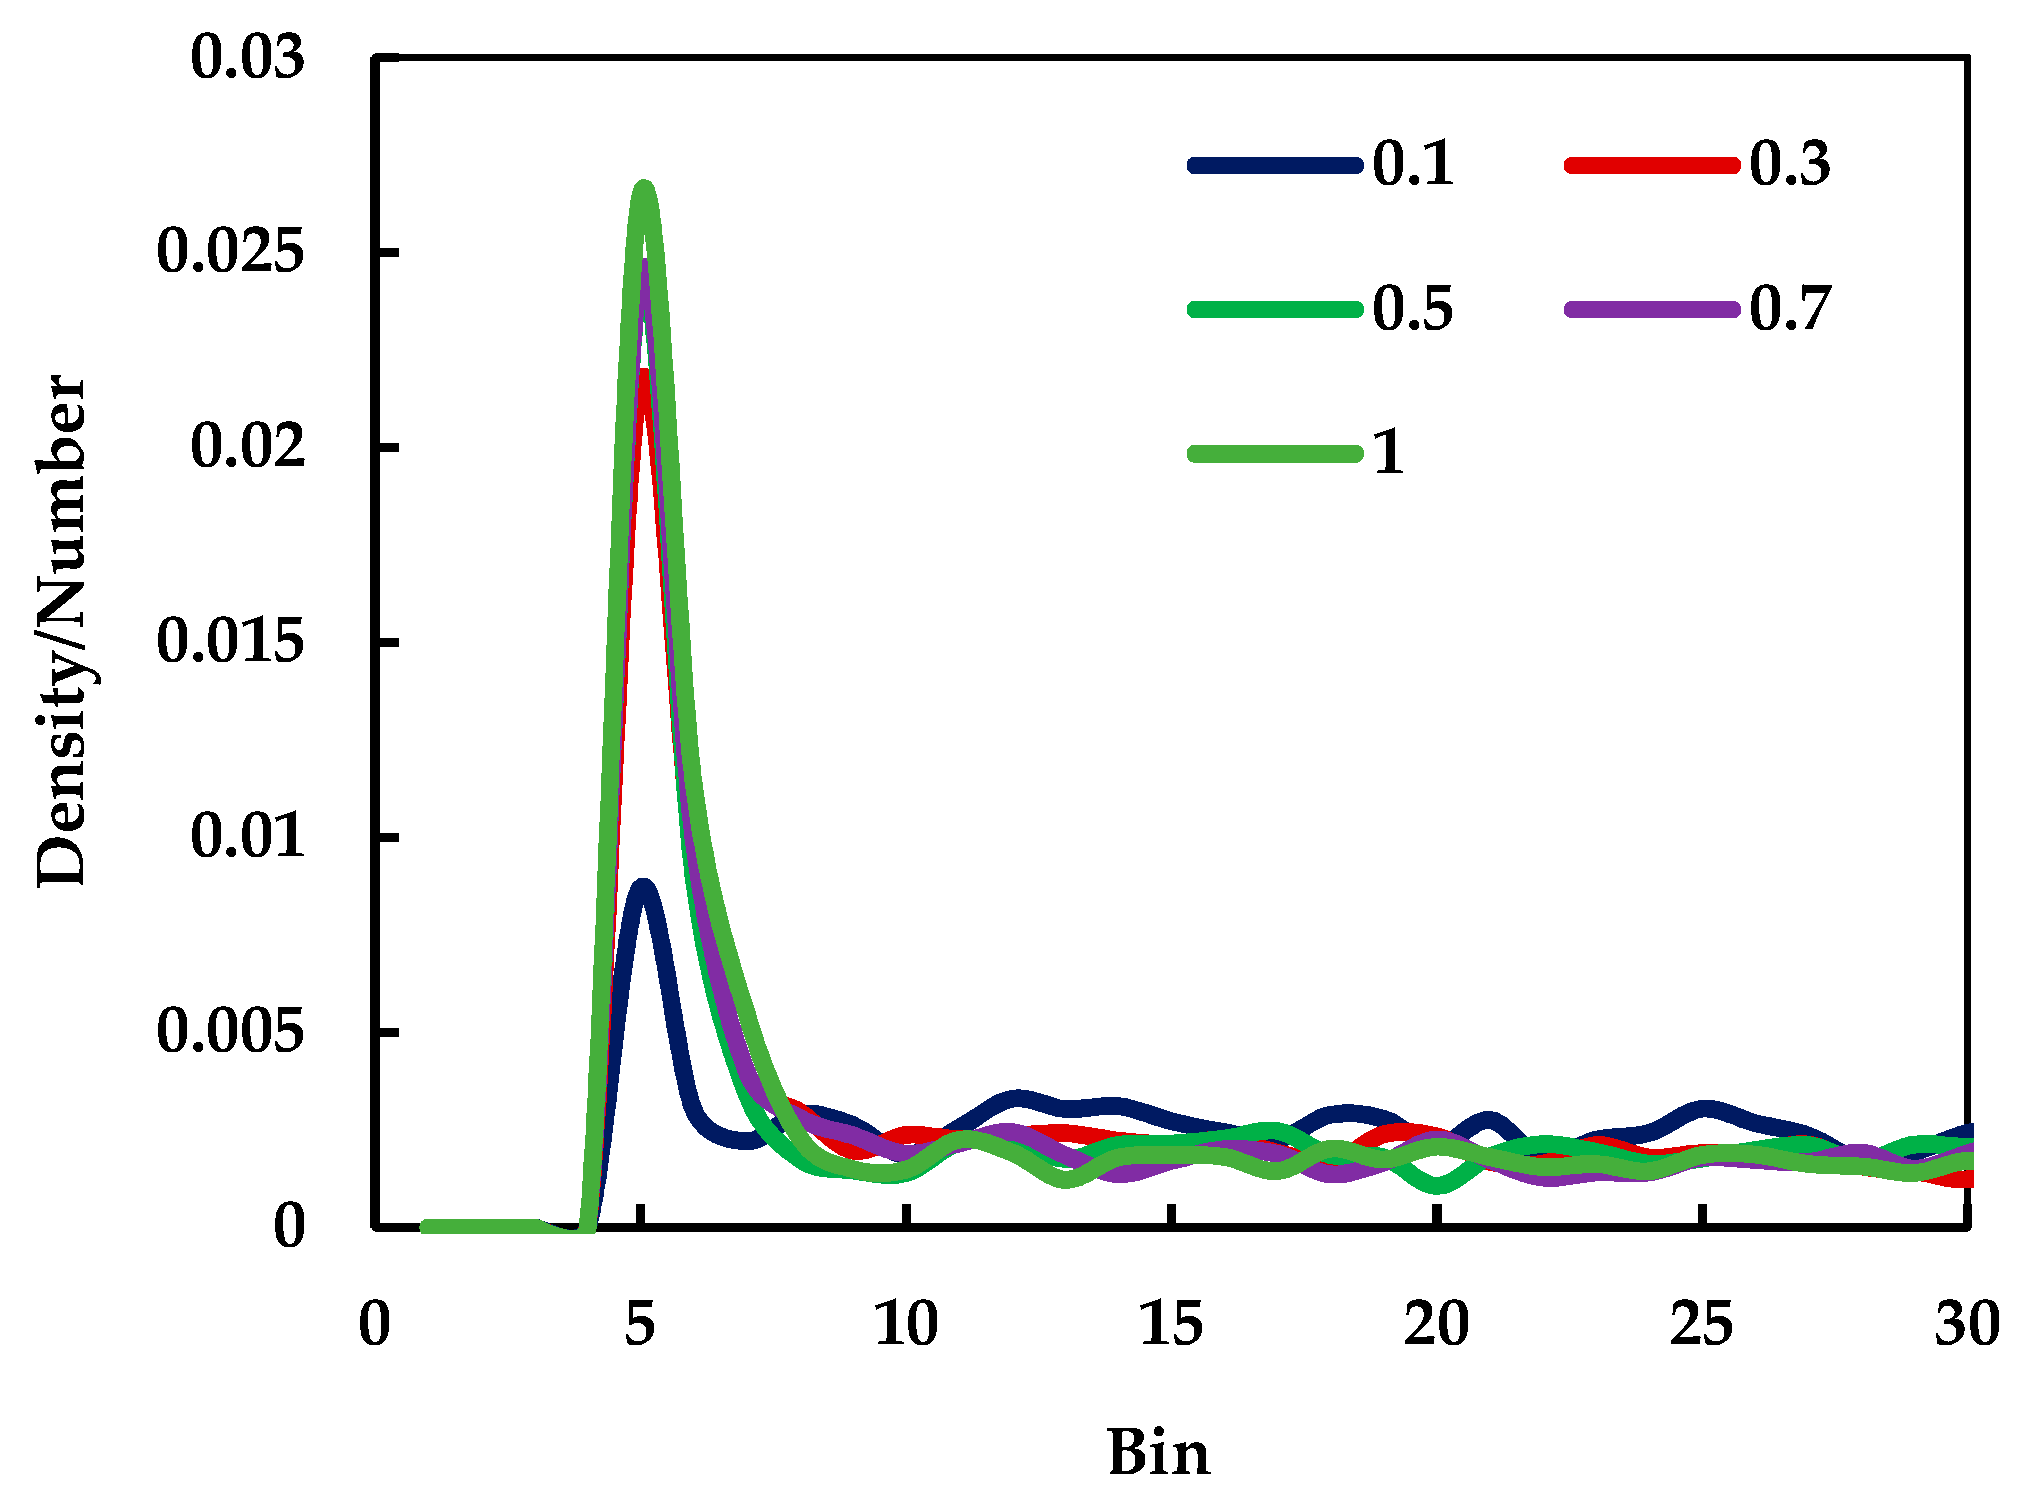
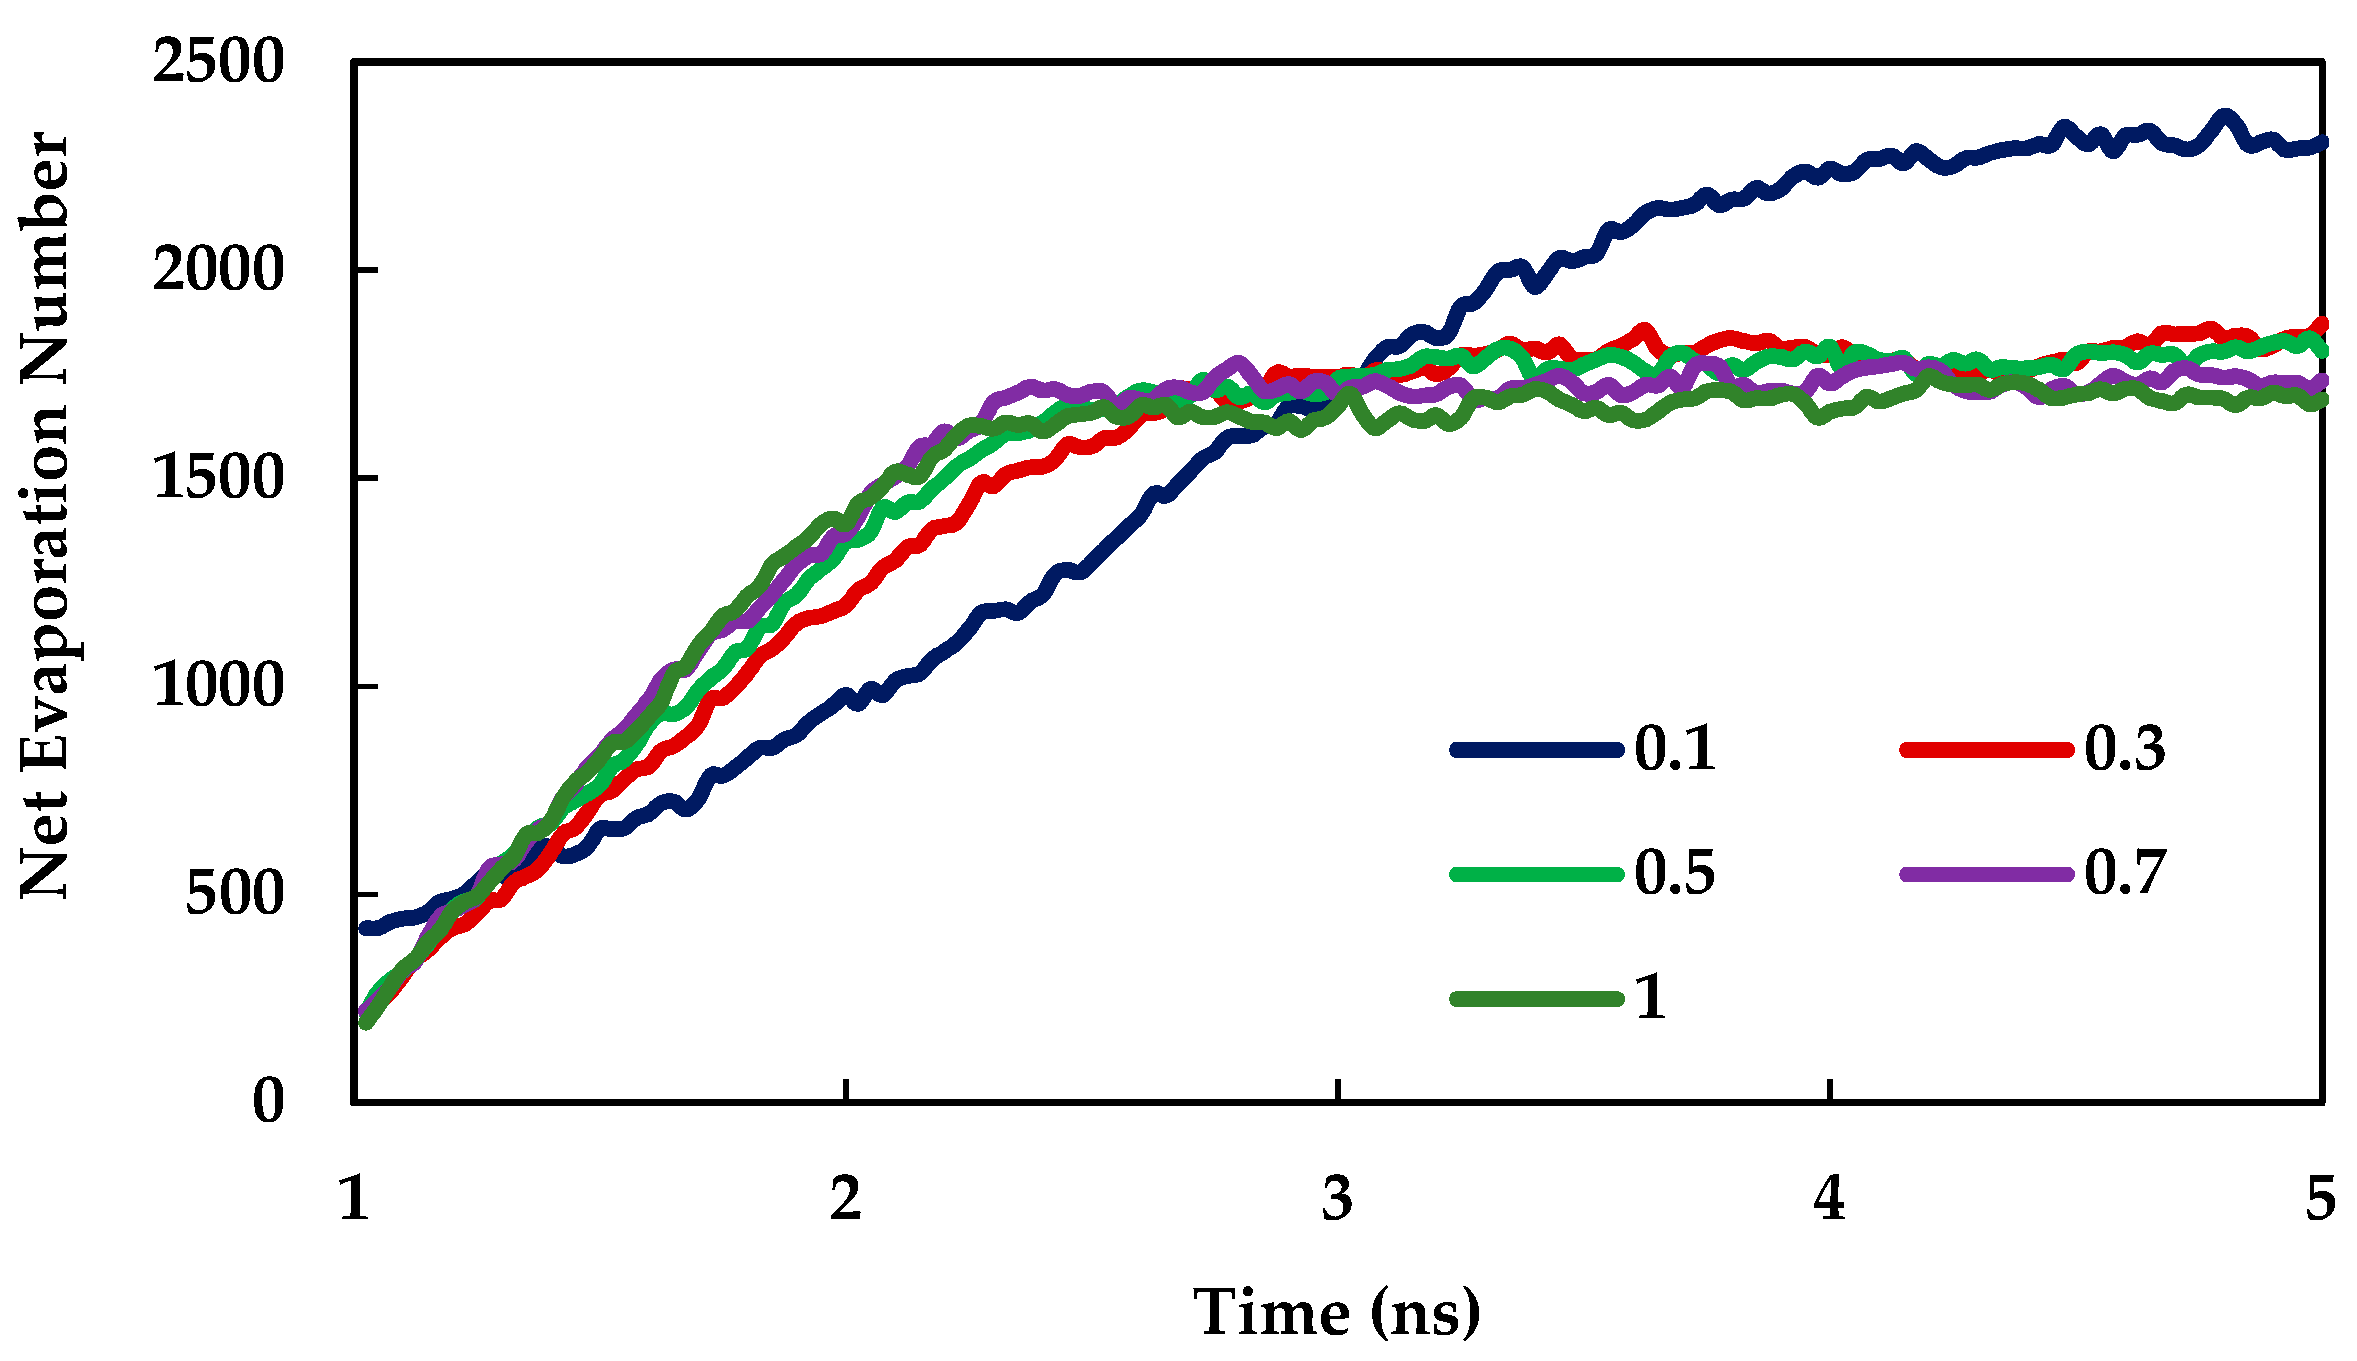
3.1. Effect of Surface Wetting Condition
3.2. Effect of Nano Structures
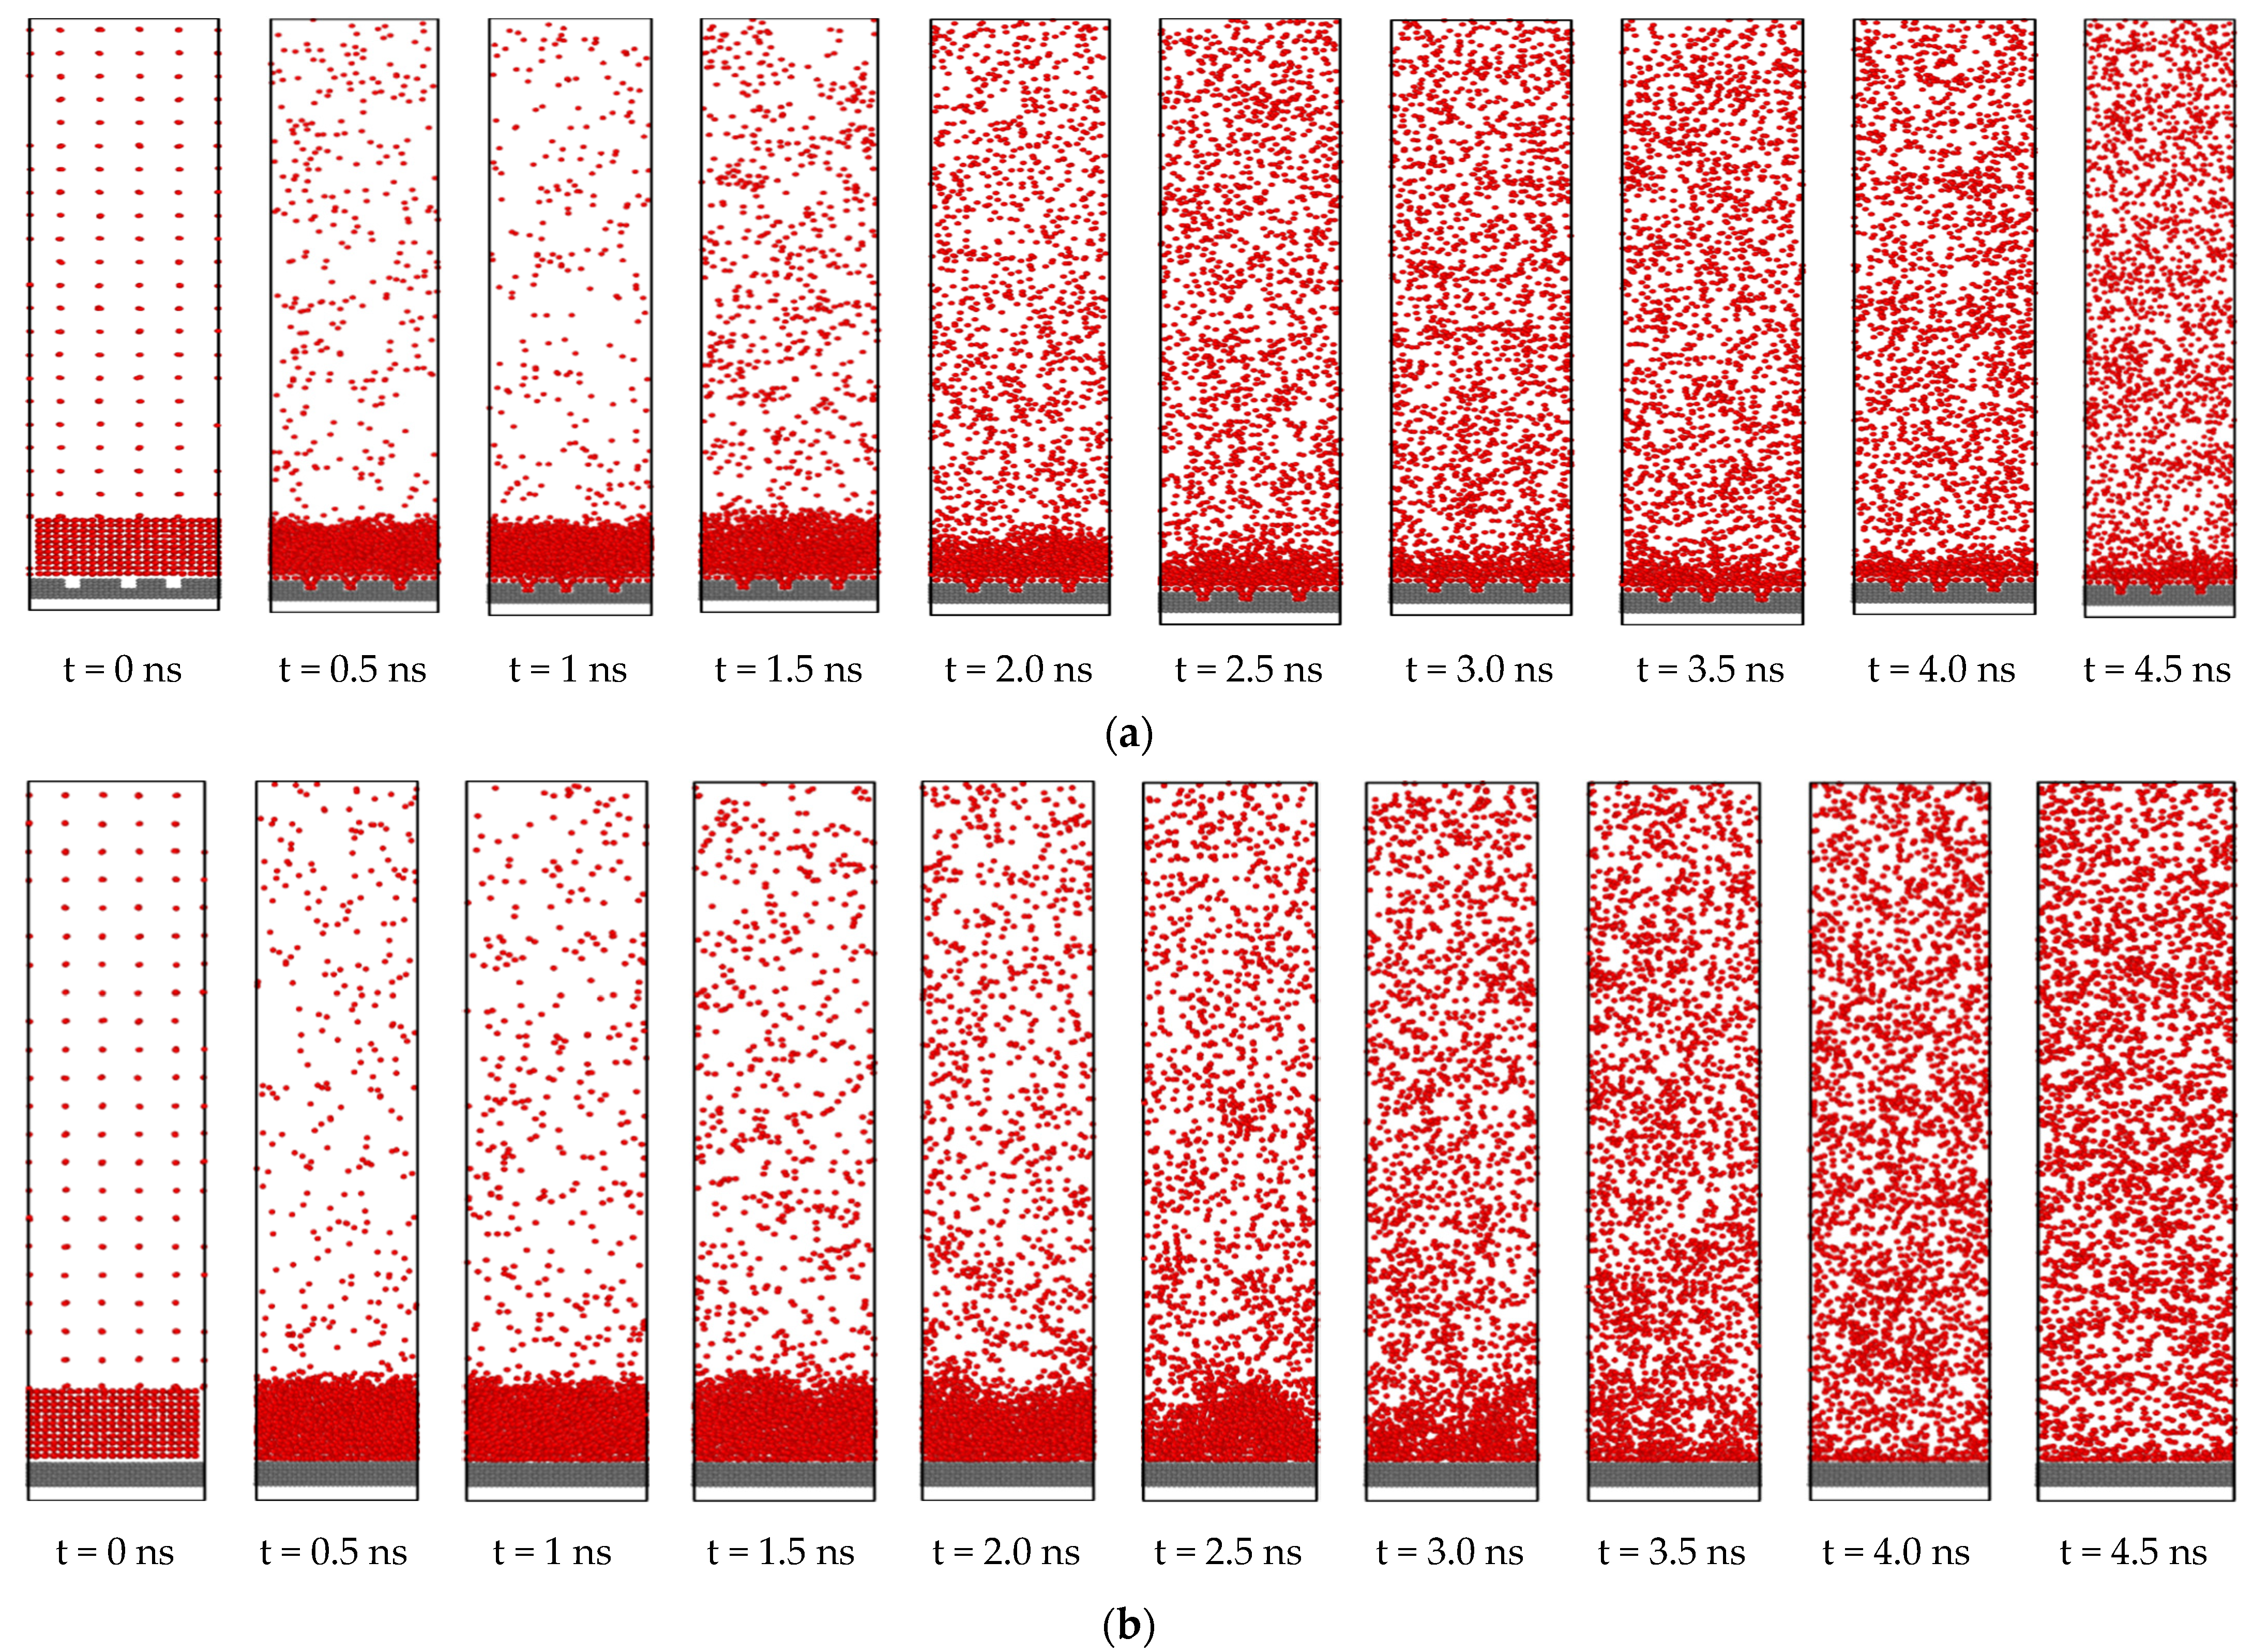
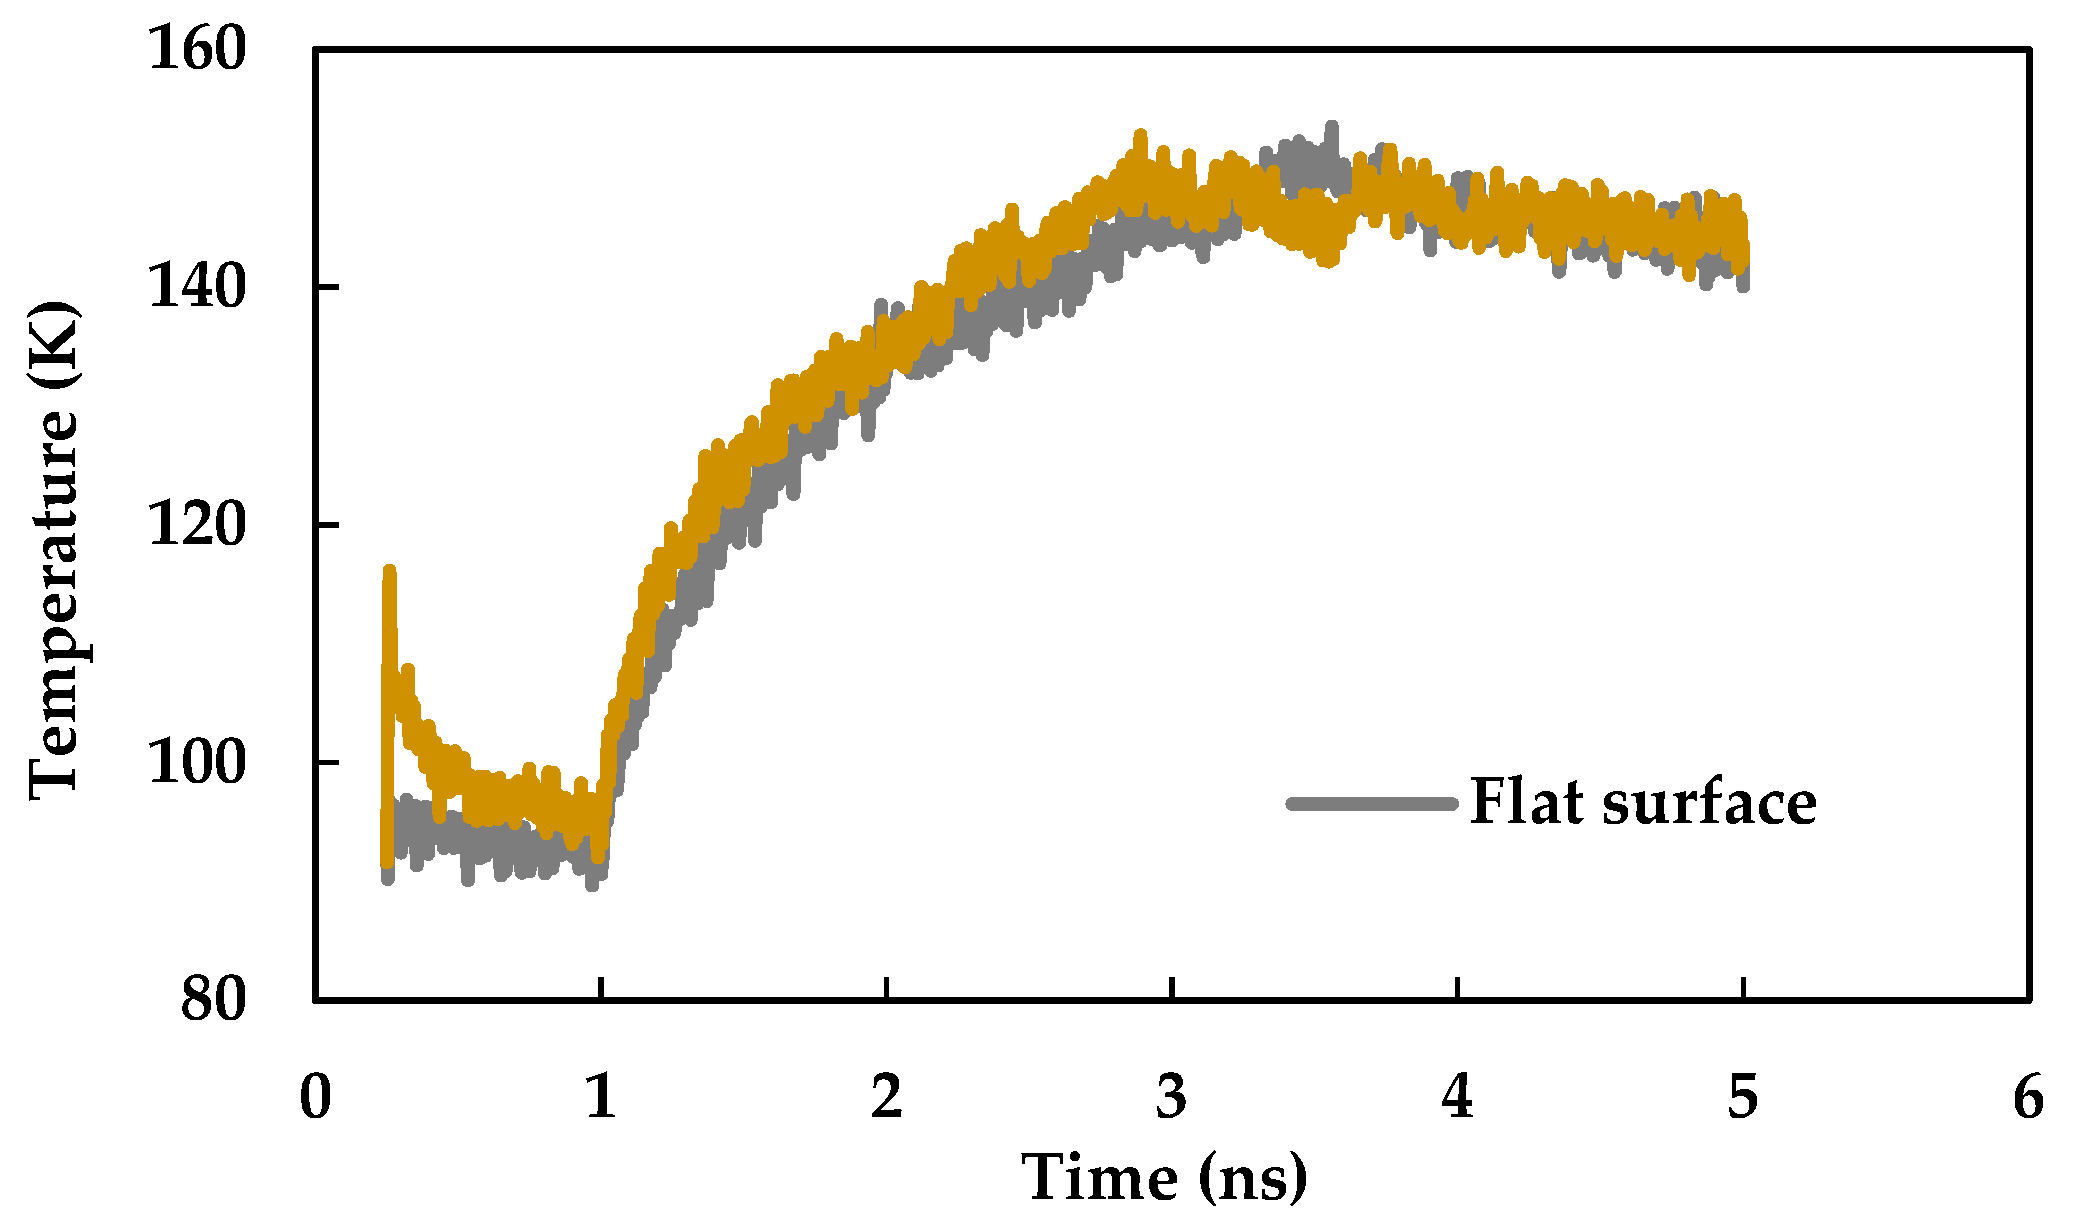
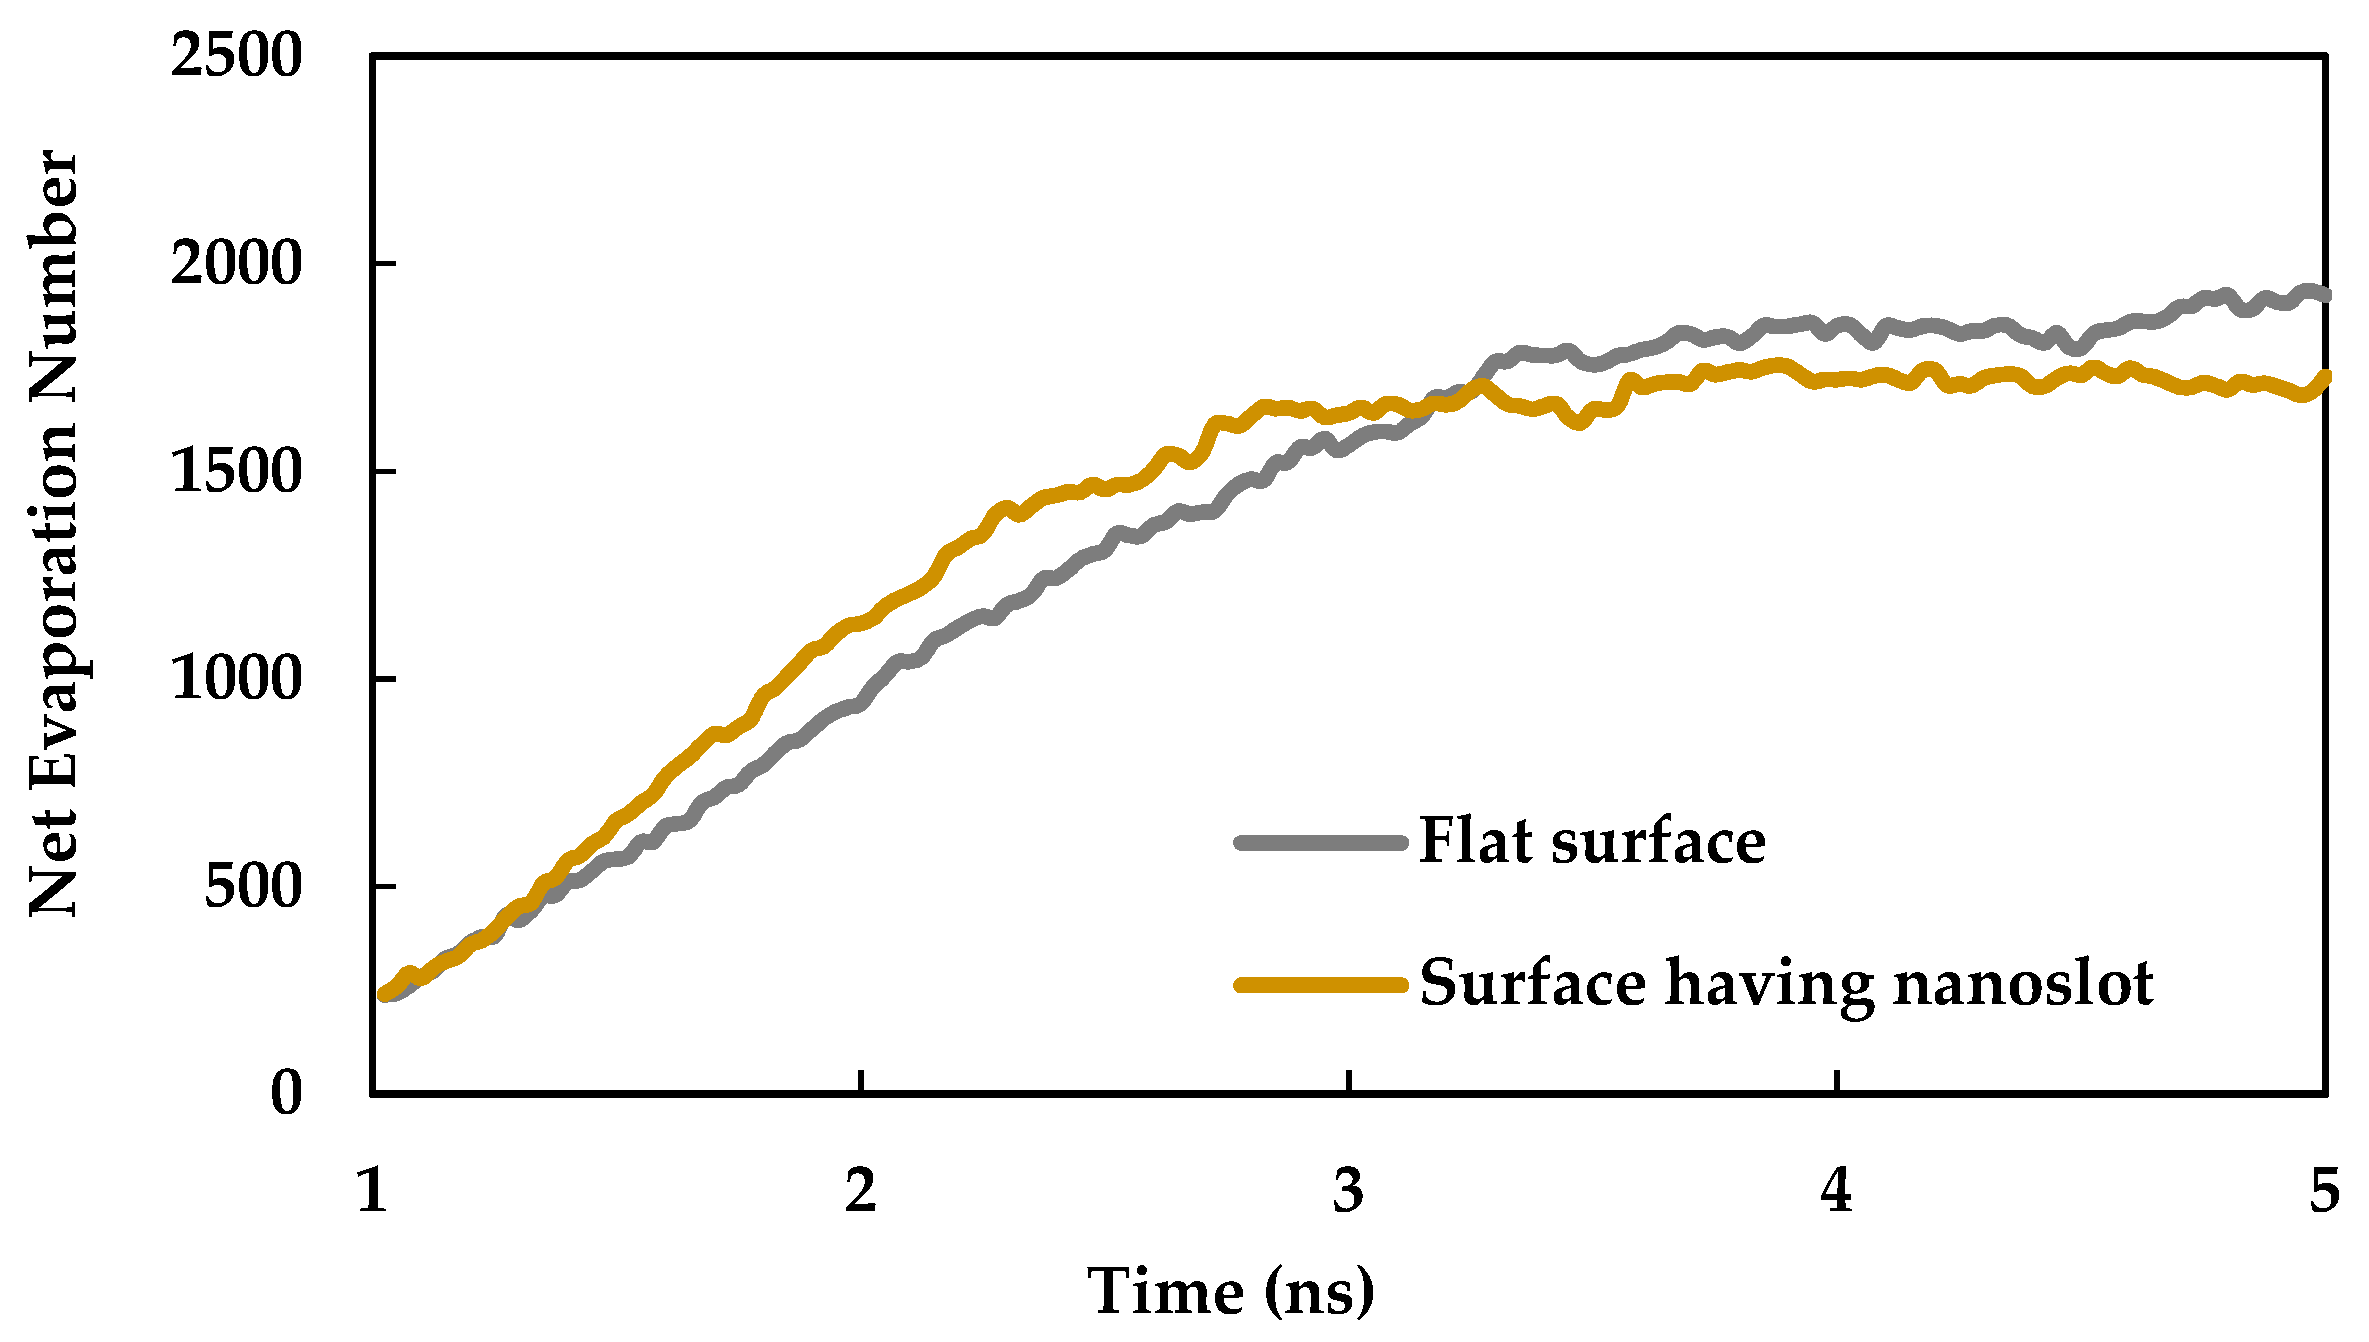
3.3. Effect of Nano Slots
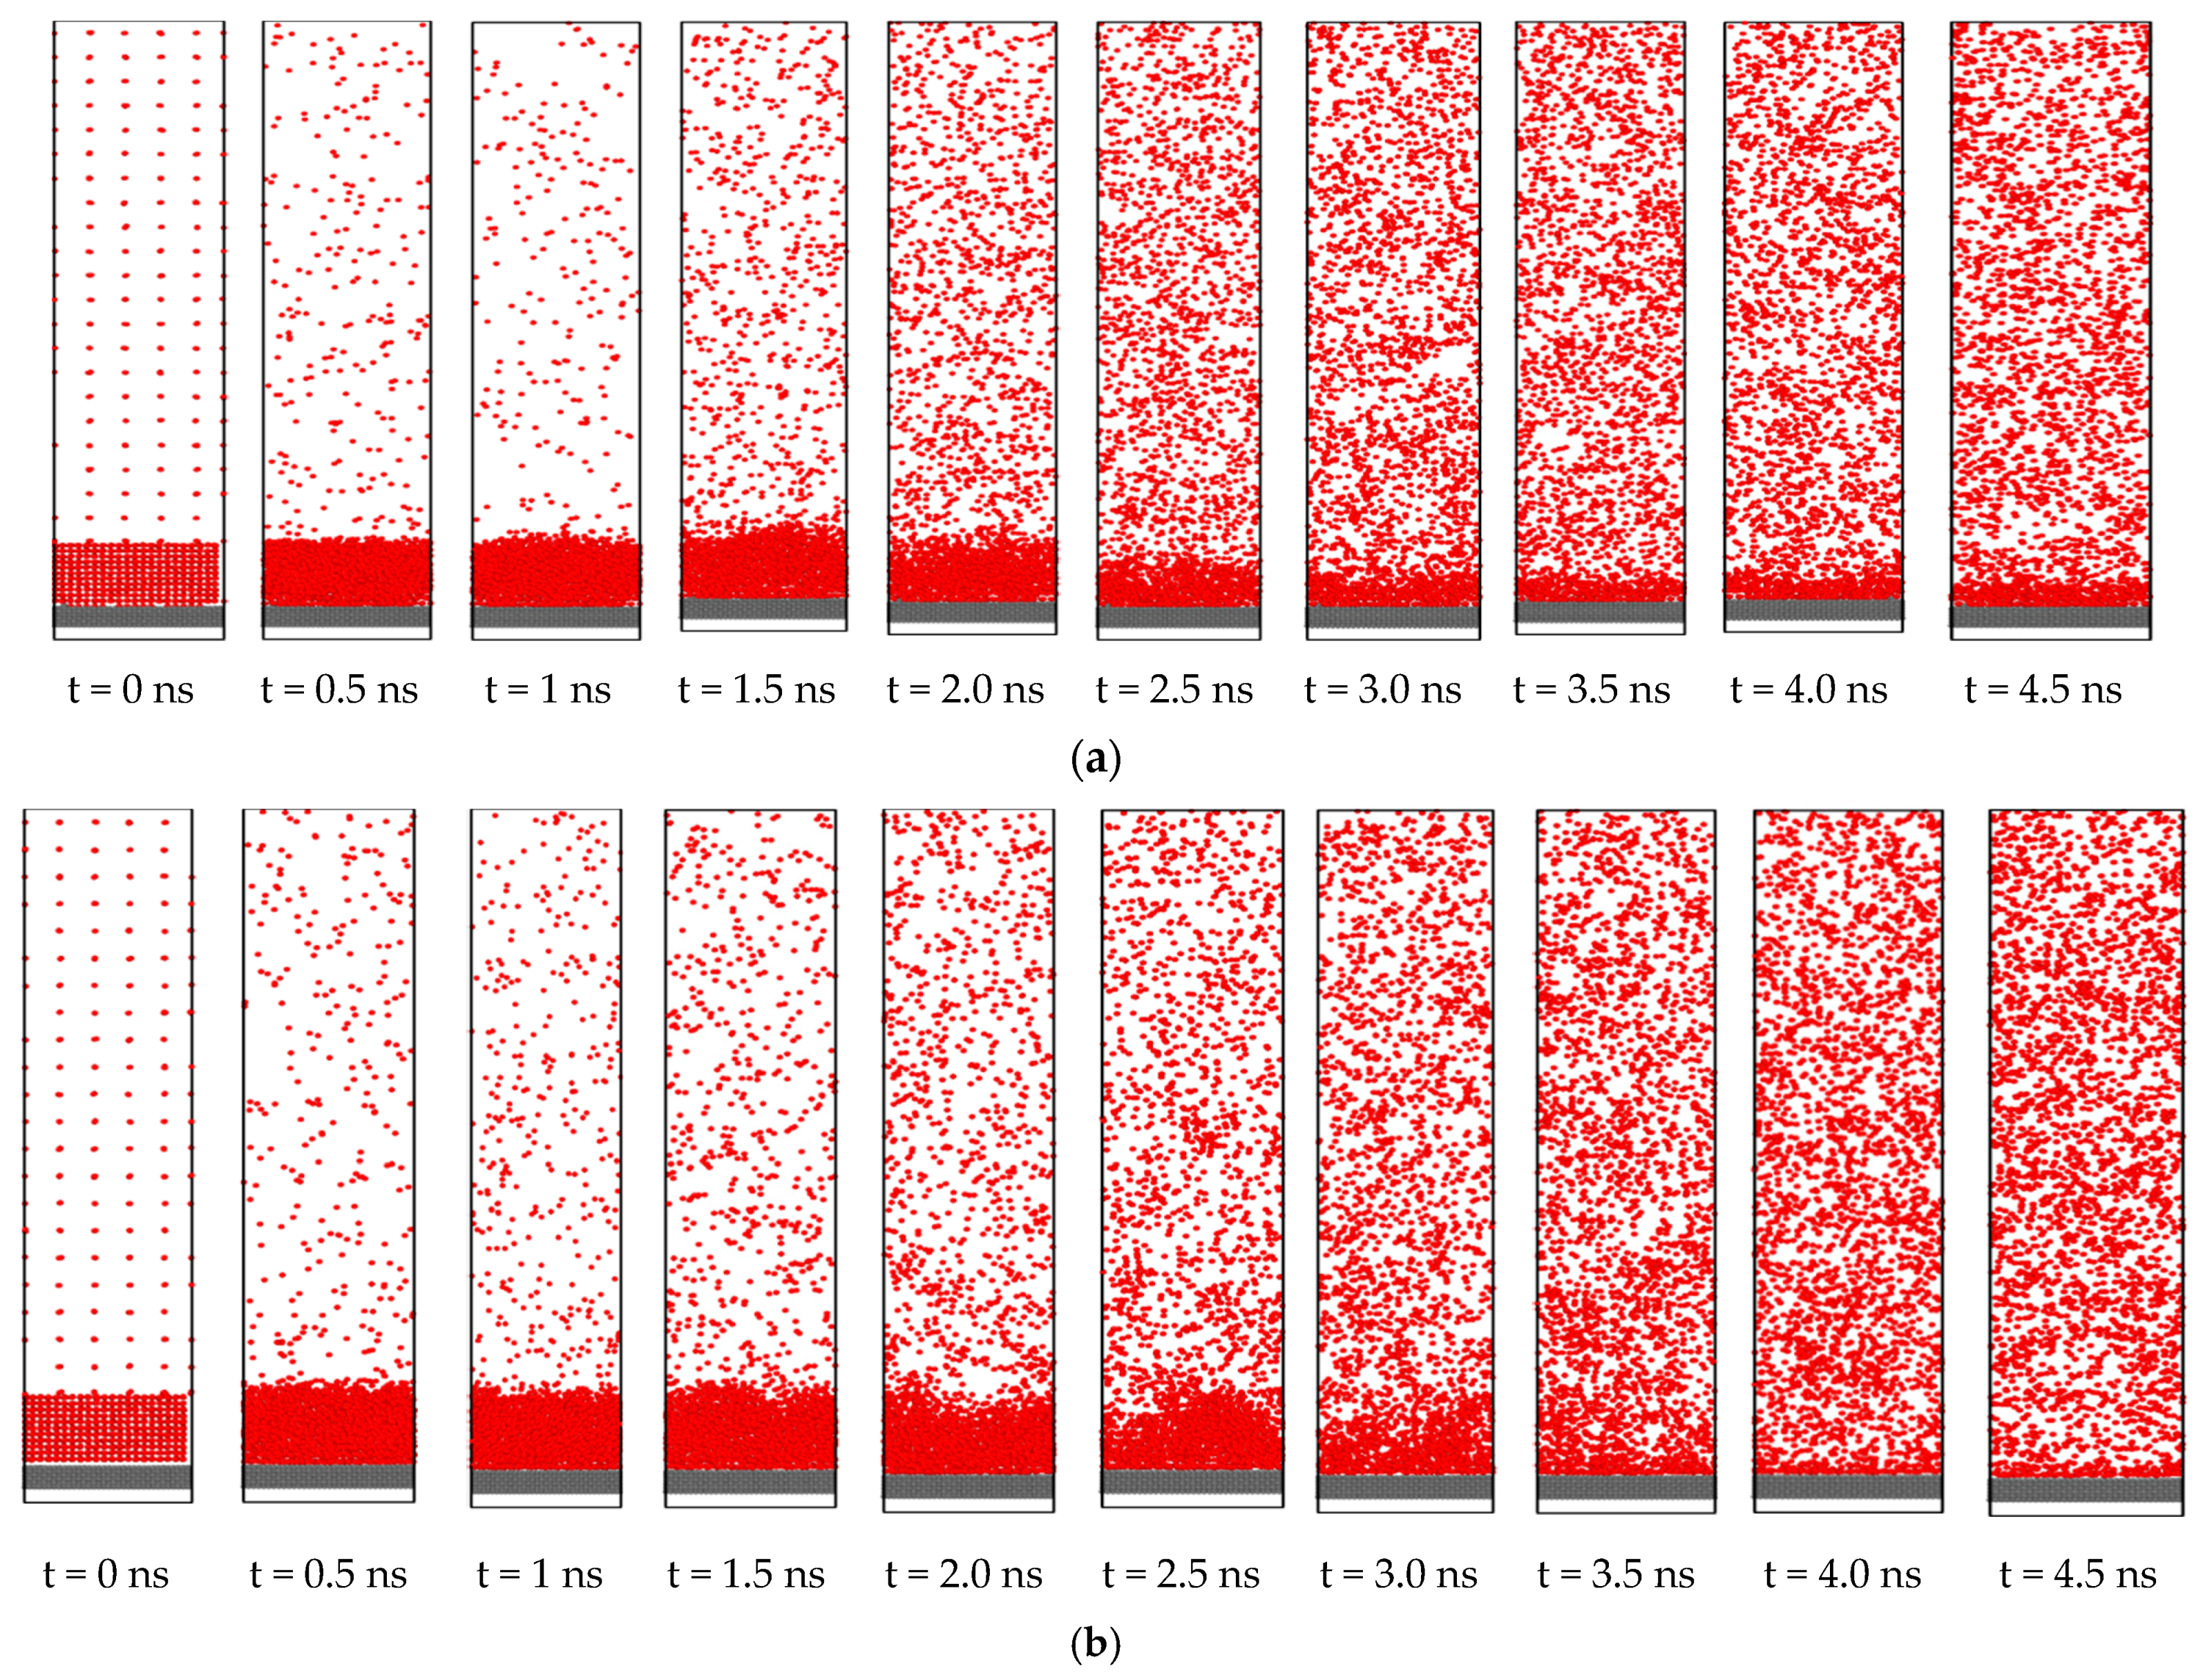
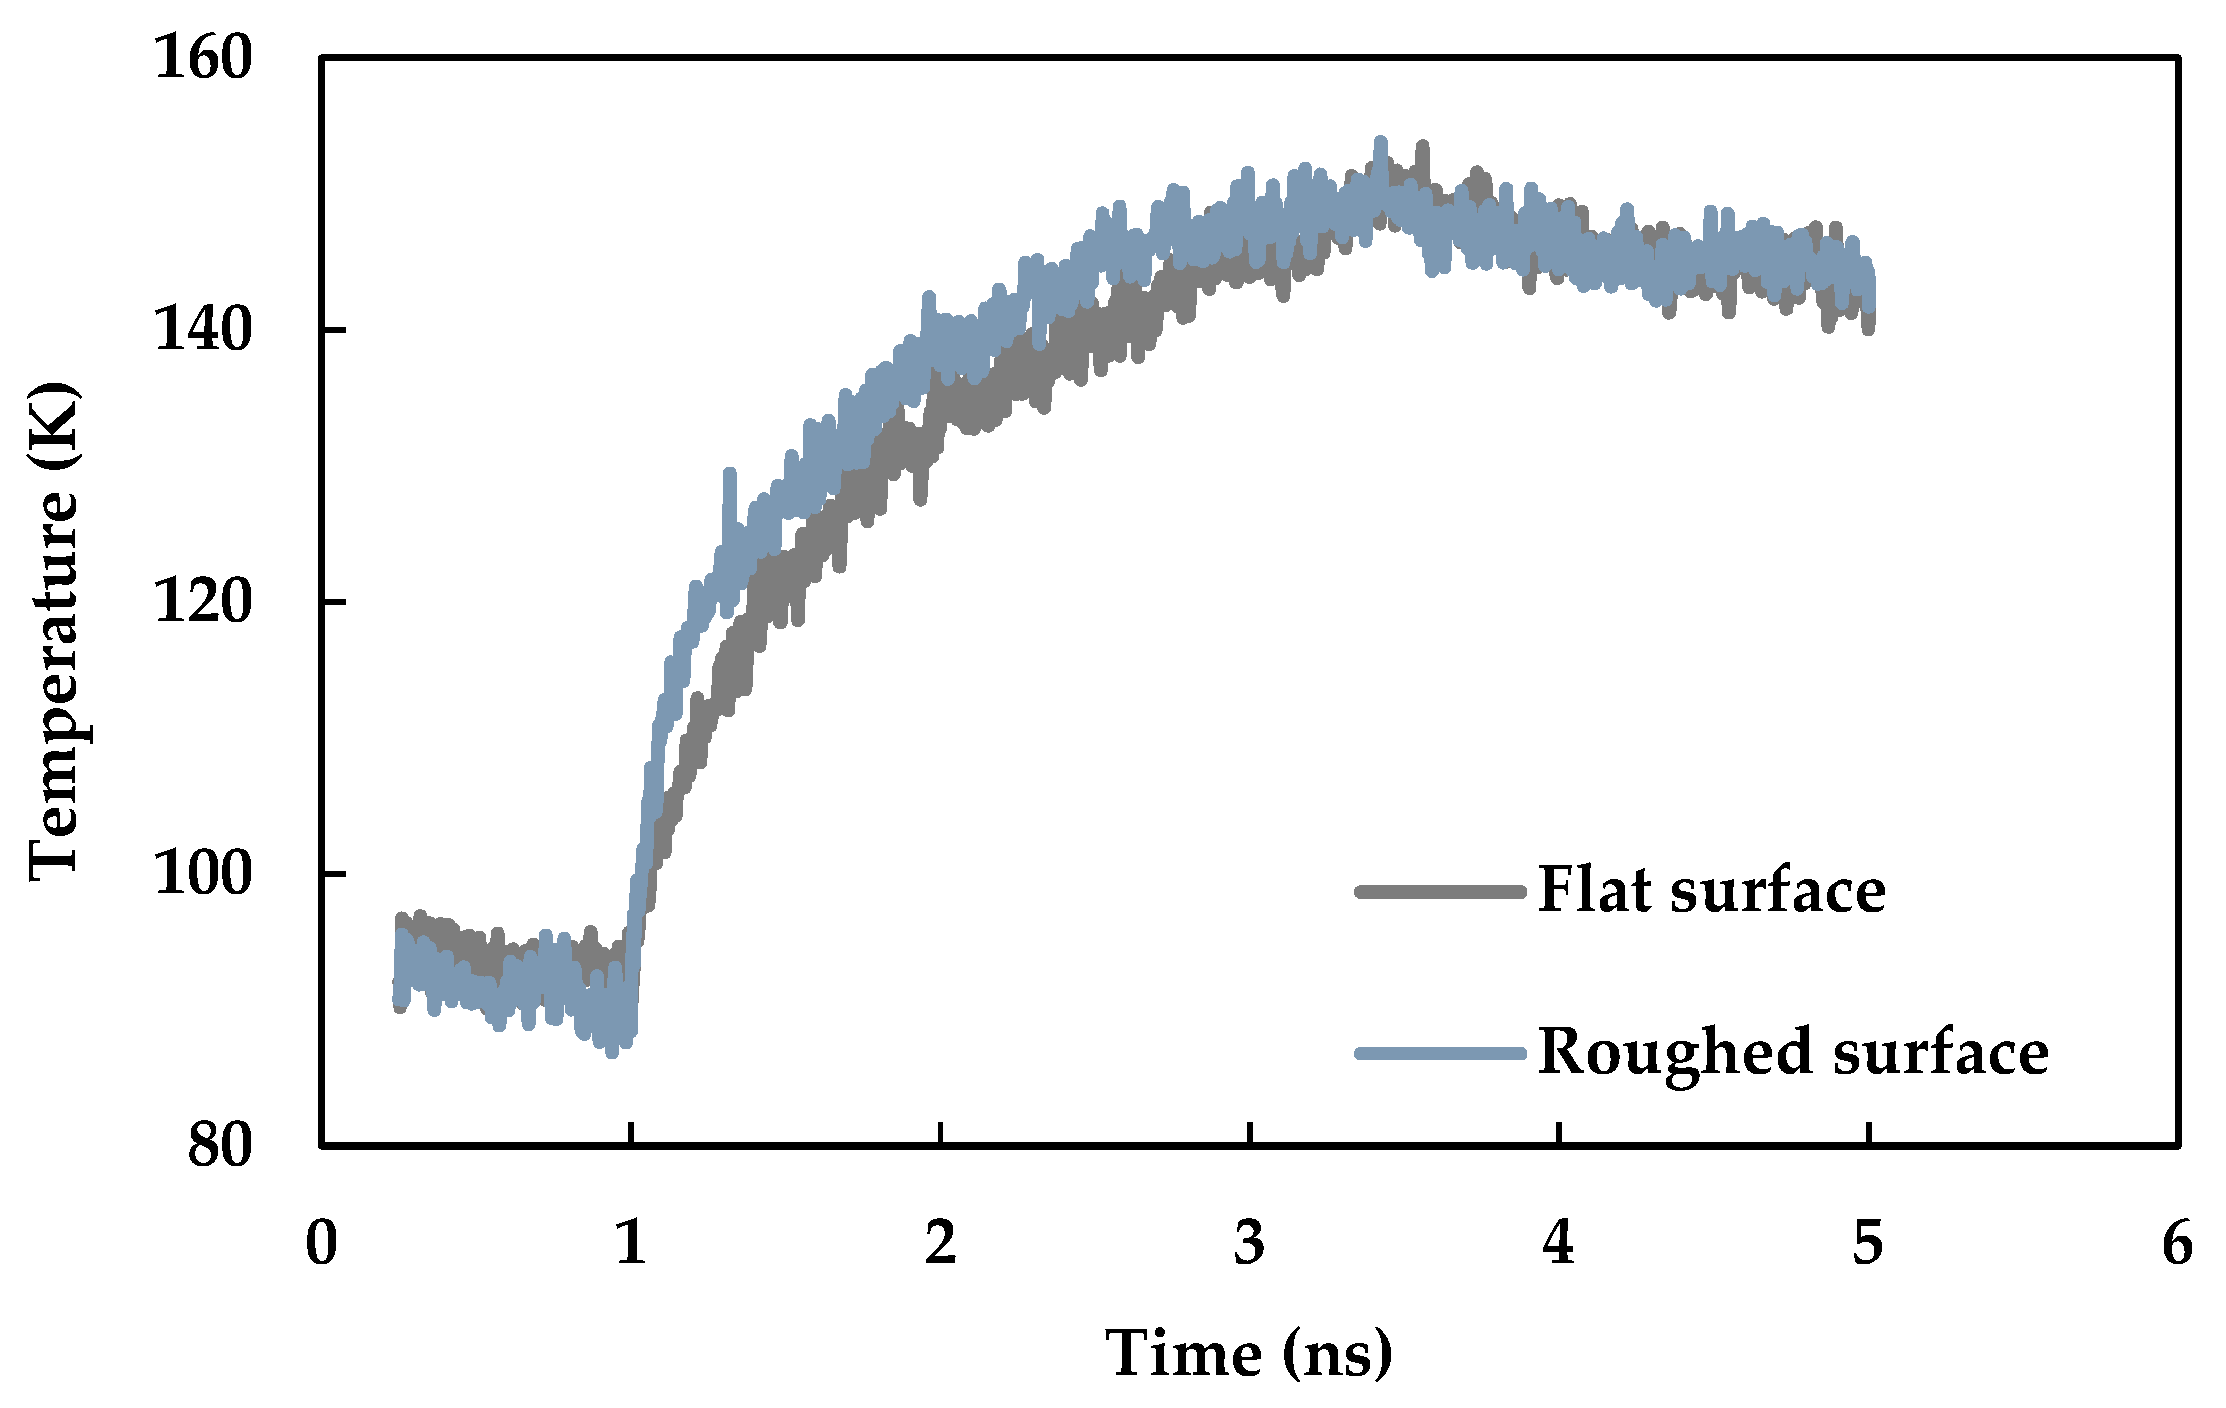
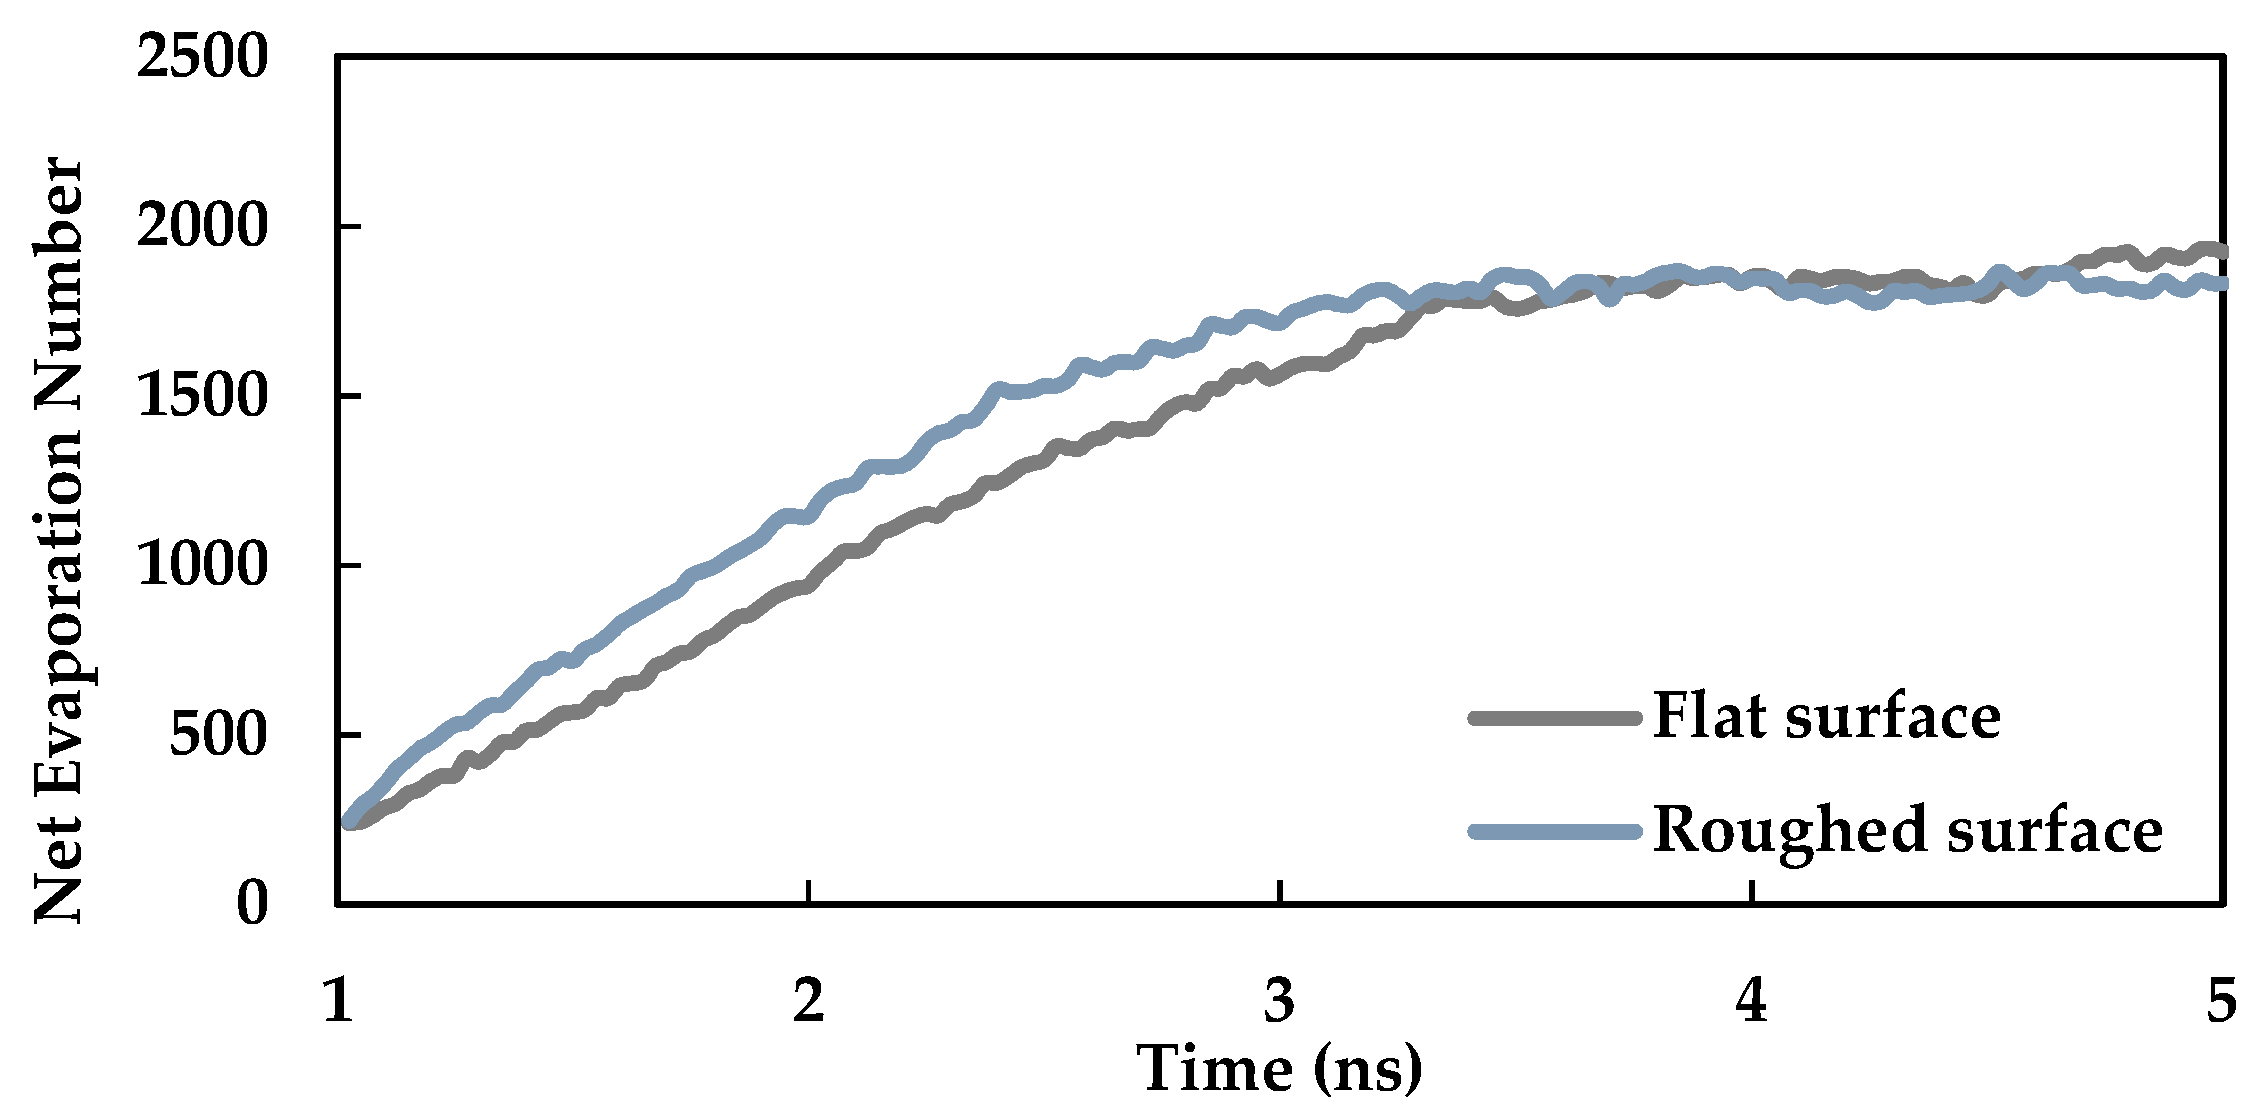
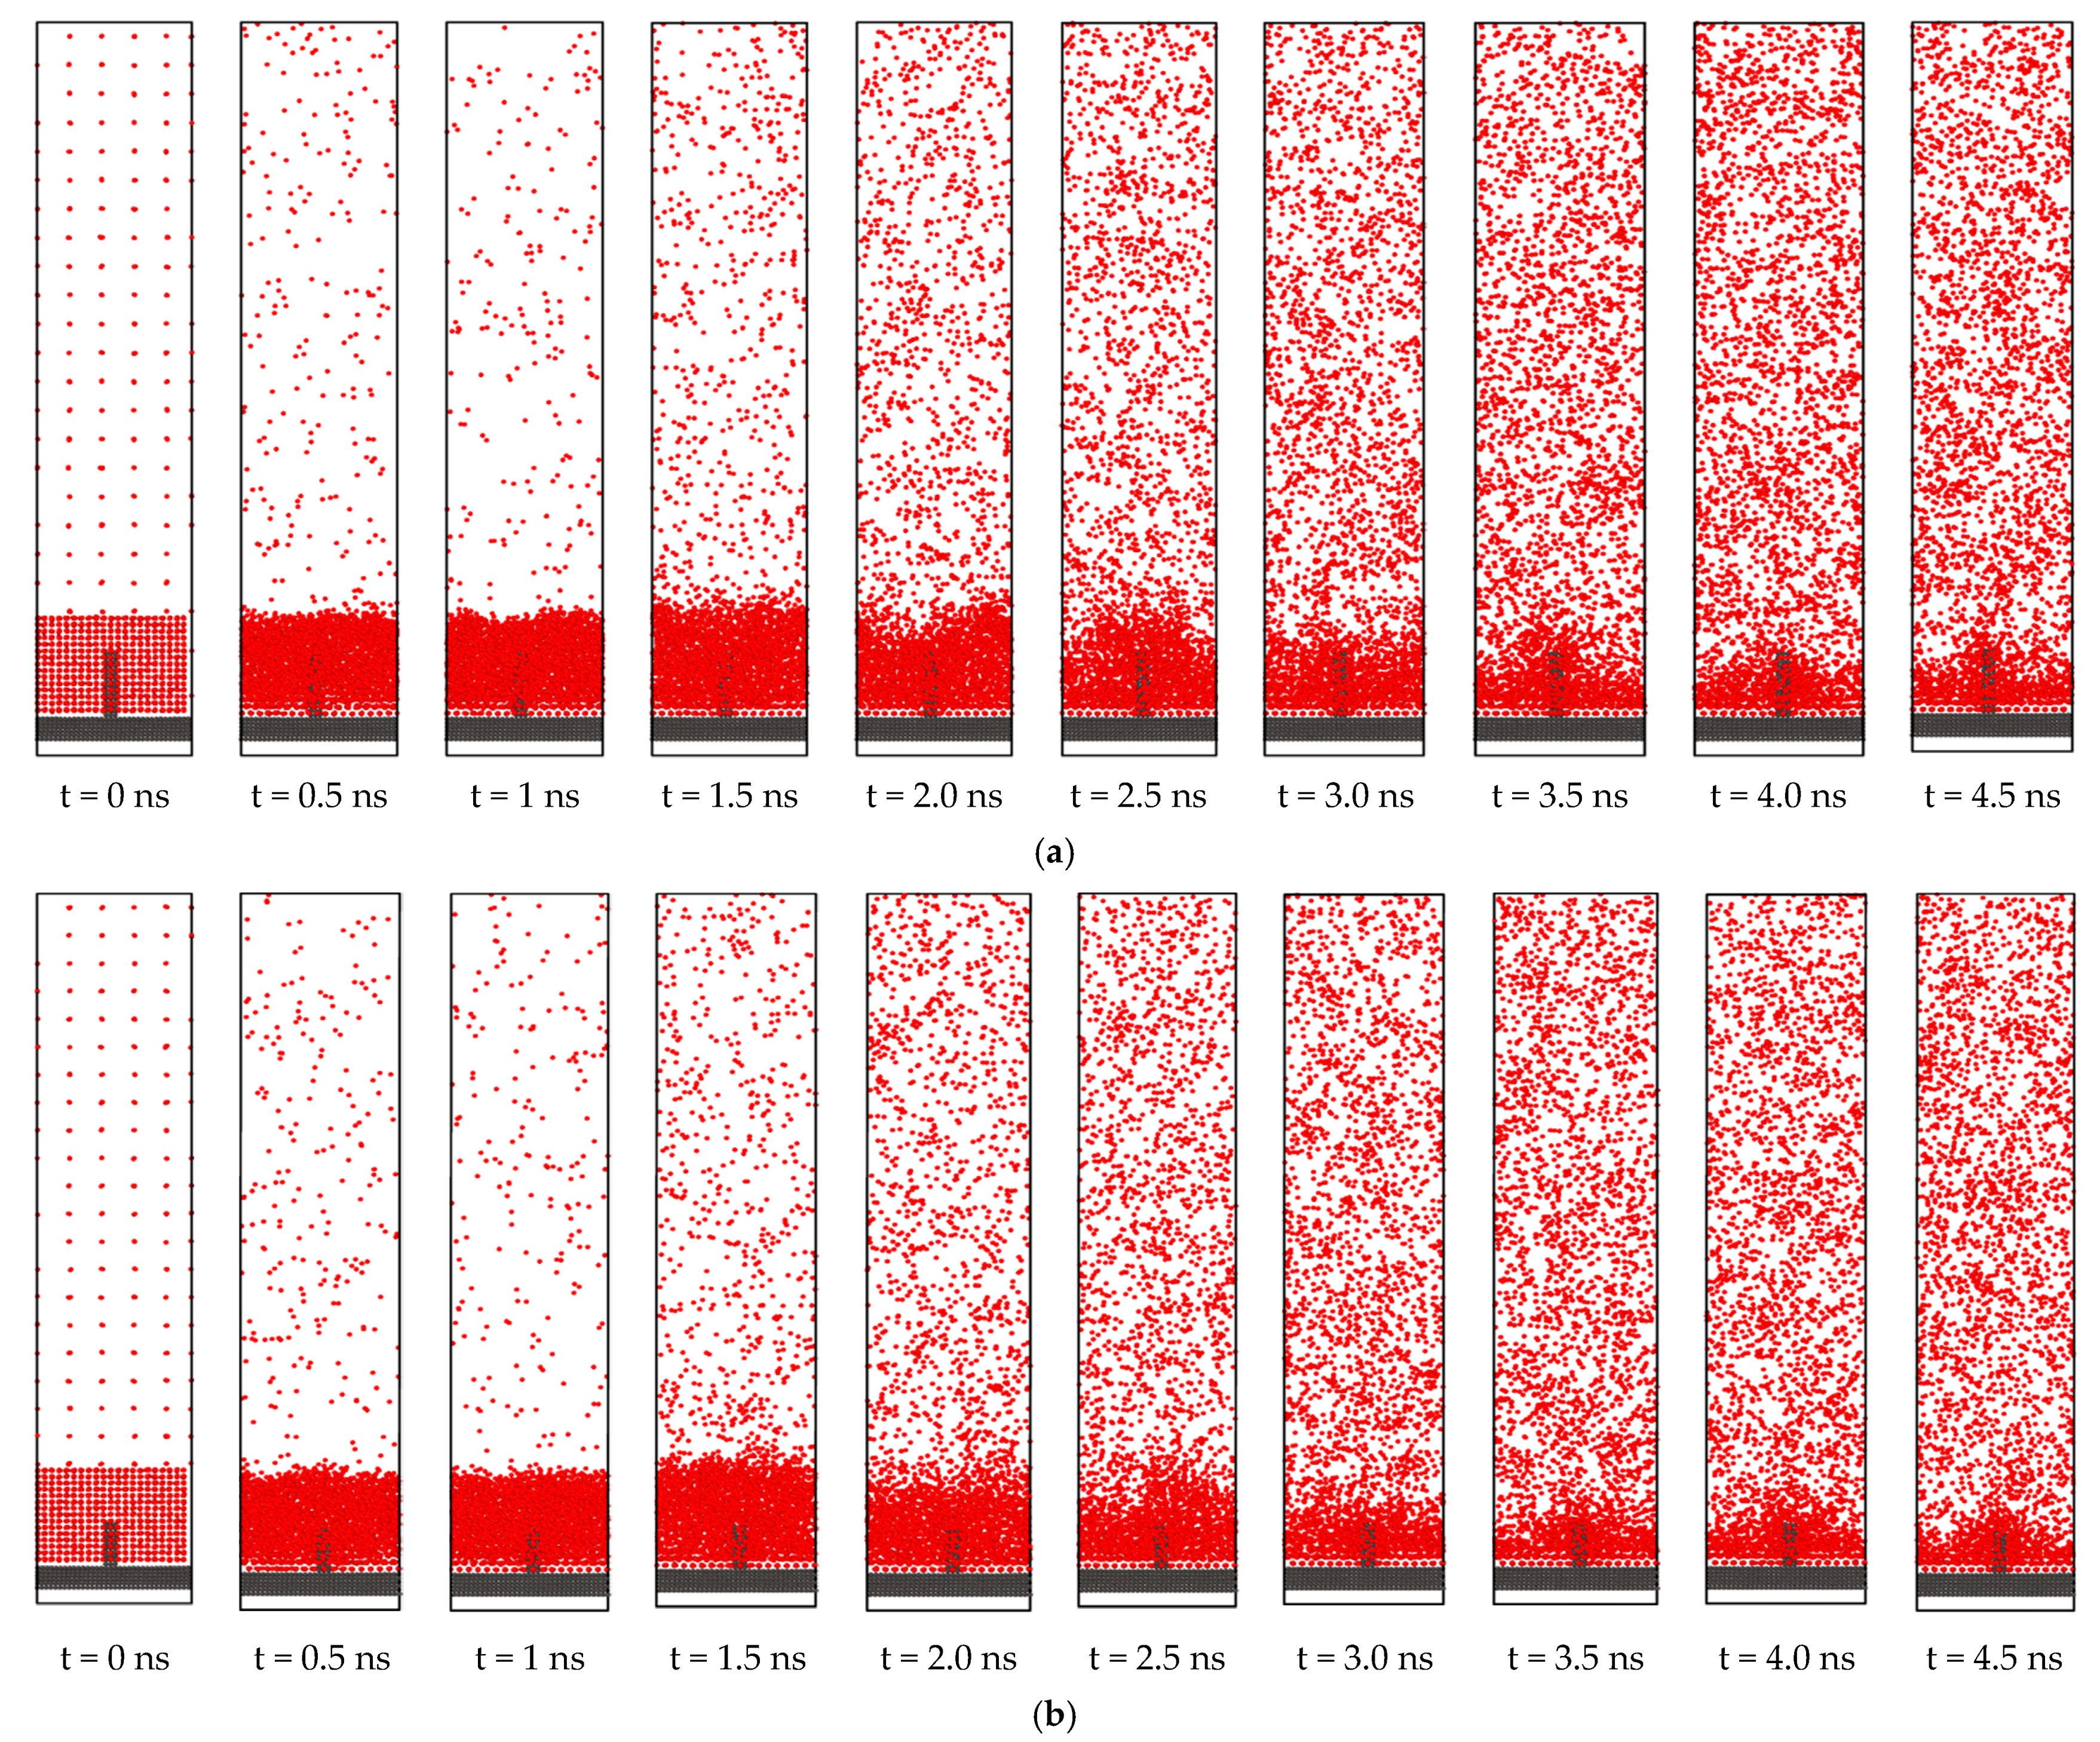
3.4. Effect of Nano Level Surface Roughness
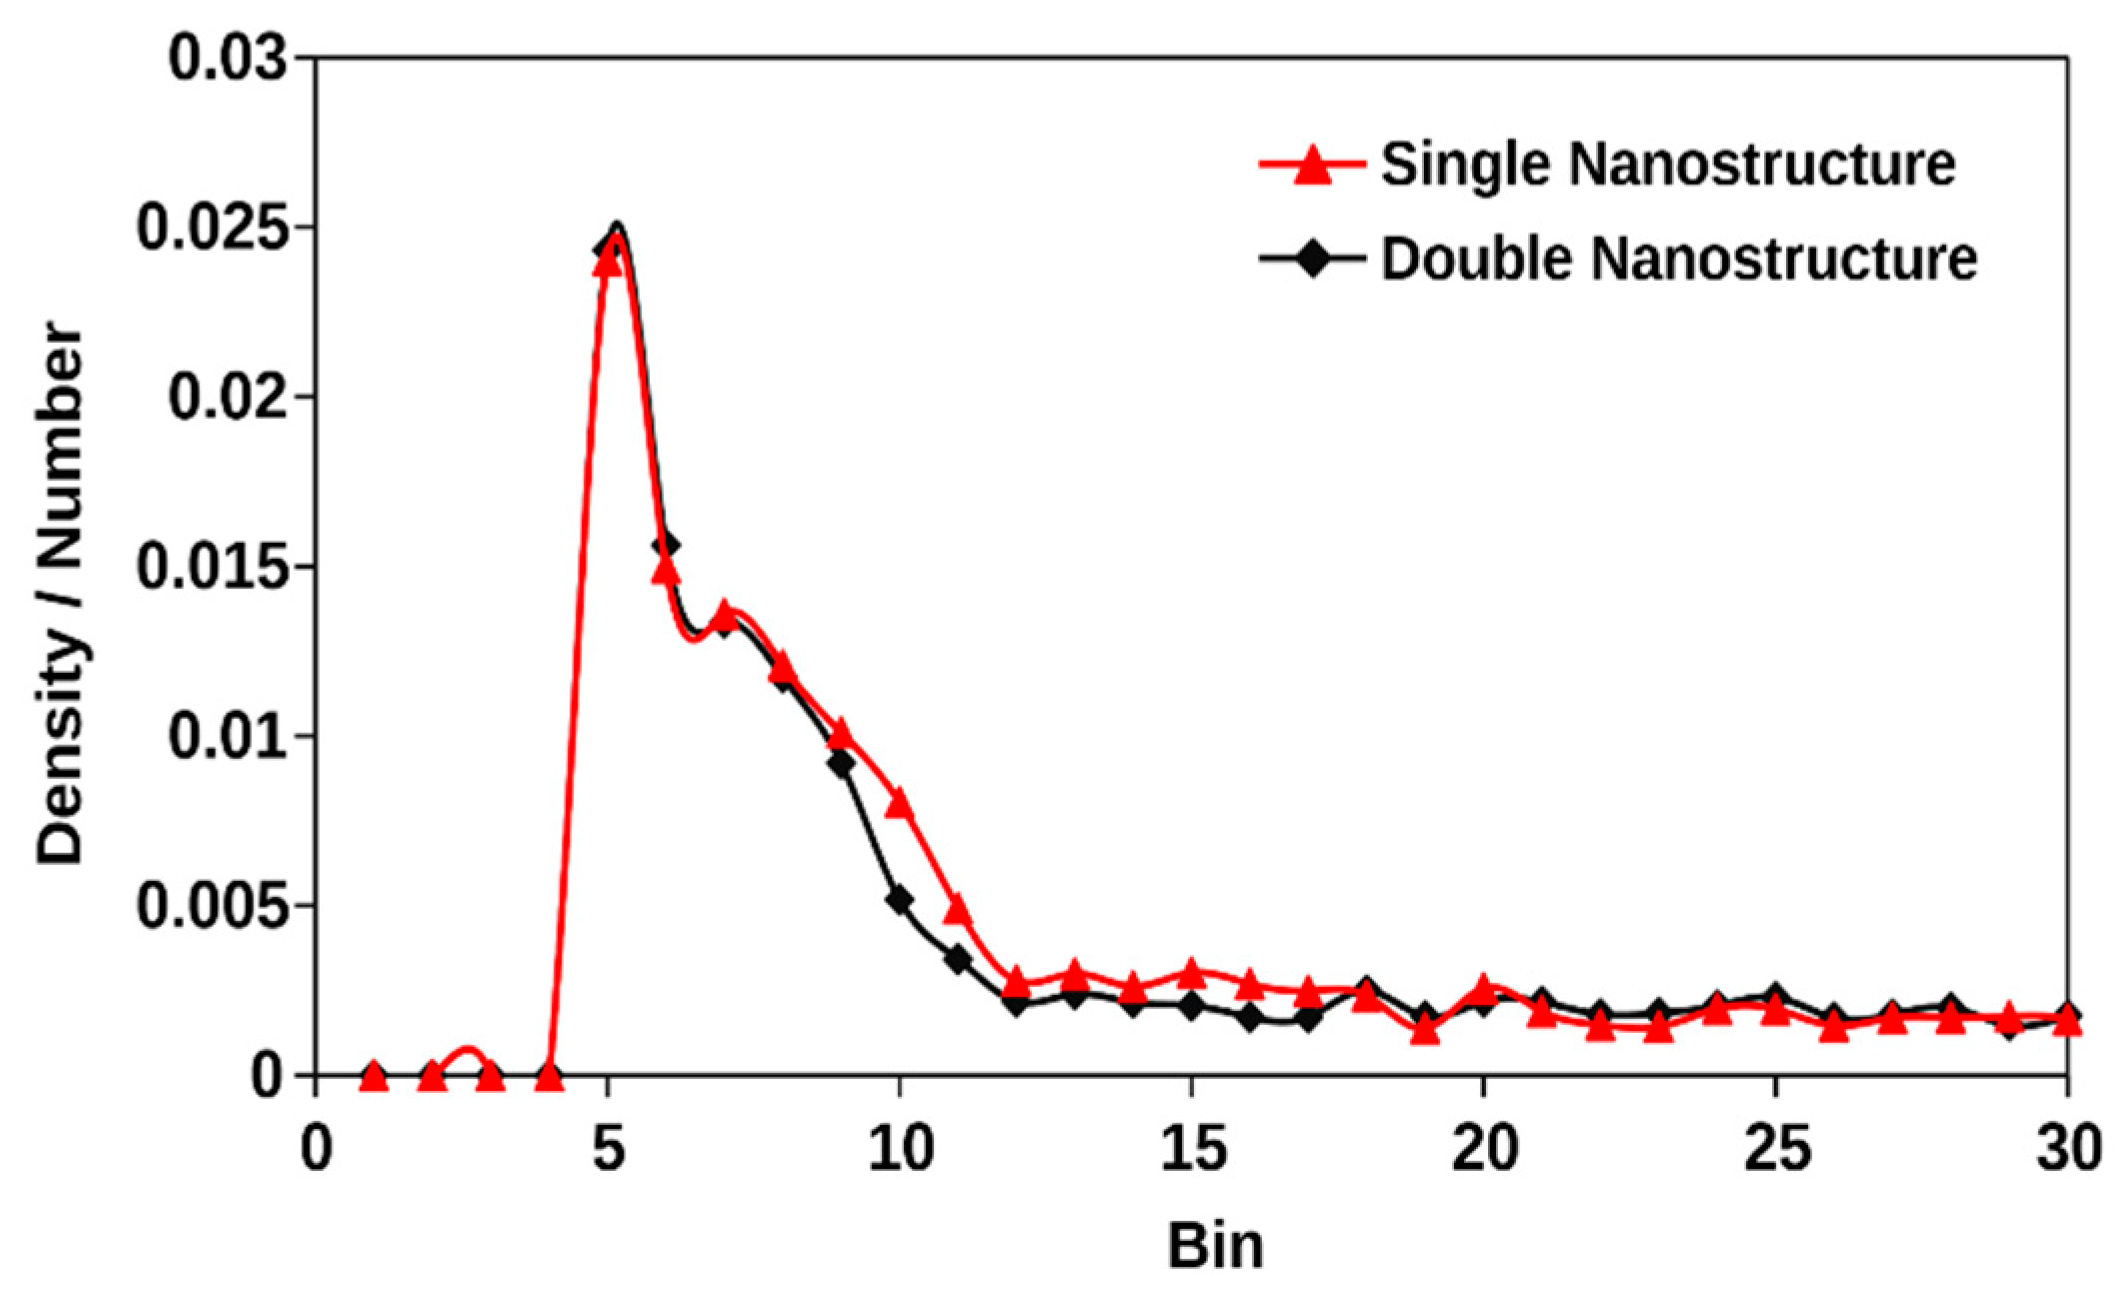
3.5. Effect of the Degree of Nano Structures for Same Effective Surface Area
4. Conclusions
- When the solid surface is transformed from hydrophobic condition to hydrophilic condition, an increase of heat transfer is observed during phase change phenomena. This happens due to the increase in the surface wettability condition. Increased surface wettability allows the liquid atoms to be more adjacent to the solid surface. Therefore, solid-liquid interaction is modified, and it results in an enhancement of heat transfer.
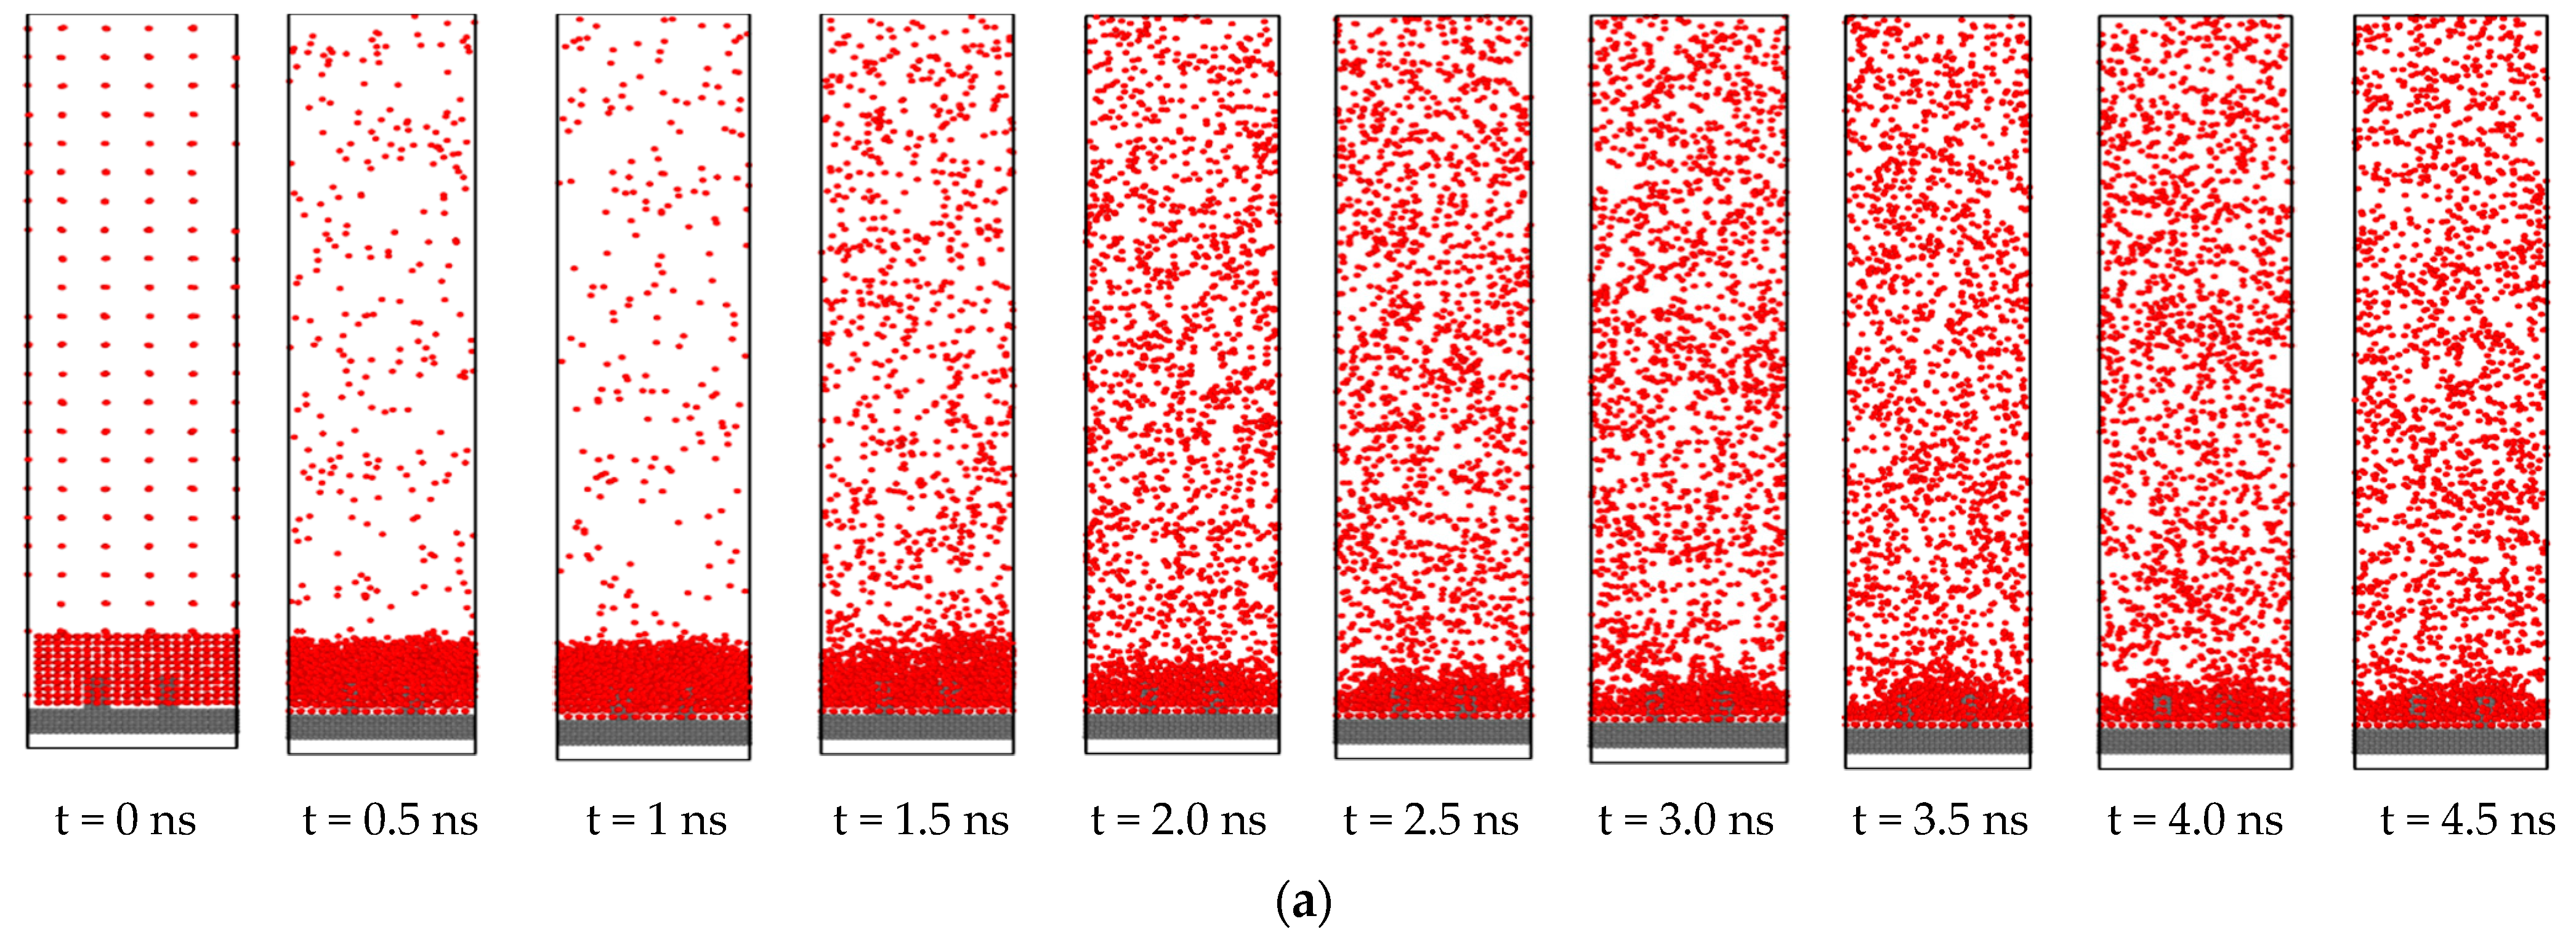
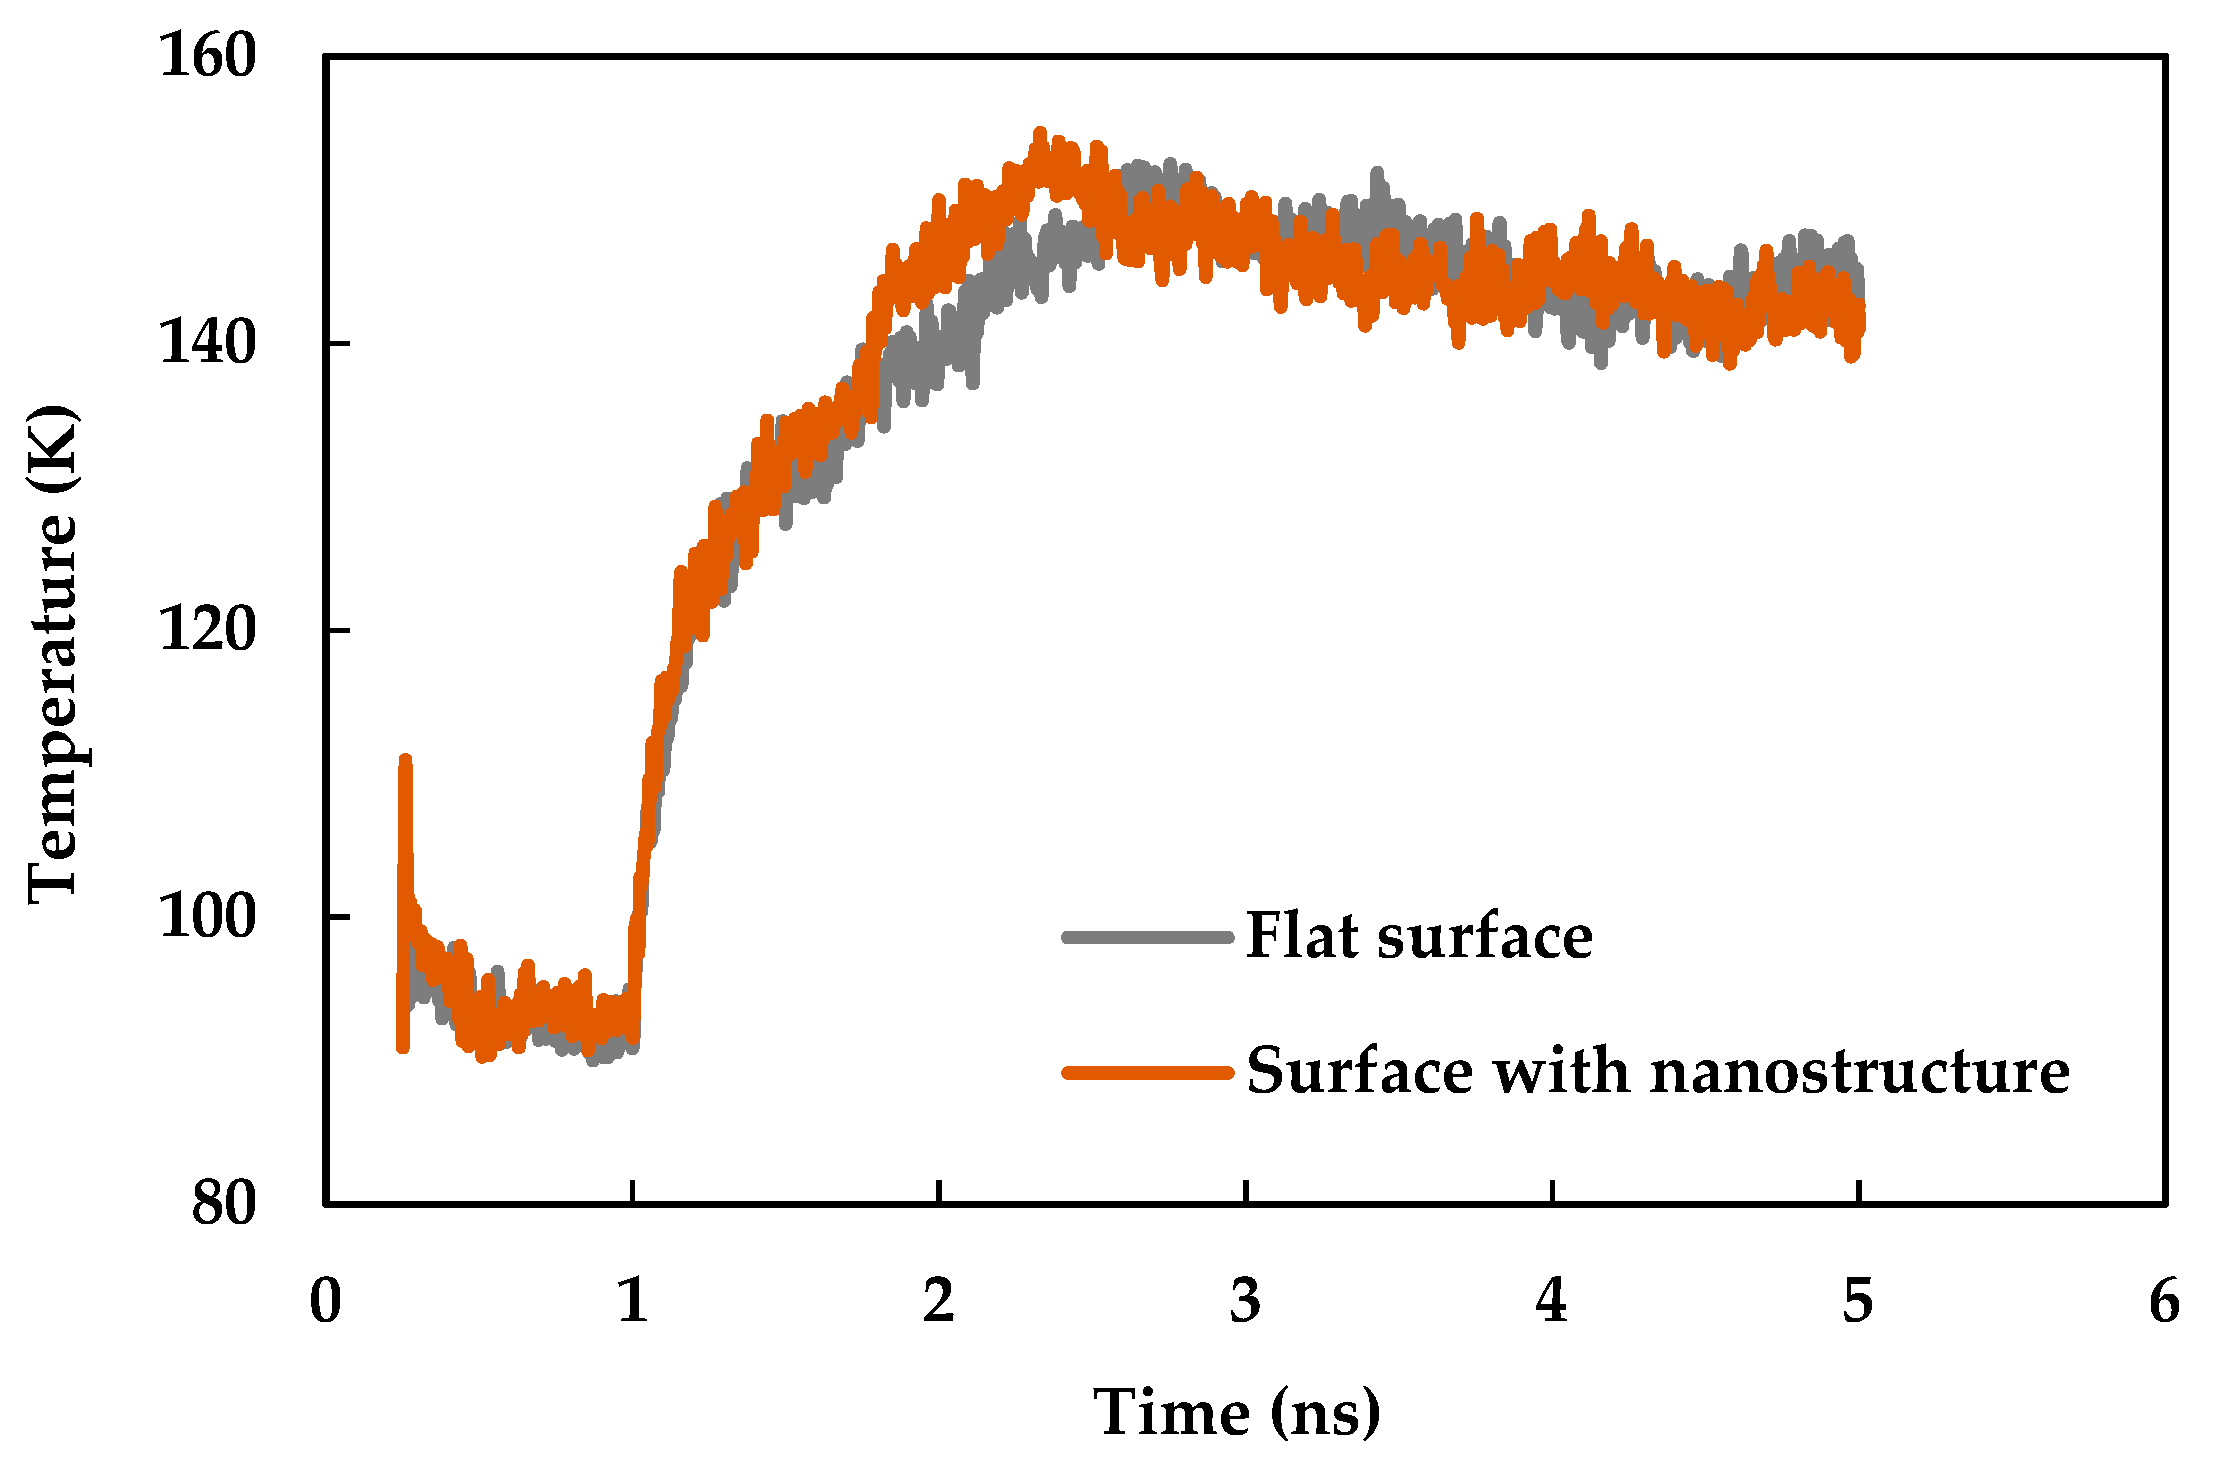
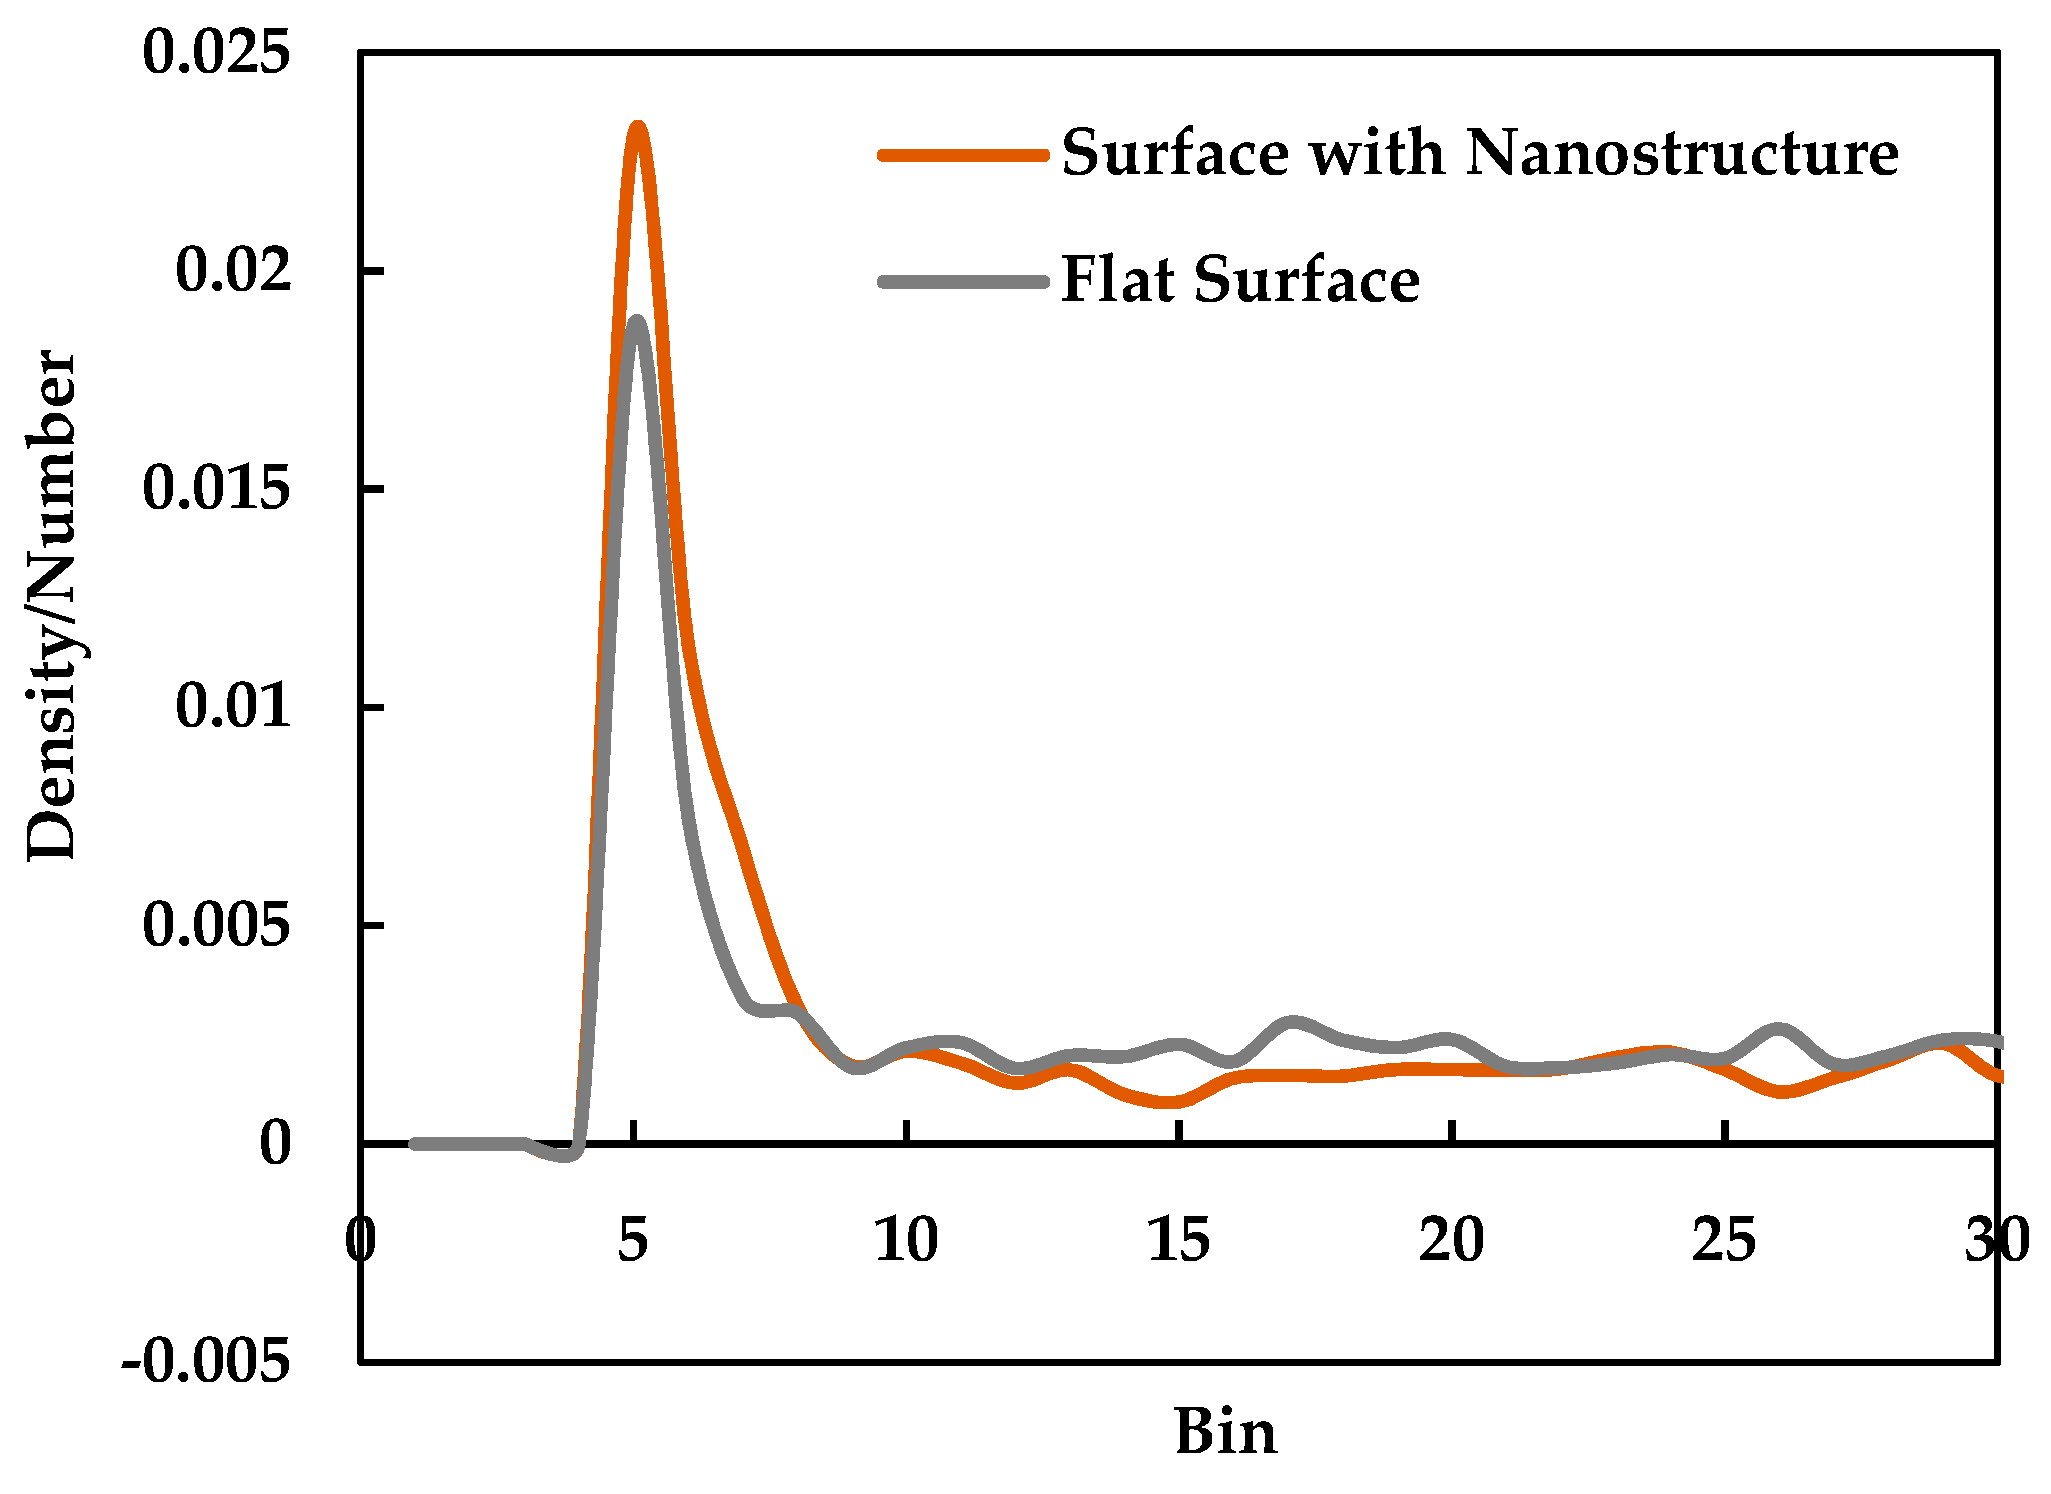
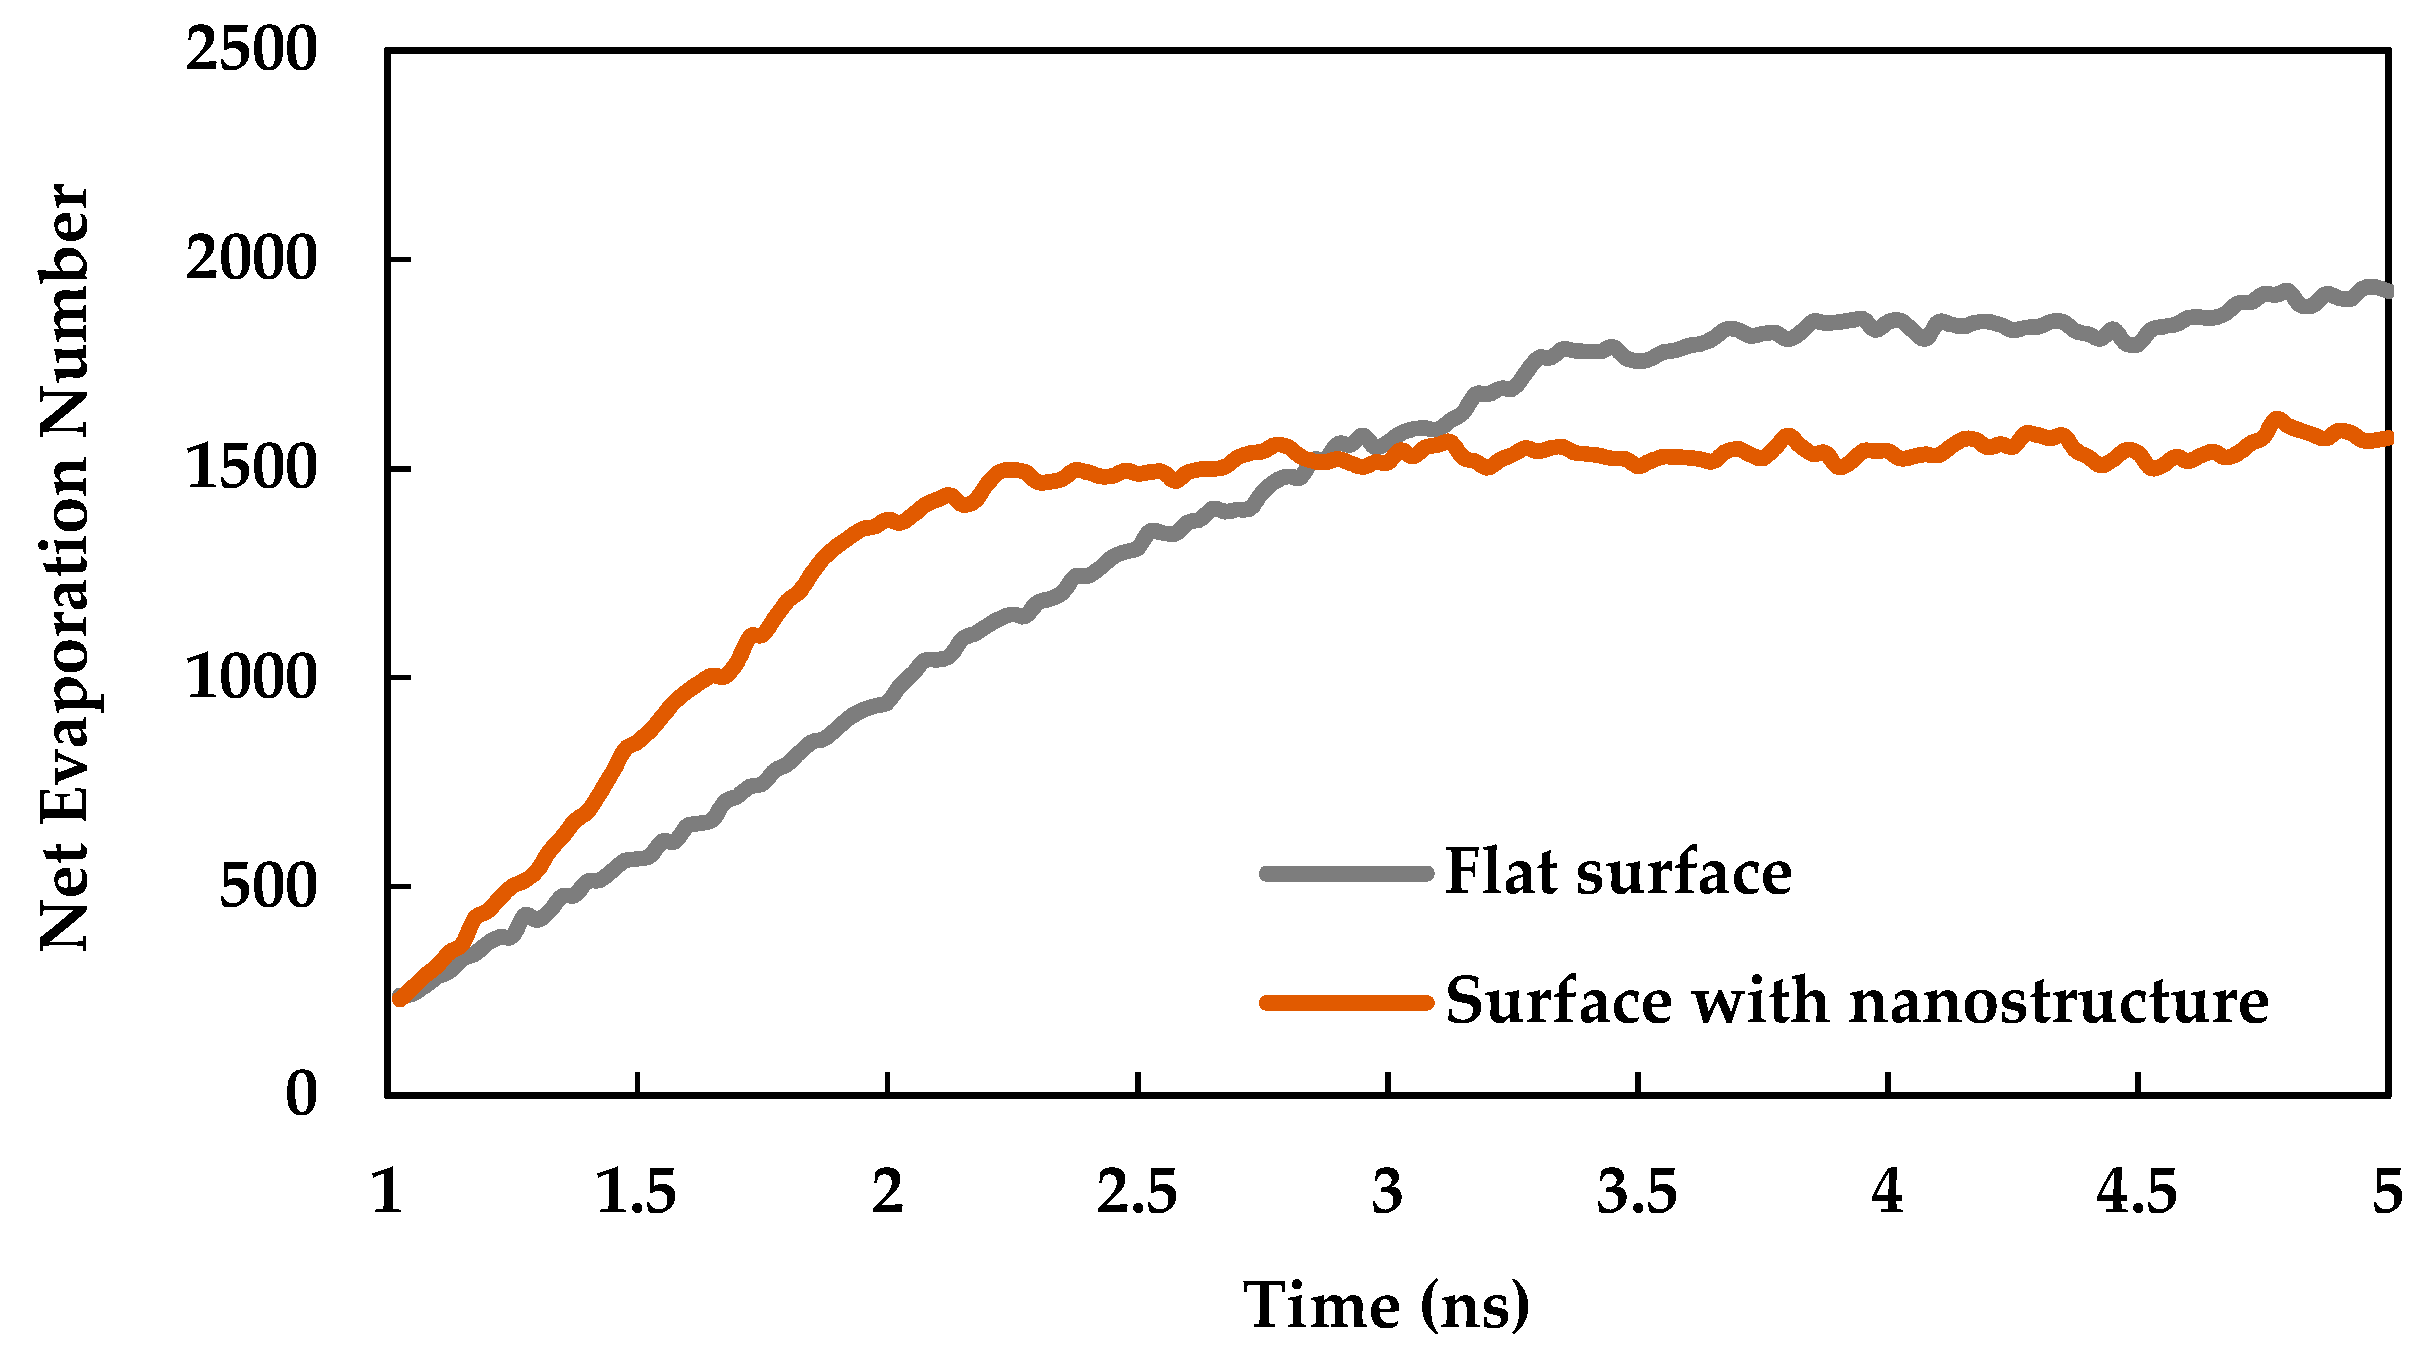
- The heat transfer rate from solid surface to liquid is enhanced for a nanostructured surface compared to a flat surface due to the increase of the effective surface area.
- Introducing nano slots increases the effective surface area as well as solid-liquid interaction and decreases the resistance to heat flow. Therefore, it results in an enhancement of heat transfer during phase change phenomena.
- Nano level surface roughness enhances heat transfer during phase change by increasing the effective surface area and solid-liquid interaction and decreasing the interfacial thermal resistance.
- If the effective surface area is kept the same, heat transfer during phase change can still be very slightly modified by increasing the number of active nucleation sites. When two nanostructures were introduced on the solid surface instead of one, keeping the effective surface area the same, there was still a very slight increase of the net evaporation number.
Author Contributions
Funding
Institutional Review Board Statement
Informed Consent Statement
Data Availability Statement
Acknowledgments
Conflicts of Interest
References
- Kabov, O.A.; Gatapova, E.Y.; Zaitsev, D.V. Cooling technique based on evaporation of thin and ultra-thin liquid films. In Proceedings of the 11th Intersociety Conference on Thermal and Thermomechanical Phenomena in Electronic Systems (ITHERM), Orlando, FL, USA, 28–31 May 2008; IEEE: Newark, NJ, USA, 2008; pp. 520–527. [Google Scholar]
- Ogoh, W.; Groulx, D. Effects of the heat transfer fluid velocity on the storage characteristics of a cylindrical latent heat energy storage system: A numerical study. Heat Mass Transf. 2012, 48, 439–449. [Google Scholar] [CrossRef]
- Georgiou, S.; Koubenakis, A. Laser-Induced Material Ejection from Model Molecular Solids and Liquids: Mechanisms, Implications, and Applications. Chem. Rev. 2003, 103, 349–394. [Google Scholar] [CrossRef]
- Bhardwaj, R.; Fang, X.; Attinger, D. Pattern formation during the evaporation of a colloidal nanoliter drop: A numerical and experimental study. N. J. Phys. 2009, 11, 075020. [Google Scholar] [CrossRef]
- Yu, J.; Wang, H. A molecular dynamics investigation on evaporation of thin liquid films. Int. J. Heat Mass Transf. 2012, 55, 1218–1225. [Google Scholar] [CrossRef]
- Seyf, H.R.; Zhang, Y. Effect of nanotextured array of conical features on explosive boiling over a flat substrate: A nonequilibrium molecular dynamics study. Int. J. Heat Mass Transf. 2013, 66, 613–624. [Google Scholar] [CrossRef]
- Nagayama, G.; Kawagoe, M.; Tsuruta, T. Molecular Dynamics Simulations of Interfacial Heat and Mass Transfer at Nanostructured Surface. Proc. Micro Nano. China 2007, 21410, 1–10. [Google Scholar]
- Maruyama, S.; Kimura, T. A study on thermal resistance over a solid-liquid interface by the molecular dynamics method. Therm. Sci. Eng. 1999, 7, 63–68. [Google Scholar]
- Ji, C.Y.; Tsuruta, T.; Nagayama, G. Effects of Solid Heating Surfaces on Nanometer-Sized Liquid Films. Therm. Sci. Eng. 2005, 13–24, 25–28. [Google Scholar]
- Saha, S.; Khan, J.A.; Farouk, T. Study of Hybrid Wet/Dry Cooling with Different Surface Morphology: Analyses on Pressure Drop and Thermal Performances. In Proceedings of the ASME 2020 Heat Transfer Summer Conference collocated with the ASME 2020 Fluids Engineering Division Summer Meeting and the ASME 2020 18th International Conference on Nanochannels, Microchannels, and Minichannels, ASME 2020 Heat Transfer Summer Conference, Virtual, Online, 13–15 July 2020. [Google Scholar]
- Saha, S.; Tikadar, A.; Khan, J.; Farouk, T. Numerical Analysis on Evaporation Assisted Convective Cooling: Effect of Surface Morphology. In Proceedings of the ASME International Mechanical Engineering Congress and Exposition, Volume 8: Heat Transfer and Thermal Engineering, Salt Lake City, UT, USA, 11–14 November 2019. [Google Scholar]
- Morshed, A.K.M.M.; Paul, T.C.; Khan, J.A. Effect of nanostructures on evaporation and explosive boiling of thin liquid films: A molecular dynamics study. Appl. Phys. A 2011, 105, 445–451. [Google Scholar] [CrossRef]
- Wang, W.; Zhang, H.; Tian, C.; Meng, X. Numerical experiments on evaporation and explosive boiling of ultra-thin liquid Argon film on aluminum nanostructure substrate. Nanoscale Res. Lett. 2015, 10, 158. [Google Scholar] [CrossRef] [PubMed]
- Shavik, S.M.; Hasan, M.N.; Morshed, A.K.M.M.; Islam, M.Q. Molecular Dynamics Study of effect of different wetting conditions on evaporation and rapid boiling of ultra-thin Argon layer over platinum surface. Procedia Eng. 2015, 105, 446–451. [Google Scholar] [CrossRef]
- Shahadat, M.R.B.; Morshed, A.K.M.M. Explosive Boiling on a Hot Copper Plate: A Molecular Dynamics Simulation Study. Adv. Eng. Forum 2020, 35, 18–28. [Google Scholar] [CrossRef]
- Lennard-Jones, J.E.; Devonshire, A.F. Critical phenomena in gases-I. Proc. R. Soc Lond. Ser. A Math. Phys. Sci. 1937, 163, 53–70. [Google Scholar]
- Nagayama, G.; Kawagoe, M.; Tokunaga, A.; Tsuruta, T. On the evaporation rate of ultra-thin liquid film at the nanostructured surface: A molecular dynamics study. Int. J. Therm. Sci. 2010, 49, 59–66. [Google Scholar] [CrossRef]
- Yu, J.; Amar, J.G. Effects of short-range attraction in metal epitaxial growth. Phys. Rev. Lett. 2002, 89, 286103. [Google Scholar] [CrossRef] [PubMed]
- Allen, M.P.; Tildesley, D.J. Computer Simulation of Liquids; Oxford University Press: Oxford, UK, 1987. [Google Scholar]
- Plimpton, S. Computational limits of classical molecular dynamics simulations. Comput. Mater. Sci. 1995, 4, 361–364. [Google Scholar] [CrossRef]
- Stukowski, A. Visualization and analysis of atomistic simulation data with OVITO–the Open Visualization Tool. Model. Simul. Mater. Sci. Eng. 2009, 18, 015012. [Google Scholar] [CrossRef]
- Plimpton, S. Fast Parallel Algorithms for Short-Range Molecular Dynamics. J. Comput. Phys. 1995, 117, 1–19. [Google Scholar] [CrossRef]


Publisher’s Note: MDPI stays neutral with regard to jurisdictional claims in published maps and institutional affiliations. |
© 2021 by the authors. Licensee MDPI, Basel, Switzerland. This article is an open access article distributed under the terms and conditions of the Creative Commons Attribution (CC BY) license (https://creativecommons.org/licenses/by/4.0/).
Share and Cite
Morshed, A.K.M.M.; Shahadat, M.R.B.; Roni, M.R.H.; Masnoon, A.S.; Shamim, S.A.-A.; Paul, T.C. A Molecular Dynamics Study of Heat Transfer Enhancement during Phase Change from a Nanoengineered Solid Surface. Processes 2021, 9, 715. https://doi.org/10.3390/pr9040715
Morshed AKMM, Shahadat MRB, Roni MRH, Masnoon AS, Shamim SA-A, Paul TC. A Molecular Dynamics Study of Heat Transfer Enhancement during Phase Change from a Nanoengineered Solid Surface. Processes. 2021; 9(4):715. https://doi.org/10.3390/pr9040715
Chicago/Turabian StyleMorshed, A. K. M. Monjur, Muhammad Rubayat Bin Shahadat, Md. Rakibul Hasan Roni, Ahmed Shafkat Masnoon, Saif Al-Afsan Shamim, and Titan C. Paul. 2021. "A Molecular Dynamics Study of Heat Transfer Enhancement during Phase Change from a Nanoengineered Solid Surface" Processes 9, no. 4: 715. https://doi.org/10.3390/pr9040715
APA StyleMorshed, A. K. M. M., Shahadat, M. R. B., Roni, M. R. H., Masnoon, A. S., Shamim, S. A.-A., & Paul, T. C. (2021). A Molecular Dynamics Study of Heat Transfer Enhancement during Phase Change from a Nanoengineered Solid Surface. Processes, 9(4), 715. https://doi.org/10.3390/pr9040715