Article

Real-World Failure Prevention Framework for Manufacturing Facilities Using Text Data

1
Department of Industrial Engineering and Institute for Industrial Systems Innovation, Seoul National University, 1 Gwanak-ro, Gwanak-gu, Seoul 08826, Korea
2
AIM Inc., Gangnamdae-ro, Gangnam-gu, Seoul 06241, Korea
3
Department of Data Science, Seoul Women’s University, Hwarang-ro, Nowon-gu, Seoul 01797, Korea
*
Author to whom correspondence should be addressed.
Processes 2021, 9(4), 676; https://doi.org/10.3390/pr9040676
Submission received: 5 March 2021 / Revised: 6 April 2021 / Accepted: 7 April 2021 / Published: 13 April 2021

Abstract

:
In recent years, manufacturing companies have been continuously engaging in research for the full implementation of smart factories, with many studies on methods to prevent facility failures that directly affect the productivity of the manufacturing sites. However, most studies have only analyzed sensor signals rather than text manually typed by operators. In addition, existing studies have not proposed an actual application system considering the manufacturing site environment but only presented a model that predicts the status or failure of the facility. Therefore, in this paper, we propose a real-world failure prevention framework that alerts the operator by providing a list of possible failure categories based on a failure pattern database before the operator starts work. The failure pattern database is constructed by analyzing and categorizing manually entered text to provide more detailed information. The performance of the proposed framework was evaluated utilizing actual manufacturing data based on scenarios that can occur in a real-world manufacturing site. The performance evaluation experiments demonstrated that the proposed framework could prevent facility failures and enhance the productivity and efficiency of the shop floor.

1. Introduction

Recently, manufacturing companies have become increasingly interested in the realization of smart manufacturing [1,2,3], where operation and information technologies are combined to enhance the efficiency and productivity of the manufacturing process [4,5]. The goals of smart manufacturing include reducing costs, enhancing productivity, improving transparency in manufacturing sites, and enabling autonomous control of production [6]. These goals can be achieved by utilizing recently introduced artificial intelligence (AI) technologies and data collected from manufacturing sites [7,8]. Data are particularly essential for the successful application of AI technologies, from achieving a specific goal to realizing complete smart manufacturing [9].
Prevention of facility failure is one of the main objectives of the implementation of smart manufacturing. Facility failure means that a machine or other equipment becomes inoperable because of such factors as breakdown, material supply shortage, and operator breaks. Such malfunction is known to be an immediate cause of a decrease in productivity on a manufacturing shop floor [10]. Facilities are usually interdependent at the shop-floor level, as a product goes through multiple facilities for manufacturing [11]. Therefore, a malfunction of one facility is critical to the entire processing line, as it affects other facilities.
Several studies have been conducted to develop a method to prevent equipment breakdown using failure logs that contain information on previous failures. For example, Li et al. [12] tried to diagnose malfunctions by using bearing vibration, and Li et al. [13] attempted to predict breakdowns by analyzing text data written by operators. A failure log contains multiple factors that describe the situation of each malfunction, with each factor recorded using either sensor signal data or non-sensor signal data. Sensor signal data is recorded in a predefined format, such as vibration, voltage, and pressure collected from a sensor attached to a facility, whereas non-sensor signal data has no specific format, such as text, images, and video [14].
Previous research on the prevention of facility failure has major drawbacks. First, few studies have proposed the implementation of systems to prevent malfunctions in real-world manufacturing sites, to the best of our knowledge. Moreover, most research has presented methods to predict the occurrence of a failure without listing the categories of possible malfunctions, which is necessary information to prevent the failure [15,16]. These methods do not allow operators to actively detect breakdowns; rather, the real-time interaction between an operator and the system can prevent the operator from performing a task [17]. While a few studies exist that used text data or focused on failure prediction categories [13,18], they utilized manual approaches, which were highly time-consuming and not suitable for general applications.
In particular, significant amounts of text written by operators manually are accumulated in manufacturing sites for the following reasons. First, few facilities are systematically integrated, so events that occur in such facilities must be manually recorded. Even in facilities with well-integrated systems, some of the necessary information is not automatically collected. Second, due to frequent changes in facilities, a system cannot completely cover every incident that occurs in the facility. Many of these exceptions can only be logged through a manual process.
For example, failure logs collected from an actual manufacturing company, Woojin Industry Co. located in Ansan-si, Gyeonggi-do, Korea [19], contain many operators’ texts. These logs are composed of factors such as the phenomena, causes of breakdowns, and repairs. The repairs are neither automatically recorded nor selected using a button with limited choices. Furthermore, they cannot be strictly categorized, so they are collected in text form. While the phenomena and causes of failure are provided using a selection button, operators often write them in the repairs text box because the choices provided by the selection button do not include all possible phenomena and causes.
Therefore, analyzing text data written manually by operators is essential for failure prevention, but it is more complicated than analyzing sensor signal data since it requires a high level of data analysis expertise and has high computational costs. It is even more challenging than analyzing other types of non-sensor signal data, such as images. Text data is computationally intractable due to its non-explicit structure, leading to many exceptions in the analysis process [20] and the characteristics of text data represented as high-dimensional vectors [21].
There are three specific challenges in analyzing text data collected from manufacturing sites. First, technical terms related to the manufacturing facilities cannot be analyzed using traditional term-by-term natural language processing (NLP) because there are many cases in which multiple terms are combined to represent a specific meaning. For example, “leakage” refers to the flow of liquids or gases, and “applicator” means a machine that spreads coatings or adhesives on something, whereas “leak applicator” means a machine that seals the space between the mating surfaces of facility to prevent leakage, which has the opposite meaning of the simple combination of the meanings of the two words. Second, different operators use different expressions to indicate the same thing. For instance, “breaking of a wire” is expressed as both “wire is broken” and “broken wire”. To cope with this problem, a method is needed to extract the words that represent important semantic aspects in texts and summarize their content [22]. Third, misspellings exist, as human errors occur in the manual writing of records.
Such a method can be used in the real world if the failure prevention system is designed considering the actual manufacturing shop floor characteristics. Since there are various facilities with a wide range of failure categories [23,24], it is impossible to manually define all possible breakdown types in the system. Therefore, automated categorization of the breakdowns is required to generalize the application and save time. If the type of predicted failure is provided, an operator can prepare for the breakdown. Furthermore, the failure type notification should be given at an appropriate time, such as before the operation begins or during a break, to avoid interrupting the operation. If the operator is notified of a potential breakdown during a time that requires their attention, they cannot respond appropriately to it. There are also failure categories that cannot be responded to unless the information is provided in advance. For instance, the operator cannot act immediately after being alerted of “parts breakage”.
To this end, we propose a real-world facility failure prevention framework that will help an operator to prepare for a possible malfunction by providing a pre-failure alert list that contains information about any breakdowns that may occur during their working hours. The notification of each possible failure includes the failure category, the part which may fail, and the probability of malfunction. An operator can prevent facility failures by preparing for each possible failure noted in the pre-failure alert list before beginning work.
Specifically, the proposed framework consists of two processes: A deferred-time process and a real-time process. In the deferred-time process, the failure pattern database is constructed by analyzing past failure logs using four steps. First, to structure the text data in the facility failure logs, phrases are extracted from the verbiage contained in the logs, and the logs are vectorized utilizing the extracted phrases. Second, the failures are categorized using weighted k-means clustering [25], which considers the importance levels of various factors in the logs. Third, each log is expanded to identify failure patterns by mapping relevant information such as weather and operator expertise. Finally, the failure patterns that occur frequently are identified to build a failure pattern database. In the real-time process, an operator who is about to begin work gets a pre-failure alert list extracted from the database so they can check the equipment in advance.
The remainder of this paper is organized as follows. Section 2 comprises a literature review on facility failure prediction and prevention. In Section 3, the proposed facility failure prevention framework is introduced and explained. In Section 4, experimental results using real-world data are presented to show the effectiveness of the proposed framework. In Section 5, the proposed framework is validated by studying real-world facility failure scenarios that could occur in actual manufacturing sites. Finally, the paper is concluded in Section 6.

2. Literature Review

Several studies using various data analysis methods have been conducted regarding the prevention of facility failure. Diverse approaches were adopted for prevention, including failure prediction, failure diagnosis, and remaining useful life (RUL) prediction. Failure prediction is the forecasting of a failure based on historical data, and failure diagnosis is an examination of the cause of the malfunction [26]. RUL prediction refers to forecasting the time until failure by analyzing historical data [27]. A study considered the relevance analysis between breakdowns and environmental factors such as weather conditions, manufacturer, and equipment, but that study was focused on analyzing the textual failure logs rather than preventing breakdown [28]. Studies on the approaches mentioned above are listed in Table 1.
The data utilized in previous research are either sensor signal or non-sensor signal. Sensor signal data have been widely used in research on failure prevention in the manufacturing domain. Previous studies used sensor signal data for pressure [15,29,30,31], temperature [29,31,32], vibration [12,16,26,33,34,35,36,37,38,39,40,41], and voltage [45] for failure diagnosis, failure prediction, and RUL prediction. The types of artificial neural networks (ANN) that were applied are auto-encoder [12,15,16,36,39,41], long short-term memory (LSTM) [12,30,31,45], convolutional neural networks (CNN) [37], deep neural networks (DNN) [28,41], and weightless neural networks (WNN) [32]. The k-nearest neighbors (k-NN) algorithm [34], support vector machine (SVM) [26], and transfer learning with high-order Kullback-Leibler (HKL) [38] were also used in a few studies, and analyses were performed using similarity measures [35].
Among non-sensor signal data, images and text were used for failure prediction, failure diagnosis, and RUL prediction. Types of neural networks such as CNN [31,37], DNN [41], and auto-encoder [41] are applied to the image data. There have been a few studies using text data [13,18,28,47]. Li et al. [13] and Bai et al. [18] predicted failure categories, which were manually labeled by operators, and Zhao et al. [47] predicted failure categories that were predefined in the data.
In addition, most studies have predicted facility status—whether the device malfunctions or not—despite the variety of failure categories that can occur [48]. A few studies predicted facility categories, which were manually annotated [13,18] or predefined [47]. However, manually labeled failure categories cannot be generalized because failure categories vary for each process. Thus, predefined failure categories are not suitable for real-world scenarios.

3. Materials and Methods

The proposed real-world failure prevention framework consists of a deferred-time process that constructs a failure pattern database and a real-time process that alerts operators to prevent facility failures. The deferred-time process constructs a database of breakdown cause-and-effect pairs from the raw failure logs. The real-time process uses the database to extract a pre-failure alert list of breakdown types that can occur during the operator’s working hours, based on each operator’s real-time logs, including such factors as the equipment they are using, their proficiency, and the current time.

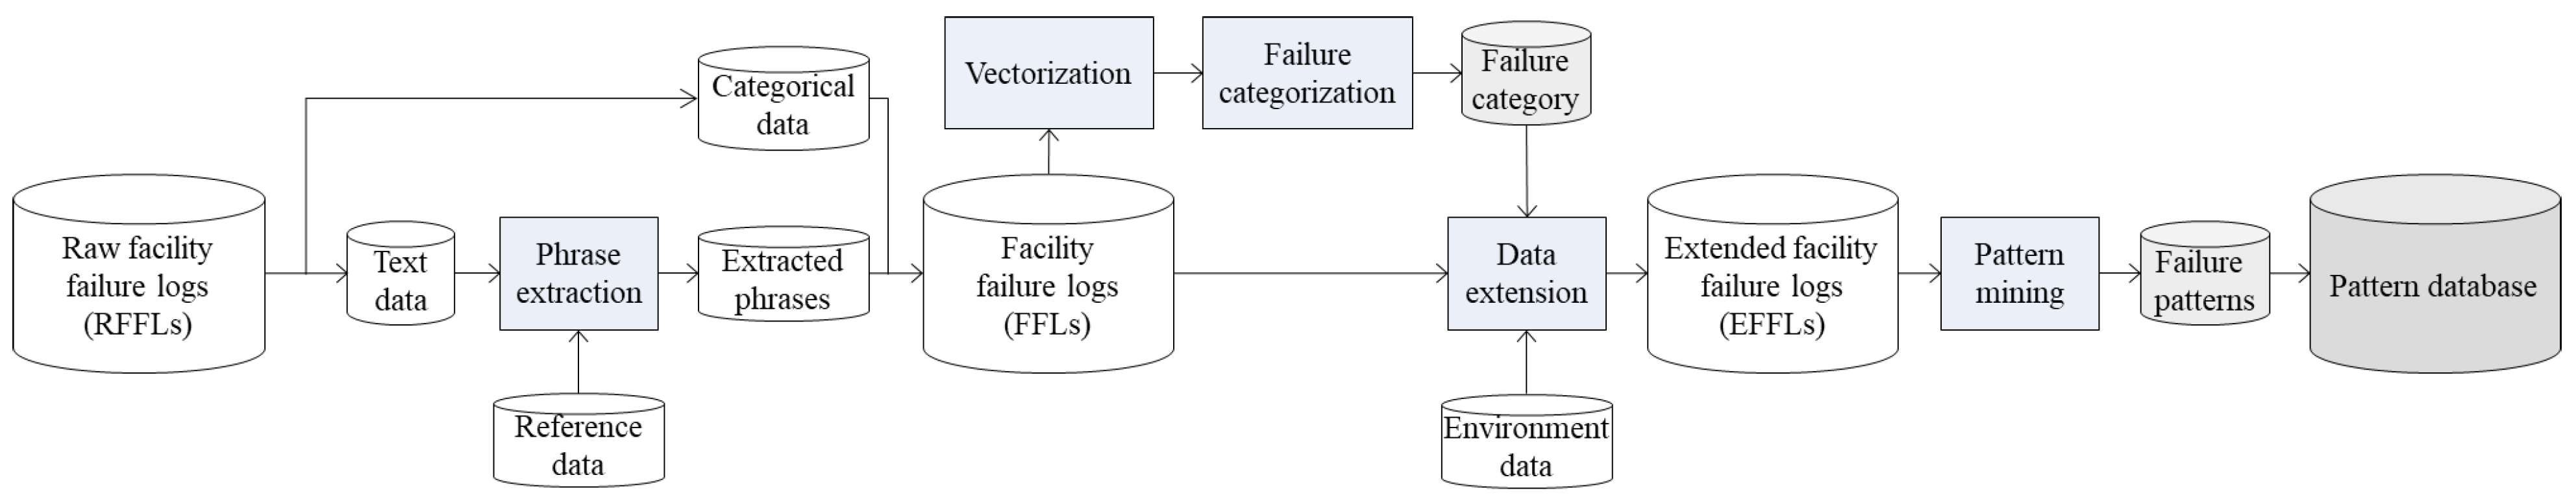
3.1. Deferred Time Process: Overall Process Description

In the deferred-time process, the failure pattern database is constructed from the raw facility failure logs (RFFLs), consisting of two data types: Categorical and text data. The categorical data are collected when one of the predefined categories is selected, and the text data are entered directly by operators because the failure cause is not entered as categorical data. RFFLs are parsed into phrase units that include the meaning of the phenomena and the causes of breakdowns and are categorized in facility failure logs (FFLs). Extended facility failure logs (EFFLs) include environmental information such as site temperature, date, operator, and facility information mapped to the FFL records and failure categories.
Subsequently, failure patterns are identified to create cause-and-effect rules based on the relationships found in the data. A failure pattern consists of the surrounding environment and the breakdown caused by that particular environment. These patterns are the final output of the process, and they are accumulated to create the failure pattern database through the following steps.
First, phrases are extracted from the text data to categorize RFFLs that contain the failure information. Second, facility failure categories are generated utilizing FFLs by clustering the logs. Third, three data elements—FFLs, failure categories, and environmental data—are mapped to each other and EFFLs for pattern mining. Finally, facility failure patterns are identified by applying FP-growth to the EFFLs. The sub-steps and the specific approaches of each step are summarized in Table 2. Moreover, an overview of these steps is shown in Figure 1.

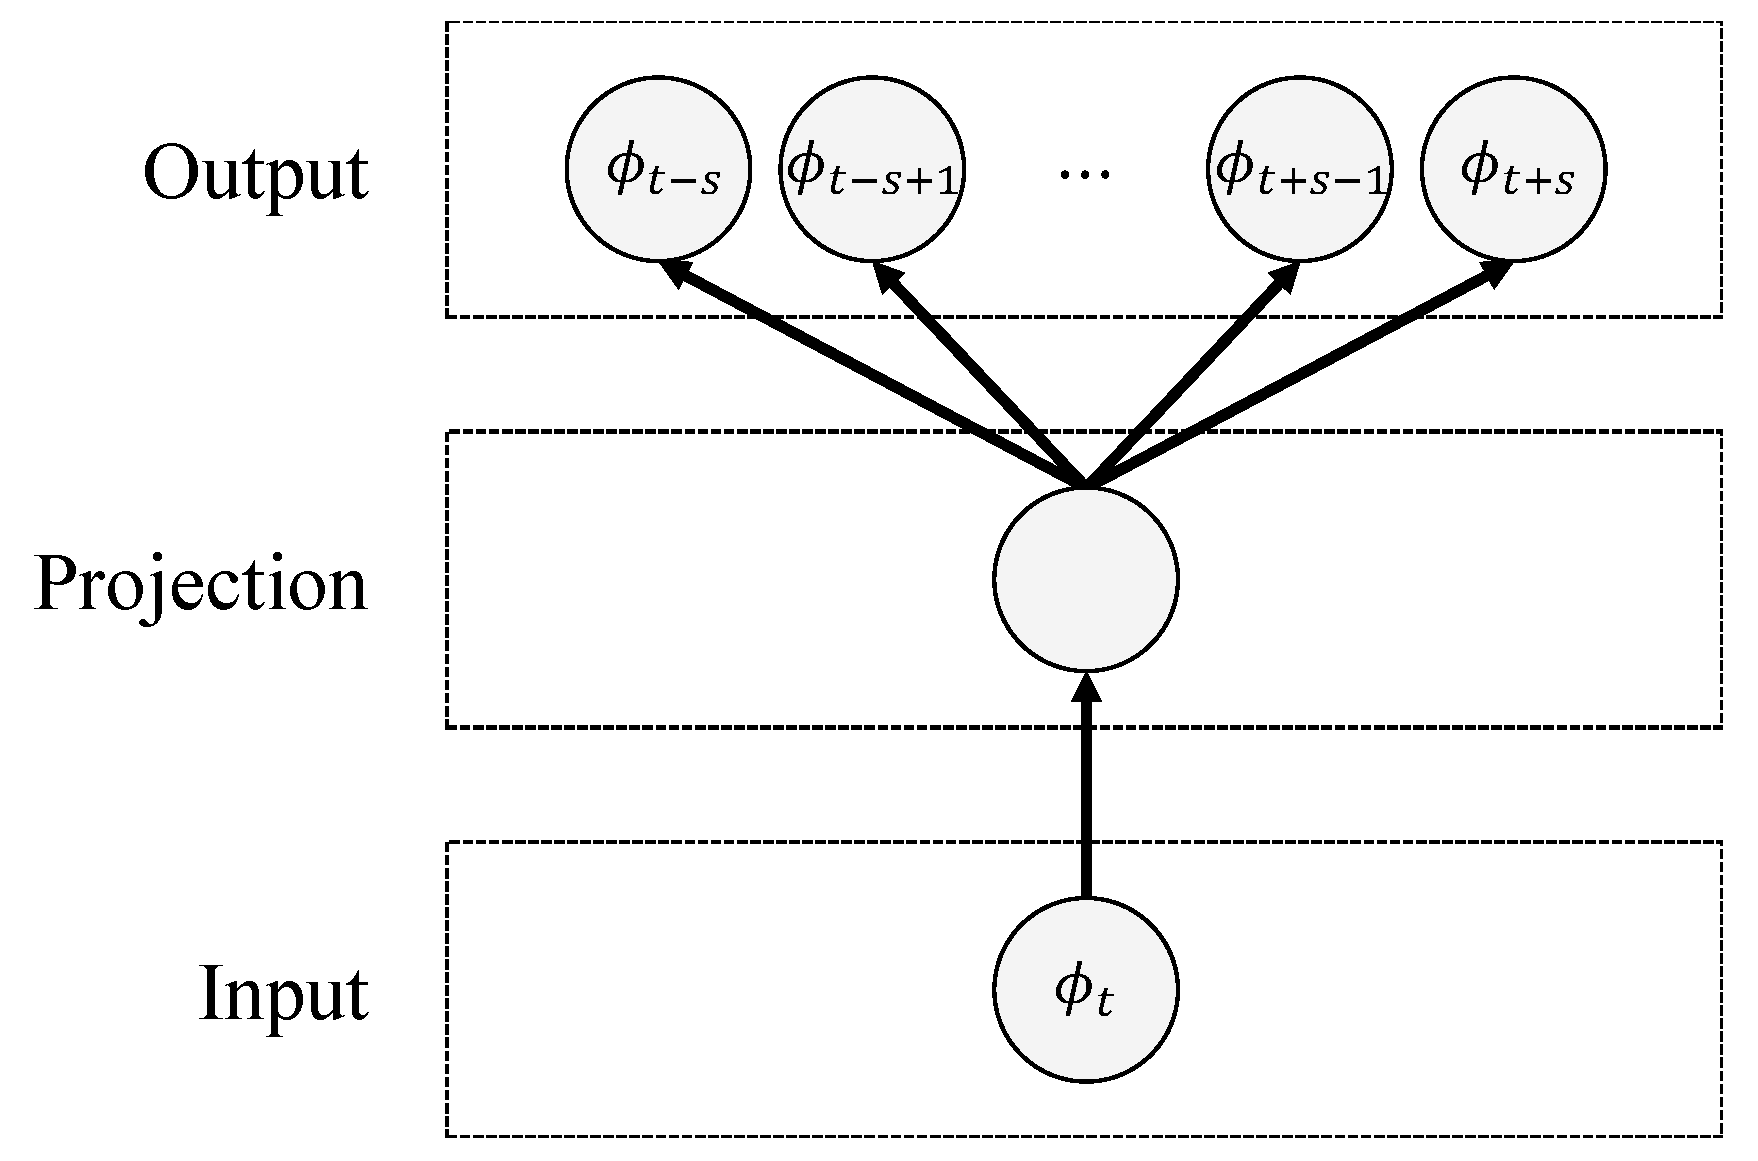
3.2. Deferred Time Process: Phrase Extraction

As mentioned above, the text data in the RFFLs is separated into phrases, which are the minimum unit in which multiple words are combined to have meaning. For phrase extraction, we construct a word usage-based dictionary to distinguish the text data. Here, the reference data, which are composed of mechanical-related terminologies commonly used in the actual site and the text data, are used to build the dictionary.
Four word usages are adopted to build the word usage-based dictionary. Four items, WD, ST, SE, and E, are defined as follows. WD is an abbreviation for “word” and indicates a word that must be expressed in a phrase because it has meaning. ST is an abbreviation for “separate” and indicates a word in the phrase that has meaning and also separates phrases. SE and E are abbreviations for “separate and eliminate” and “eliminate”, respectively, and indicate words that have no meaning and thus are unnecessary for phrase extraction. SE is also a separator between phrases. We build a dictionary tagging the above items for words that frequently appear in text data of RFFLs.
Meanwhile, the reference data collected by crawling the online mechanical terminology dictionary [49] and by interviewing experts comprise terminologies that are difficult to understand with general knowledge alone because they are used only in the field. This online terminology dictionary provides a set of terms related to the specific field. Terms and definitions from the online terminology dictionary are crawled and added to the word usage-based dictionary. Facility-related terms are tagged as WD because they should be expressed in phrases, as are expertise terms acquired from the expert interviews.
The overall steps to extract phrases using the constructed word usage-based dictionary are as follows. First, each word in the text data is extracted and tagged using the dictionary and Python language. Phrases are extracted when they contain necessary words, and unnecessary words are deleted. A phrase is a unit used to identify the phenomenon or cause of failure and should not include action details. Therefore, the extracted phrases that contain action descriptions such as “replacement”, “exchange”, “action”, and “change” are deleted in post-processing. Multiple phrases can be extracted, depending on the amount of facility information included in the inputs.
Examples of phrases extracted using the word usage-based dictionary are shown in Table 3. The input in Example 1 is ”Parts wear due to excessive rubbing”. “Parts”, “wear”, “excessive”, and “rubbing” are WD, and “due to” is SE because the words preceding “due to” indicate a failure phenomenon and the words following show the cause of breakdown. Two phrases in the example are derived as “parts wear” and “excessive rubbing”. In Example 2, “Introduction of white foreign matter into the product protector part” is extracted from “Operation of the equipment has stopped due to the introduction of white foreign matter into the product protector part”.

3.3. Deferred Time Process: Failure Categorization

Vectorization is an essential step in transforming data from non-numeric to numeric [50,51,52]. The FFL data types, categorical and text data, are embedded into a vector space using one-hot encoding and phrase2vec [53], respectively. The one-hot encoding algorithm determines the number of dimensions by the number of categories, with the corresponding category value set to 1 and the other category values set to 0 [52]. Phrase2vec, based on word2vec [51] which expresses words having the same meaning as adjacent vectors, generates vector representations of phrases, considering their meanings. Extracted phrases are represented as vectors reflecting the calculated semantic similarities between phrases. Therefore, the phrases extracted from the text data that are written differently by each operator, even though they describe the same type of failure, are expressed as adjacent vectors using phrase2vec, implemented by the Python package Gensim [54].
The phrase2vec, also known as the continuous skip-gram model, consists of three neural network layers: The input, projection, and output layers, as shown in Figure 2. The skip-gram model maximizes the average log probability in Equation (1):
1 T t = 1 T s j s , j 0 log p ( ϕ t + j | ϕ t ) ,
where ϕ t and ϕ t + j are the center phrase and the j-th word from the center phrase, respectively. T is the number of words and phrases in the learning sentence, s is the window size of the model, and j is the window size index. The window size refers to the number of surrounding words before and after the center phrase to represent in the vector.
Let u denote the unique words and phrases on the training dataset for the skip-gram model. In the case of Gensim’s implementation model, Google News dataset [55] consisting of about 100 billion words is utilized for the model training. For the embedding vector generation, the phrase transformed into a v-dimensional one-hot vector (the input layer) is multiplied with the u × d weight matrix, producing a d-dimensional embedding vector (the projection layer). Finally, the estimated probabilities of u unique words positioned in ϕ t + j is calculated by multiplying the generated embedding vector by the d × u weight matrix (the output layer). Model training proceeds so that the estimated probabilities calculated from the embedding vector becomes close to the one-hot embedding vector of the answer word positioned in ϕ t + j . Therefore, the embedding vector contains information on surrounding words since the embedding vector is trained to infer the surrounding words well. In the case of phrases having similar meanings, in many cases, the words appearing around them are also similar, so the embedding vectors also become closer. Details on the skip-gram model can be found in [53].
A log of FFLs is created by concatenating the embedding vectors from text data and one-hot encoding from categorical data.
l n = o f n v ϕ n ,
where l n refers to the n-th log of FFLs, ⊕ is the concatenation symbol, o f n is the one-hot encoding of the categorical data for the n-th log, and v ϕ n is the embedding vector of the extracted phrase for the n-th log.
Failure categorization using the log of FFLs generated from the vectorization step proceeds to derive significant failure patterns. Failure patterns are identified from the situations in which a breakdown occurs and the corresponding failure categories. The more diverse the situation in which the category occurs is, the more reliable are the pattern results that can be obtained. Therefore, FFLs consisting of multiple phrases should be clustered into a few failure categories.
For the categorization, weighted k-means clustering is used to assign different weights to each factor in the FFLs. K-means clustering, which is widely used because of its simple nature and intuitive advantages, minimizes the variance of the distances between the cluster center and the data point. Weighted k-means clustering aims to minimize the distance variance per cluster by grouping the given data into k clusters and assigning weights to factors. The weights are a directly adjustable parameter.
The objective function of weighted k-means clustering is defined in Equation (3):
k = 1 K n = 1 N m = 1 M i k n w m l m n c k 2 ,
where c k is calculated by Equation (4).
c k = n = 1 N m = 1 M i k n w m l m n n = 1 N i k n .
i k n indicates whether l n belongs to the k-th cluster or not, with i k n set to 1 if l n belongs to the k-th cluster and 0 otherwise. K, N, and M are the numbers of clusters, logs, and factors, respectively, in the FFLs. w m is a weight vector of the factors in the FFLs. l m n and c k refer to a log in the n-th row with m factors and a centroid for the k-th cluster. The entire process of clustering the vector representation of FFL logs using weighted k-means clustering is shown in Algorithm 1.
Algorithm 1: Weighted k-means clustering.
 Randomly select k centroids from all l n ;
 Set limit of iterations, M a x I t e r ;
I t e r 0 ;
repeat
   For all l n , calculate the weighted distance to each centroid c k ,
     m = 1 M w m l m n c k 2 ;
   Assign all l n to its nearest centroid;
   Compute the new controids by using Equation (4);
   I t e r I t e r + 1 ;
until The centroids do not change or I t e r M a x I t e r ;
Weights should be given for all factors. In our case, a total of six factors, Facility, Phenomenon, Cause, Location, Part, and Extracted phrases were used. Here, Facility, Phenomenon, Cause, Location, and Part are categorical data in RFFLs, and Extracted phrases are generated from text data. Each factor contributes only an assigned weight, and the given weights are different in the clustering process. Since the extracted phrases are represented in the vector based on semantic similarity, they are clearly distinguished from similar and dissimilar phrases. Therefore, extracted phrases have more influence than other factors.
We use two types of weights in our experiments. One is provided by experts, and the other emphasizes the extracted phrases. The cluster is configured according to the parameter k, which is the number of clusters. In this paper, it refers to the number of failure categories, with the FFLs clustered into a total of k failure categories. The clustering process was implemented using the Pycluster [56] package, a module that provides clustering algorithms in Python.

3.4. Deferred Time Process: Data Extension

In this step, data for identifying significant failure patterns are generated by mapping the data. Data that include various factors can lead to diverse patterns. Because many factors can form different combinations, this increases the number of pattern cases. Thus, the data are extended through mapping to extract meaningful patterns.
Extended data are mapped using three types of data: Environmental data, failure categories, and FFLs. Environmental data include the shop-floor temperature, operator proficiency, working hours, and facility information. Operator proficiency means the competence of each operator working on the shop floor. Working hours indicate the shift time and meal-break time by shift. Facility information includes items such as the process to which the facility belongs, the year it was installed on the shop floor, and the facility code.
Data extension proceeds in two steps, as follows. First, the failure categories, which were output by the failure categorization step, are mapped to the FFLs, the output of the phrase extraction step. Second, the mapped data in the first step are connected to the environmental data. The final mapped data from the above two steps are used for pattern mining.

3.5. Deferred Time Process: Failure Pattern Mining

Facility failure patterns representing situations where failure categories occur are derived using the frequent patterns growth (FP-growth) algorithm [57], which mines frequent patterns. The FP-growth algorithm constructs a tree structure containing the frequency information and mines frequent itemsets through a recursive divide-and-conquer approach. Details on the FP-growth algorithm can be found in [57]. We utilized the FP-growth solution of SPMF open-source software [58], specialized in pattern mining, available at the SPMF website [59].
Patterns consist of antecedent rules, which describe the cause eliciting a consequence, and a consequent rule, which describes the result. The antecedents in the facility failure patterns include the part, breakdown situation, temporal information such as the month and day, location information such as the facility, and environmental information such as the operator and age of the facility. The consequents in the facility failure patterns are the failure categories.
There are two indicators for evaluating the mining patterns: Support and confidence, calculated using the antecedents and the consequent. Support refers to the probability that a pattern includes a specific environment and failure category in the whole pattern and is defined by Equation (5):
S u p p o r t ( X Y ) = P ( X Y ) .
In Equation (5), X is the antecedents and Y is the consequent. Confidence is the probability that the pattern contains a specific environment, including a particular failure category, and is defined as in Equation (6):
C o n f i d e n c e ( X Y ) = P ( X Y ) P ( X ) .

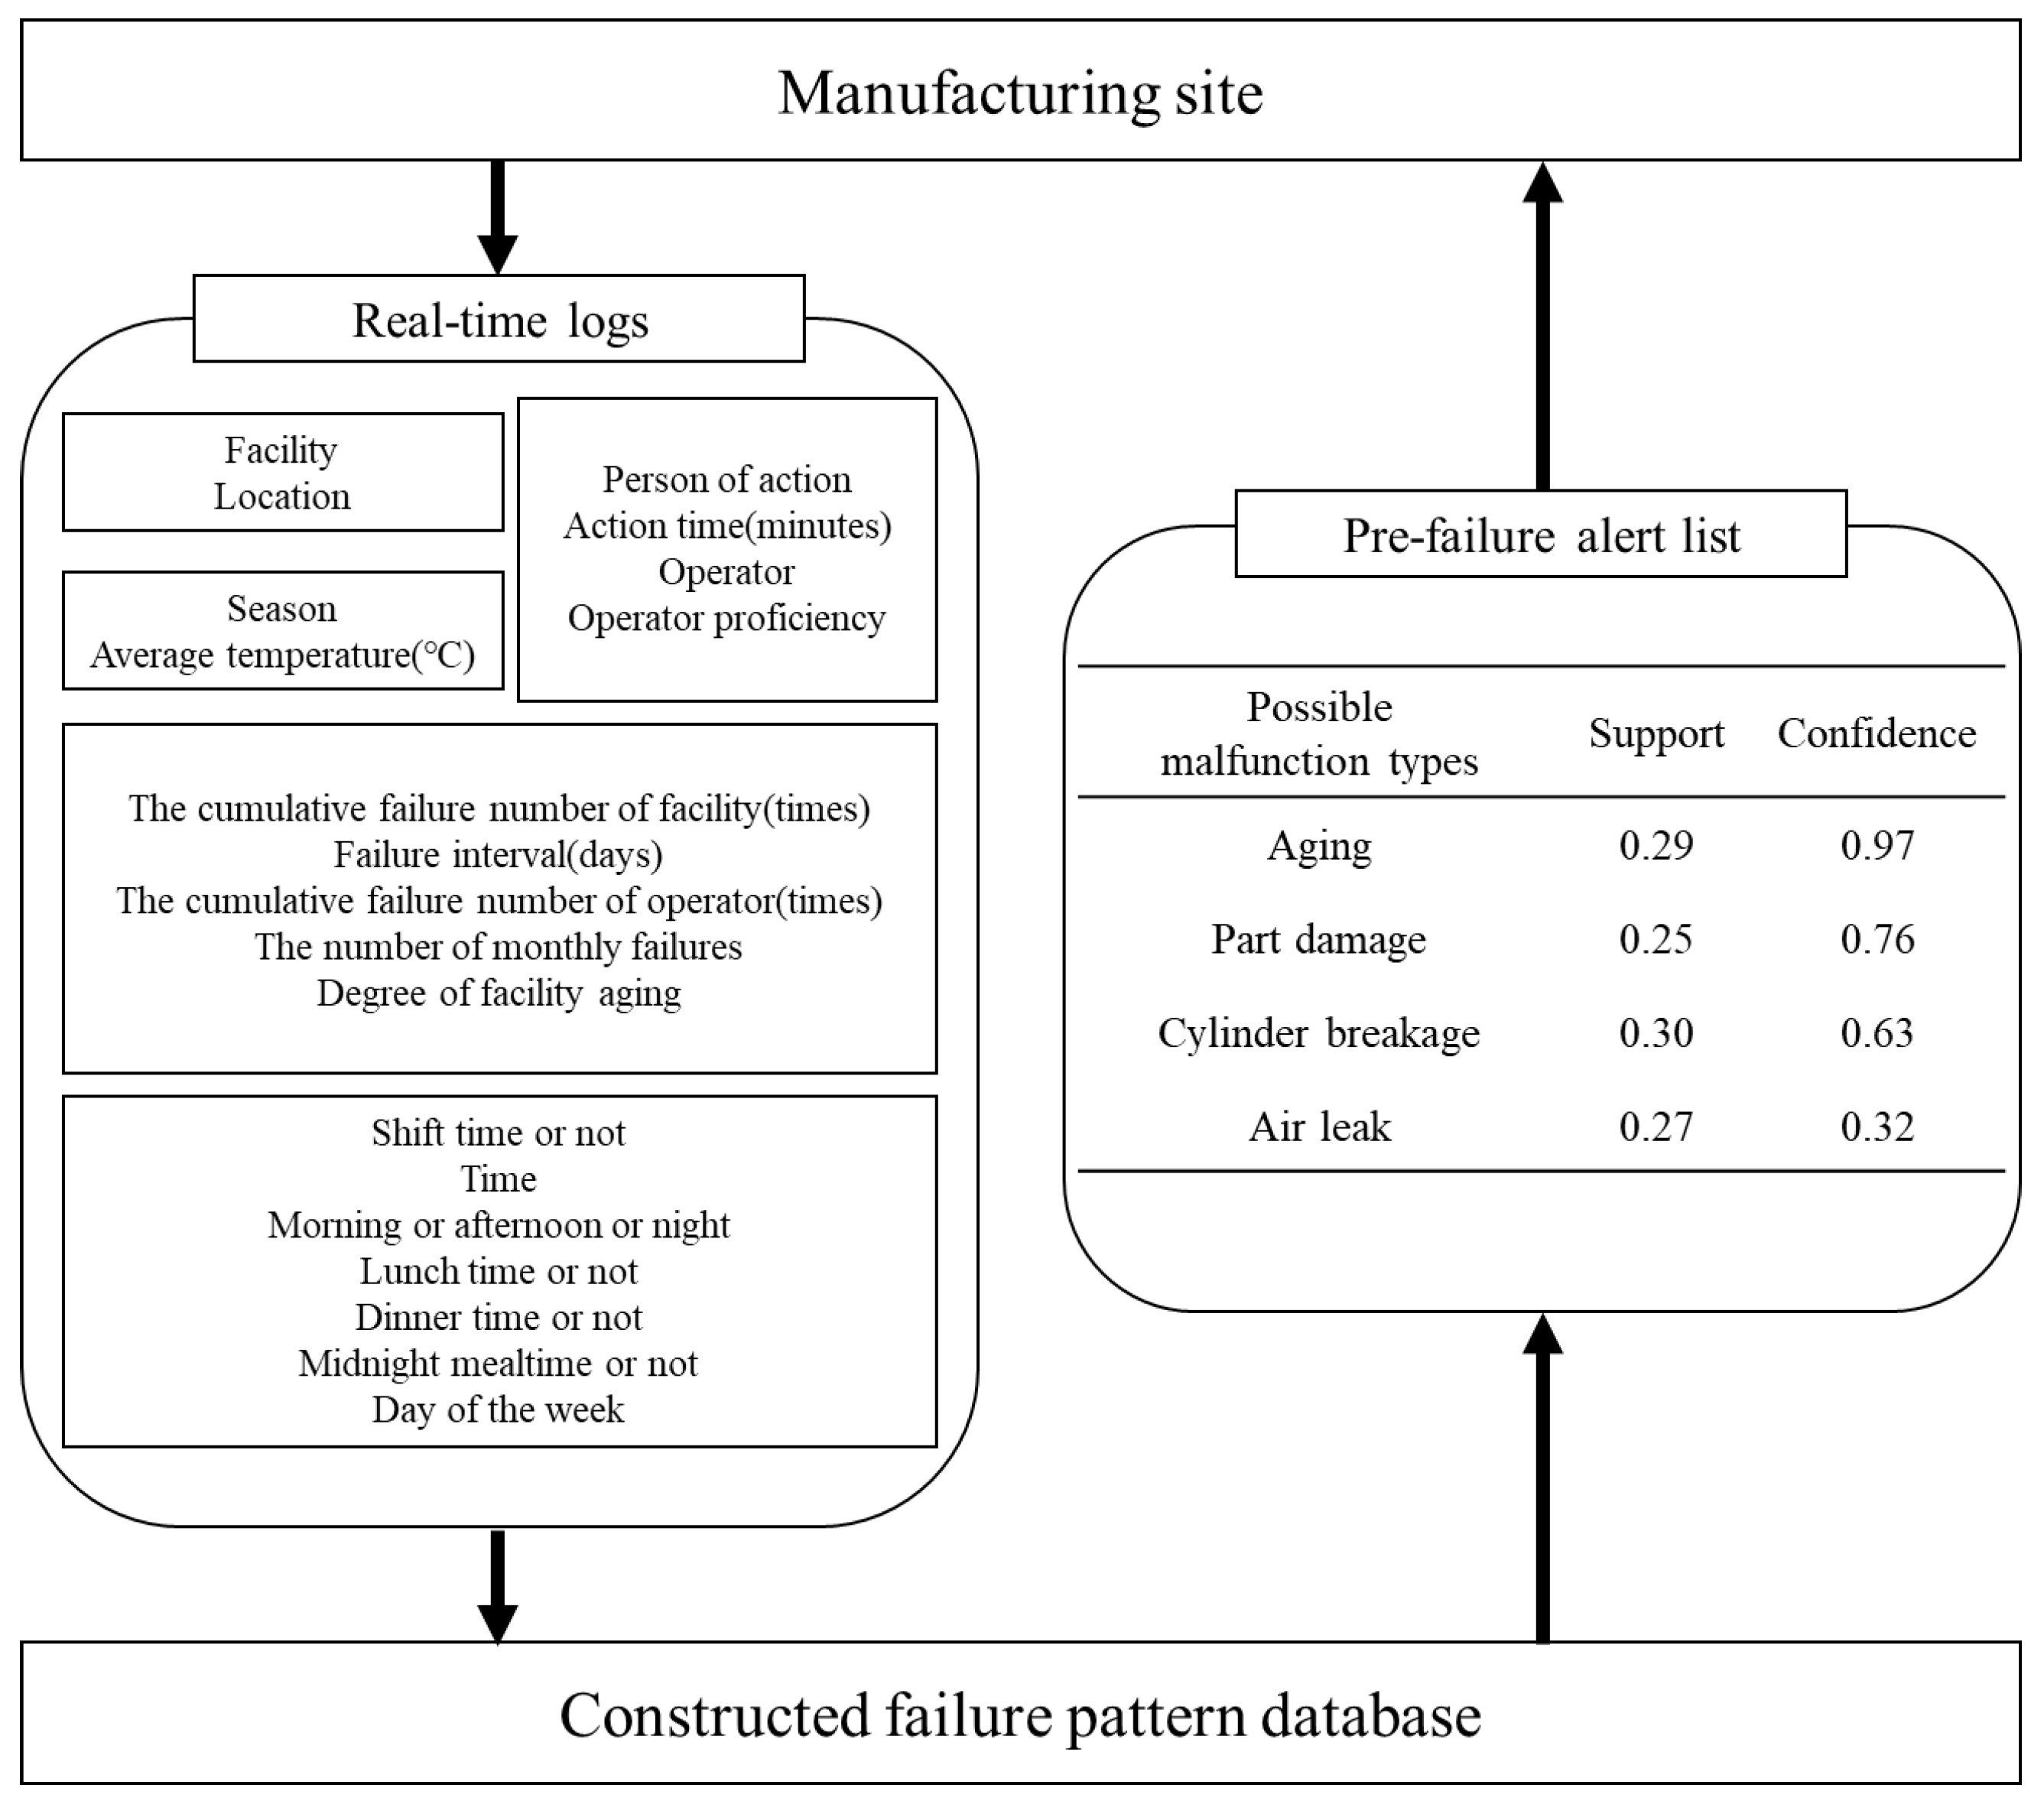
3.6. Real-Time Process: Pre-Failure Alert Based on Failure Pattern Database

Alerting operators during their working hours through pre-failure alert lists, which include possible malfunction types, allows the operators to prevent potential failures. The operators enter their real-time logs sequentially into the alert system before beginning work, and the alert system uses the log to list the corresponding failure categories, which are the consequents in the matching-pattern rules, confidence values, and support values from the failure pattern database. The list is sorted by confidence level, with the highest-confidence failure types displayed first, so that the operator can check the facility before beginning work and prevent a potential failure.
Real-time logs include environmental information such as the facility, weather, day of the week, and the operator who will receive the list. Real-time logs vary from operator to operator and from time to time. Due to the nature of the manufacturing sites, operator shifts may occur many times each day. The pre-failure alert list, which is provided based on the real-time logs, corresponds to the characteristics of a site where the working environment changes frequently.
The operator can use the given list to act in advance to prevent a potential malfunction before starting work. Because the failure types are listed in order of confidence level, the operator can identify the most likely failure category. If the highest-confidence failure type in the pre-failure alert list given to a particular operator is “leaking”, they can check any parts that can leak before they begin work. Thus, they can prevent failures by working through the list provided based on the current real-time logs. This process is illustrated in Figure 3.

4. Results

The proposed framework was evaluated using a real-world dataset provided by the manufacturer Woojin Industry [19]. This manufacturer collected failure logs, called RFFLs in this paper, which recorded the relevant data when a machine malfunctioned. A total of 1394 RFFLs used in this experiment were collected from the oxygen sensors between February 2014 and January 2018.
Examples of RFFLs are shown in Table 4. No. 1 in Table 4 means that the electric machine of OZ Application 3 malfunctioned due to the discharge of the sensor battery. However, there is no category for this cause, so the operator entered the breakdown cause manually in the comment. No. 3 in Table 4 is the log of a failure caused by a foreign substance contaminating the wiring of OZ Checker 3. Disconnection was not in the phenomenon category, so the operator added it to the comment.
Specifically, RFFLs include the facility, phenomenon, cause, location, part, and comment. Facility is the facility name where the malfunction occurred, consisting of 25 category values. Phenomenon is the symptom of failure and is recorded with one of 14 values. Cause means the fundamental event causing facility failure and takes one of 17 values, although some causes are not covered by any of the provided values. Location is the group of parts or components where the failure occurred, with 5 and 19 values, respectively. The comment is composed of data manually typed by operators to describe the failure because it is difficult to explain the phenomenon or cause effectively using only the given category options. A summary of the RFFLs is shown in Table 5.

4.1. Experimental Settings

There are three parameters to be determined for failure categorization. First, the dimension of the vector to represent the extracted phrases for categorization is determined. Second, the number of failure categories, k, is determined. Third, the weight for the k-means clustering of each factor in the FFLs is set.
Extracted phrases in the FFLs are embedded in a vector of 200 dimensions using phrase2vec. Vector dimensions that are too large or too small will limit the ability to fully express the meaning of the text. The vector dimension 200 is commonly used for text data [60].
The number of failure categories, k, is qualitatively predefined in the range from 15 to 20. With a larger k, the categorization meaning disappears, whereas with a smaller k, the variance between categories increases [61]. Furthermore, the following two reasons influenced us in setting the k value in the range from 15 to 20. First, there are 14 phenomena and 17 causes in the RFFLs. Second, managers and operators at the site judged that from 15 to 20 failure categories were adequate.
In categorizing FFLs into approximately k categories, weights were given differently for each factor in the FFLs, as shown in Table 6. The weights for the factors were determined by interviewing experts on-site and by emphasizing the extracted phrases. The facility weight was the highest, and extracted phrases had the lowest weights in the expert weighting. Emphasizing phrases had the largest weights among the extracted phrases, and they had the smallest weights for phenomena and causes that were not properly categorized. The weight values were selected for the best performance after the experiments for several cases.
For the performance comparison, k-means clustering, which is not considered weighting by the factors, was selected as the baseline. K-means clustering clustering groups the given data into k clusters to minimize the variance of the distance from each cluster [62]. The method treats all factors fairly in the clustering process and sets the weights of all features equally when evaluating dissimilarity, as shown in the “Given equally” column of Table 6.
Popular cluster evaluation metrics such as the adjusted rand index and V-measure were employed to identify performance differences between the proposed and comparison methods. Both metrics are external cluster validation measures and have a value between 0 and 1. External index measures evaluate whether a label is assigned to the correct class using known data for the labels. Therefore, labeled data is required to use the two metrics to evaluate the failure categorization. The data were labeled by qualitative failure categorization by experts, resulting in 708 FFL logs collected, labeled, and assigned to seven failure categories.
Adjusted rand index [63] is a metric to solve a problem with the rand index [64], which tends to increase in value as the number of clusters increases. Rand index is the ratio of the number of pairs that are correctly clustered to the number of all pairs. The adjusted rand index is shown in Equation (7):
A R I = n 2 ( T P + T N ) [ ( T P + F P ) ( T P + F N ) + ( F N + T N ) ( F P + T N ) ] n 2 2 [ ( T P + F P ) ( T P + F N ) + ( F N + T N ) ( F P + T N ) ] ,
where n is the total number of possible combinations of pairs from the given data. TP (true positive) is a pair clustered in the same category when the labels are the same. TN (true negative) refers to a pair clustered in different categories when the labels are different. FP (false positive) and FN (false negative) indicate incorrect clustering. FP is a pair with the same label that is clustered in different categories, whereas FN is a pair with different labels that is clustered in the same category.
V-measure [65] is defined as the harmonic mean of homogeneity and completeness. Let Q, K be a set of classes categorized qualitatively by experts and a set of clusters, respectively. Then, the homogeneity score is defined as follows:
h o m o g e n e i t y = 1 i f H ( Q , K ) = 0 1 H ( Q K ) H ( Q ) o . w . ,
where H ( Q K ) and H ( Q ) are defined as in Equations (9) and (10), respectively.
H ( Q K ) = k = 1 K q = 1 Q b q k N log b q k q = 1 Q b q k ,
H ( Q ) = q = 1 Q k = 1 K b q k n log k = 1 K b q k n ,
where b q k is the number of logs in both categorized class q and cluster k, and N and n are the number of logs and the number of classes, respectively. The homogeneity score increases when each cluster contains only the same labels as are possible, as shown in Equation (8). The completeness score aims to include all given labels in one cluster and is calculated by Equation (11).
c o m p l e t e n e s s = 1 i f H ( K , Q ) = 0 1 H ( K Q ) H ( K ) o . w . ,
where H ( K Q ) and H ( K ) , respectively, are defined as in Equations (12) and (13), respectively.
H ( K Q ) = q = 1 Q k = 1 K b q k N log b q k k = 1 K b q k
H ( K ) = k = 1 K q = 1 Q b q k n log q = 1 Q b q k n .
In Equation (14), the parameter β is used to adjust the weights of homogeneity h and completeness c.
V β = ( 1 + β ) h c ( β h ) + c
The failure patterns derived from pattern mining were evaluated using two values: Support and confidence. The two values are calculated from the antecedents and consequents, which are the environment and failure categories, respectively. The higher the two values, the more frequently the pattern occurs, with the patterns with the highest values judged as the most significant. Therefore, we evaluated the quality of the failure patterns by identifying and comparing the distributions and maximum values of confidence and support.

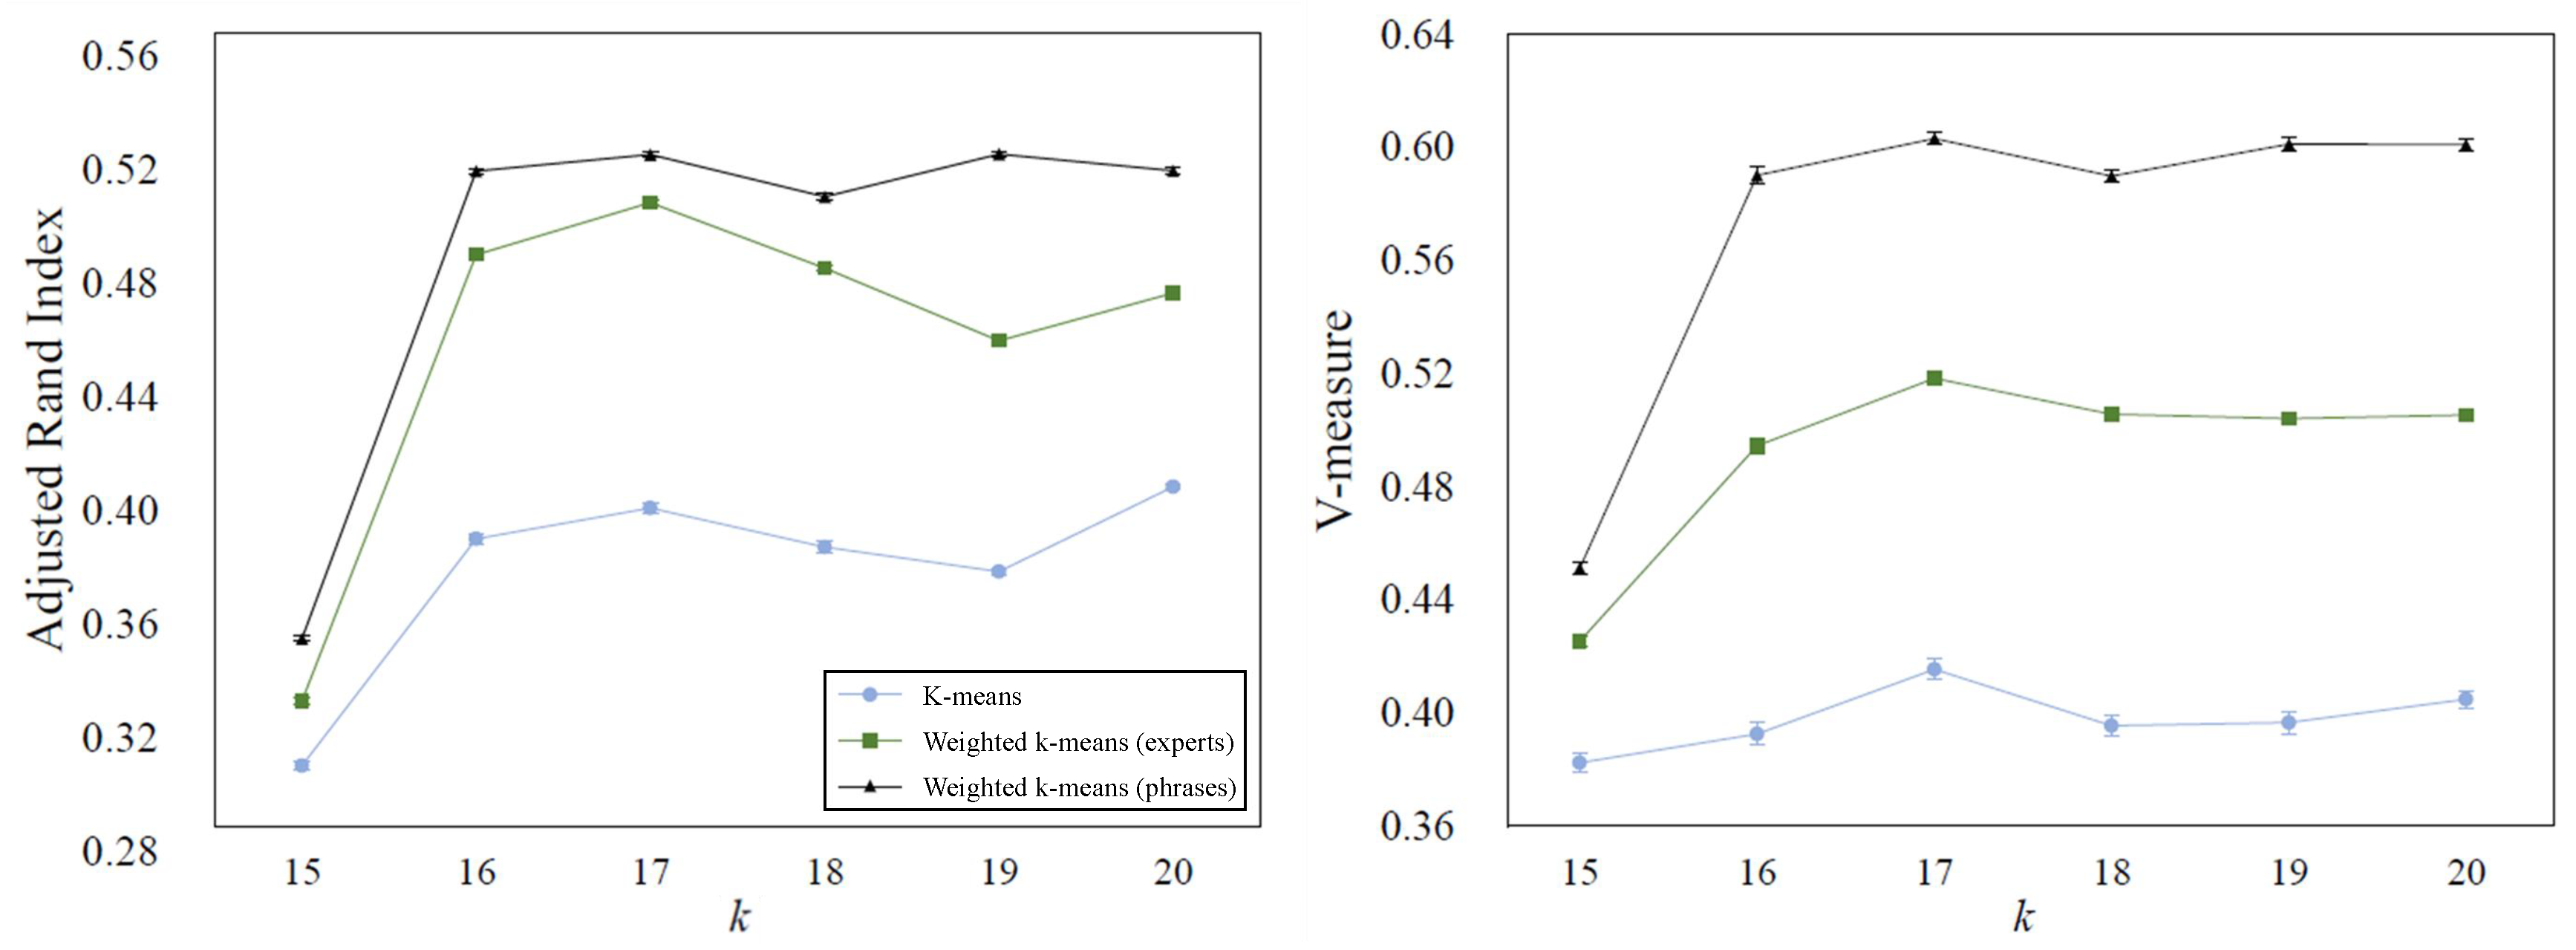
4.2. Experiment Results

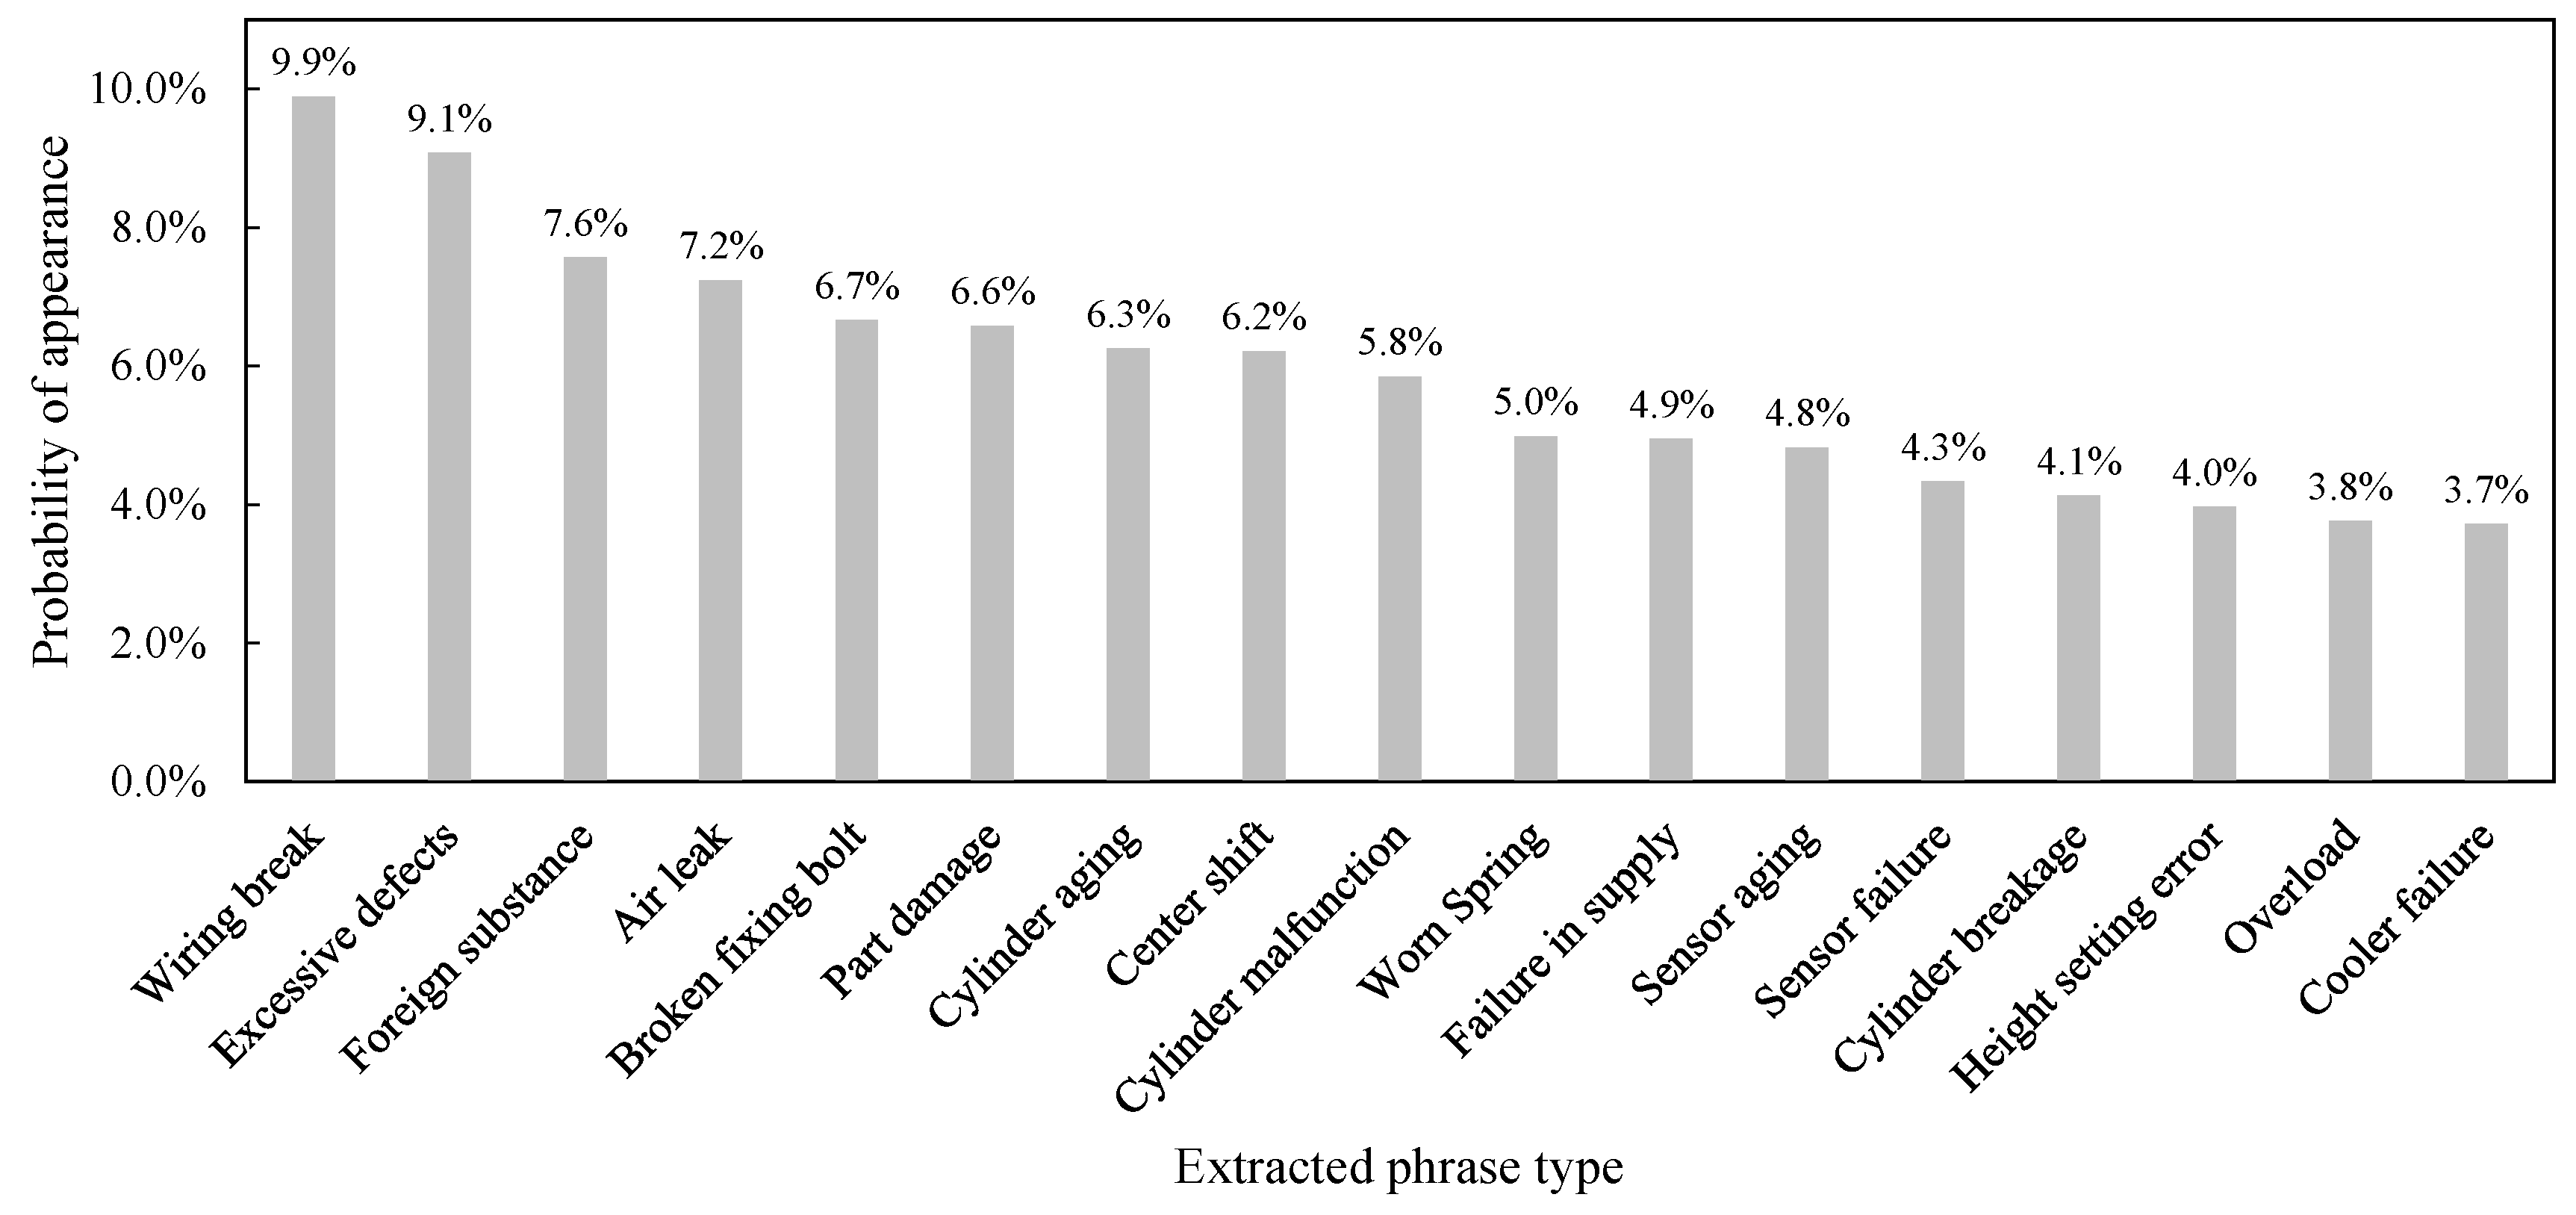
4.2.1. Phrase Extraction Results

In the phrase extraction step, significant phrases were extracted from RFFL comments using a word-usage dictionary. The dictionary was constructed by dividing phrases, which are the smallest units with meaning contained in the comment, by their word usage. In addition, technical jargon for the apparatus, included in the reference data or obtained by crawling, was added to the dictionary. The phrases were extracted by matching the words in the comment by defined word usages using the dictionary.
Table 7 shows examples of phrases extracted from RFFLs. Since multiple phrases were extracted from a single row of the comment factor, total 2446 phrases were extracted from 1394 RFFLs. The frequency of appearance (as a percentage of the total) by clustering 2446 phrases into 17 representative types is shown in Figure 4. It is confirmed that phrases related to wiring break were extracted the most.

4.2.2. Failure Categorization Results

The results of the performance measurement are depicted in Figure 5. As mentioned above, V-measure and rand index were used to compare k-means clustering (black line in Figure 5), weighted k-means clustering with the weights given by experts (green line in Figure 5), and weighted k-means clustering with the weights emphasizing phrases (light blue line in Figure 5). The average, minimum value, and maximum value after repeating the calculation 15 times are displayed together on each data point. Weighted k-means clustering using the weights emphasizing phrases generated better results than the other methods. In particular, the result shows the best performance when k is 17. The rand index result tends to increase as k increases, and the range of weighted k-means focused on extracted phrases is smaller than that of others. A similar trend is found in the V-measure results.

4.2.3. Data Extension Results

EFFLs, which consist of antecedents and a consequent, are generated by matching three data elements: FFLs, failure categories, and environmental data. The input data for pattern derivation and the factors are shown in Table 8. There are 21 factors in total, with 20 antecedents and one consequent. Morning or afternoon or night indicates the time period when the breakdown occurred. Lunch time or not, dinner time or not, and midnight mealtime or not indicate whether the facility fails in a mealtime as defined at the site. Average temperature is the site temperature at the time of failure. The cumulative failure number of the facility is the cumulative number of times the facility failed, and the cumulative failure number of the operator is the cumulative number of times any facility failed while being controlled by the operator. The degree of facility aging is the time from when the facility was installed at the site to when it failed.

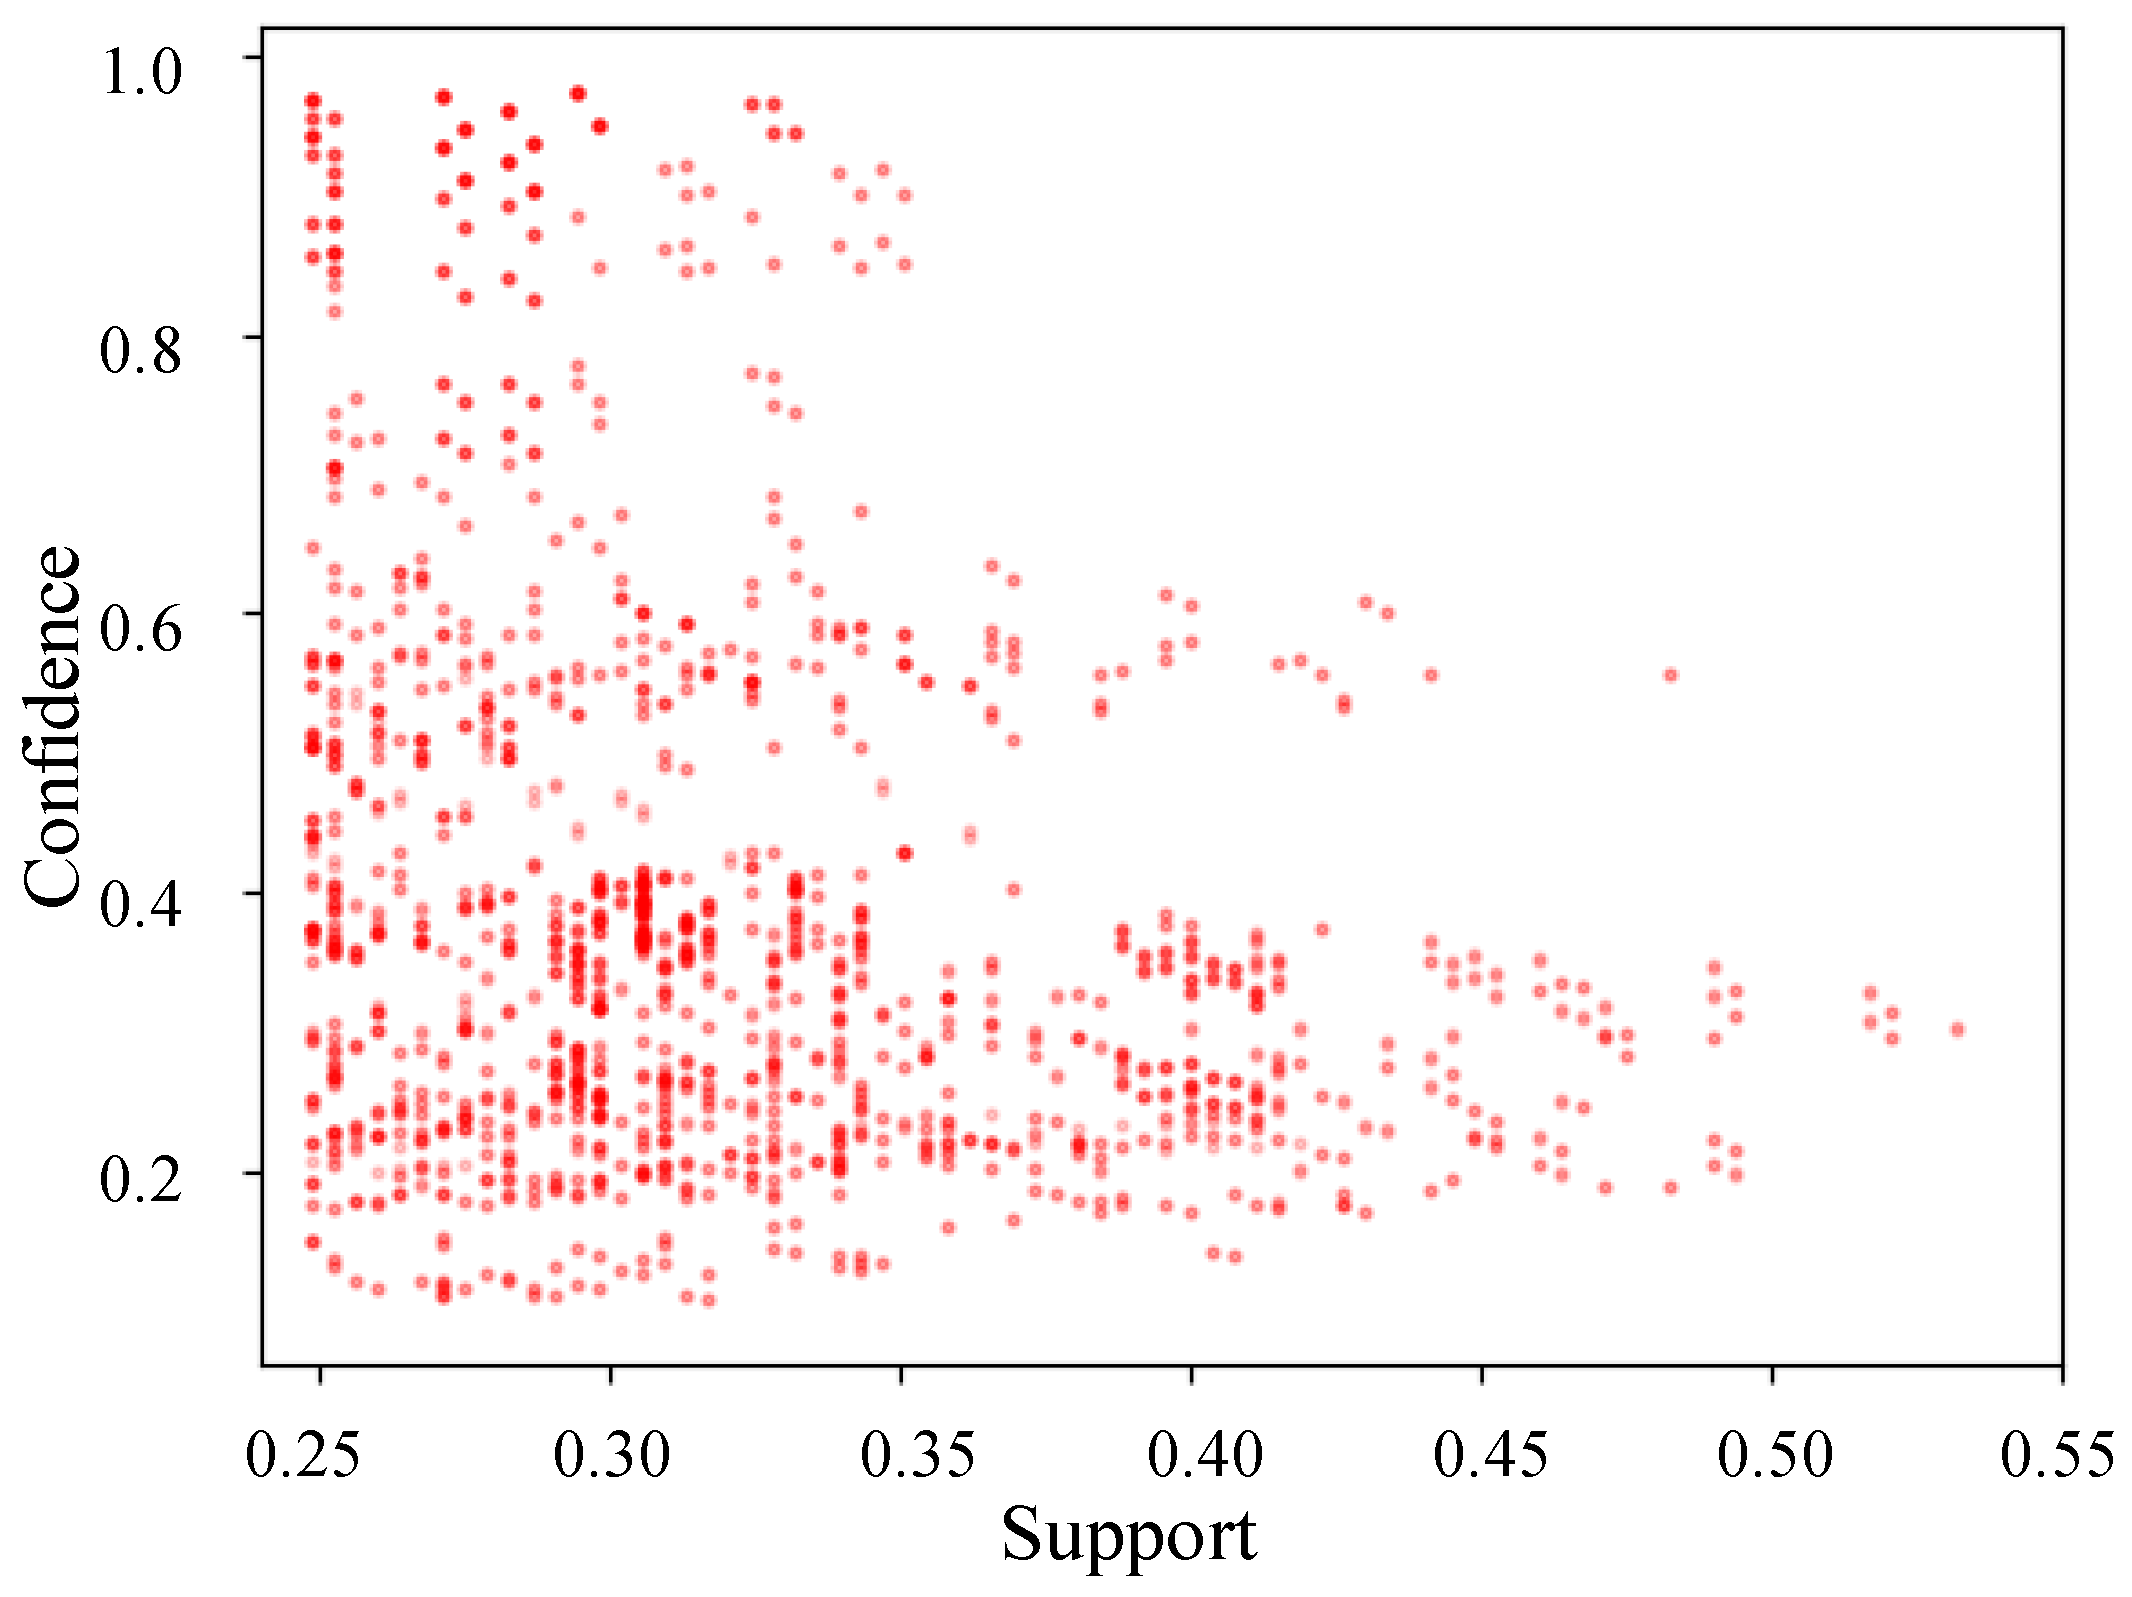
4.2.4. Pattern Mining Results

Failure patterns were obtained by applying FP-growth to EFFLs. Table 9 shows examples of failure patterns that have high confidence values. The pattern in the first row of the table can be described as follows. When the antecedents are “OZ Machine 1”, “Person of action 1”, “Air equipment”, “Not shift time”, “Not lunch time”, “Not dinner time”, and “Not midnight meal time”, the failure category “aging” accounted for 29% of the total patterns. The confidence value is 97%, indicating that the failure category “aging” accounts for over 90% of the overall patterns that satisfy the antecedents.
The maximum confidence and support values among the derived patterns are 100% and 53%, respectively. A total of 2653 patterns were derived, and the failure categories derived in these patterns accounted for 11 out of the 17 possible failure categories.
Figure 6 is a scatter plot demonstrating the support and confidence values for each pattern. The x-axis shows the support, the y-axis shows the confidence, and one point corresponds to one pattern. The more patterns with the same support and confidence values, the darker the color of the point. The scatter plot shows that the confidence values are distributed over a large area for the same support value. In particular, it can be seen that clear failure patterns are detected through the dark points that exist in the area of more than 80% confidence.
We also classified 17 possible failure categories from a 124-dimensional one-hot vector representing antecedents using an ANN, implemented with scikit-learn [66] package of Python. The ANN, composed of one 100-dimensional hidden layer and rectified linear units (ReLU) activation function, was trained using Adam optimizer [67] with β 1 = 0.9 , β 2 = 0.999 , and ϵ = 10 8 . L2 regularization with weight decay of 10 4 was also used to prevent overfitting. All 2653 data were randomly split into training set and test set at a ratio of 8 to 2, and the ANN model was trained for 30 epochs through cross entropy loss. As a result of measuring the classification accuracy for the test set after model training with the training set, accuracy of 85.2% was obtained.

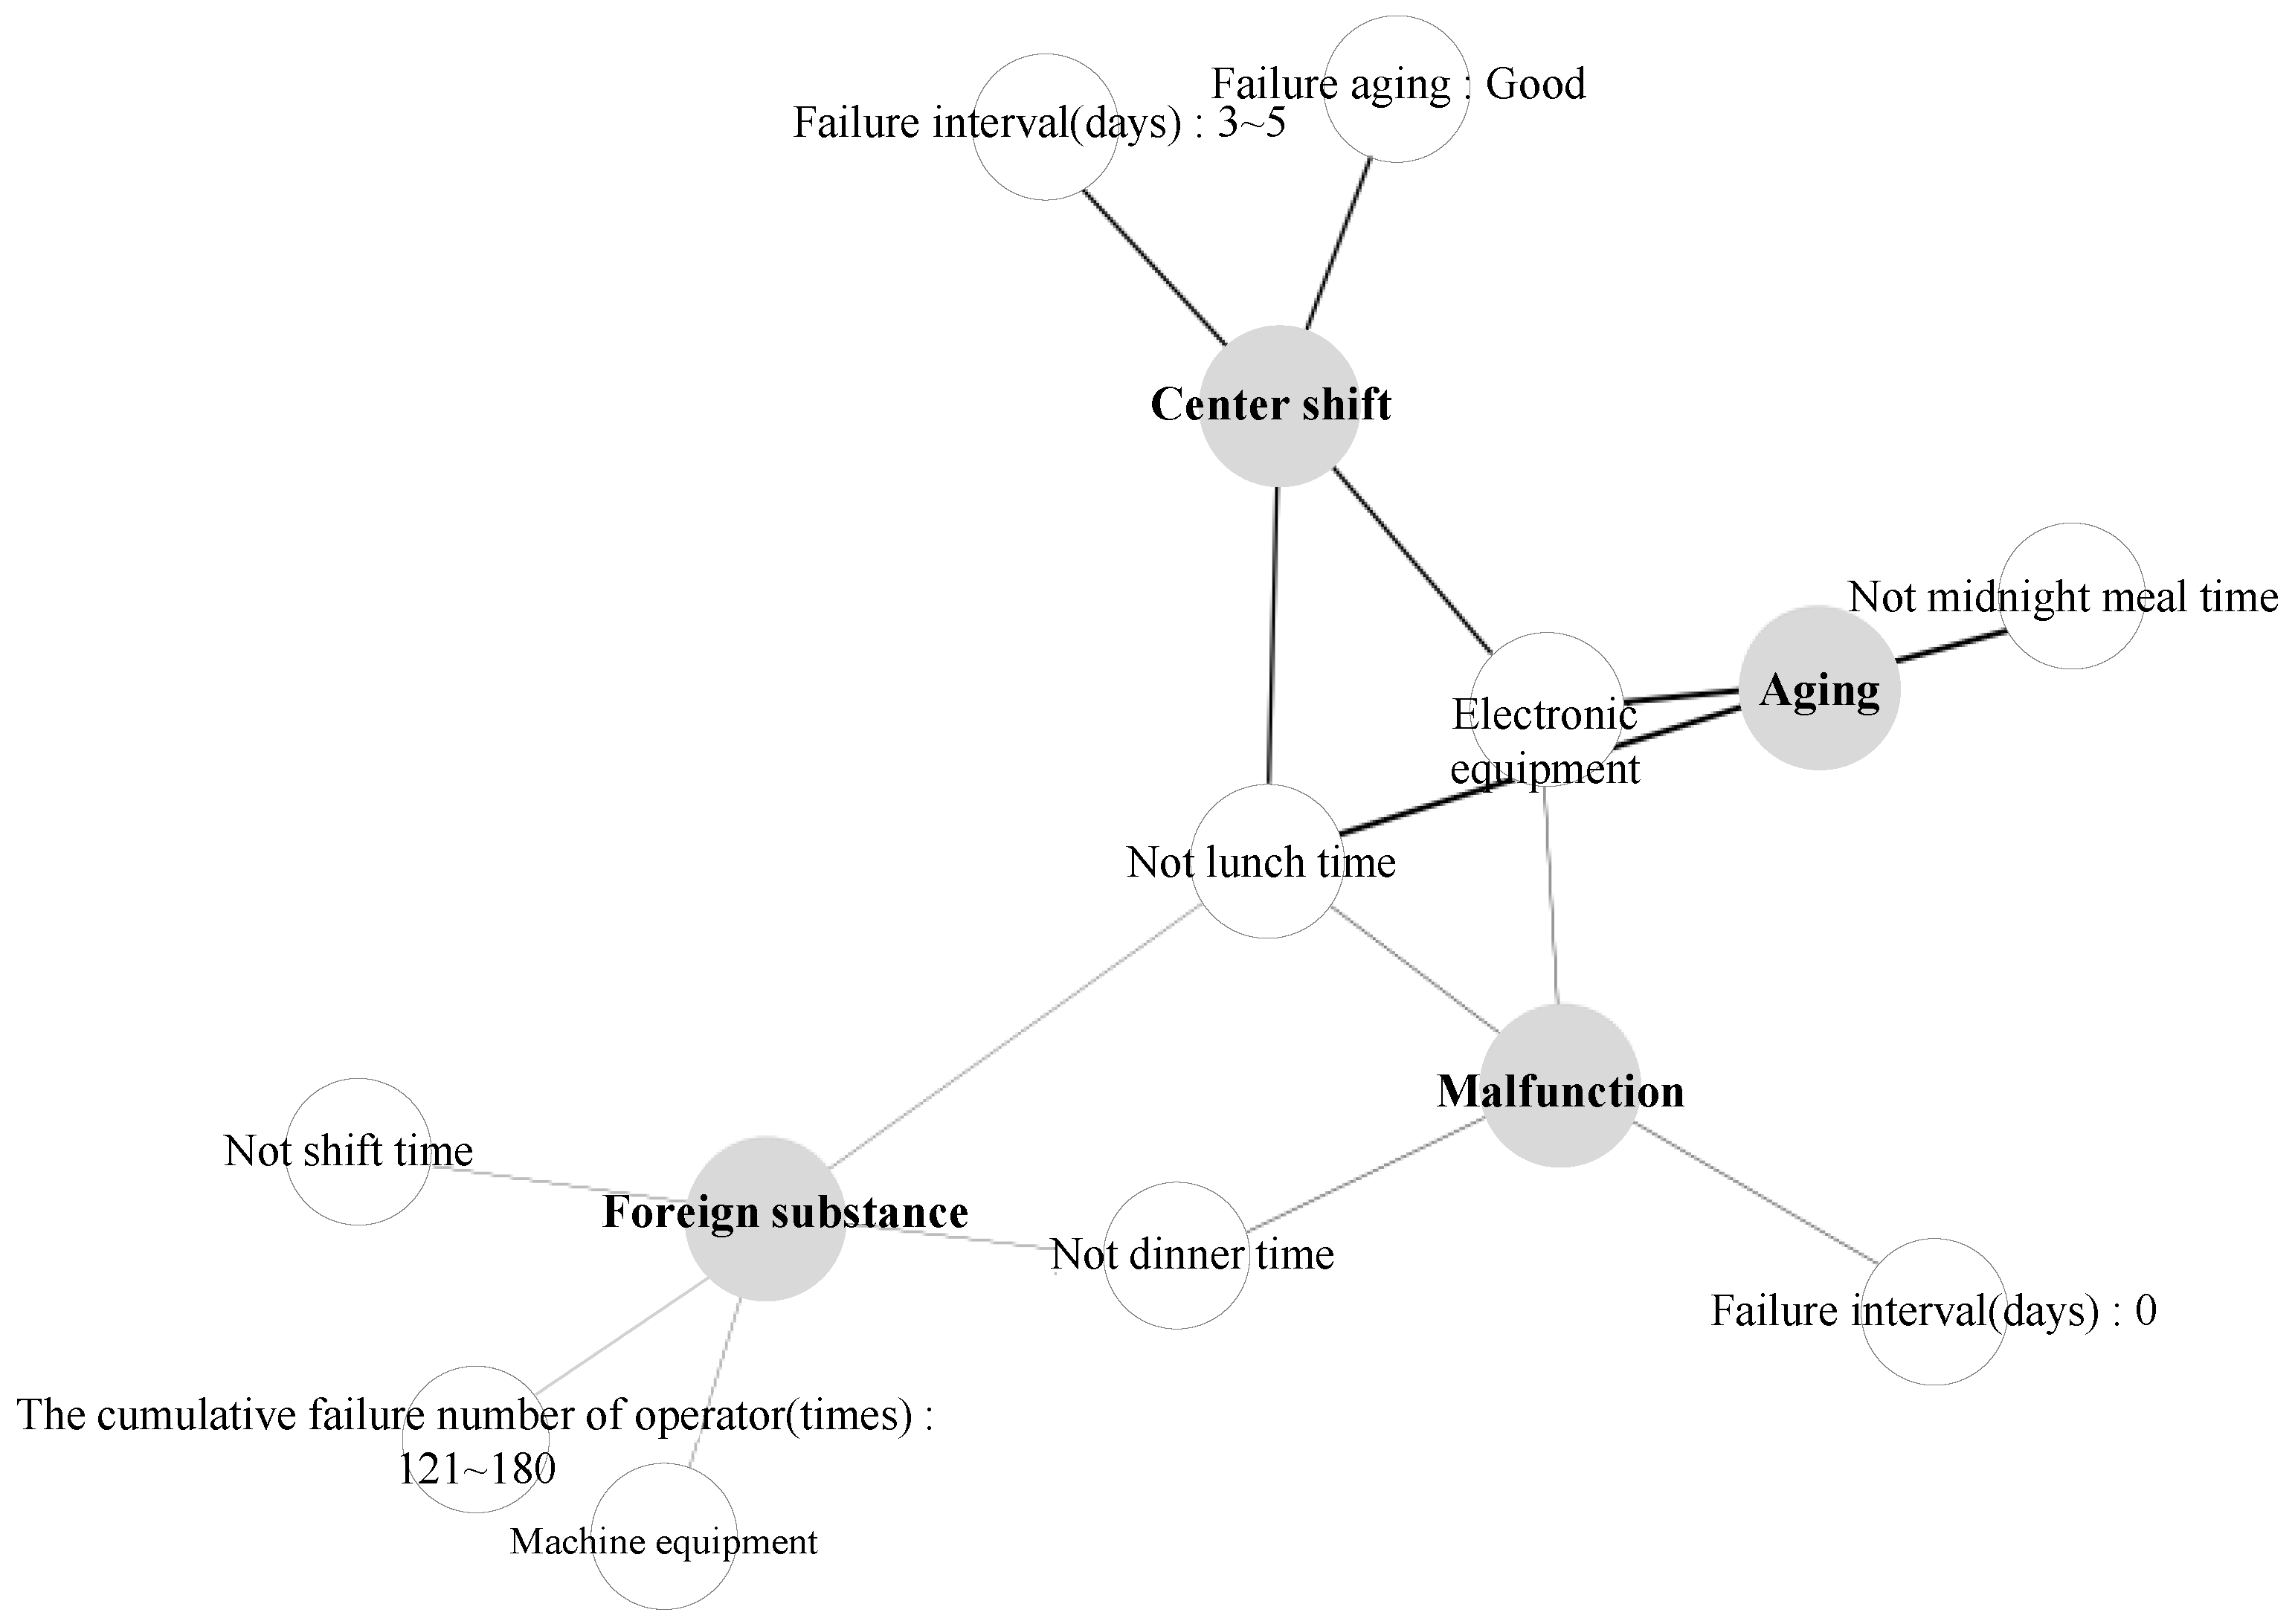
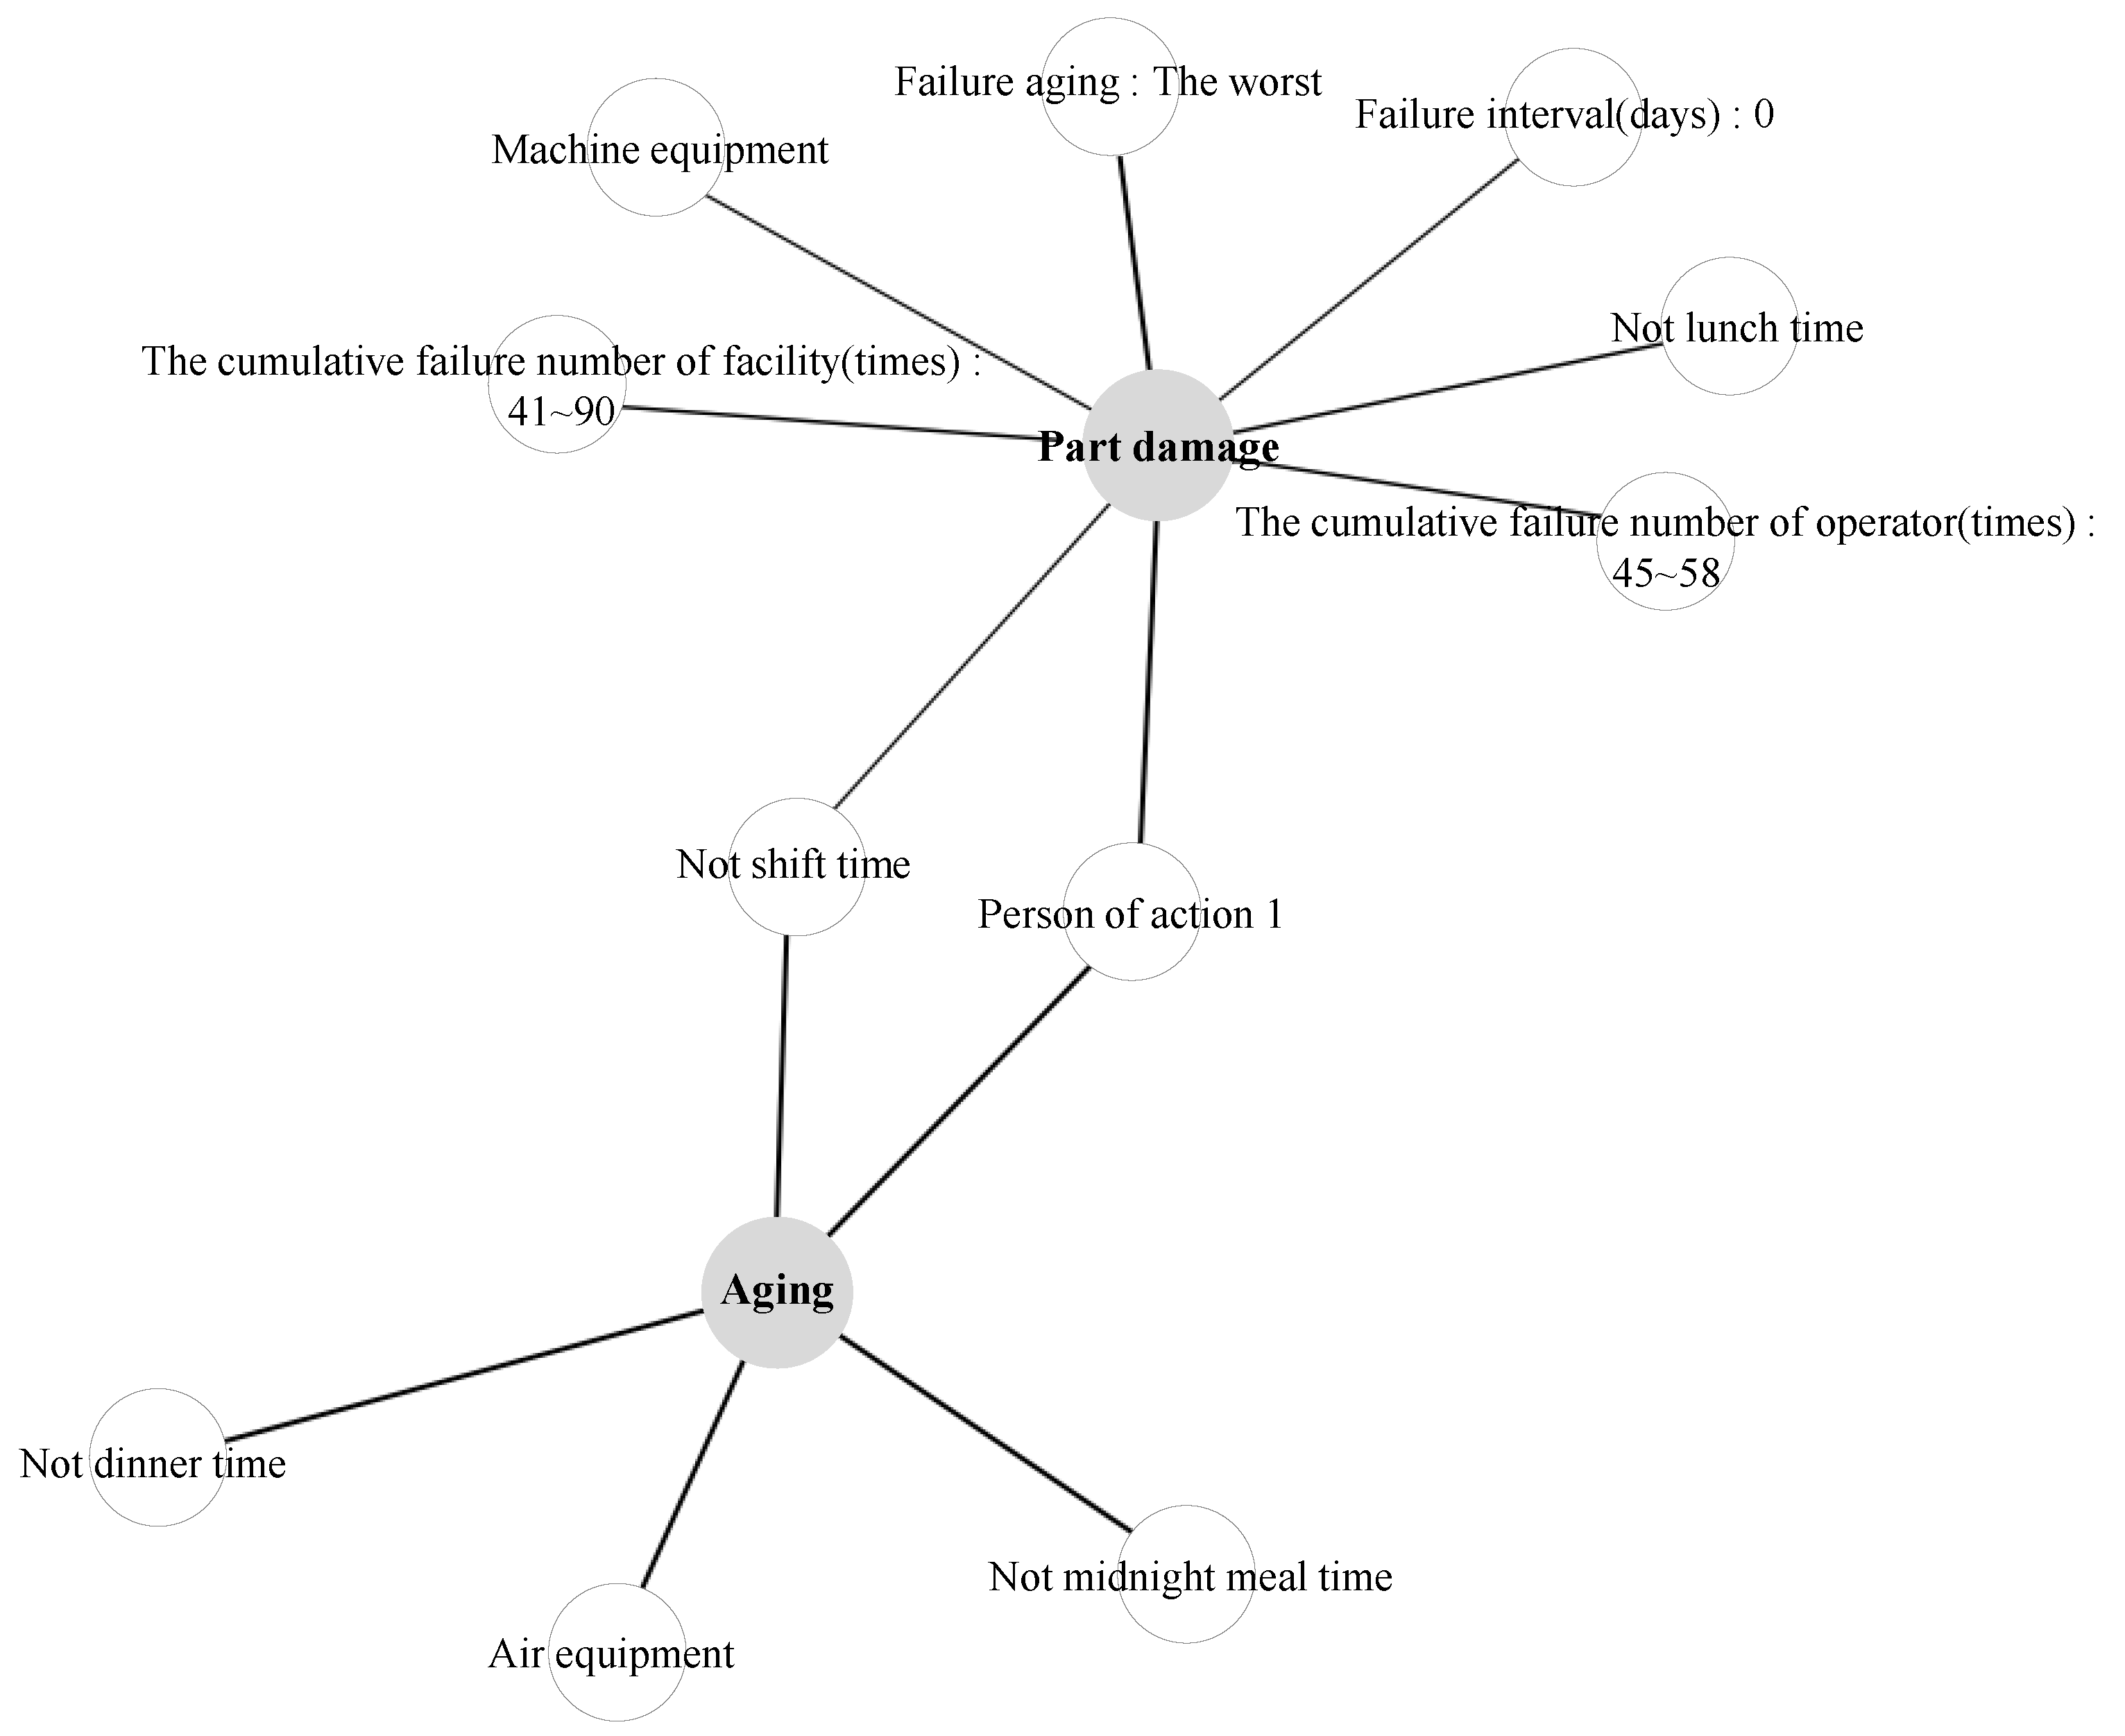
5. Real-World Facility Failure Scenario

The proposed framework can be applied to real-world scenarios at actual manufacturing sites. For real-world applications, we compared the pre-failure alert lists of two operators controlling the same facility. Let Operators 1 and 2 have different job proficiencies—high expertise and low expertise, respectively. The examples are shown in Table 10, the pre-failure alert list for Operator 1, and Table 11, the pre-failure alert list for Operator 2. The scenario shows the failure types in Operator 1’s list are more diverse than those in Operator 2’s. Assuming the preceding rule is the same, the difference in failure types implies that the confidence values are low, so the list for Operator 1 shows more types than that for Operator 2.
The pre-failure alert lists for the two operators included in this scenario are visualized in Figure 7, which shows the pre-failure alert list patterns for Operator 1, and Figure 8, which shows the same for Operator 2. White nodes denote the antecedents, and gray denotes the consequent. The edges indicate the confidence value for the pattern with the antecedents and the consequent, where the higher the value, the thicker the edge. The visualization confirms that Operator 1’s list has low confidence values with more breakdown types than Operator 2’s.

6. Conclusions

In this paper, we proposed a real-world facility failure prevention framework based on failure logs to prevent facility failures that directly affect the production rate at manufacturing sites. Specifically, operators are alerted with pre-failure alert lists at every shift time, reflecting that many manufacturing sites have multiple shifts and the work environment changes frequently. The failure logs containing text data were categorized and mapped to environmental data to build a failure pattern database to generate the list. When the real-time logs are searched in the failure pattern database via the alert system, a pre-failure alert list corresponding to the real-time logs can be provided.
To determine the failure phenomena and causes from the text data input directly by the operator, phrases were extracted to determine the meaning. In the failure categorization step for pattern mining, the weight of each factor in the failure logs was assigned to give more weight to phrases that indicate the breakdown phenomenon or cause. The data have been extended to vary the number of pattern cases by mapping to various environmental information. When the list was extracted for two operators with different proficiencies given the environmental information, we found that high-confidence-value breakdown types were extracted for less skilled operators.
Even when a pre-failure alert list has been given, breakdowns can occur for a variety of reasons. Therefore, our future work will be building a system that provides repair methods for the corresponding breakdowns so that, even if a malfunction occurs, it can be managed successfully.

Author Contributions

All authors have contributed in writing and editing this article. Writing—Original Draft Preparation, J.P. and E.C.; Funding Acquisition, Y.C.; Supervision, Y.C.; Writing—Review and Editing, J.P. and Y.C. All authors have read and agreed to the published version of the manuscript.

Funding

This work has supported by the National Research Foundation of Korea(NRF) grant funded by the Korea government(MSIT) (No. 2020R1C1C1009848) and by a research grant from Seoul Women’s University (2020-0455).

Institutional Review Board Statement

Not applicable.

Informed Consent Statement

Not applicable.

Data Availability Statement

Not applicable.

Conflicts of Interest

The authors declare no conflict of interest.

References

  1. Lee, S.; Rho, S.H.; Lee, S.; Lee, J.; Lee, S.W.; Lim, D.; Jeong, W. Implementation of an Automated Manufacturing Process for Smart Clothing: The Case Study of a Smart Sports Bra. Processes 2021, 9, 289. [Google Scholar] [CrossRef]
  2. Lu, Y.W.; Hsu, C.Y.; Huang, K.C. An Autoencoder Gated Recurrent Unit for Remaining Useful Life Prediction. Processes 2020, 8, 1155. [Google Scholar] [CrossRef]
  3. Moyne, J.; Iskandar, J. Big Data Analytics for Smart Manufacturing: Case Studies in Semiconductor Manufacturing. Processes 2017, 5, 39. [Google Scholar] [CrossRef] [Green Version]
  4. O’Donovan, P.; Bruton, K.; O’Sullivan, D.T.J. Case study: The implementation of a data-driven industrial analytics methodology and platform for smart manufacturing. Int. J. Progn. Health Manag. 2016, 7, 1–22. [Google Scholar]
  5. Wang, J.; Ma, Y.; Zhang, L.; Gao, R.X.; Wu, D. Deep learning for smart manufacturing: Methods and applications. J. Manuf. Syst. 2018, 48, 144–156. [Google Scholar] [CrossRef]
  6. Ding, K.; Chan, F.; Zhang, X.; Zhou, G.; Zhang, F. Defining a digital twin-based cyber-physical production system for autonomous manufacturing in smart shop floors. Int. J. Prod. Res. 2019, 57, 1–20. [Google Scholar] [CrossRef] [Green Version]
  7. Machado, C.G.; Winroth, M.P.; Silva, E.H. Sustainable manufacturing in Industry 4.0: An emerging research agenda. Int. J. Prod. Res. 2019, 58, 1–23. [Google Scholar] [CrossRef]
  8. Tao, F.; Qi, Q.; Liu, A.; Kusiak, A. Data-driven smart manufacturing. J. Adv. Manuf. Syst. 2018, 48, 157–169. [Google Scholar] [CrossRef]
  9. Salierno, G.; Cabri, G.; Leonardi, L. Different perspectives of a factory of the future: An overview. Adv. Res. Syst. Eng. Workshops 2019, 349, 107–119. [Google Scholar]
  10. Julsereewong, A.; Thepmanee, T. Safety instrumented system design in consideration of cost-benefit analysis: A case study of tail gas treating process. In Proceedings of the 17th International Conference on Control, Automation and Systems (ICCAS), Jeju, Korea, 18–21 October 2017; pp. 637–642. [Google Scholar]
  11. Muller, G.; Andersen, J.H. Factory production line as SoS; a case study in airplane engine component manufacturing. In Proceedings of the 10th System of Systems Engineering Conference (SoSE), Antonio, TX, USA, 17–20 May 2015; pp. 42–46. [Google Scholar]
  12. Li, Z.; Li, J.; Wang, Y.; Wang, K. A deep learning approach for anomaly detection based on SAE and LSTM in mechanical equipment. Int. J. Adv. Manuf. Technol. 2019, 103, 499–510. [Google Scholar] [CrossRef]
  13. Li, G.; Wang, X.; Yang, A.; Rong, M.; Yang, K. Failure prognosis of high voltage circuit breakers with temporal latent Dirichlet allocation. Energies 2017, 10, 1913. [Google Scholar] [CrossRef] [Green Version]
  14. Ai, P.; Yue, Z.X. A framework for processing water resources big data and application. Appl. Mech. Mater. 2014, 519, 3–8. [Google Scholar] [CrossRef]
  15. Ma, J.; Ni, S.; Xie, W.; Dong, W. Deep auto-encoder observer multiple-model fast aircraft actuator fault diagnosis algorithm. Int. J. Control Autom. Syst. 2017, 15, 1641–1650. [Google Scholar] [CrossRef]
  16. Liu, G.; Bao, H.; Han, B. A stacked autoencoder-based deep neural network for achieving Gearbox fault diagnosis. Math. Probl. Eng. 2018, 2018. [Google Scholar] [CrossRef] [Green Version]
  17. Yang, C.; Su, X.; Yuan, H.; Liu, Y.; Zhang, W.; Wang, X. Automatic diagnosis technology of lightning fault in transmission line. In Proceedings of the 2nd International Conference on Electrical, Control and Automation Engineering (ECAE 2017), Xiamen, China, 24–25 December 2017. [Google Scholar]
  18. Bai, Z.; Sun, G.; Zang, H.; Zhang, M.; Shen, P.; Liu, Y.; Wei, Z. Identification technology of grid monitoring alarm event based on natural language processing and deep learning in China. Energies 2019, 12, 3258. [Google Scholar] [CrossRef] [Green Version]
  19. Woojin. Woojin Ltd. Available online: http://www.ngkntk.co.kr/ (accessed on 24 March 2021).
  20. Jing, L.; Zhou, L.; Ng, M.K.; Huang, J.Z. Ontology-based distance measure for text clustering. In Proceedings of the SIAM SDM Workshop on Text Mining, Bethesda, MD, USA, 20–22 April 2006; pp. 1–8. [Google Scholar]
  21. Dhillon, I.S.; Mallela, S.; Kumar, R. A divisive information-theoretic feature clustering algorithm for text classification. J. Mach. Learn. Res. 2003, 3, 1265–1287. [Google Scholar]
  22. Martinc, M.; Škrlj, B.; Pollak, S. TNT-KID: Transformer-based neural tagger for keyword identification. arXiv 2020, arXiv:2003.09166. [Google Scholar]
  23. Wang, X.; Zhang, Y.; Wang, L.; Wang, J.; Lu, J. Maintenance grouping optimization with system multi-level information based on BN lifetime prediction model. J. Manuf. Syst. 2019, 50, 201–211. [Google Scholar] [CrossRef]
  24. Ragab, A.; Yacout, S.; Ouali, M.S.; Osman, H. Prognostics of multiple failure modes in rotating machinery using a pattern-based classifier and cumulative incidence functions. J. Intell. Manuf. 2019, 30, 255–274. [Google Scholar] [CrossRef]
  25. Guest, O.; Kanayet, F.J.; Love, B.C. Cognitive capacity limits and electoral districting. J. Comput. Soc. Sci. 2019, 2, 119–131. [Google Scholar] [CrossRef] [PubMed] [Green Version]
  26. Zhu, X.; Xiong, J.; Liang, Q. Fault diagnosis of rotation machinery based on support vector machine optimized by quantum genetic algorithm. IEEE Access 2018, 6, 33583–33588. [Google Scholar] [CrossRef]
  27. Ge, C.; Zhu, Y.; Di, Y.; Dong, Z. Equipment residual useful life prediction oriented parallel simulation framework. Theory Methodol. Tools Appl. Model. Simul. Complex Syst. 2016, 643, 377–386. [Google Scholar]
  28. Wang, H.; Cao, J.; Lin, D. Deep analysis of power equipment defect based on semantic framework text mining technology. CSEE J. Power Energy (Early Access) 2019, 1–8. [Google Scholar] [CrossRef]
  29. Adedigba, S.A.; Khan, F.; Yang, M. Dynamic failure analysis of process systems using neural networks. Process Saf. Environ. Prot. 2017, 111, 529–543. [Google Scholar] [CrossRef]
  30. Lindemann, B.; Fesenmayr, F.; Jazdi, N.; Weyrich, M. Anomaly detection in discrete manufacturing using self-learning approaches. Procedia CIRP 2019, 79, 313–318. [Google Scholar] [CrossRef]
  31. Zhang, J.; Wang, P.; Yan, R.; Gao, R.X. Long short-term memory for machine remaining life prediction. J. Manuf. Syst. 2018, 48, 78–86. [Google Scholar] [CrossRef]
  32. Oliveira, J.C.M.; Pontes, K.V.; Sartori, I.; Embiruçu, M. Fault detection and diagnosis in dynamic systems using weightless neural networks. Expert Syst. Appl. 2017, 84, 200–219. [Google Scholar] [CrossRef]
  33. Chelladurai, H.; Jain, V.; Vyas, N. Development of neural network model to predict flank wear and chipping failure. J. Adv. Manuf. Syst. 2019, 18, 237–254. [Google Scholar] [CrossRef]
  34. Jeong, S.P.; Sohn, J.W. Prediction of bolt fastening state using structural vibration signals. J. Mech. Sci. Technol. 2019, 33, 3963–3970. [Google Scholar] [CrossRef]
  35. Liu, R.; Kothuru, A.; Zhang, S. Calibration-based tool condition monitoring for repetitive machining operations. J. Manuf. Syst. 2020, 54, 285–293. [Google Scholar] [CrossRef]
  36. Li, C.; Zhang, W.; Peng, G.; Liu, S. Bearing fault diagnosis using fully-connected winner-take-all autoencoder. IEEE Access 2018, 6, 6103–6115. [Google Scholar] [CrossRef]
  37. Niu, Q. Discussion on fault diagnosis of and solution seeking for rolling bearing based on deep learning. Acad. J. Manuf. Eng. 2018, 16, 58–64. [Google Scholar]
  38. Qian, W.; Li, S.; Wang, J. A new transfer learning method and its application on rotating machine fault diagnosis under variant working conditions. IEEE Access 2018, 6, 69907–69917. [Google Scholar] [CrossRef]
  39. Shao, H.; Jiang, H.; Lin, Y.; Li, X. A novel method for intelligent fault diagnosis of rolling bearings using ensemble deep auto-encoders. Mech. Syst. Signal Process. 2018, 102, 278–297. [Google Scholar] [CrossRef]
  40. Wang, J.; Wang, K.; Wang, Y.; Huang, Z.; Xue, R. Deep Boltzmann machine based condition prediction for smart manufacturing. J. Ambient Intell. Human. Comput. 2019, 10, 851–861. [Google Scholar] [CrossRef]
  41. Ren, L.; Sun, Y.; Cui, J.; Zhang, L. Bearing remaining useful life prediction based on deep autoencoder and deep neural networks. J. Manuf. Syst. 2018, 48, 71–77. [Google Scholar] [CrossRef]
  42. Sun, C.; Ma, M.; Zhao, Z.; Chen, X. Sparse deep stacking network for fault diagnosis of motor. IEEE Trans. Ind. Informat. 2018, 14, 3261–3270. [Google Scholar] [CrossRef]
  43. Zhao, M.; Zhong, S.; Fu, X.; Tang, B.; Pecht, M. Deep residual shrinkage networks for fault diagnosis. IEEE Trans. Ind. Informat. 2020, 16, 4681–4690. [Google Scholar] [CrossRef]
  44. Peng, D.; Wang, H.; Liu, Z.; Zhang, W.; Zuo, M.J.; Chen, J. Multibranch and multiscale CNN for fault diagnosis of wheelset bearings under strong noise and variable load condition. IEEE Trans. Ind. Informat. 2020, 16, 4949–4960. [Google Scholar] [CrossRef]
  45. Hong, J.; Wang, Z.; Yao, Y. Fault prognosis of battery system based on accurate voltage abnormity prognosis using long short-term memory neural networks. Appl. Energy 2019, 251, 1–14. [Google Scholar] [CrossRef]
  46. Zhang, Z.; Li, B.; Zhang, W.; Lu, R.; Wada, S.; Zhang, Y. Real-time penetration state monitoring using convolutional neural network for laser welding of tailor rolled blanks. J. Manuf. Syst. 2020, 54, 348–360. [Google Scholar] [CrossRef]
  47. Zhao, H.; Sun, S.; Jin, B. Sequential fault diagnosis based on lstm neural networks. IEEE Access 2018, 6, 12929–12939. [Google Scholar] [CrossRef]
  48. Kumar, A.; Shankar, R.; Choudhary, A.; Thakur, L.S. A big data MapReduce framework for fault diagnosis in cloud-based manufacturing. Int. J. Prod. Res. 2016, 54, 7060–7073. [Google Scholar] [CrossRef] [Green Version]
  49. NAVER. NAVER Encyclopedia of Knowledge. Available online: https://terms.naver.com/ (accessed on 24 March 2021).
  50. Isa, D.; Lee, L.; Kallimani, V.; RajKumar, R. Text document preprocessing with the bayes formula for classification using the support vector machine. IEEE Trans. Knowl. Data Eng. 2008, 20, 1264–1272. [Google Scholar] [CrossRef]
  51. Mikolov, T.; Chen, K.; Corrado, G.; Dean, J. Efficient estimation of word representations in vector space. arXiv 2013, arXiv:1301.3781. [Google Scholar]
  52. Harris, D.; Harris, S. Digital Design and Computer Architecture; Morgan Kaufmann Publishers: Burlington, MA, USA, 2010. [Google Scholar]
  53. Mikolov, T.; Sutskever, I.; Chen, K.; Corrado, G.; Dean, J. Distributed representations of words and phrases and their compositionality. arXiv 2013, arXiv:1310.4546. [Google Scholar]
  54. Řehůřek, R.; Sojka, P. Software Framework for Topic Modelling with Large Corpora. In Proceedings of the LREC 2010 Workshop New Challenges for NLP Frameworks, Valletta, Malta, 22 May 2010; pp. 45–50. [Google Scholar]
  55. Google. Google News Dataset. Available online: https://code.google.com/archive/p/word2vec/ (accessed on 24 March 2021).
  56. De Hoon, M.J.; Imoto, S.; Nolan, J.; Miyano, S. Open source clustering software. Bioinformatics 2004, 20, 1453–1454. [Google Scholar] [CrossRef] [Green Version]
  57. Han, J.; Pei, J.; Yin, Y. Mining frequent patterns without candidate generation. ACM SIGMOD Rec. 2000, 29. [Google Scholar] [CrossRef]
  58. Fournier-Viger, P.; Lin, J.C.W.; Gomariz, A.; Gueniche, T.; Soltani, A.; Deng, Z.; Lam, H.T. The SPMF open-source data mining library version 2. In Proceedings of the Joint European Conference on Machine Learning and Knowledge Discovery in Databases; Springer: Berlin/Heidelberg, Germany, 2016; pp. 36–40. [Google Scholar]
  59. SPMF. SPMF Open-Source Software Specialized in Pattern Mining. Available online: https://www.philippe-fournier-viger.com/spmf/ (accessed on 24 March 2021).
  60. Rekabsaz, N.; Bierig, R.; Lupu, M.; Hanbury, A. Toward optimized multimodal concept indexing. In Proceedings of the 2015 International KEYSTONE Conference on Semantic Keyword-Based Search on Structured Data Sources, Coimbra, Portugal, 8–9 September 2015; pp. 141–152. [Google Scholar]
  61. Grubesic, T.H. On the application of fuzzy clustering for crime hot spot detection. J. Quant. Criminol. 2006, 22, 77–105. [Google Scholar] [CrossRef]
  62. MacQueen, J.B. Some methods for classification and analysis of multivariate observations. In Proceedings of the Fifth Berkeley Symposium on Mathematical Statistics and Probability; University of California Press: Berkeley, CA, USA, 1967; pp. 281–297. [Google Scholar]
  63. Hubert, L.; Arabie, P. Comparing partitions. J. Classif. 1985, 2, 193–218. [Google Scholar] [CrossRef]
  64. Rand, W. Objective criteria for the evaluation of clustering methods. J. Am. Stat. Assoc. 2012, 66, 846–850. [Google Scholar] [CrossRef]
  65. Rosenberg, A.; Hirschberg, J. V-Measure: A conditional entropy-based external cluster evaluation measure. In Proceedings of the 2007 Joint Conference on Empirical Methods in Natural Language Processing and Computational Natural Language Learning (EMNLP-CoNLL); Association for Computational Linguistics: Prague, Czech Republic, 2007; pp. 410–420. [Google Scholar]
  66. Pedregosa, F.; Varoquaux, G.; Gramfort, A.; Michel, V.; Thirion, B.; Grisel, O.; Blondel, M.; Prettenhofer, P.; Weiss, R.; Dubourg, V. Scikit-learn: Machine Learning in Python. J. Mach. Learn. Res. 2011, 12, 2825–2830. [Google Scholar]
  67. Kingma, D.P.; Ba, J. Adam: A method for stochastic optimization. arXiv 2014, arXiv:1412.6980. [Google Scholar]
Figure 1. Overview of the failure pattern database construction process.
Processes 09 00676 g001
Figure 2. Architecture of continuous skip-gram model.
Processes 09 00676 g002
Figure 3. Overview of the real-time process. The real-time logs and pre-failure alert list are examples generated in our problem setting.
Processes 09 00676 g003
Figure 4. Bar graph showing the frequency of appearance as a percentage of the total by clustering all 2446 phrases into 17 representative types.
Processes 09 00676 g004
Figure 5. Experiment results of the proposed and compared methods in failure categorization using rand index and V-measure according to diverse k.
Processes 09 00676 g005
Figure 6. Scatter plot of patterns according to confidence and support values, where the darkness of a point indicates the frequency of the pattern.
Processes 09 00676 g006
Figure 7. Visualization of a pre-failure list for Operator 1, where white and gray node respectively represent antecedent and consequent and thickness of edge represent the confidence value of patterns.
Processes 09 00676 g007
Figure 8. Visualization of a pre-failure list for Operator 2, where white and gray node respectively represent antecedent and consequent and thickness of edge represent the confidence value of patterns.
Processes 09 00676 g008
Table 1. Summary of previous studies on facility failure prevention according to types of data, whether failure category utilizes or not, approach, and method.
Data TypeData CategoryFailure CategoryApproachMethodReference
Sensor signal dataPressureNot usedFailure predictionArtificial neural networks (ANN)Adedigba et al., 2017 [29]
Failure diagnosisDeep auto-encoderMa et al., 2017 [15]
Long short-term memory (LSTM)Lindemann et al., 2019 [30]
Remaining useful life (RUL) predictionBi-directional LSTMZhang et al., 2018 [31]
TemperatureNot usedFailure diagnosisANNAdedigba et al., 2017 [29]
Weightless neural networksOliveira et al., 2017 [32]
RUL predictionBi-directional LSTMZhang et al., 2018 [31]
VibrationNot usedFailure predictionANNChelladurai et al., 2019 [33]
K-nearest neighborsJeong and Sohn, 2019 [34]
Similarity measuresLiu et al., 2020 [35]
Failure diagnosisAuto-encoderLi et al., 2018 [36]
Stacked auto-encoderLiu et al., 2018 [16]
Convolutional neural networks (CNN)Niu, 2018 [37]
High-order Kullback-LeiblerQian et al., 2018 [38]
Ensemble deep auto-encoderShao et al., 2018 [39]
Support vector machine (SVM)Zhu et al., 2018 [26]
Stacked auto-encoder and LSTMLi et al., 2019 [12]
Deep neural networks (DNN)Wang et al., 2019 [40]
RUL predictionAuto-encoder and DNNRen et al., 2018 [41]
ConsideredFailure diagnosisSparse deep stacking networksSun et al., 2018 [42]
Deep residual shrinkage networksZhao et al., 2020 [43]
Multibranch and multiscale CNNPeng et al., 2020 [44]
VoltageNot usedFailure diagnosisLSTMHong et al., 2019 [45]
Non-sensor signal dataImageNot usedFailure predictionCNNZhang et al., 2020 [46]
Failure diagnosisCNNNiu, 2018 [37]
RUL predictionDeep auto-encoder and DNNRen et al., 2018 [41]
TextNot usedRelevance analysisFP-growthWang et al., 2019 [28]
ConsideredFailure predictionSequence to sequence model and SVMLi et al., 2017 [13]
LSTMZhao et al., 2018 [47]
LSTM and CNNBai et al., 2019 [18]
Table 2. Summary of the deferred time process.
StepSub-StepApproach
Phrase extractionConstructing the word usage-based dictionaryDefining four word usages
Extending the word usage-based dictionary
with reference data
Collecting the reference data by crawling
the online dictionary and by interviewing experts
Phrase extraction using the word usage-based dictionary
to generate facility failure logs (FFLs)
Tagging words in text data using the dictionary
and extracting phrases using the tagged words
Failure categorizationFFLs vectorizationUsing phrase2vec for the extracted phrases
and generating one-hot vectors for the categorical data
Failure categorization with the vectorized FFLsUsing weighted k-means clustering
Data extensionGenerating extended facility failure logs (EFFLs)Mapping FFLs, failure categories,
and environment data
Failure pattern miningMining frequent failure patterns
and constructing failure pattern database
Deriving the frequent failure patterns
using FP-growth algorithm
Table 3. Examples of extracted phrases using the word usage-based dictionary.
DivisionExample 1Example 2
InputParts wear due to excessive rubbingOperation of the equipment has stopped due to
the introduction of white foreign matter into the product protector part
DictionaryWDParts wear,
Excessive rubbing
WDIntroduction of white foreign matter into the product protector part
ST-ST-
E-EOperation of the equipment has stopped
SEdue toSEdue to
OutputParts wearIntroduction of white foreign matter into the product protector part
Excessive rubbing
Table 4. Examples of raw facility failure logs (RFFLs) composed of facility, phenomenon, cause, location, part, and comment.
No.FacilityPhenomenonCauseLocationPartComment
1OZ
Applicator 3
Incorrect
operation
Unknown
cause
ElectricSensorShutdown due to battery discharge
2OZ
Checker 4
Unknown
phenomenon
Component
aging
MachineHeatersElema is broken since the heater is old
3OZ
Checker 3
Unknown
phenomenon
Foreign
substance
ElectricWiringMeasuring section wire disconnection. Result: Does not work
Table 5. Summary of RFFLs composed of categorical (excluding comment) and textual (comment) data.
FactorTypeThe Number of CategoriesCategory Examples
FacilityCategory25OZ Machine 1, OZ Checker 4, OZ Applicator 1, OZ Applicator 3, OZ Granulator 1
Phenomenon14Poor connection, Worn parts, Malfunction, Component damage, Unknown phenomenon
Cause17Overload, Foreign substance, Component aging, Process abnormality, Unknown cause
Location5Hydraulic equipment, Air equipment, Mechanical equipment, Electrical equipment, Quality abnormality
Part19Cylinder, Wiring, PLC, Sensor, Heator
CommentText--
Table 6. Weights of FFL factors indicating weight utilized for the weighted k-means clustering and compared methods.
FactorWeights
Given
Equally
Given
by Experts
Emphasizing
Phrases
Facility1.03.02.0
Phenomenon1.02.81.5
Cause1.02.51.5
Location1.02.02.0
Part1.01.52.0
Extracted phrases1.00.83.0
Table 7. Examples of extracted phrases from comment in RFFLs. Multiple phrases are extracted from a single comment.
CommentExtracted phrases
Cause: Cylinder sensor error
Symptom: Cylinder malfunction
Action: Replace sensor
Cylinder sensor failure
Cylinder malfunction
Symptom: Elema heater current not flowing
Cause: Breakdown of Paracon
Elema heater current not flowing
Breakdown of Paracon
Abnormal operation of old cylinder No. 7Abnormal operation
Old cylinder No. 7
Failure in supply cylinder of heat unitFailure in supply cylinder of heat unit
Straight line stopped due to compressor failureCompressor failure
Detection of a faulty heater due to breakage ElemaBreakage Elema
Replacement of heater due to Impurity No. 1 disconnectionImpurity No. 1 disconnection
Table 8. List of factors in EFFLs with 20 antecedents and one consequent.
RuleFactor
AntecedentFacility
Location
Person of action
Action time(minutes)
Operator
Operator proficiency
Shift time or not
Time
Morning or afternoon or night
Lunch time or not
Dinner time or not
Midnight mealtime or not
Day of the week
Season
Average temperature ( C)
The cumulative failure number of facility(times)
Failure interval(days)
The cumulative failure number of operator(times)
The number of monthly failures
Degree of facility aging
ConsequentFailure category
Table 9. Examples of the extracted failure patterns sorted by confidence value.
AntecedentsConsequentSupportConfidence
“OZ Machine 1”, “Person of action 1”, “Air equipment”,
“Not shift time”, “Not lunch time”, “Not dinner time”, “Not midnight mealtime”
Aging0.290.97
“OZ Machine 11”, “Machine equipment”, “Person of action 1”,
“Not shift time”, “Not lunch time”, “Facility aging: The worst”
Part damage0.250.76
“OZ Machine 4”, “Electronic equipment”, “Operator proficiency: B”,
“Not lunch time”, “Not dinner time”, “Failure interval: 0 (days)”
Cylinder breakage0.300.63
Table 10. Pre-failure list of Operator 1 with high expertise.
AntecedentsConsequentSupportConfidence
Failure location: Electronic equipment
Not lunch time
Not midnight mealtime
Aging0.230.37
Location: Electronic equipment
Not lunch time
Failure interval (days): 3∼5
Facility aging: Good
Center shift0.260.34
Location: Electronic equipment
Not lunch time
Not dinner time
Failure interval (days): 0
Malfunction0.290.19
Location: Machine equipment
Not shift time
Not lunch time
Not dinner time
The cumulative failure number of operator (times): 121∼180
Substance0.200.12
Table 11. Pre-failure list of Operator 2 with low expertise.
AntecedentsConsequentSupportConfidence
Failure location: Air equipment
Not shift time
Not dinner time
Not midnight mealtime
Person of action 1
Aging0.390.97
Location: Machine equipment
Not shift time
Not lunch time
Facility aging: Good
Part damage0.350.76
Location: Machine equipment
Not lunch time
The cumulative failure number of operator (times): 45∼58
The cumulative failure number of facility (times): 41∼90
Part damage0.350.70
Location: Machine equipment
Not shift time
Failure interval (days): 0
Part damage0.450.56
Publisher’s Note: MDPI stays neutral with regard to jurisdictional claims in published maps and institutional affiliations.

