Article

Performance of Single and Two-Stage Cross-Flow Ultrafiltration Membrane in Fractionation of Peptide from Microalgae Protein Hydrolysate (Nannochloropsis gaditana)

by
Nur Izzati Md Saleh
1,
Wan Azlina Wan Ab Karim Ghani
1,2,*,
Siti Mazlina Mustapa Kamal
3 and
Razif Harun
1
1
Sustainable Process Engineering Research Centre (SPERC), Department of Chemical and Environmental Engineering, Faculty of Engineering, Universiti Putra Malaysia, UPM Serdang 43400, Malaysia
2
Institute of Plantation Studies, Universiti Putra Malaysia, UPM Serdang 43400, Malaysia
3
Department of Process and Food Engineering, Faculty of Engineering, Universiti Putra Malaysia, UPM Serdang 43400, Malaysia
*
Author to whom correspondence should be addressed.
Processes 2021, 9(4), 610; https://doi.org/10.3390/pr9040610
Submission received: 12 February 2021 / Revised: 19 March 2021 / Accepted: 23 March 2021 / Published: 31 March 2021
(This article belongs to the Section Materials Processes)

Abstract

:
Cross-flow ultrafiltration (UF) membrane with two different configurations; single (10 kDa and 5 kDa) and two-stage (10/5 kDa) in fractionating microalgae protein hydrolysate (MPH) were studied to obtain a low molecular weight of peptide. The effect of flow rate, trans-membrane pressure (TMP), and pH in fractionating MPH were evaluated based on permeate flux and peptide transmission. The results showed that, for single UF membrane, optimum operating parameters were at a flow rate of 23 mL/min, TMP of 1.5 bar, and pH of 9, with permeate flux of 43.65 L/m2 h (10 kDa) and 55.42 L/m2 h (5 kDa) and peptide transmission of 58.20% (10 kDa) and 67.34% (5 kDa). Meanwhile, for two-stage (10/5 kDa) UF membrane, the best parameters were observed at a flow rate of 23 mL/min, TMP of 1.5 bar, and pH of 2, with permeate flux of 69.85 L/m2 h and peptide transmission of 79.13%. Fractionation of MPH with two-stage UF membrane was observed to be better at producing a low molecular weight of peptide compared to single UF membrane. In conclusion, it was possible to produce permeate flux with a high amount of low molecular weight of peptide by controlling the operating parameters with the suitable configuration membrane.

1. Introduction

Microalgae is a photosynthetic marine organism and is also known as an alternative feedstock, which does not compete for arable land or potable water [1,2,3]. Microalgae is rich in numerous chemical compounds such as proteins, carbohydrates, lipids, carotenoids, vitamins, and mineral salts, which may be used in various biological activities for health benefits [4,5,6]. Such compounds can present anti-oxidant, anti-fungal, anti-viral, anti-algal, anti-enzymatic, or antibiotic actions [7]. Peptide derived from algae’s protein has become a promising bioactive compound that offer a wide range of biological activities [8].
In the production of protein-peptide, enzymatic hydrolysis is beneficial in improving the functional properties of protein because the peptide usually has low molecular weight, high activities, structural stability, is easily absorbed, and is nontoxic [9,10]. However, microalgae protein hydrolysate (MPH) still contains peptides of various sizes (low and high molecular weight) in a large number of hydrolyzed protein fractions [11]. Some studies have shown that peptides of low molecular weight have more potent antioxidants than peptides of high molecular weight [11,12]. Thus, a better understanding of fractionation is needed to obtain a desired size of bioactive peptide. The chromatographic technique is a common method used to separate this complex matrix that contains many hydrolyzed protein fractions of similar size due to its high specific separation capacities. However, the high cost of this technology prohibits the production of peptide on a large scale. Therefore, conventional methods based on pressure-driven ultrafiltration (UF) membrane can be used to separate the bioactive peptides because the separation is only based in a physical mechanism and is very simple, cheap, and easy to operate [13,14]. According to Korhonen and Pihlanto [8], the UF membrane is routinely used to enrich bioactive peptides from protein hydrolysates, and the usage of low molecular weight cut–off membrane has been found useful for separating out small peptides from high molecular weight residues and the remaining enzymes. Operating UF membrane in cross-flow filtration possesses more advantages over dead-end filtration, such as its excellent ability to filter feed with a high concentration of filterable matter and the fact that it can be broadly utilized in the food, chemical, and biopharmaceutical industries [15,16]. Based on previous studies, separation of peptide using UF membrane has been widely studied for fish and milk hydrolysate, but a similar study on microalgae protein hydrolysate has yet to be found [17,18]. However, the main drawback of using UF membrane technology in the fractionation of peptide is membrane fouling, which could reduce permeate flux and peptide transmission. The fouling phenomena could be due to concentration polarization or membrane pore blocking. Many attempts have been made to exploit surface modification membrane to reduce the fouling and improve the performance of UF membrane [19,20,21]. Membrane fouling results in higher feed pressures, higher operational costs, higher demand for chemical cleaning, and shorter overall membrane life [19]. Therefore, it is important to select the right operating parameter, suitable membrane, and solution condition to reduce the membrane fouling and subsequently maximize the yield.
Another challenge that limits the use of membrane systems for protein and peptide fractionation is related to its poor selectivity, especially in proteins or peptides that are very similar in size. The distribution of the broad membrane pore size of most commercial membrane is one of the reasons for poor selectivity in protein fractionation [22]. Many reports have explored the efficacy of using membrane systems to separate proteins with a very close molecular size. Although such results explicitly illustrate the feasibility of using cross-flow filtration for protein separation, all data were collected from model systems consisting of an artificial mixture of two separated proteins. Experimental works involving complex multi-component feed flows seem to be more limited, and the average efficiency of these systems is much less remarkable [23]. Roslan et al. [22] added that the implementation of UF membrane to the separation of protein hydrolysate is indeed a complex process. Fractionation using a two-stage UF membrane system has been studied by several researchers and has been found to improve the permeate flux and selectivity of targeted bioactive compounds [23,24]. However, there is currently a lack of studies in the literature dealing with the separation of multi-components of microalgal biomass [25]. Thus, ultrafiltration with a two-stage UF membrane is introduced to improve the peptide selectivity from complex multi-component MPH.
To date, there is no study regarding the fractionation of peptide from MPH of Nannochloropsis gaditana (N. gaditana). Thus, the objective of this study is to investigate the effect of operating parameters such as flow rate, trans-membrane pressure (TMP), and pH at different membrane configurations: single (10 kDa and 5 kDa) and two-stage (10/5 kDa) UF membrane with overall targets of reducing membrane fouling and increasing peptide yields.

2. Materials and Methods

2.1. Chemicals and Reagents

All the chemicals and reagents used in this research were of analytical grade. 1,2-phthalic dicarboxaldehyde (OPA) (C8H6O2) was purchased from Acros Organics; sodium hydroxide (NaOH) was purchased from R&M Chemicals; and sodium tetraborate decahydrate (B4Na2O7.10H2O), sodium dodecyl sulphate (C12H25NaSO4), 2-mercaptoethanol (C2H6OS), serine (C3H7NO3), hydrochloric acid (HCl), sodium phosphate monobasic (NaH2PO4), and sodium phosphate dibasic (Na2HPO4) were purchased from Sigma–Aldrich. Microalgae N. gaditana sp biomass was purchased from Longevity Superfoods (Utah, USA). Alcalase enzyme from a strain of Bacillus licheniformis Subtilisin A with 2.4 activity units [AU]/kg protein was obtained from Novo Nordisk (Denmark) and stored in a chiller at 5 °C until further used.

2.2. Preparation of Microalgae Protein Hydrolysate

MPH was prepared through hydrolysis using alcalase enzyme with a concentration of 0.3 g/L substrate with 5 g/L concentration in 100 mL of 50 mM phosphate buffer solution at pH 8. The mixture was incubated at 50 °C with a shaking speed of 80 rpm for 24 h. After that, the enzymatic hydrolysis process was stopped by heating the mixture in a water bath at 95 °C for 10 min. The mixture was allowed to cool before centrifugation at 4000× g (centrifuge model KUBOTA) for 20 min, followed by filtration. Filtration with filter paper Whattman No.1 was performed to remove the microalgae residue [26], and the supernatant MPH was collected for the fractionation process.

2.3. Preparation of Microalgae Protein Hydrolysate

MPH fractionation was performed using an ultrafiltration membrane (QuixStand-Benchtop system, GE Healthcare Bioscience, Piscataway, NJ, USA) equipped with a peristaltic pump (Watson–Marlow). The Quix-Stand benchtop system used a GE healthcare hollow fiber cross-flow membrane filtration cartridge. The system was capable of processing solutions quickly and efficiently. The system consisted of inlet and outlet pressure gauges, lower and upper manifolds, a support rod, and a 400 mL feed reservoir. The reservoir keeps the process solution, feeds the solution to the recirculation pump, and collects the retentate stream. The feed reservoir was connected to the sanitary connector located on the lower manifold, and the system includes a reservoir cap, gasket, and clamp. The cap has two barbed inlet ports that enable the tube to connect with the cap. The caps of the two ports allowed recirculation of the retentate stream back to the reservoir. They allowed additional feed solution or diafiltrate to be introduced into the reservoir during processing. Membranes with a molecular weight cut-off (MWCO) of 4–8 kDa are suitable for the fractionation of bioactive peptides with the desired molecular weights [27]. Therefore, by taking into account the availability of membrane cartridges from the supplier, two different sizes of hollow fiber membrane cartridge were used with molecular weight cut-offs (MWCO) of 5 and 10 kDa (Xampler Cartridge, GE Healthcare Bio-Science, Westborough, MA, USA) with polyethersulfone (PES) materials and surface area of 140 cm2. Both of the UF membrane cartridges were operated in a vertical position for better drainage and higher recovery. A schematic diagram of the UF membrane is shown in Figure 1.

2.4. Membrane Sanitization

Prior to the filtration process, the UF membrane cartridge was sanitized to remove any impurities that could affect the process. The membrane was cleaned and rinsed using 0.5 N sodium hydroxide for 30 min in a sonicator.

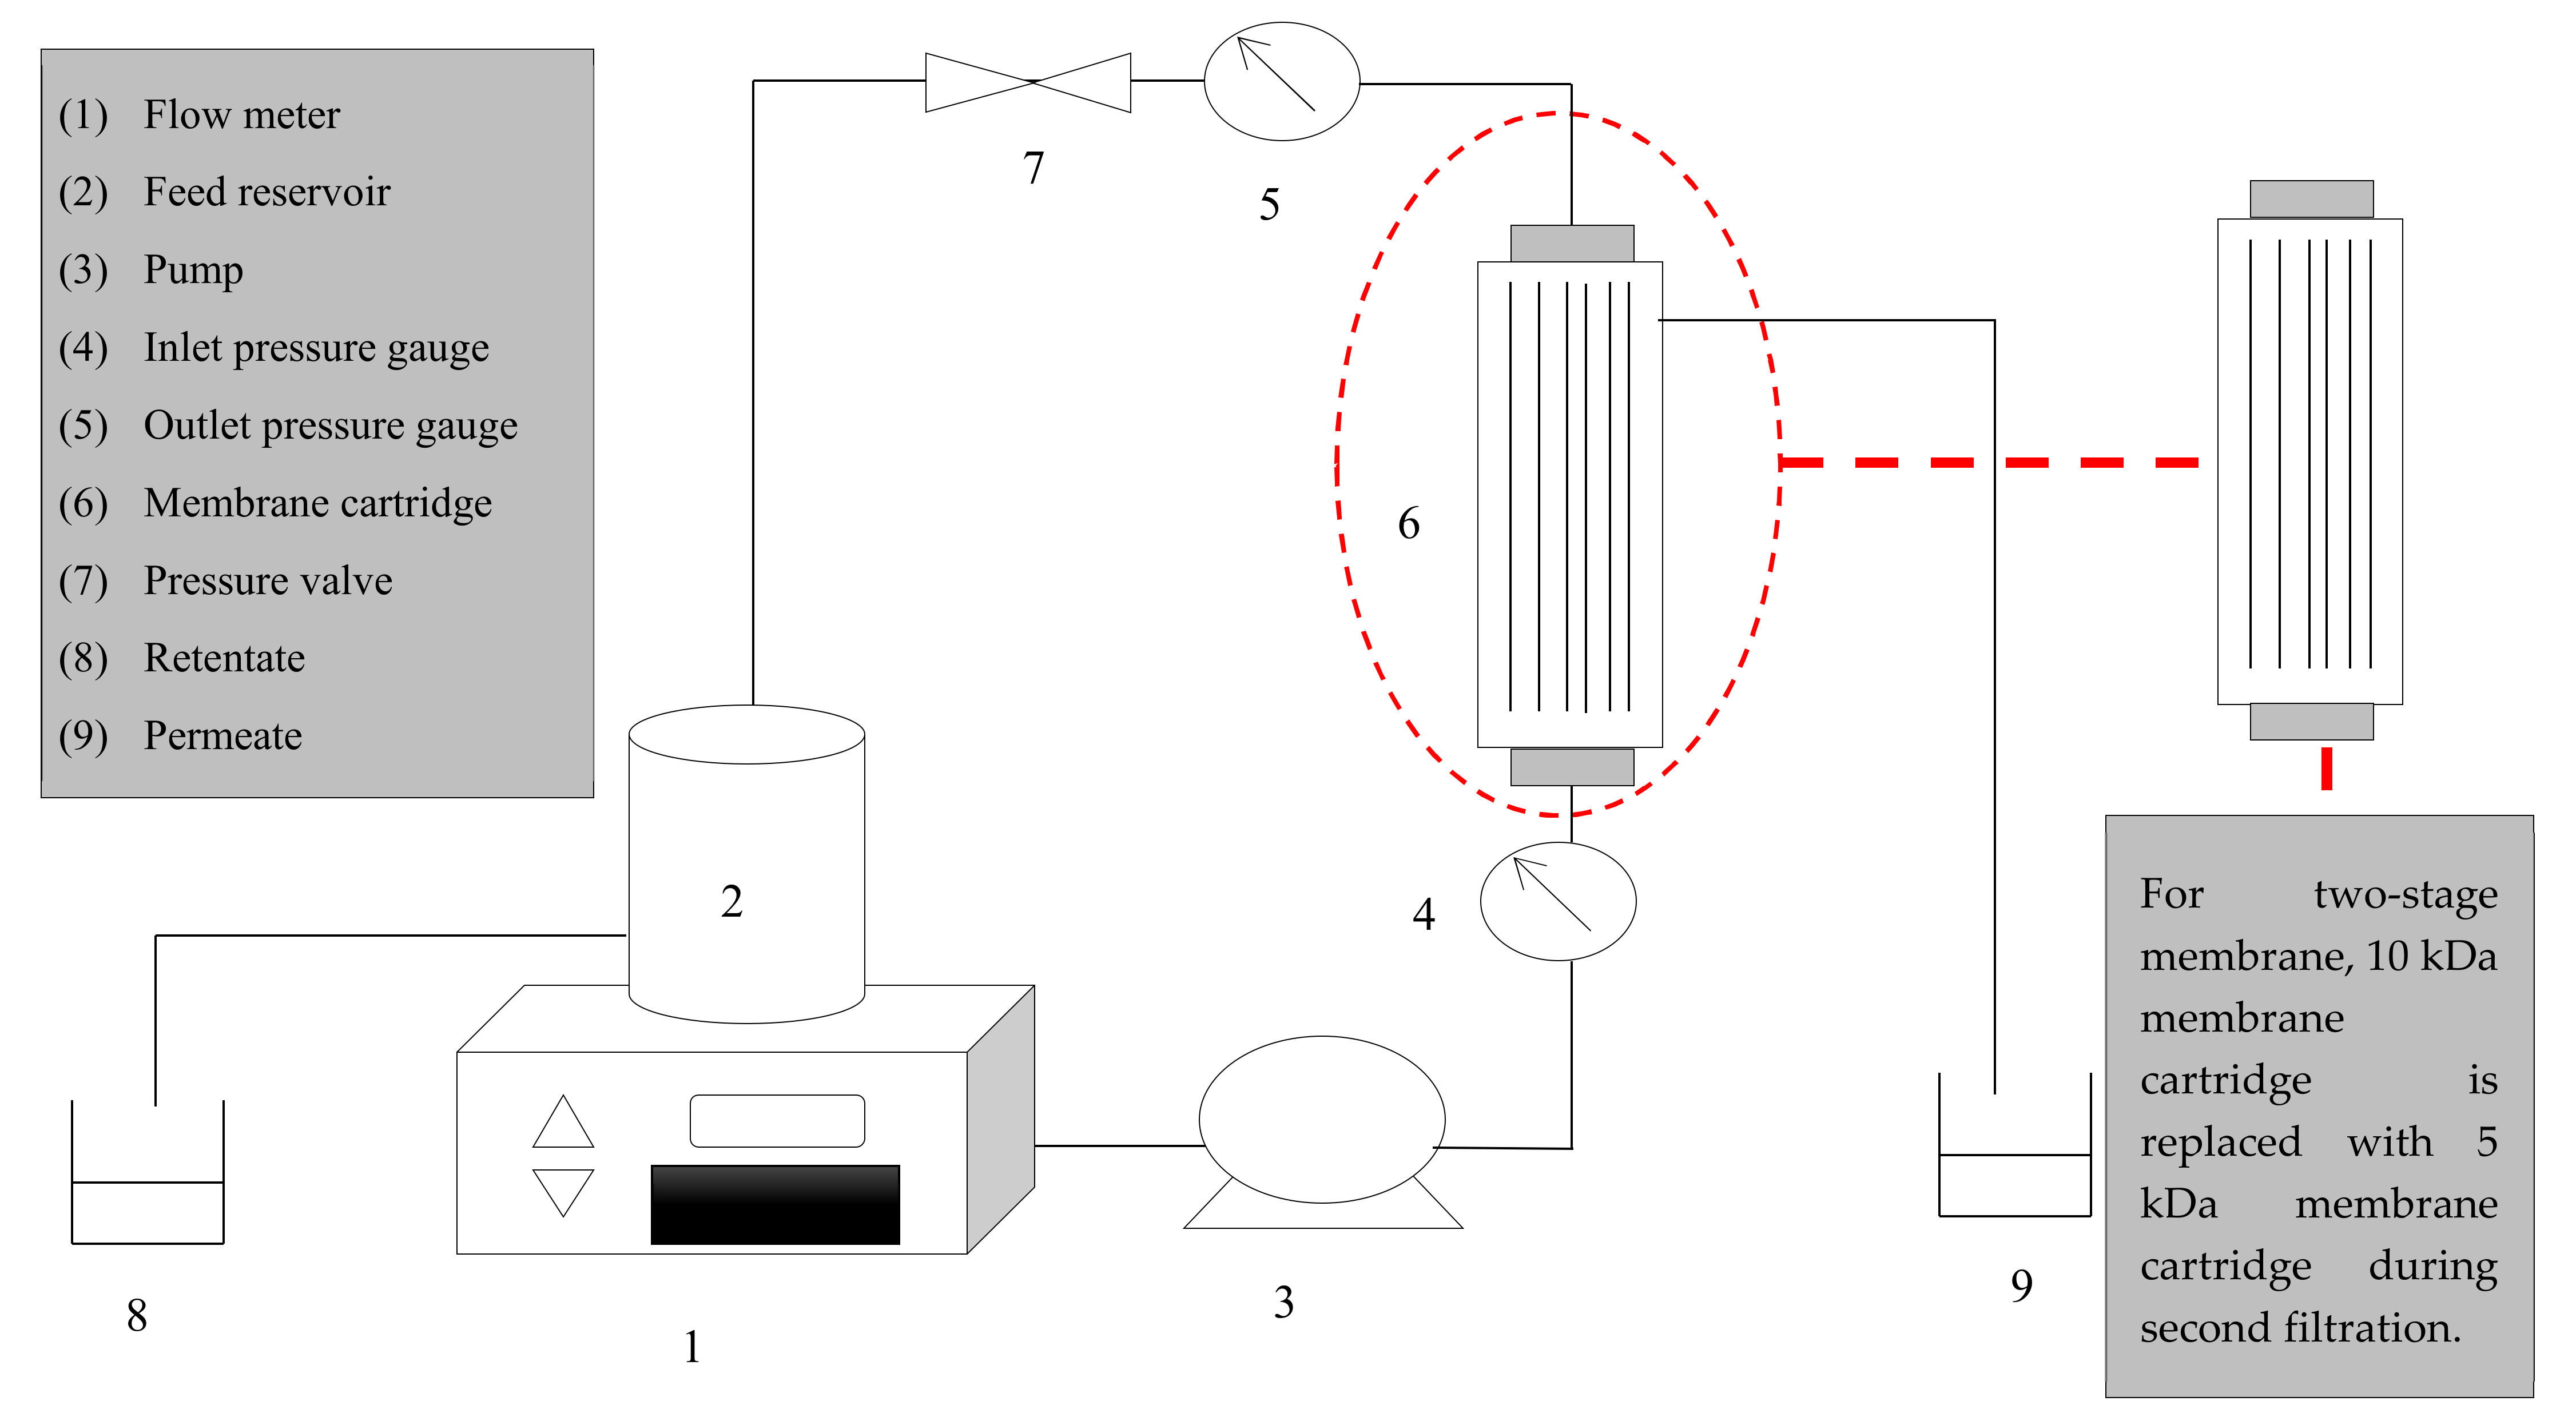
2.5. Evaluation of Membrane Performance (Permeate Flux and Peptide Transmission)

2.5.1. Permeate Flux

The permeate flux was performed at predetermined time intervals every 5 min to ensure the accuracy of the flux measurement [28]. Permeate flux, J (L/m2 h), was calculated according to Equation (1), as described by Zain et al. [29]:
Flux ,   J = V At
where V is the volume of permeate collected (L), A is membrane surface area (m2), and t is filtration time (h).
All measurements were performed in triplicate, and results are expressed as the mean ± standard deviation.

2.5.2. Peptide Transmission

The peptide transmission was determined using calculated feed and permeate concentration. The transmission of peptide can be described as the ratio of solute concentration in the permeate (Cp) to the feed concentration (Cf). Peptide transmission of MPH was calculated based on Equation (2), as described by Roslan et al. [30] and Yunos and Field [31]:
Peptide   transmission ,   Ʈ = C p C f × 100
All measurements were performed in triplicate, and results are expressed as the mean ± standard deviation.

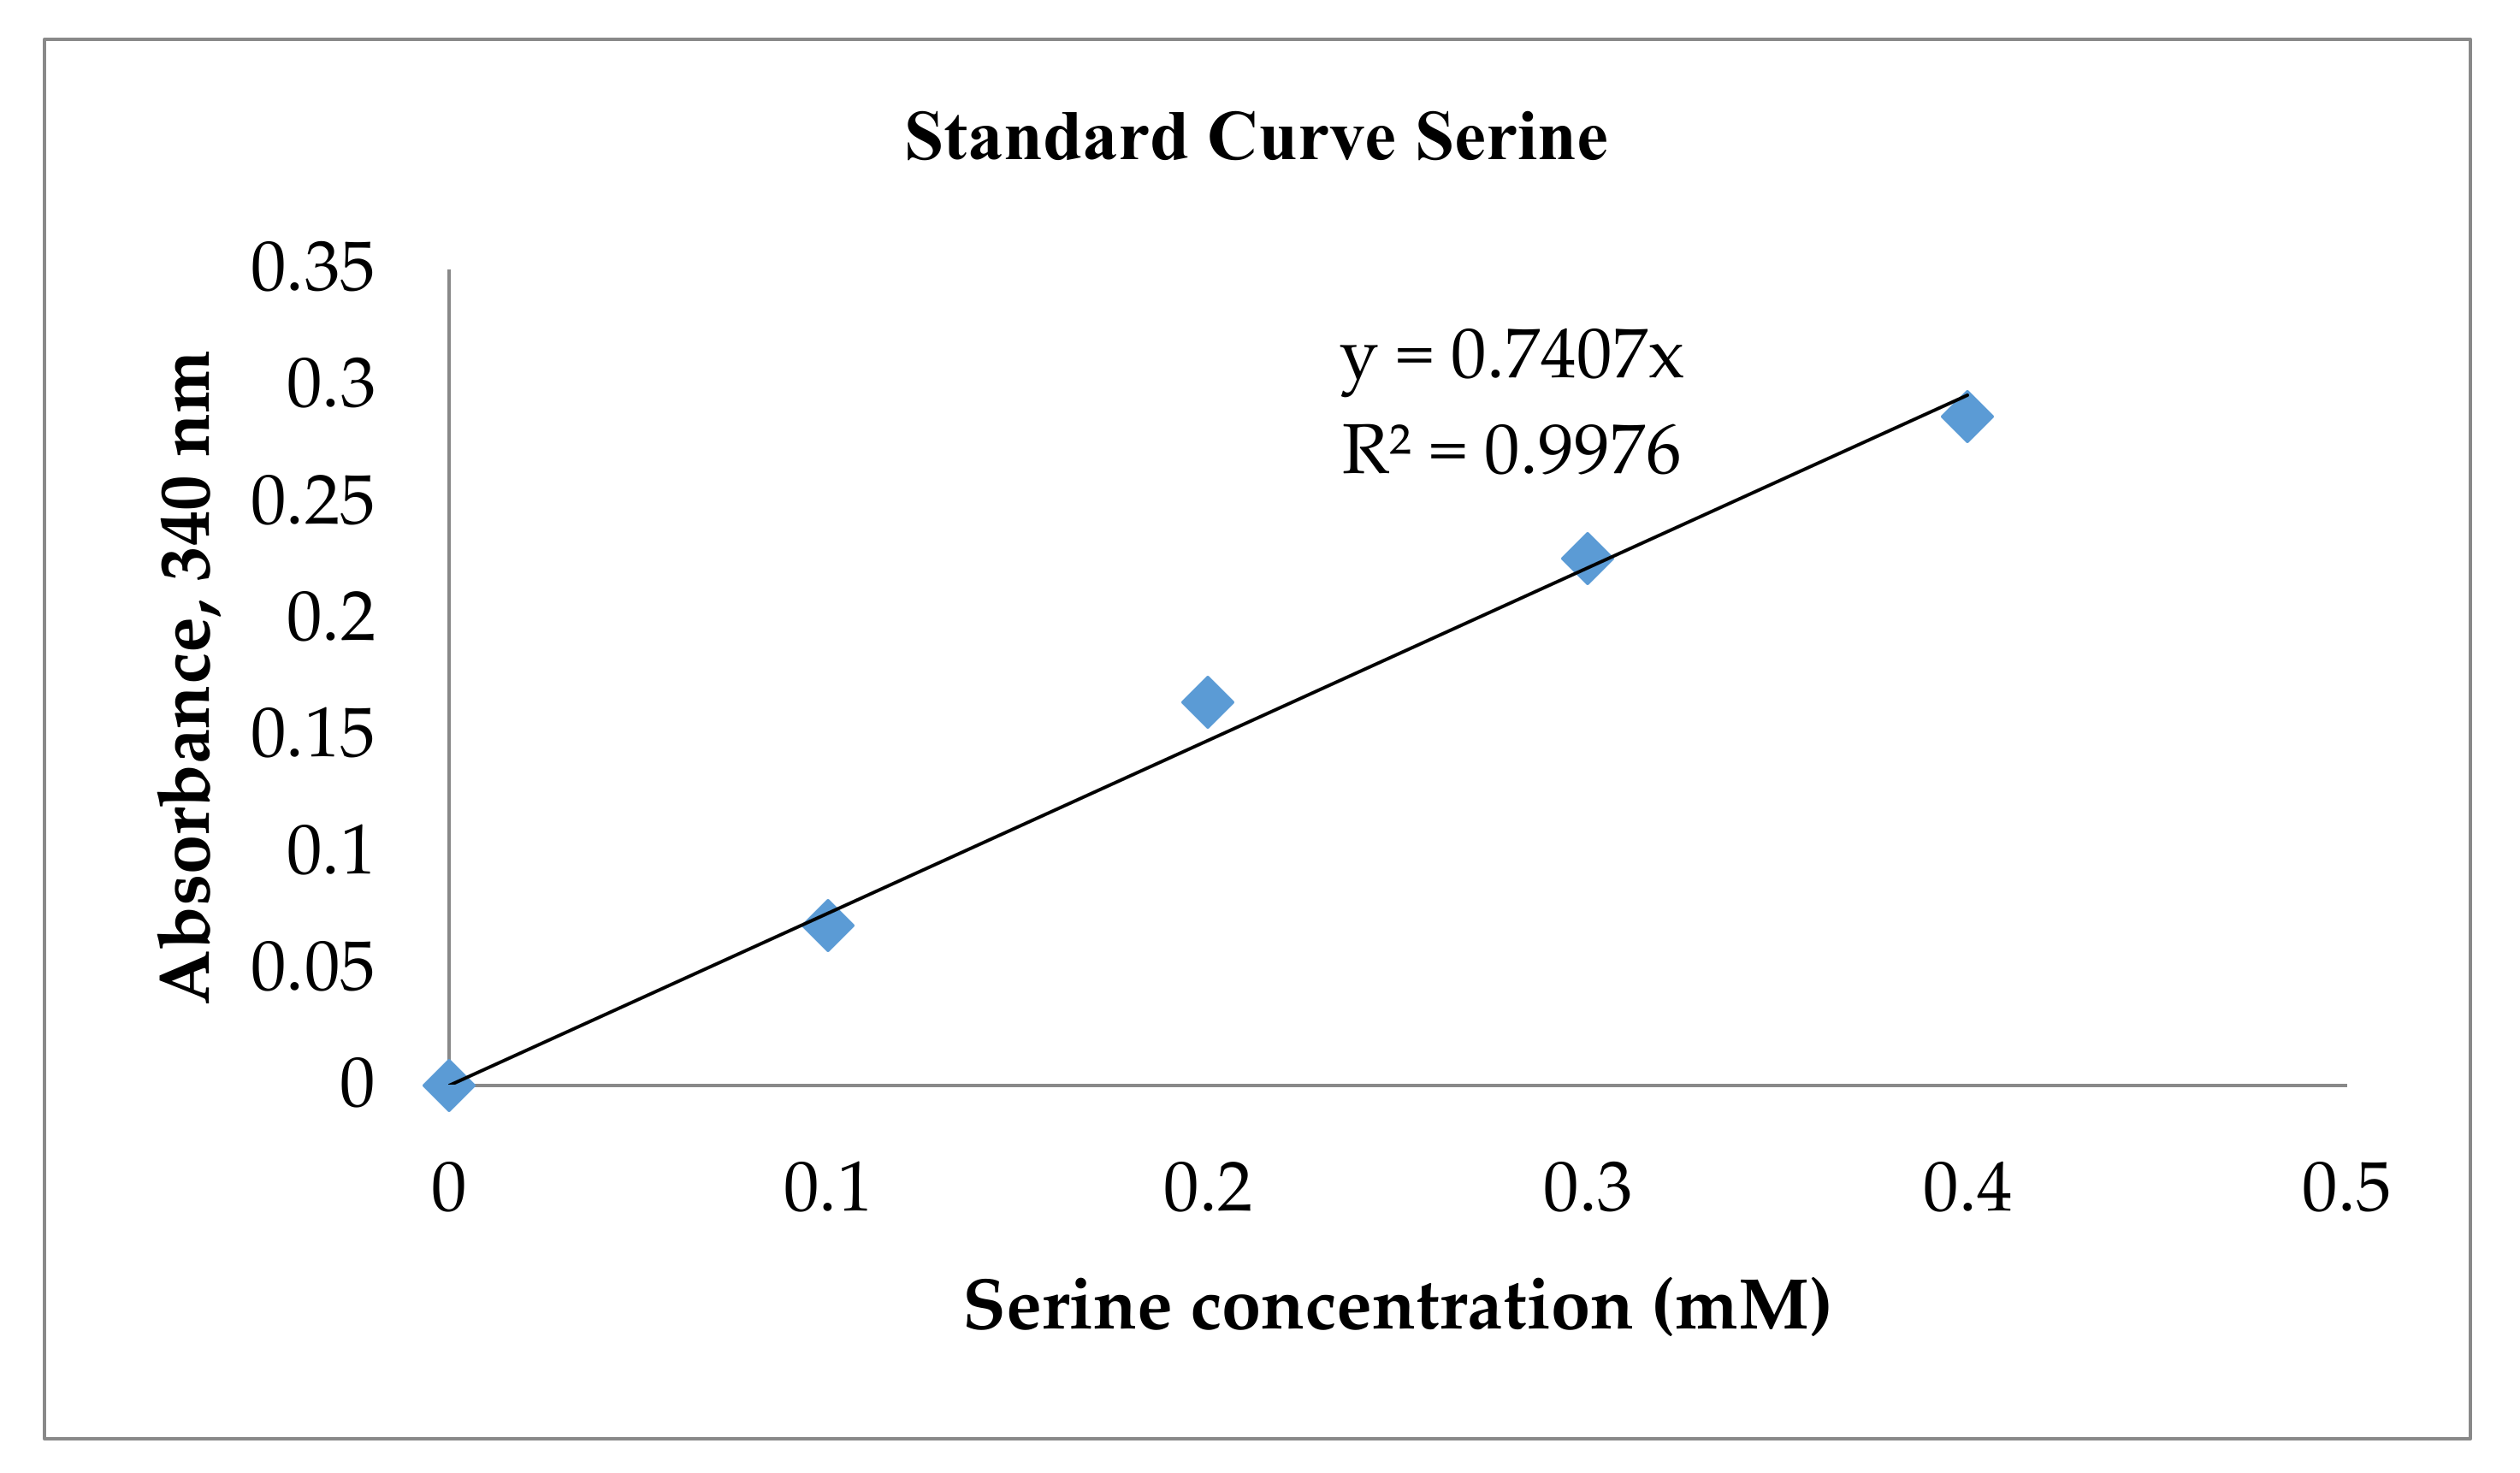
2.6. Measurement of Peptide Content

Peptide content for feed and permeate during fraction process was measured using the 1,2-phthalic dicarboxaldehyde (OPA) method, as described by Church et al. [32]. The OPA method employs a specific reaction between OPA and primary amino groups to form 1-alkylthio-2-alkyl-substituted isoindoles in the presence of a thiol [33]. The formed isoindoles can be spectrophotometrically quantified at 340 nm [34]. The OPA stock solution was prepared in a 100 mL volumetric flask by dissolving 3.81 g of sodium tetraborate decahydrate and 100 mg of sodium dodecyl sulphate in 75 mL of deionized water. In a test tube, 80 mg of o-phthalaldehyde 98% was dissolved in 2 mL of ethanol, and the solution was added in the volumetric flask. Then, 200 µL of β-mercaptoethanol was pipetted into the mixture, and deionized water was topped up to the volume. This reagent was freshly prepared before the analysis. Serine solution was prepared by dissolving 50 mg serine in 500 mL of deionized water. The serine standard curve was prepared from 0.1 mM to 0.4 mM. For the analysis, 400 µL of microalgae protein hydrolysate was mixed with 3 mL OPA reagent and mixed for 5 s. The mixture was incubated for 2 min at room temperature and measured using a UV-Visible spectrophotometer at 340 nm. The concentration of the number of hydrolysed peptide bonds was determined by referring to the serine standard curve and denoted as (h). Meanwhile, for the total number of peptide bonds released by substrate (hTot), an acid hydrolysis was performed. An acid hydrolysis or complete hydrolysis was performed by hydrolysing 0.2 g of substrate in 6N HCl at 95 °C for 24 h. The amount of free peptide (before hydrolysis, h0) and peptide in the hydrolysate (after hydrolysis, h1) were calculated based on Equation (3):
DH   ( % ) = h h Tot × 100 = h 1 h 0 h Tot × 100
where h1 = The amount of peptide in the hydrolysate, h0 = The amount of free peptide (before hydrolysis), htot = The total amount of peptide after complete hydrolysis (100%) of the substrate at 95 °C for 24 h in 6N HCl
The standard curve serine used to measure the peptide content is shown in Figure 2.

2.7. Fractionation Process

The fractionation process was conducted by adding 200 mL of MPH to the feed reservoir and hollow fiber UF membrane cartridge that fractionate the sample according to the molecular weight cut-off. Cross-flow ultrafiltration membrane systems with two different configurations, single (10 kDa and 5 kDa) and two-stage membrane (10/5 kDa), in fractionate MPH were evaluated. The two-stage membrane configuration was performed by allowing the fractionation process using the 10 kDa membrane first and then allowing the permeate from the 10 kDa membrane to pass through the 5 kDa membrane.
The operating parameters of the cross-flow ultrafiltration membrane, such as pH, flow rate, and trans-membrane pressure (TMP), were studied. The flow rate was varied at 23, 29, 35, and 41 mL/min, and adjusted using a peristaltic pump. Meanwhile, the TMP was varied at 0.5, 1.0, and 1.5 bar with a constant flow rate of 23 mL/min, controlled by a back pressure valve. Then, the pH solution was varied from acidic to alkaline conditions, pH 2, pH 4, pH 7, and pH 9, and was adjusted using 1.0 N of hydrochloric acid and 1.0 N of sodium hydroxide until the desired pH was achieved. The fractionation process was performed for 35 min for each run, and the volume of permeate was collected every 5 min. The data obtained from the experiments were used to evaluate the UF membrane performance based on permeate flux and peptide transmission.

2.8. Peptide Selectivity

Based on the membrane study, the best fractionation condition for each configuration of UF membrane (single membrane, 5 and 10 kDa; two-stage membrane, 10/5 kDa) were analyzed for peptide selectivity. The peptide selectivity of MPH was analyzed based on size distribution using AKTA Fast Pressure Liquid Chromatography (FPLC, Amersham Pharmacia Biotech) equipped with a sensor at a wavelength of 734 nm. The sample was fractionated using a prepacked TricornTM glass column (SuperdexTM30 Increase 10/300 GL) in which the matrix was built from the composite of cross-linked agarose and dextran. Prior to the analysis, deionized water and two buffers were prepared: 20% ethanol and 0.05 M tris-HCl buffer at pH 7. All the buffers and deionized water were prepared for 1 L, sonicated for 20 min using a water bath sonicator (1510 BRANSON), and filtered using 0.45 µm nylon membrane filter. The UNICORN software was used in the FPLC system, and all the connections under the system were checked before the procedure was run. Next, pump B in the system was pump washed for 5 min, followed by pump A, using deionized water. Then, the column was attached to the system and a pump wash through the column was needed. The flow rate and the pressure limit of the system were set to 0.5 mL/min and 2.7 MPa, respectively. After that, the sample loop was cleaned using 1 mL of ethanol and deionized water. The whole system was prepared using mobile phase tris-HCl buffer before each sample was run. After the system was ready, 100 µL of sample was injected into the sample loop and run according to the method created. The result obtained was compared to the reference standard. In this study, peptides of known molecular weight (GLY-TYR, 238.2 g/mol; VAL-TYR-VAL, 379.5 g/mol; methionine enkephalin acetate, 573.7 g/mol; leucine enkephaline, 555.6 g/mol; angiotensin II acetate, 1046.2 g/mol; neurotensin, 1672.92 g/mol; and cytochrome C; 12,327 g/mol) were used as standard and run using the same method as sample.

3. Results and Discussion

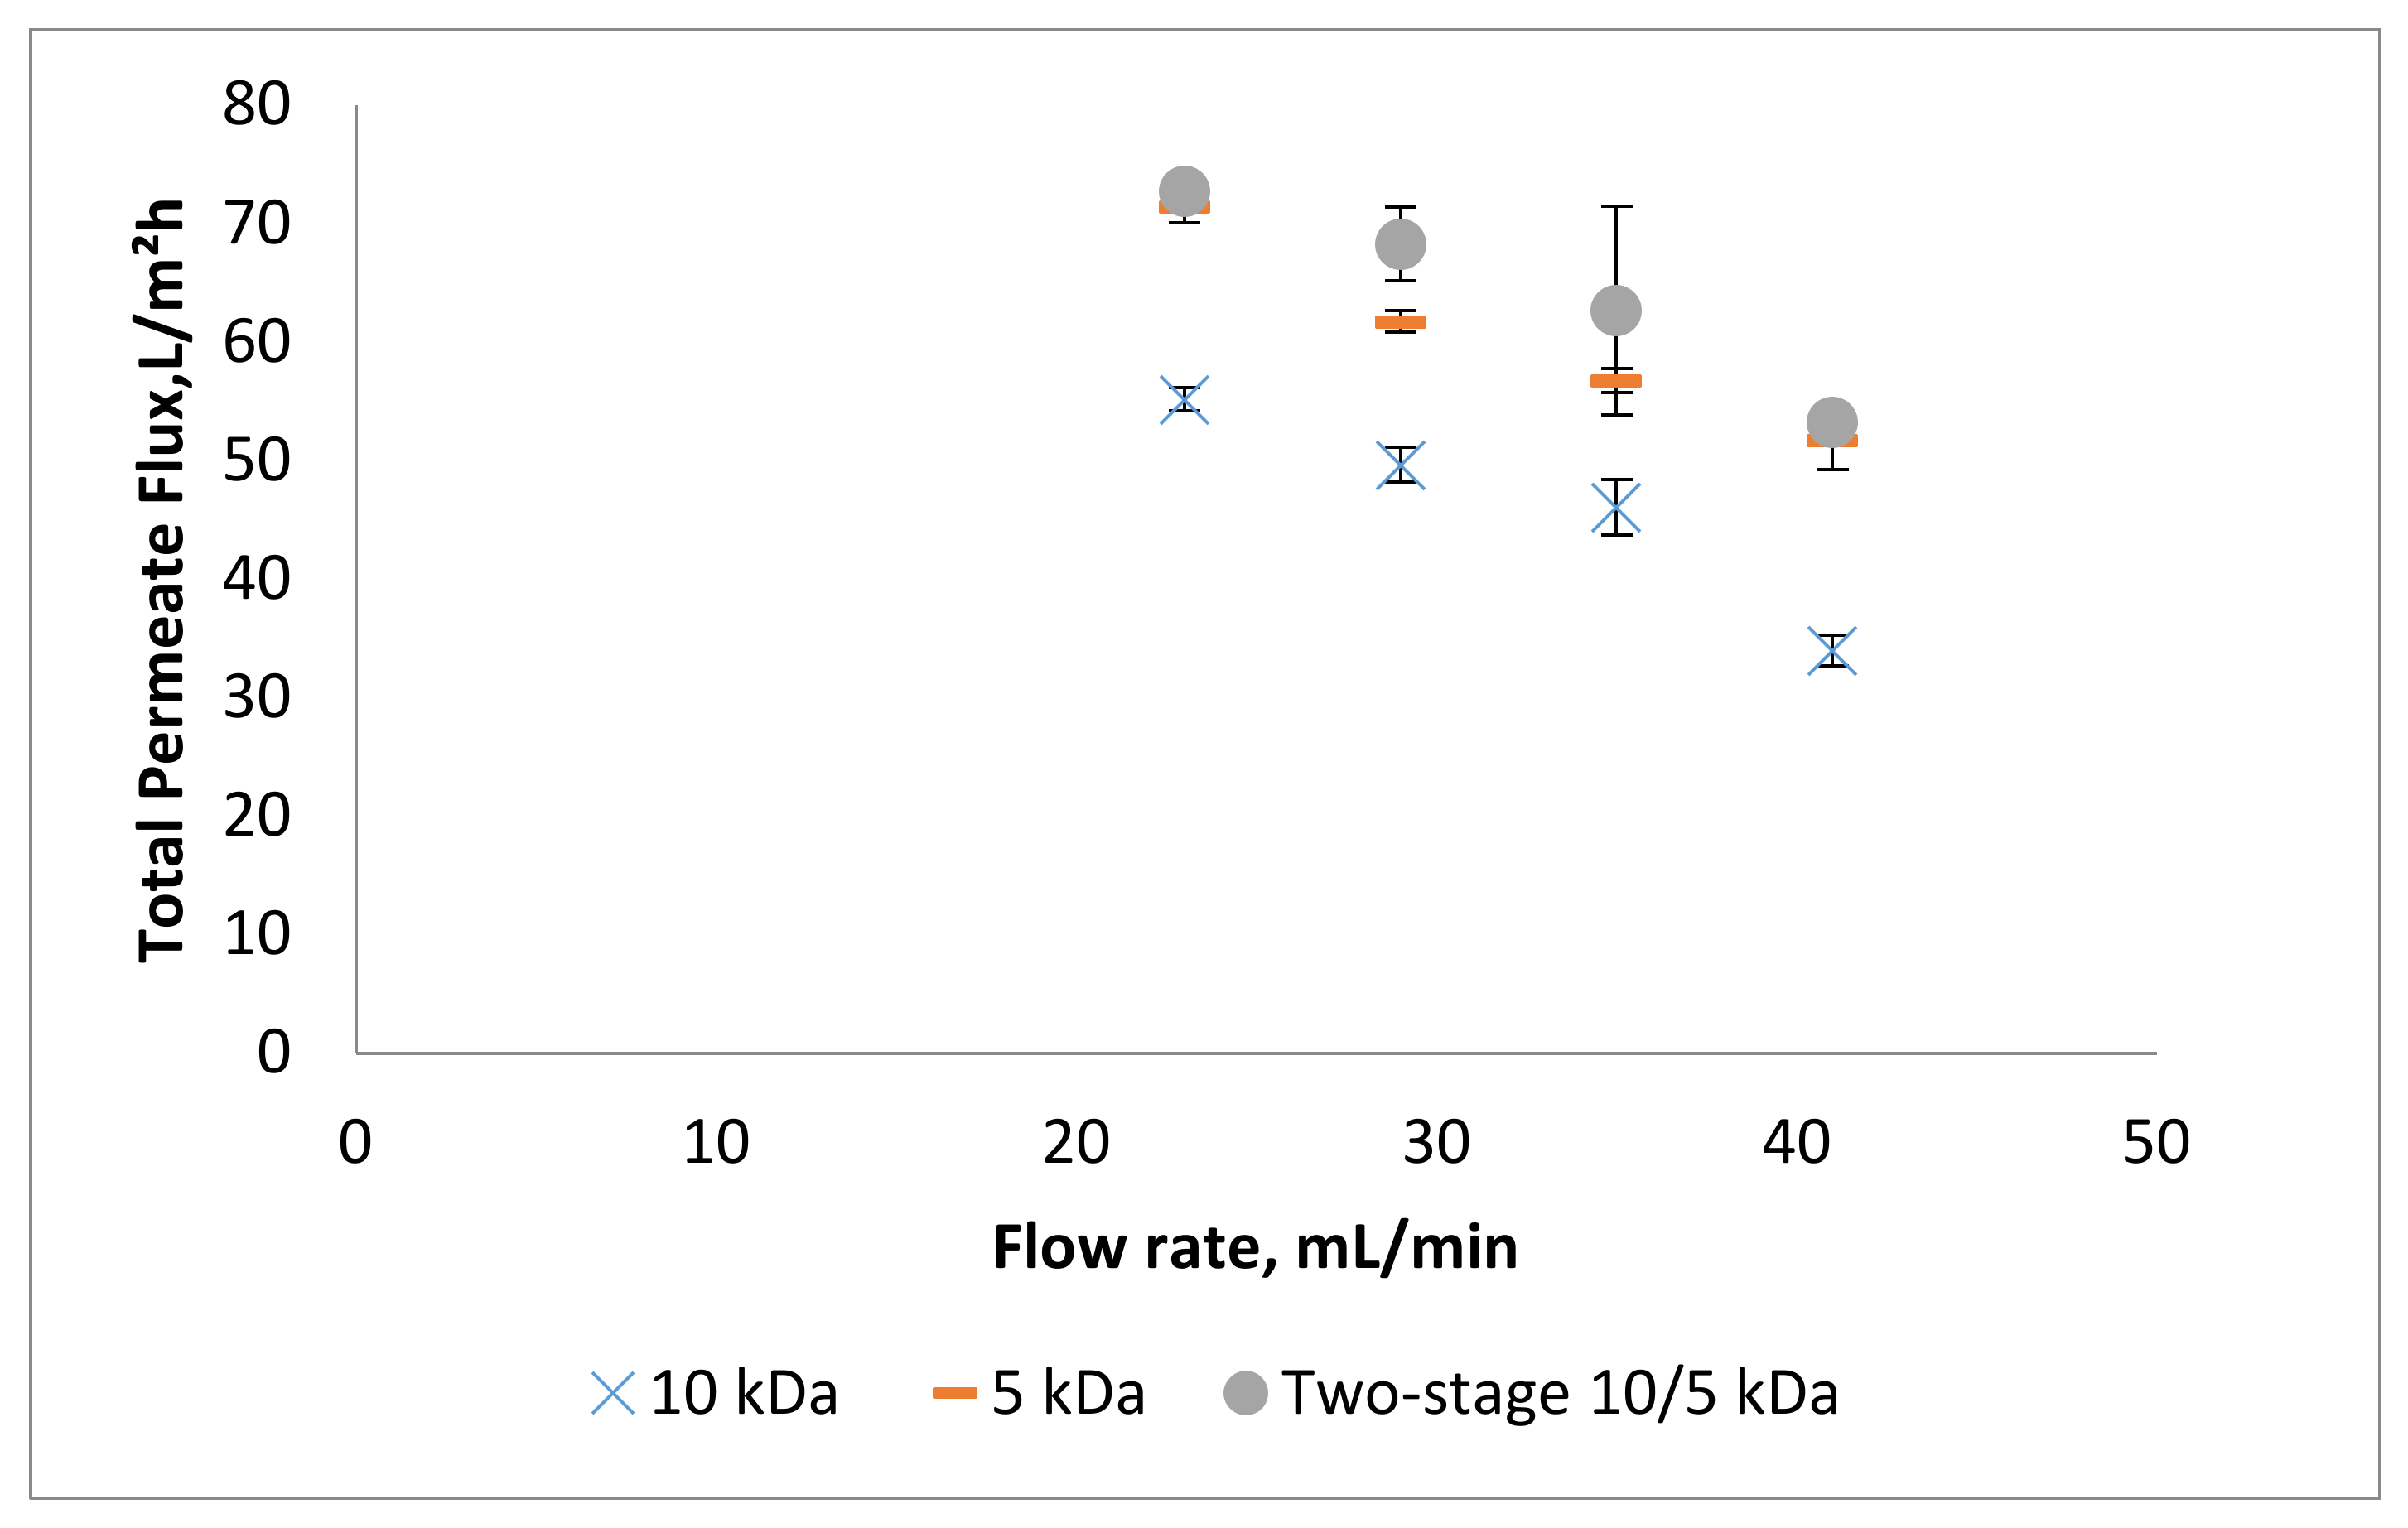
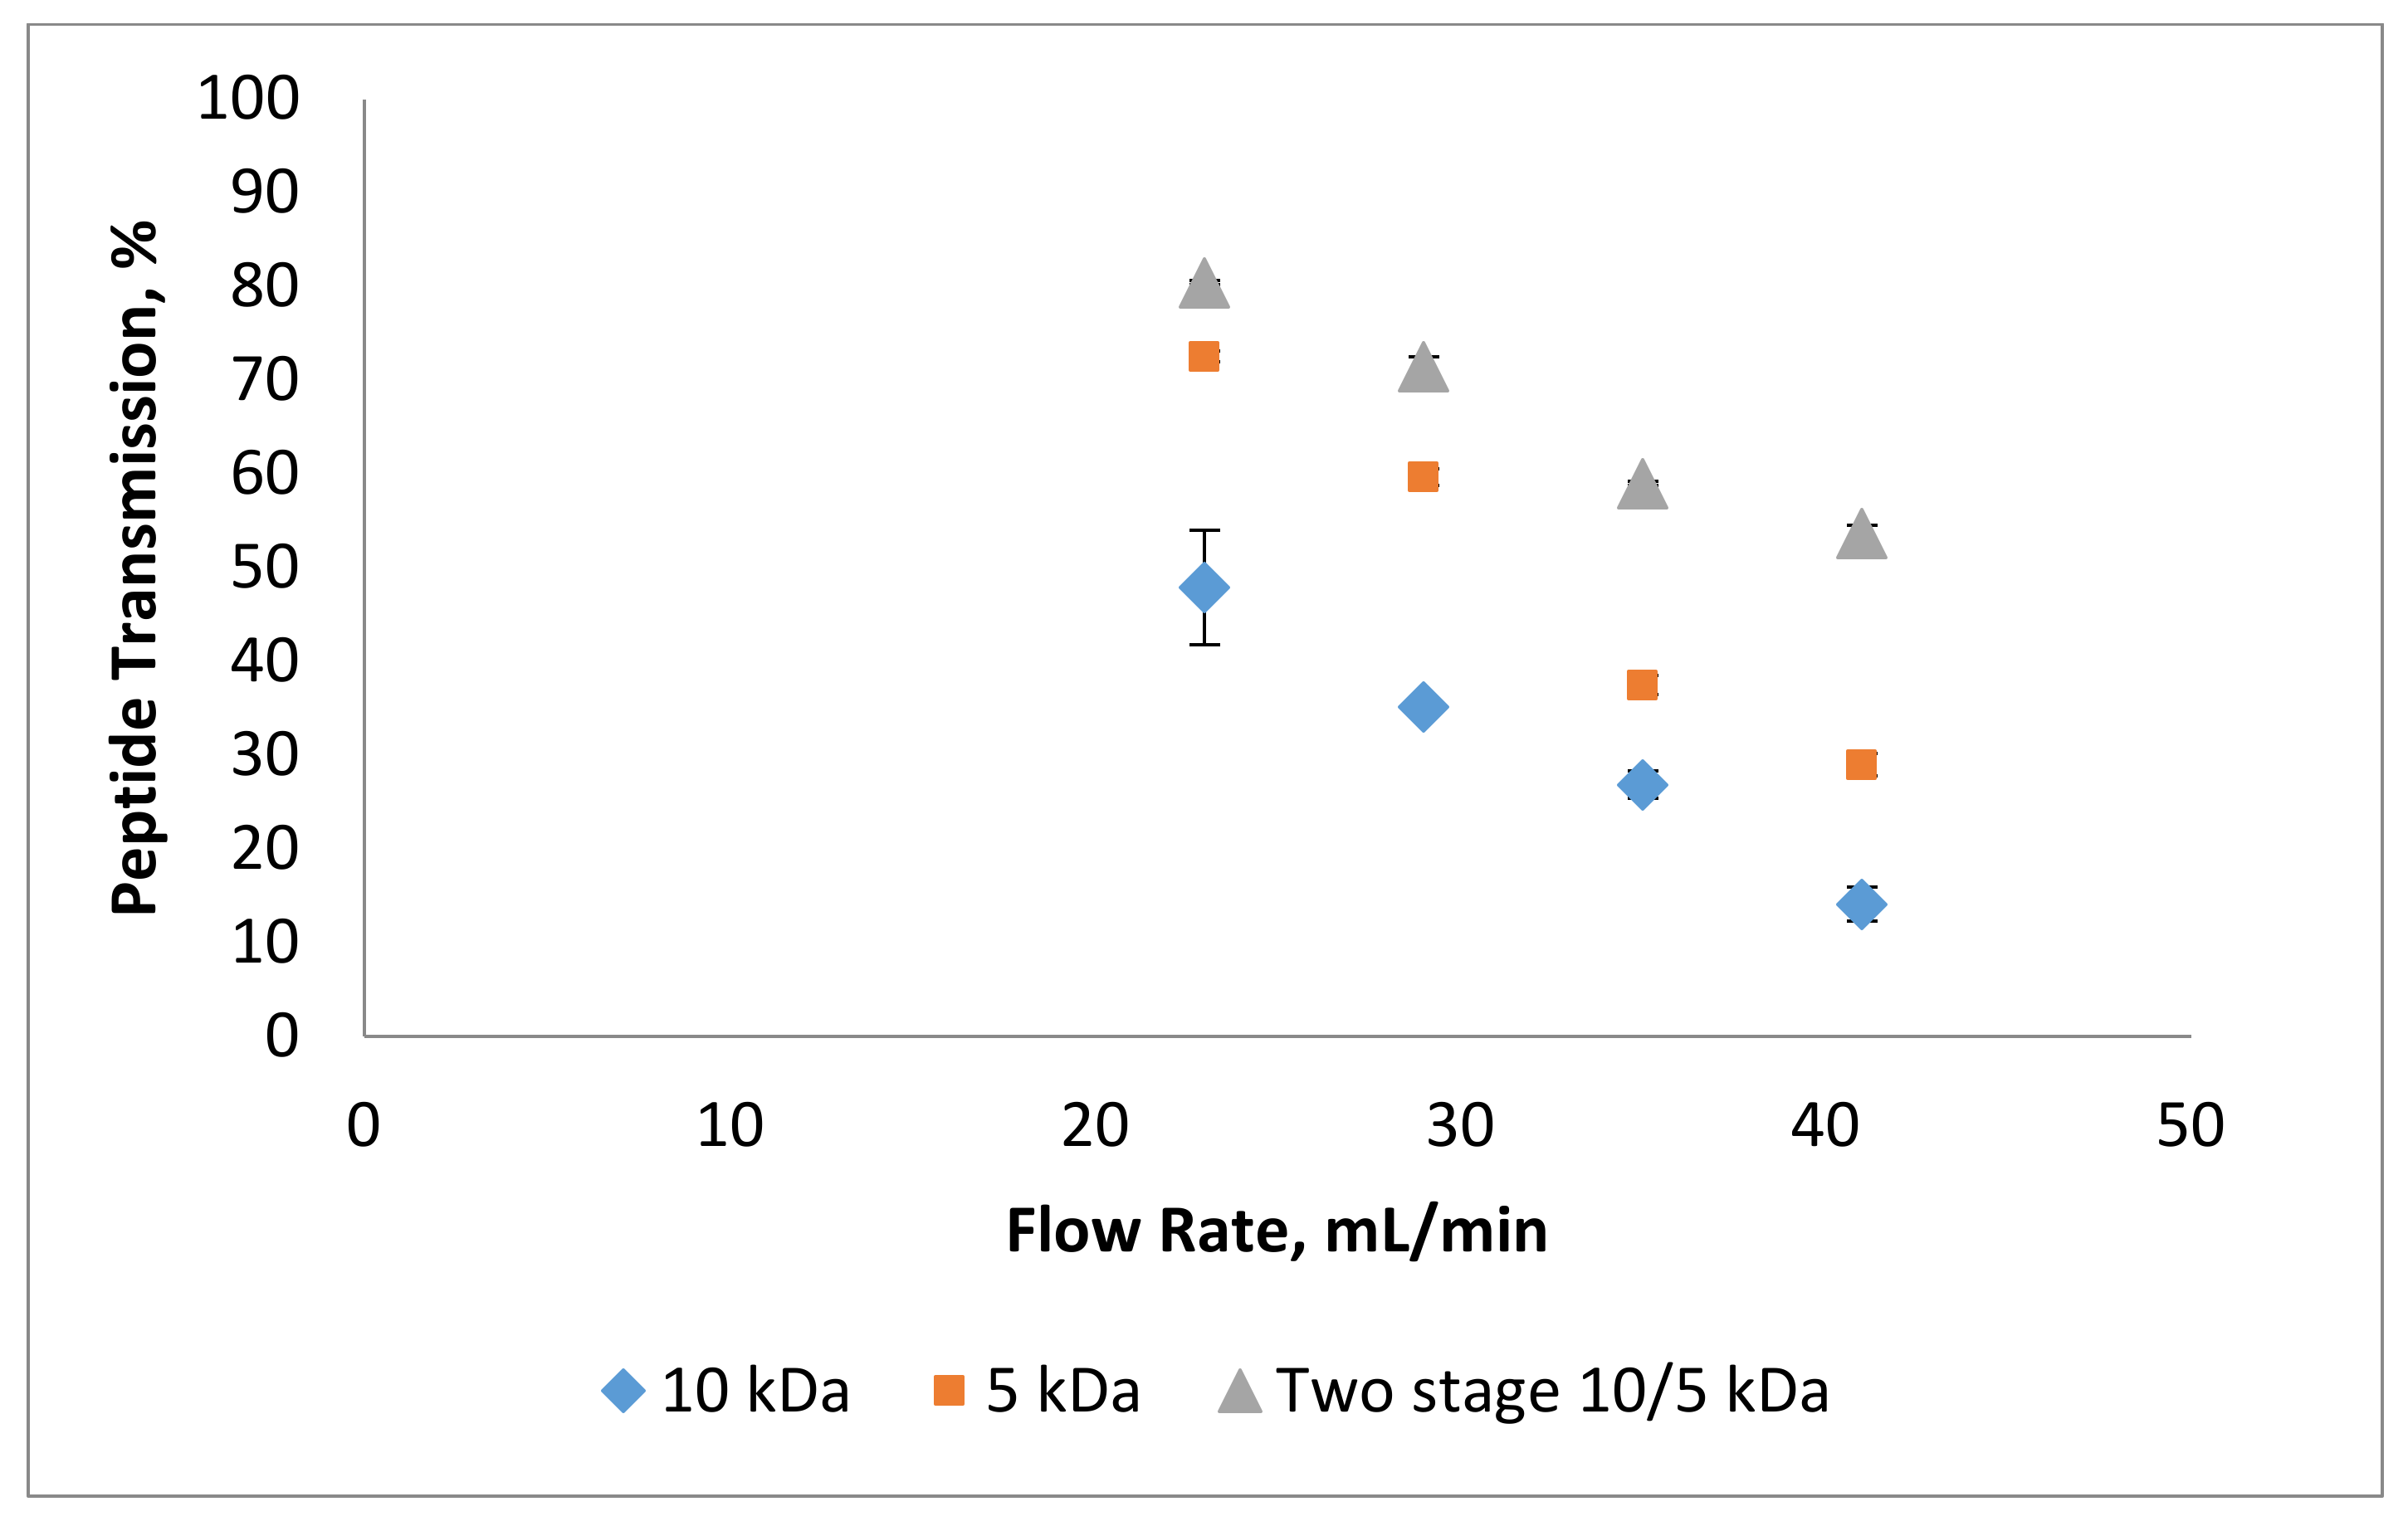
3.1. Effect of Flow Rate on Permeate Flux and Peptide Transmission in Fractionating MPH

Flow rate is one of the most important parameters in UF membrane. The increase or decrease in flow rate during filtration could influence the membrane flux and transmission of peptide. In this study, cross-flow hollow fiber membrane was used to investigate the effect of flow rate range from 23 to 41 mL/min on permeate flux. Figure 3 represents the total permeate flux for both types of membrane size. The figure shows that, for a single membrane, the 10 kDa membrane had a low total permeate flux compared to the 5 kDa membrane, and the permeate flux decreased as the feed flow rate increased for both membranes. Other researchers also found similar trends in which large membrane pore sizes contributed to low flux and transmission when compared to small membrane pore sizes [35,36,37]. Hwang et al. [36] showed that the 0.4 µm pore size membrane had a blocking index higher than the 0.2 µm pore size membrane under the same filtration pressure, which subsequently lead to a lower filtration flux. Severe membrane blocking in the larger membrane pores could be due to more particles accumulating in the larger pore volume. Having a larger membrane pore size could result in lower separation by reducing the membrane permeability [37]. Membrane blocking that reduces the permeability created the fouling effect and caused the permeate flux and peptide transmission to be low [38].
At a flow rate of 23 mL/min, the highest total permeate flux was recorded for the 5 kDa membrane, followed by 29, 35, and 41 mL/min with 71.46 ± 1.36, 61.78 ± 0.93, 56.78 ± 1.01, and 51.74 ± 2.45 L/m2 h, respectively. The same trend was observed in the 10 kDa membrane, where a flow rate of 23 mL/min was recorded with the highest total permeate flux followed by 29, 35, and 41 mL/min with 55.20 ± 0.99, 49.69 ± 1.45, 46.08 ± 2.34, and 34.01 ± 1.27 L/m2 h, respectively. Usually, a high flow rate was associated with a high permeate flux because of a high flow rate; shear rate at the membrane surface will increase. This high shear rate reduces membrane fouling or blocking as it removes the deposited material on the membrane surface and thus decreases the fouling layer’s hydraulic resistance [39]. However, in this case, the result was contradicted by the shear rate theory. This might be due to this experiment being performed at constant pressure. Typically, as the flow rate increases, the TMP and shear rate also leads to increase, but as the TMP was kept at a constant value, the shear rate effect was negligible. Thus, low flow rate could attribute to high permeate flux. According to Tanaka et al. [40], permeate flux could decrease as feed flow rate increase due to the increase in membrane transport resistance. This was because, at the higher feed flow rate, the concentration of the retained molecule increased at the membrane surface and formed a filter cake, and there was a higher resistance to flow through the membrane, leading to a decrease in the permeate flux and difficulty for the smaller permeable species to pass through the membrane [41]. The same trend was reported by the studies of Sofuwani et al. [42] and Taddei et al. [43].
Meanwhile, for two-stage membrane 10/5 kDa, the total permeate flux was higher than the single membrane. One plausible reason for this could be due to the change in the MPH’s viscosity from using a two-stage membrane [24]. During the first stage of filtration using the 10 kDa membrane, most macromolecules larger than 10 kDa were retained in the feed. This made the obtained permeate less viscous, and this permeate was further filtered at the second stage using the 5 kDa membrane. A reduction in the feed MPH’s viscosity could reduce the fouling effect in the membrane and improve the performance of the ultrafiltration membrane. The permeate flux trends are similar with a single membrane, in which the total permeate flux decreased with flow rate. The highest permeate flux was observed at a flow rate of 23 mL/min with permeate flux 72.76 ± 1.50 L/m2 h, followed by flow rates of 29, 35, and 41 mL/min with permeate fluxes of 68.33 ± 3.12 L/m2 h, 62.71 ± 8.79 L/m2 h, and 53.27 ± 0.79 L/m2 h, respectively. During the first stage, the fouling due to concentration polarization was greatly influenced by other large components such as starch, which has gelling properties that might hinder the filtration. However, at the second stage ultrafiltration, the gel layer was avoided, reducing the fouling effect and increasing the total permeate flux [25].
Peptide transmission of MPH at different feed flow rates using a single-stage 10 kDa, 5 kDa membrane and two-stage 10/5 kDa membrane are shown in Figure 4. Based on the previous result shown in Figure 3, the peptide transmissions of MPH increased with permeate flux and decreasing linearly with increasing flow rate. The peptide transmission using a two-stage 10/5 kDa membrane was significantly higher than the single stage 10 and 5 kDa membranes for all ranges of feed flow rate. The highest peptide transmission was found at a flow rate of 23 mL/min, which, for the 10/5 kDa membrane, was 80.50 ± 0.22%. The 5 kDa membrane was 72.57 ± 0.59%, and the 10 kDa membrane was 47.94 ± 6.08%, while the lowest peptide transmission was at a flow rate of 41 mL/min, with the two-stage 10/5 kDa membrane yielding 53.71 ± 0.83%, the 5 kDa membrane yielding 29.05 ± 1.19, and the 10 kDa membrane yielding 14.15± 1.84%. A significance difference in peptide transmission could be seen when using the two-stage membrane. The highest permeate flux was found using the 10/5 kDa membrane. The high initial flux values at the beginning of UF membrane could induce a strong convective flow and force material toward the membrane surface, where it is retained and deposited [44]. Under membrane-controlled filtration conditions, boundary layer effects, such as adsorption of proteins, caused an increase of the filtration resistance, as observed by Caric et al. [45]. This condition put the critical flux (Jcrit) in a transition state, where the fouling was caused by boundary layer effects and convective mass deposition [46]. As the resistance increased, the initial convective flow, and consequently the fouling at the membrane inlet, was reduced. Thus, the membrane area controlled by a deposit layer was decreased and the peptide transmission increased at a lower flow rate [44]. According to Suwal [47], feed flow rate did not significantly affect peptide migration, but at the highest flow rate, the selectivity of certain peptides was reduced. Therefore, only a specific peptide was allowed to pass through, and this reduced the peptide transmission at high flow rate. Even though high flow rate generally tended to reduce the aggregation of the feed solids in the gel layer, it also increased their diffusion back towards the bulk feed solution. This led to an overall reduction in the effect of concentration polarization. However, in some cases, the increase in tangential flow velocity affects the removal of larger particles from the membrane surface, but causes stratification of smaller particles on the membrane surface, with consequent pore plugging [48].

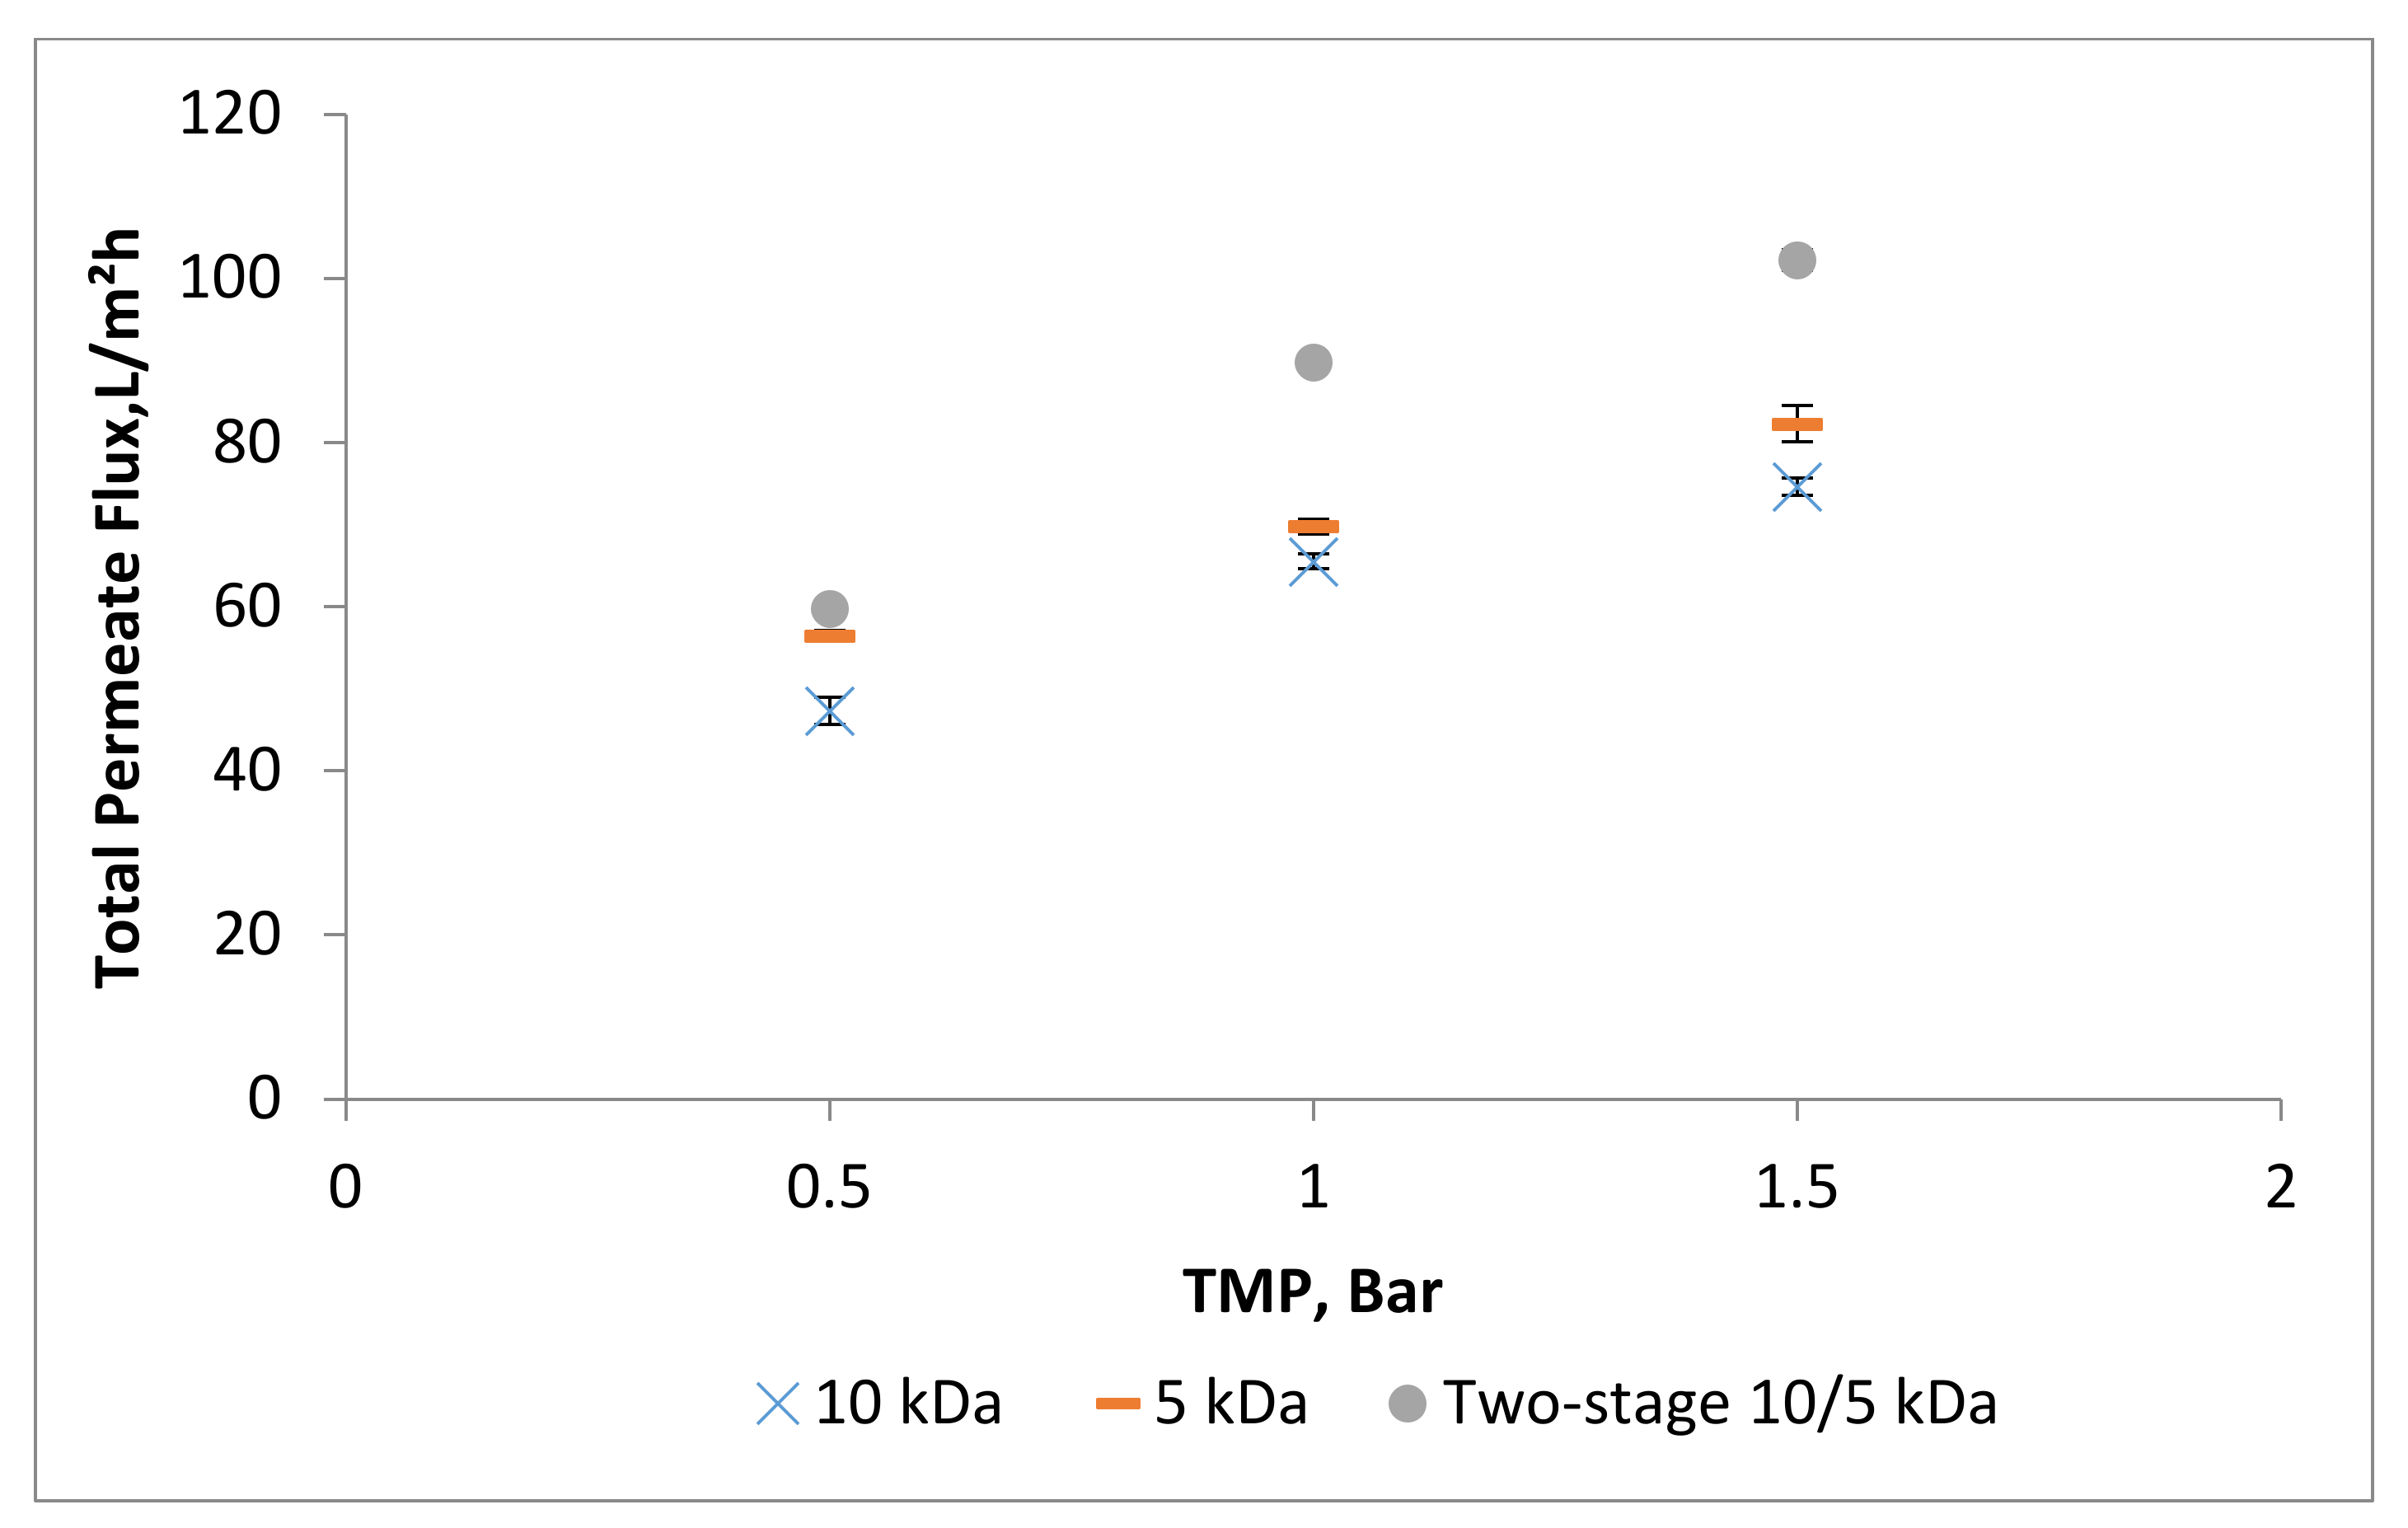
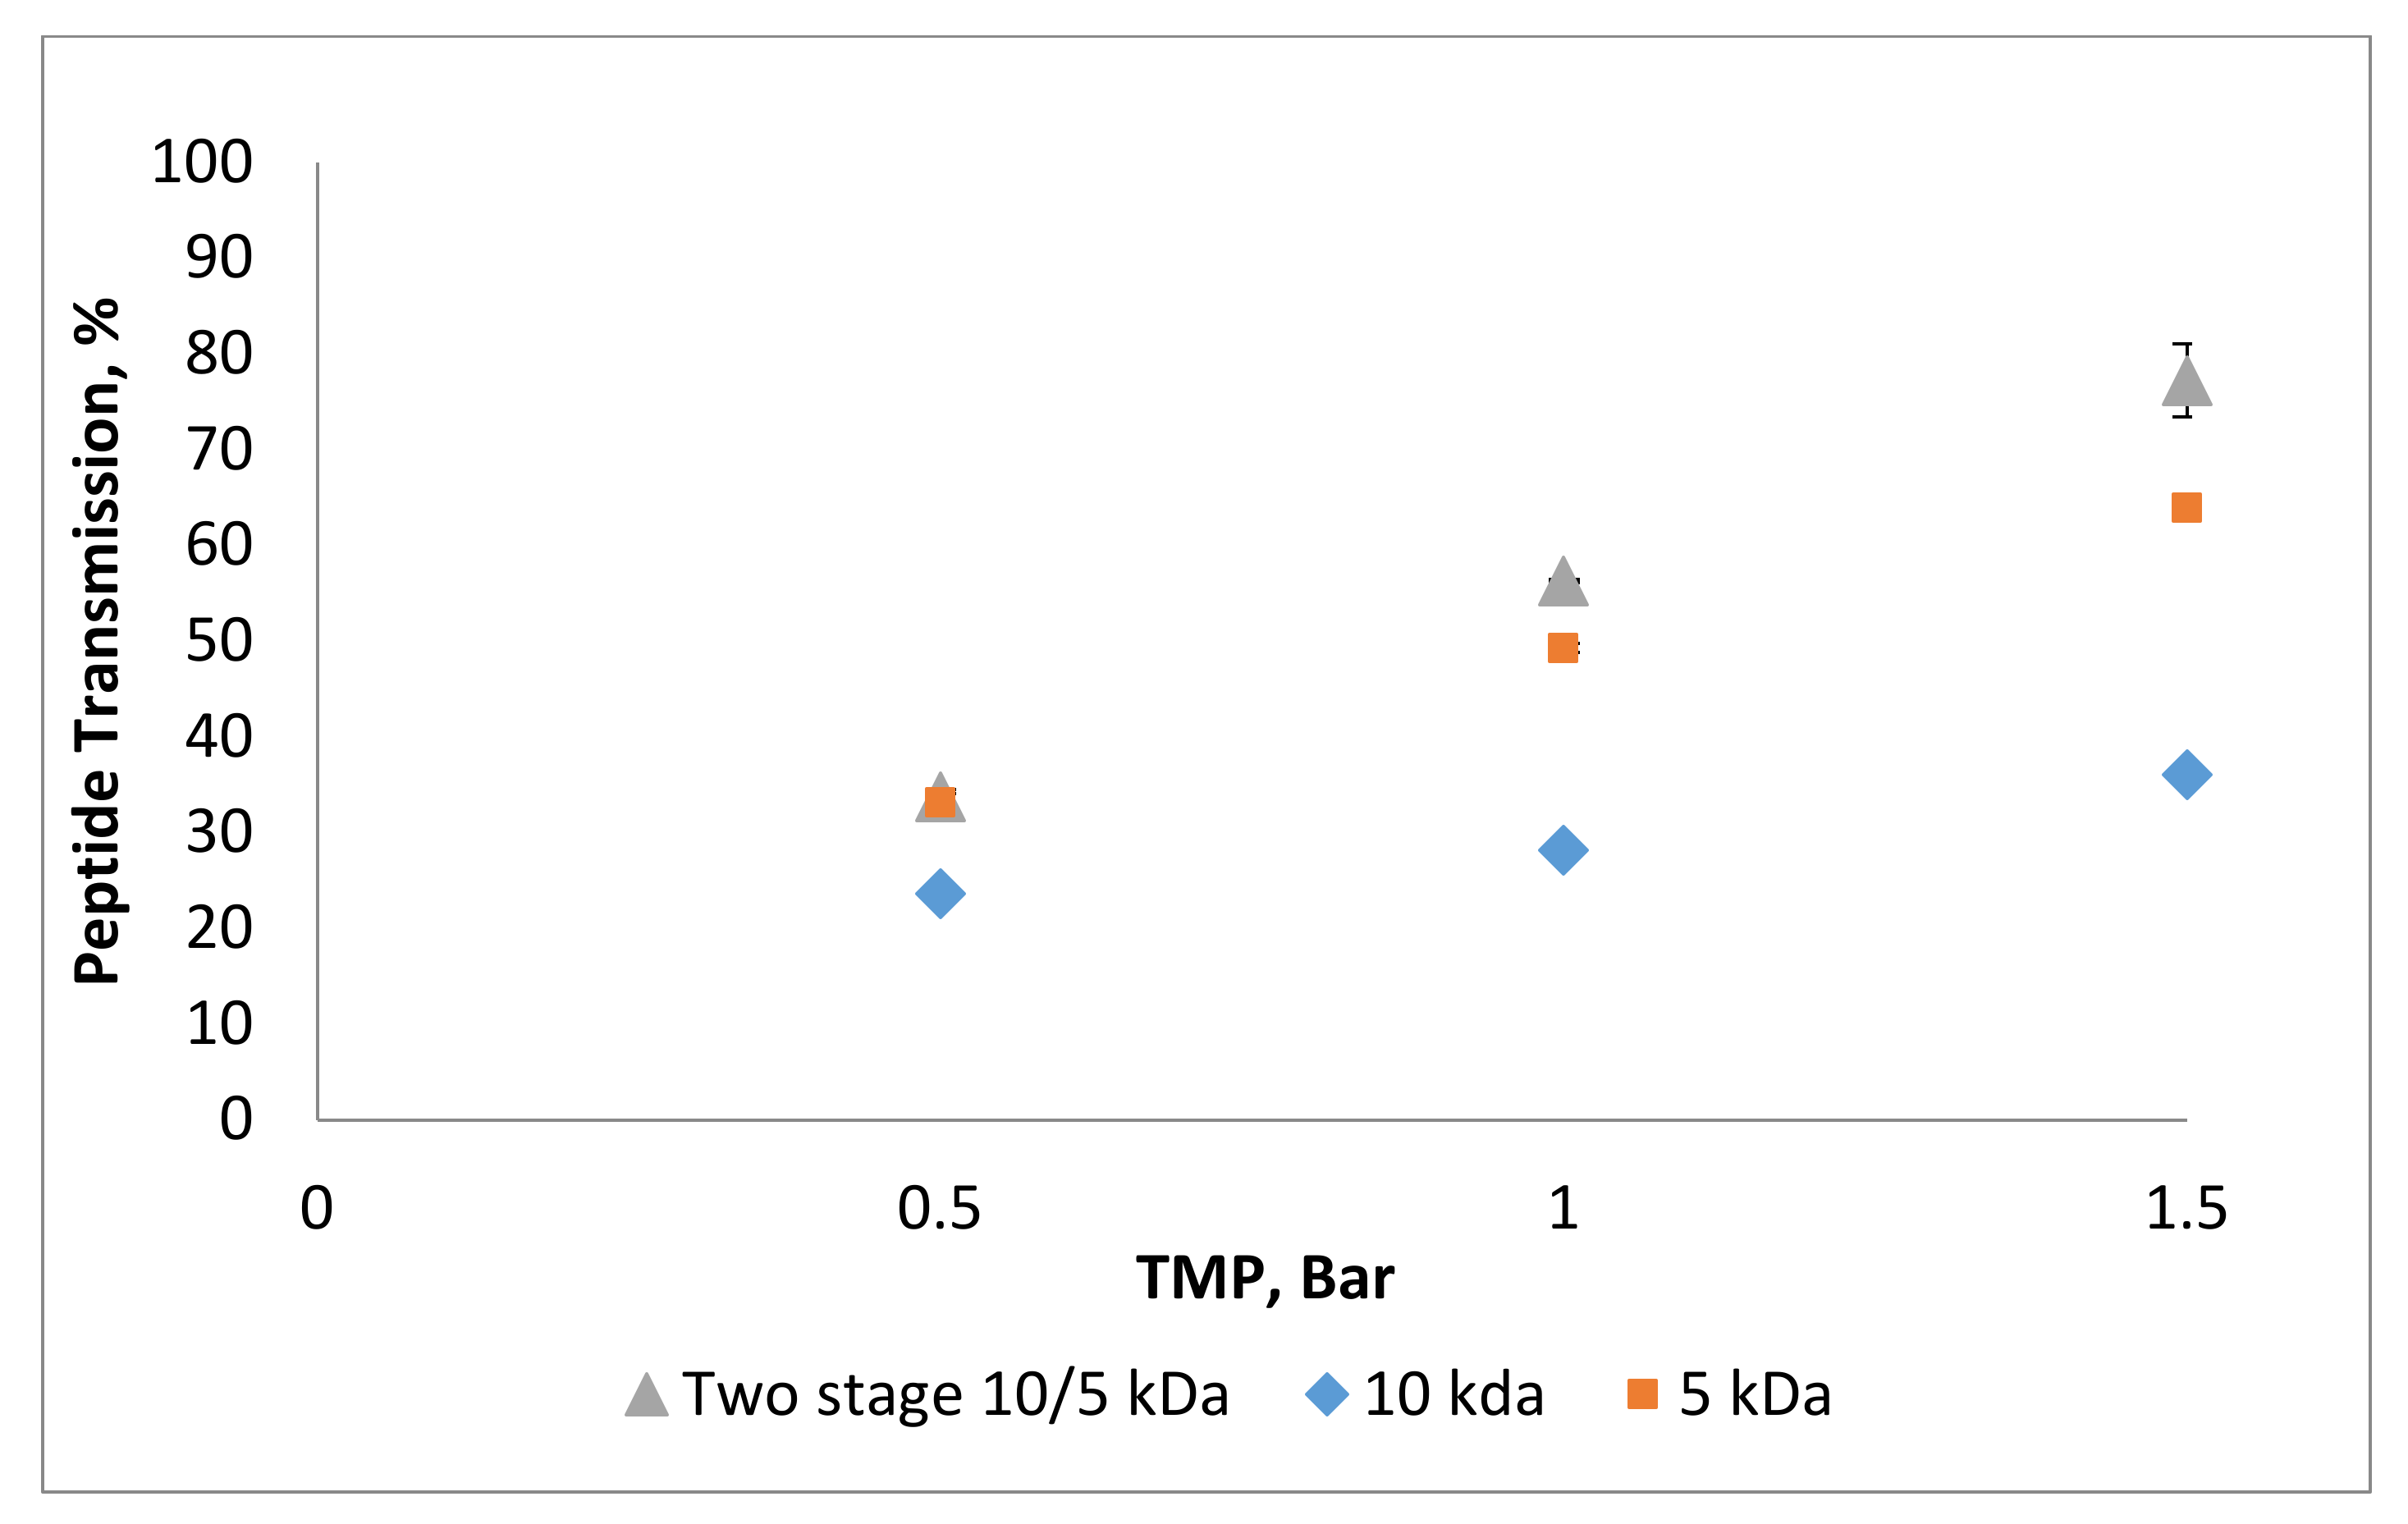
3.2. Effect of Trans-Membrane Pressure on Permeate Flux and Peptide Transmission in Fractionating MPH

According to the previous results, a flow rate of 23 mL/min was selected to run the UF membrane at different TMPs for the single membrane 10 and 5 kDa and the two-stage 10/5 kDa membrane. Three different TMPs; 0.5, 1.0, and 1.5 bar, with a constant flow rat, were chosen to investigate the effect of TMP on permeate flux and peptide transmission. Figure 5 shows the total permeate flux for MPH using single and two-stage membrane. It was observed that the permeate flux increased with applied TMP, similar to results reported by Tanaka and Usui [41]. The result revealed that using the two-stage 10/5 kDa membrane obtains a high total permeate flux compared to the single-stage membrane (10 and 5 kDa). Total permeate flux for the 5 kDa membrane at 0.5, 1.0, and 1.5 bar were 56.50 ± 0.67, 66.82 ± 0.90, and 82.34 ± 2.19 L/m2 h, respectively. Meanwhile, total permeate flux for the 10 kDa membrane at 0.5, 1.0, and 1.5 bar were 47.33 ± 1.68, 65.56 ± 0.88, and 74.64 ± 1.07 L/m2 h, respectively. The study by Hughes and Field [38] revealed that membrane fouling increased with membrane pore size. Siddiqui et al. [37] also mentioned that increasing the width of pore size distribution deteriorates the membrane performance. This explains why a membrane with a pore size of 5 kDa has higher permeate flux than a 10 kDa membrane at different TMP.
Meanwhile, for the two-stage 10/5 kDa membrane, the total permeate flux at 0.5, 1.0, and 1.5 bar were 59.75 ± 0.72, 89.81 ± 0.46, and 102.31 ± 1.26 L/m2 h, respectively. As discussed above, the higher permeate flux observed in the two-stage 10/5 kDa membrane might be affected by its viscosity. During the first stage of filtration, most macromolecules that could lead to the formation of fouling were removed. This situation made the filtration at the second stage easier because less resistance in the membrane improved the filtration process. As a result, more MPH with MWCO less than 5 kDa could enter the membrane pores.
Peptide transmission of MPH at different TMP using single membrane 10 and 5 kDa and two-stage membrane 10/5 kDa are shown in Figure 6. Peptide transmission of MPH increased linearly with the applied TMP, and also with the permeate flux. Higher peptide transmission for a single membrane was obtained using the 5 kDa membrane for all TMPs. In the 5 kDa membrane, any components or molecules bigger than the pore size will be retained by the membrane. This will cause a lower osmotic pressure difference between feed and permeate solution and, consequently, the diffusion of macromolecules from the membrane surface back into the bulk solution will be slow. Under these conditions, the retained components can precipitate on the membrane surface, leading to the formation of a solid layer, which affects membrane performance by reducing the transmembrane flux and modifying the selectivity of the membrane [48]. Large macromolecules then form a gel layer on the membrane surface, which could affect the membrane separation characteristics by changing the rejection selectivity towards low molecular weight compounds. Another study showed that the increase of pressure had decreased the selectivity of separation for certain peptides. The transmission slowed down for peptides ranging from 0.5–3 kDa, but favored the transmission of peptides lower than 0.5 kDa. This might be due to the increase of pressure, which causes compaction of the secondary dynamic membrane and a decrease of the apparent molecular weight cut-off [49]. In this case, peptide transmission using a low molecular weight membrane size, the 5 kDa membrane, was favored over the 10 kDa membrane.
Meanwhile, the two-stage membrane showed the highest peptide transmission compared to a single membrane. The result obtained was linear with permeate flux. The peptide transmission for 0.5, 1.0, and 1.5 bar were 33.80 ± 0.73%, 56.35 ± 0.18%, and 77.29 ± 3.82%, respectively. An improvement could be observed when using a two-stage membrane, with an increase of 53.20% (using a single 10 kDa membrane) and 17.18% (using a single 5 kDa membrane) of peptide transmission at high TMP. Low viscosity of feed during second stage filtration contributed to low concentration polarization in the membrane. As a result, more peptides could be transmitted through the membrane, which improved the filtration process.

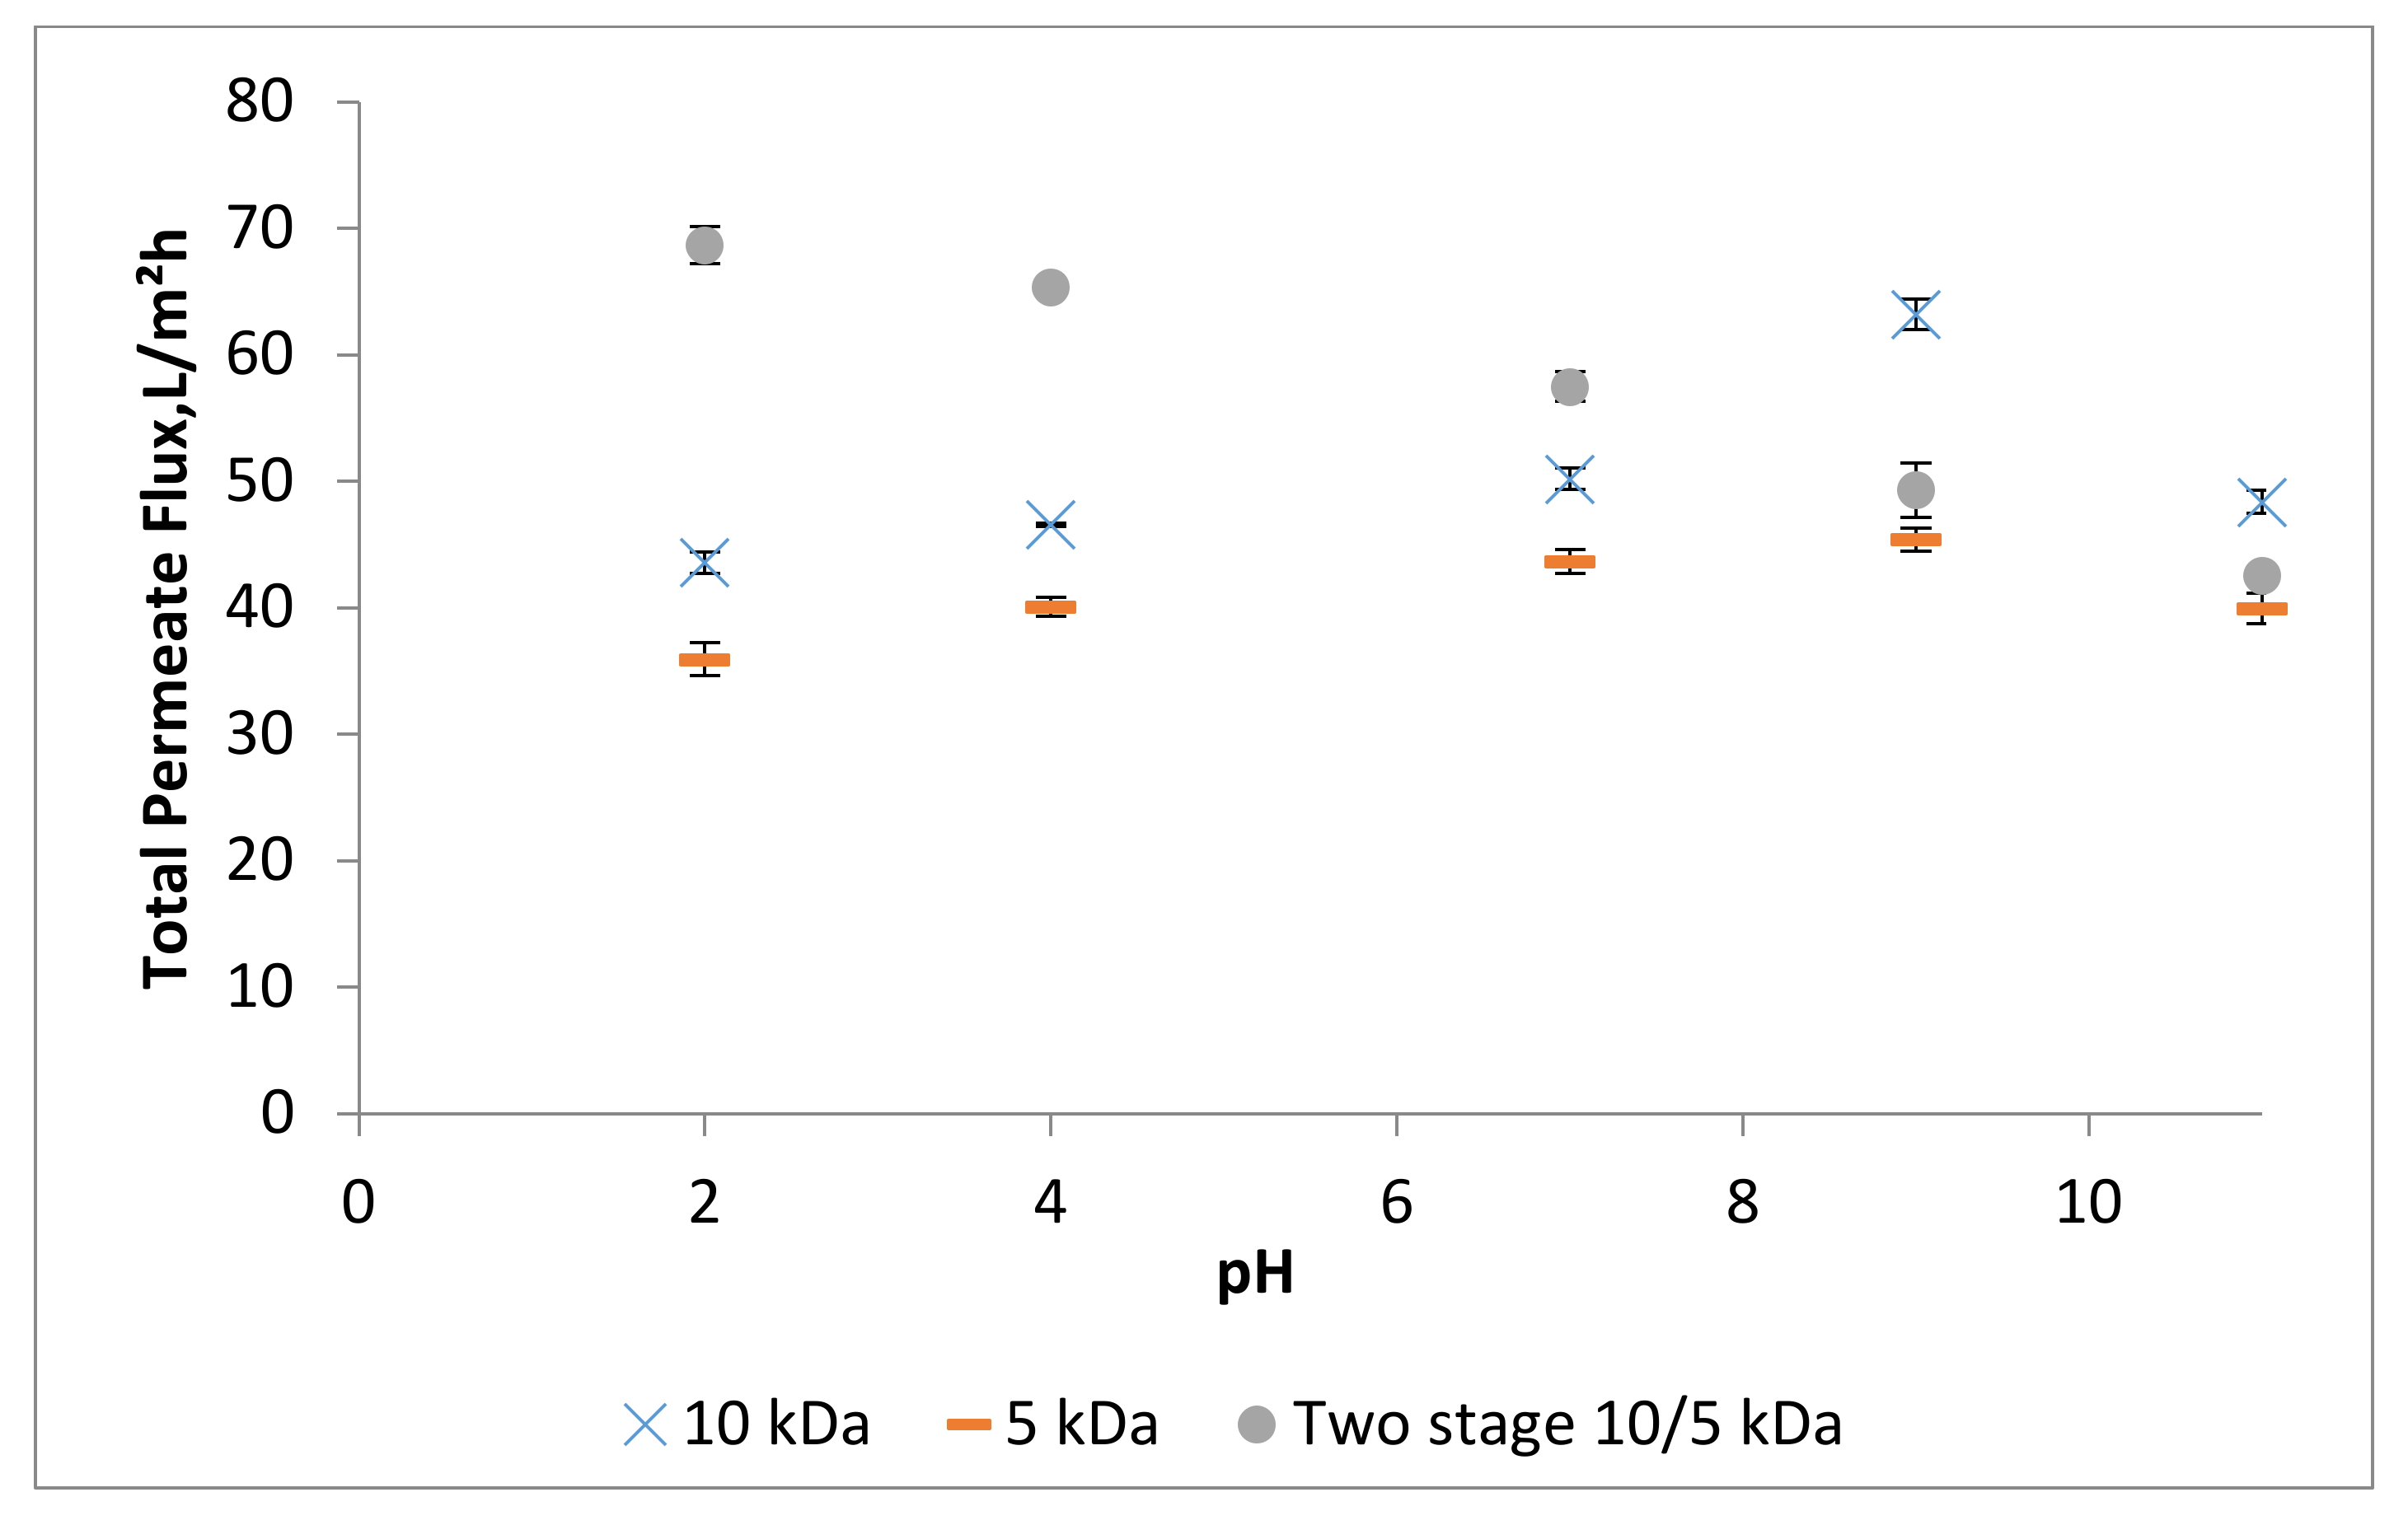
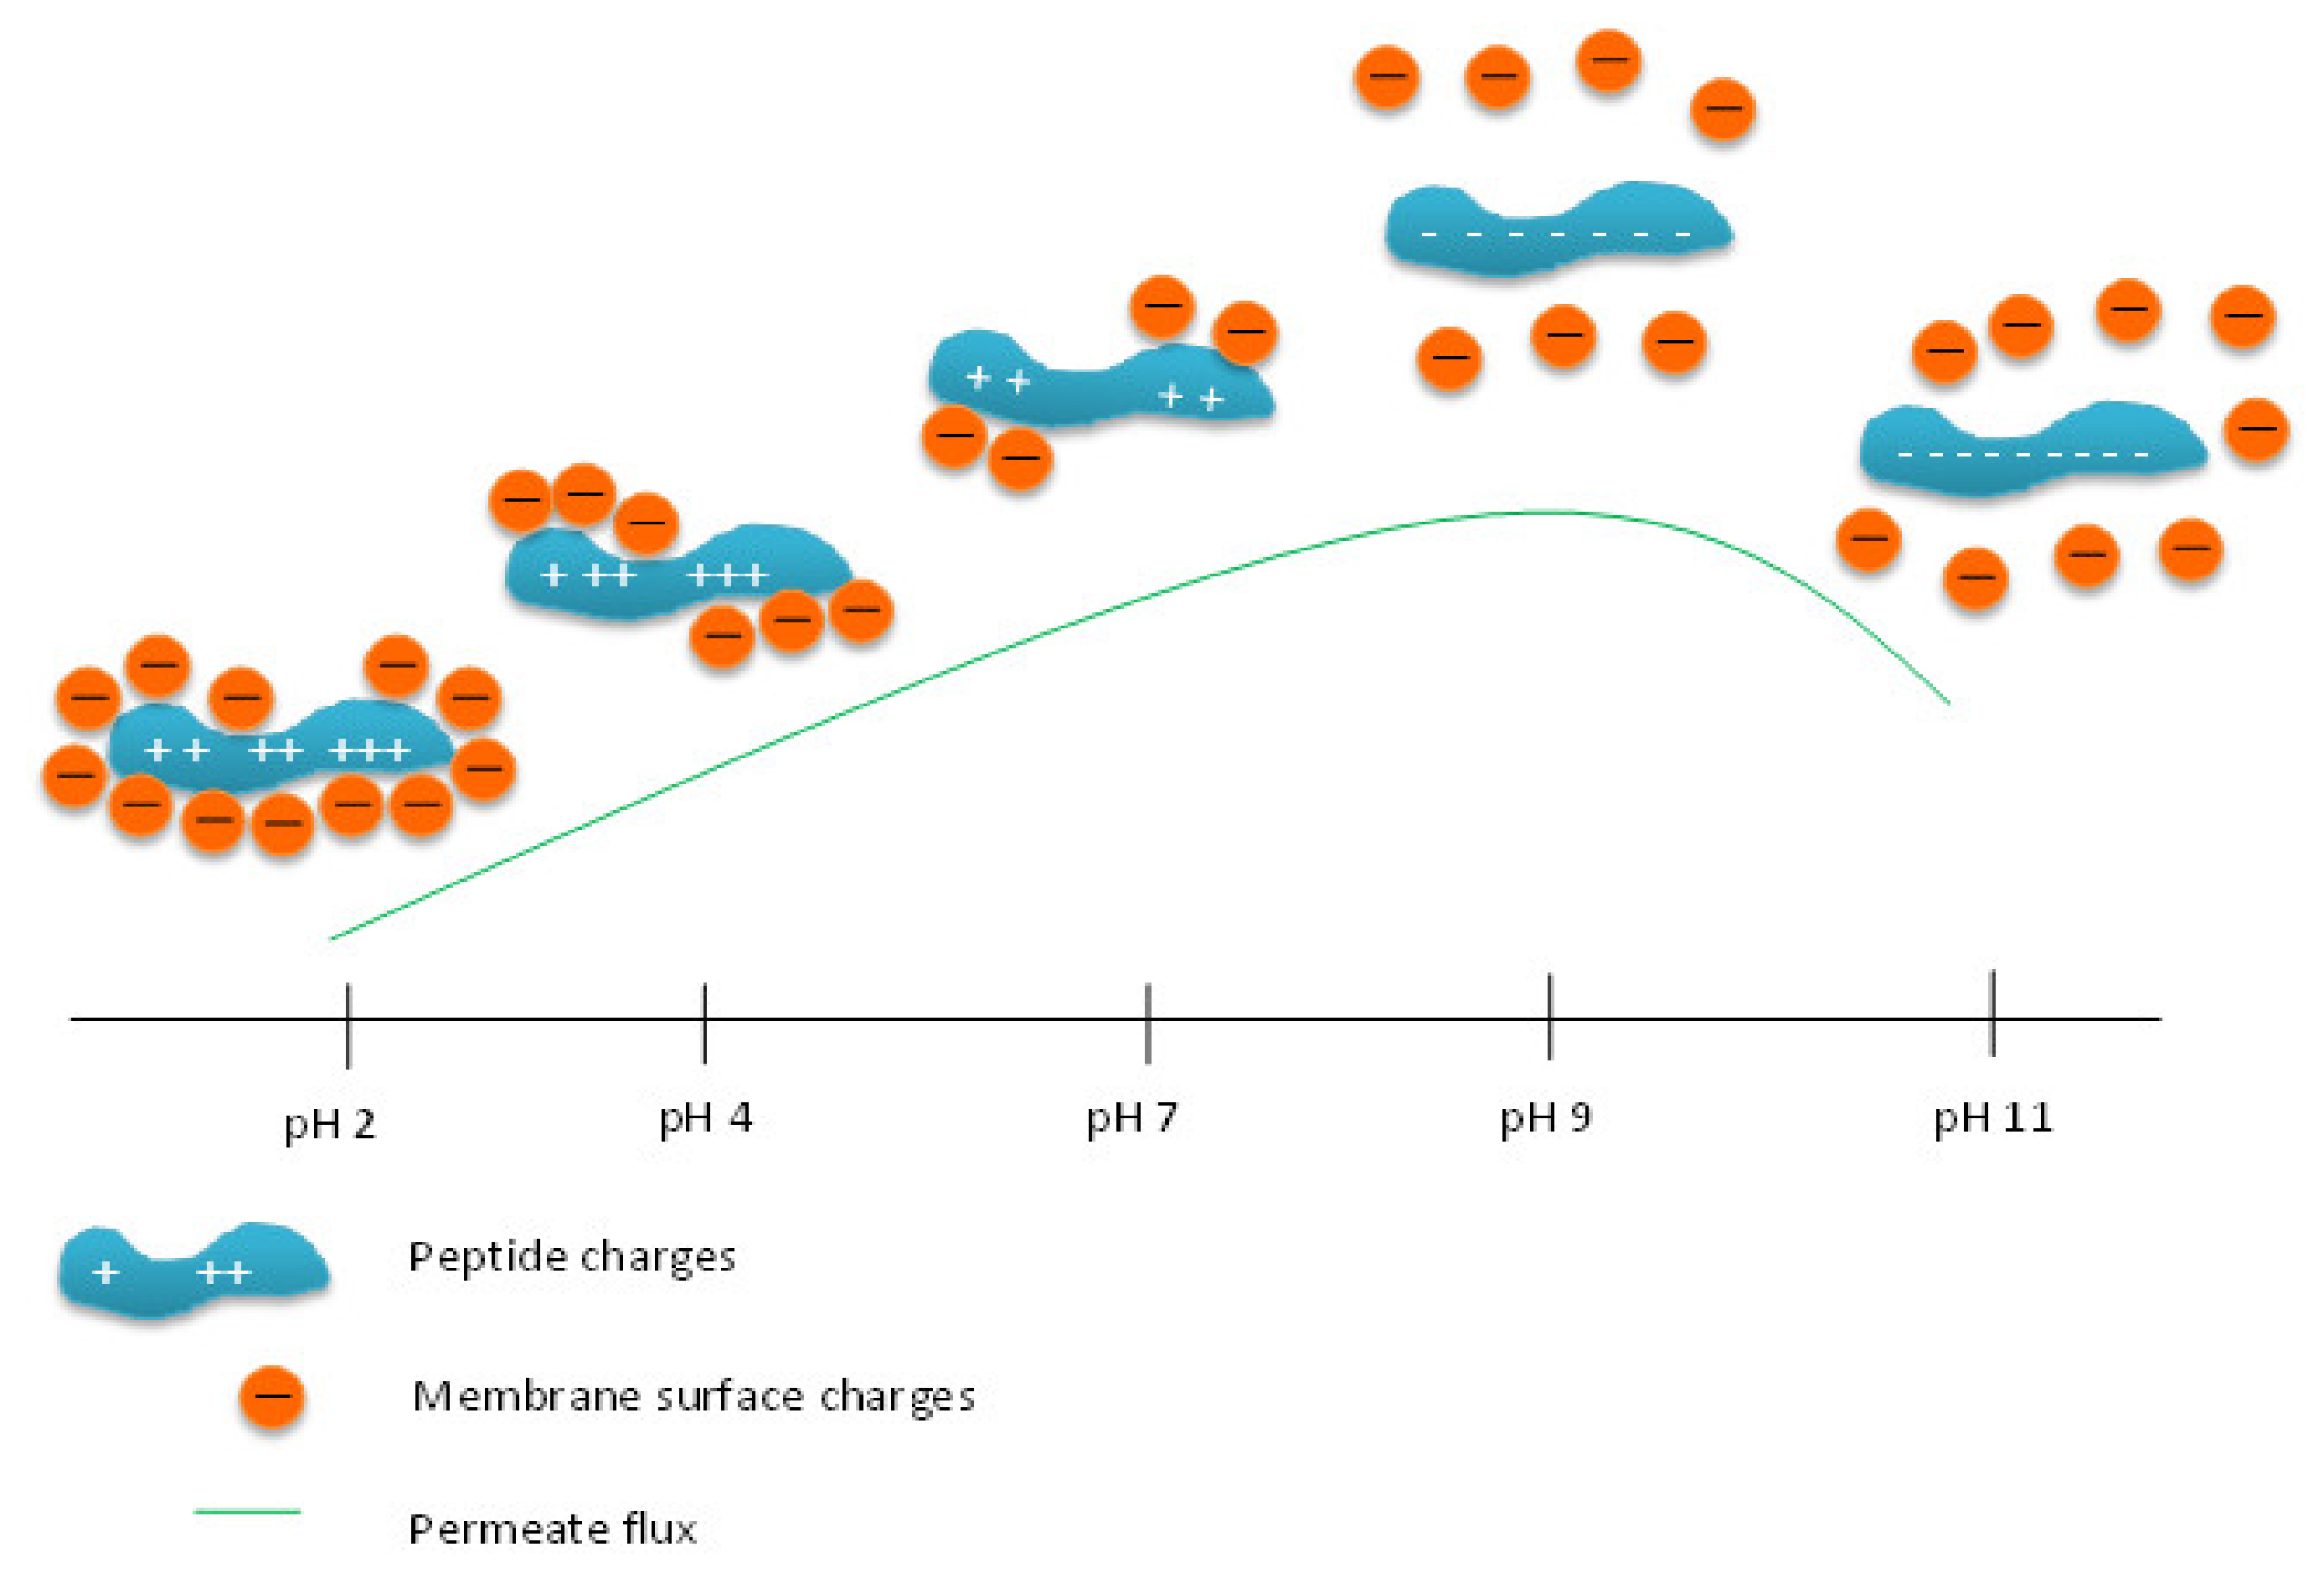
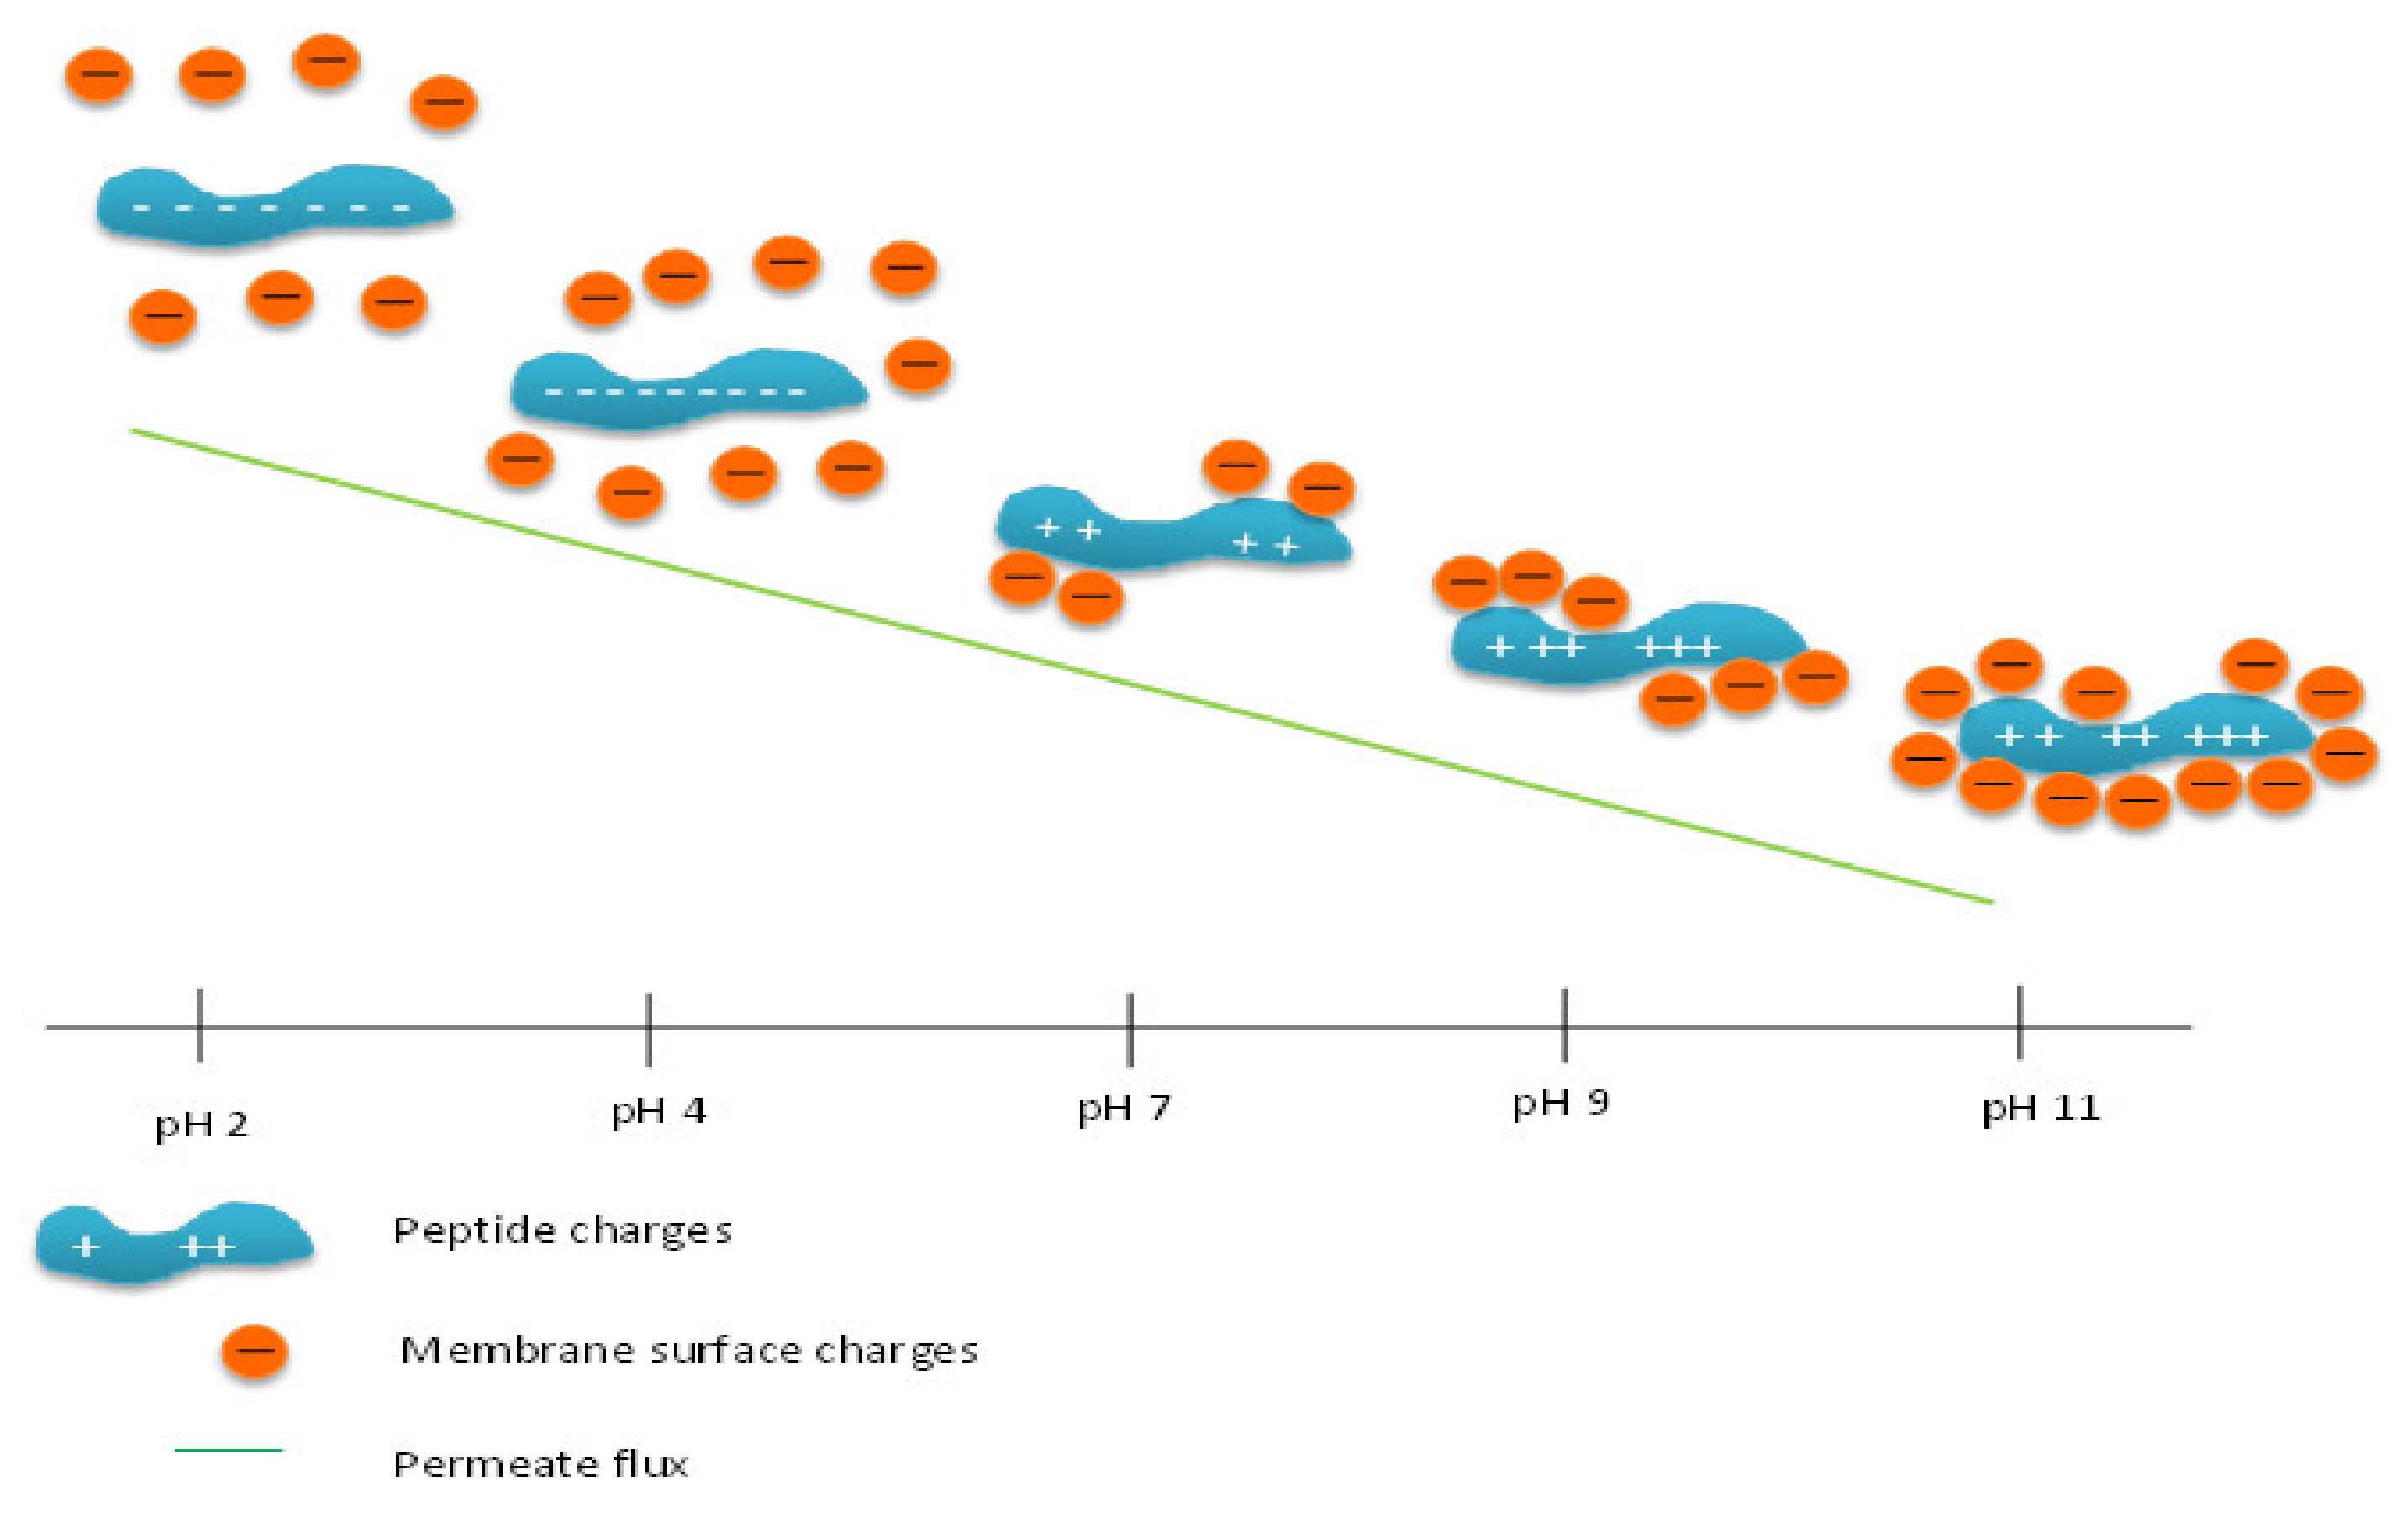
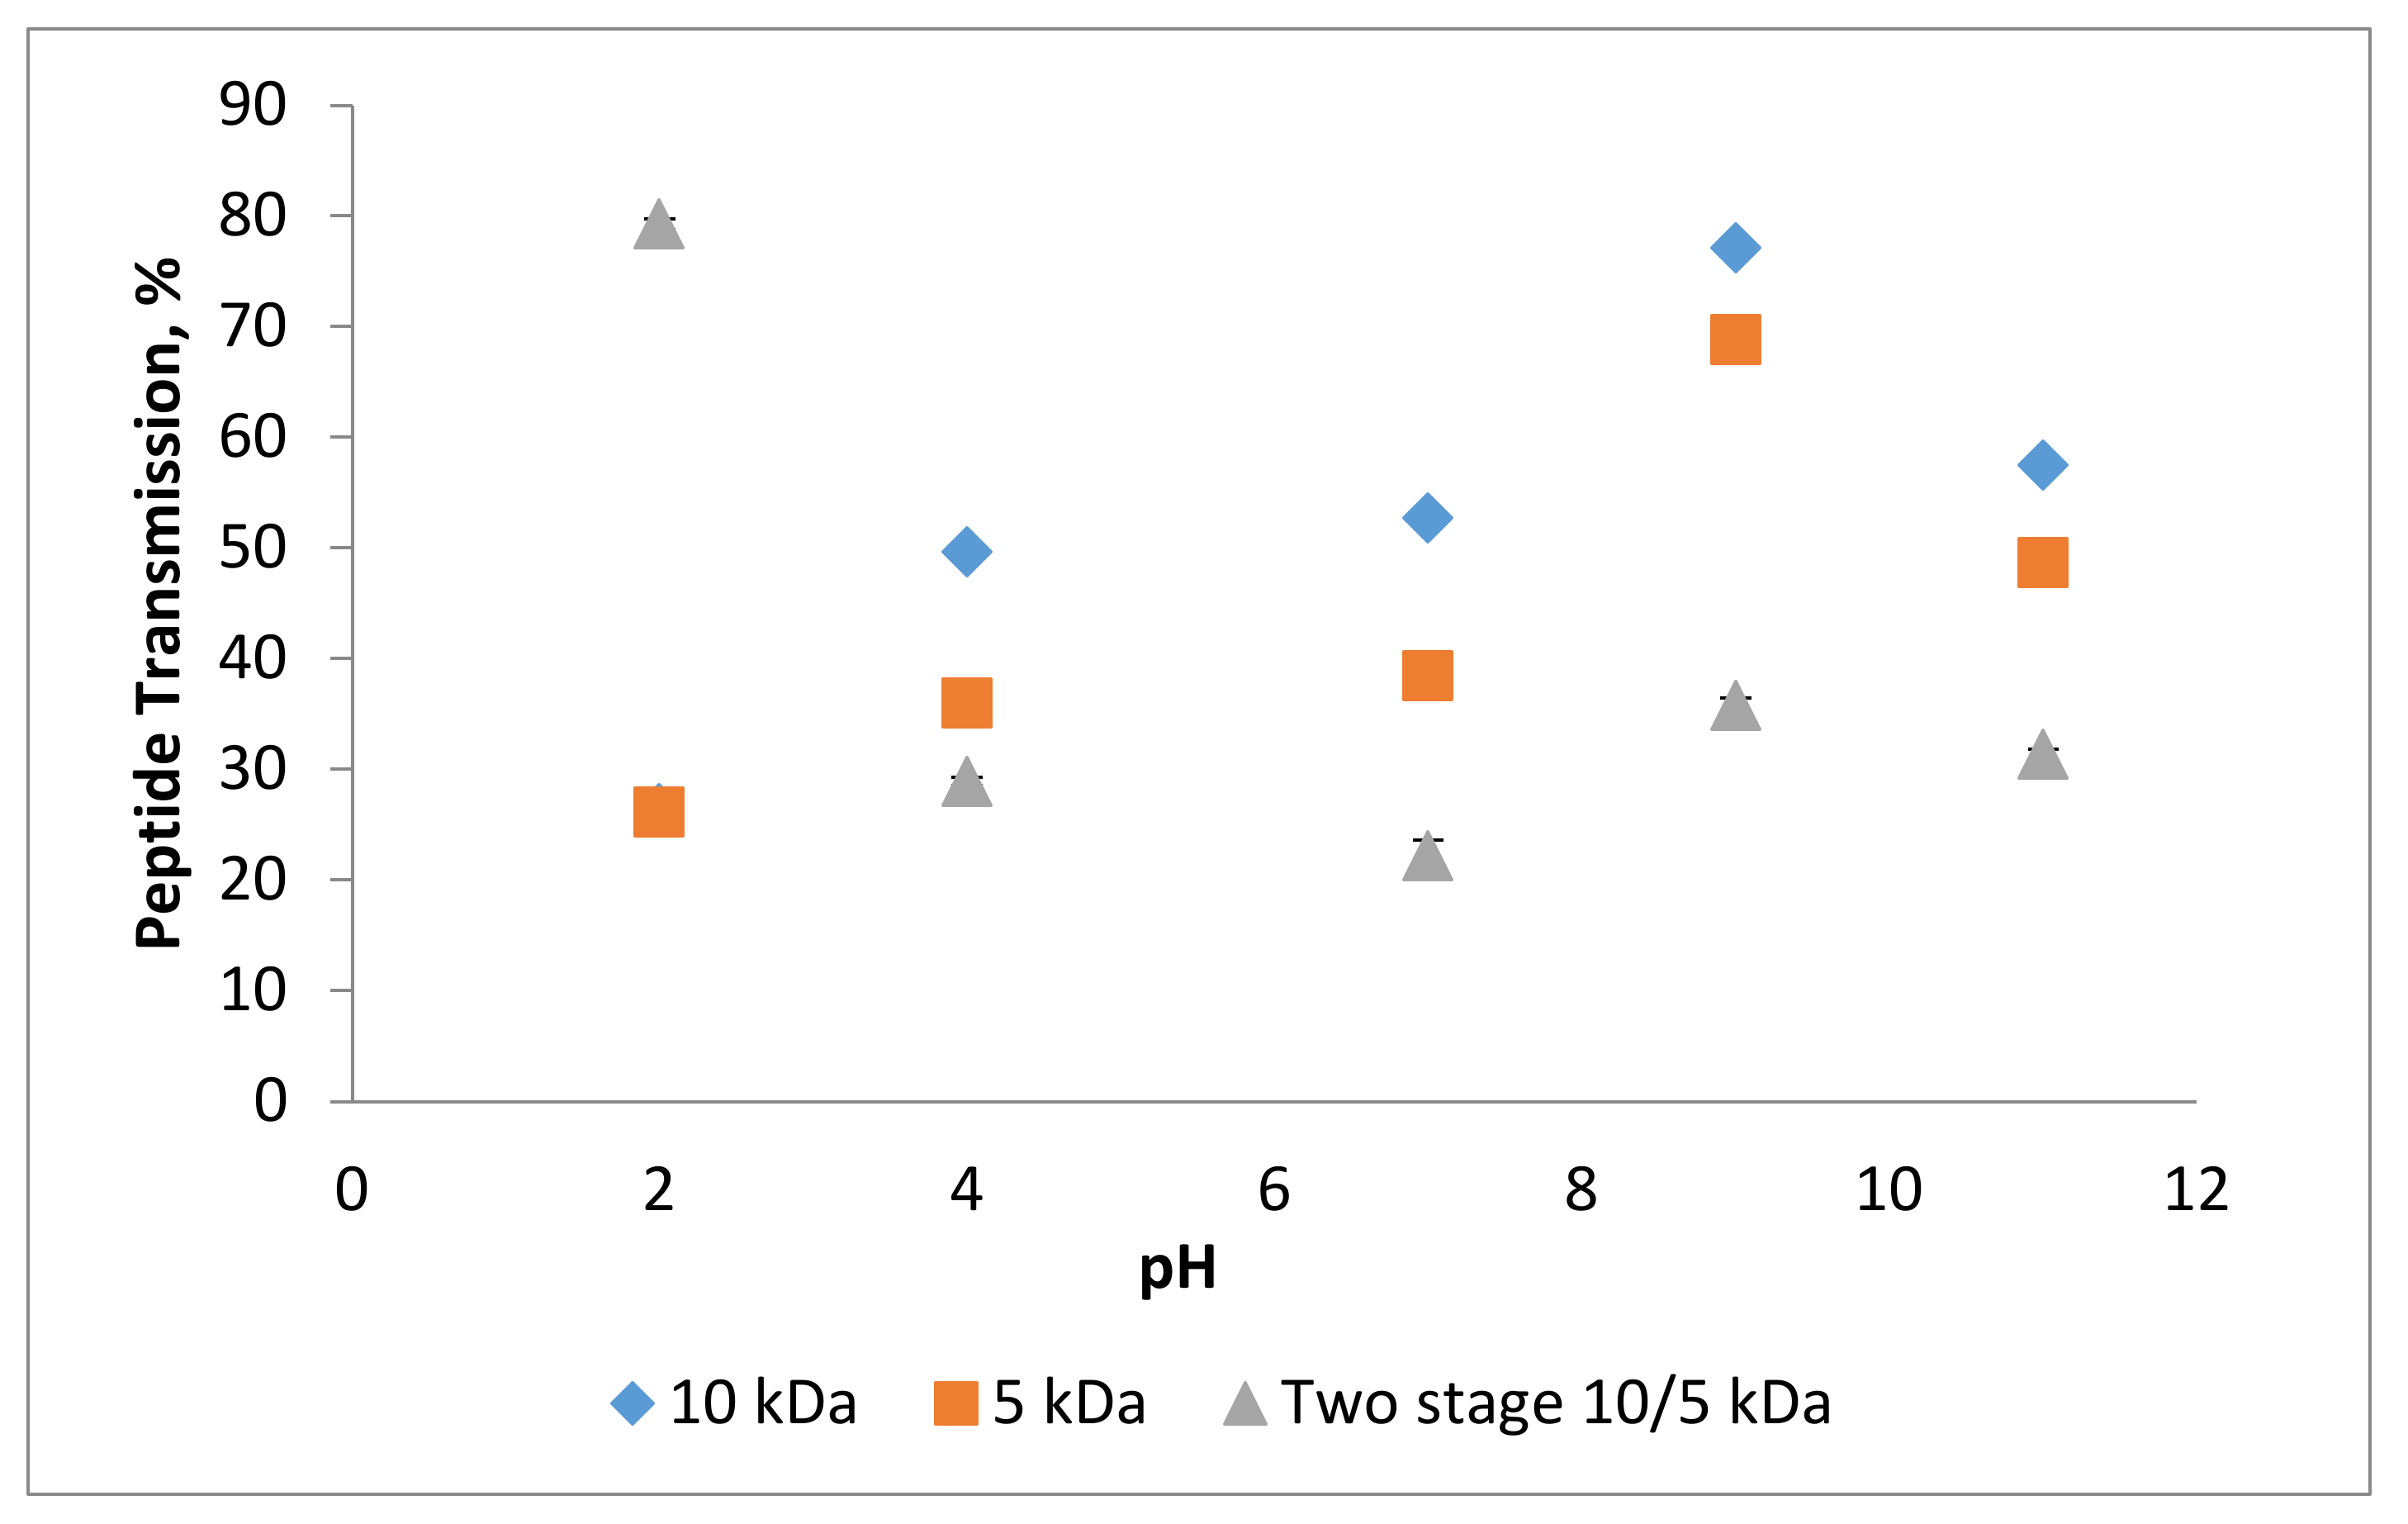
3.3. Effect of pH on Permeate Flux and Peptide Transmission in Fractionating MPH

The pH was the only factor in the UF membrane that could change the chemical structure of the feed solution. Thus, pH is an important parameter in studying the performance of UF membrane. In this study, pH ranges, from acidic to alkaline conditions (pH 2, 4, 7, 9, and 11), were varied at a constant flow rate of 23 mL/min and TMP of 0.5 bar to examine the effects of pH in the separation of MPH. The total permeate flux at different pH solutions is shown in Figure 7. The MPH filtration using the 10 kDa membrane was higher than using the 5 kDa membrane. For the 10 kDa membrane, the lowest flux was obtained at pH 2, with a total permeate flux of 43.60 ± 0.83 L/m2 h. The total permeate flux was increased as the pH increased to pH 4 and 7, with the total permeate flux recorded as 46.60 ± 0.12 and 50.24 ± 0.83 L/m2 h, respectively. At pH 9, a maximum permeate flux with a value of 63.22 ± 1.22 L/m2 h was obtained. A decrease in total permeate flux (48.41 ± 0.89 L/m2 h) was observed as the pH changed to pH 11. A similar trend was observed in MPH filtration using the 5 kDa membrane. The total permeate flux increased significantly from pH 2 (35.97 ± 1.32 L/m2 h) followed by pH 4, 7, and 9, with fluxes of 40.14 ± 0.75, 43.69 ± 0.97, and 45.44 ± 0.90 L/m2 h, respectively. The permeate flux then decreased to 39.98 ± 1.19 L/m2 h at pH 11. It can be seen that pH 9 was suitable for MPH filtration, and the performance of UF membrane decreased as the pH approached either too acidic or too alkaline. This shows that extreme conditions are not favorable for MPH filtration for both types of membrane.
Based on the results, it can be considered that the isoelectric point (IEP) for MPH by using a single membrane is at pH 2. As shown in Figure 8, the permeate flux at pH 2 was the lowest, and permeate flux increased as it moved away from the IEP. As discussed above, the changes in pH value could affect the solubility and conformation of proteins. This shows that the solubility of protein at IEP is low and increased as the pH is adjusted away from it [39]. Low solubility of proteins could enhance the aggregation process and thus increase the fouling phenomena. This will reduce the permeability through the polarized layer near the membrane surface because the protein and peptide molecules occupy the small-sized pores and form a densely packed layer on the membrane [50]. The pore blockage causes the chance of MPH permeating through the membrane to be lower. Apart from this, the changes in pH could also affect the interaction between the protein peptide and the membrane. According to Saidi et al. [51], the membrane is more permeable in an alkaline condition due to the strong electrostatic repulsion between the peptide and membrane, which helpes to increase permeate flux. In this study, a hollow fiber membrane, made from polyethersulfone (PES) material, was used. At low pH or below IEP value, the peptides were positively charged (hydrophobic peptides); meanwhile, the PES membrane was negatively charged (hydrophilic surface). The different charges of peptides and membrane could cause peptide accumulation and thus increase the adsorption of peptides on the membrane surface [40,41,52]. PES is rich in conjugated benzene rings, which provide a potential site for protein-membrane interactions. The protein’s hydrophobic sites that were exposed caused further protein binding, thus leading to an increase of membrane fouling. The extent of adsorptive fouling was also influenced by solute concentration in the feed solution [53]. This explained the reason that the lowest flux was observed at pH 2. As the pH moved away from the IEP, the peptides became negatively charged (hydrophilic peptide) and interacted with the negatively charged membrane. However, this interaction was repulsive and good for the UF membrane as it reduced the accumulation between peptide and membrane. Thus, the membrane permeability was higher and increased the permeate flux. In this study, maximum permeability was achieved at pH 9, which can be attributed to the highest flux. This indicates that filtration of MPH for the 10 and 5 kDa membranes achieved critical flux at pH 9. Nevertheless, the permeate flux decrease at pH 11 might be due to the extreme conditions that cause protein peptide aggregation; this is in agreement with Roslan et al. [30]. An increase in molecular weight cut-off was observed at extremely alkaline conditions (pH > 11). The particle precipitation on the membrane surface might have occurred, and the condition made the membrane unsuitable to continue operation [54].
In contrast, membrane filtration with a two-stage configuration had the highest permeate flux at pH 2. The total permeate flux were decreased from pH 2 followed by pH 4, 7, 9, and 11, with fluxes of 68.71 ± 1.49, 65.38 ± 0.29, 57.54 ± 1.17, 49.34 ± 2.16, and 42.56 ± 0.17 L/m2 h, respectively. It is noticeable that filtration using the two-stage membrane was dominant in the acidic regions. As for the single membrane, the permeation of flux was highly influenced by the charge of the peptide. The peptides of MPH were positively charged and might increase the repulsion force between negatively charged membranes, hence increasing the total permeate flux. However, in the two-stage membrane, the number of charges in the peptide might change. During second stage filtration, peptide with a size larger than 10 kDa has been removed and the MPH only contains peptide with less than 10 kDa. This might contribute to the increasing number of negatively charged peptides in MPH, as shown in Figure 9. Based on the results, pH 11 could be considered as the IEP in which low permeate flux was recorded. As the pH moved away from the IEP (towards the acidic region) the peptides with negative charge might increase the electrostatic repulsion between the negatively charged membrane surfaces. This situation increases the total permeate flux, as seen in the results in which pH 2 had high permeate flux. As the pH moves towards the IEP, the peptides became positively charged and the interaction between the peptide and the membrane surface might increase. This might cause adsorption and accumulation of peptide on the membrane surface and block the pores. Robertson and Zydney [55] also reported that the adsorption was not only due to electrostatic interactions, but also by Van der Waals, hydrophobic, hydrophilic, structural, and steric interactions between the protein and the membrane as well as between the protein molecules. As a result, the permeation rate of flux might possibly decrease. This explains the reason that the total permeate flux decreased as the pH increased in the two-stage membrane.
The effect of pH on peptide transmission of MPH is shown in Figure 10. The same pattern as permeate flux was observed for the single membrane configuration. In the 10 kDa membrane, the lowest flux was obtained at pH 2, with peptide transmission of 26.45 ± 1.23%, followed by pH 4, 7, and 9, with peptide transmissions of 49.62 ± 0.72%, 52.70 ± 1.47%, and 77.10 ± 0.45%. At pH 11, the peptide transmission dropped to 57.48 ± 0.73%. Low peptide transmission was usually associated with low permeate flux. Meanwhile, in the 5 kDa membrane, the peptide transmissions at pH 2, 4, 7, and 9 were 26.16 ± 1.05%, 35.96 ± 0.65%, 38.45 ± 0.18%, and 62.82 ± 0.77%, respectively. A reduction in peptide transmission at pH 11 of about 48.67 ± 0.62% was recorded. As discussed above, pH 2 was found to be the IEP for the MPH filtration. Filtration at the IEP caused the aggregation of protein and fouling on the membrane surface. At the IEP, all the basic amino acids carried positive charges, and their number was equal to the number of negative charges due to the ionization of most of the carboxyl groups. When the pH moved away from the IEP, the basic groups started to deprotonate; meanwhile, more acidic groups ionized and resulted in increasing the net negative charge with the pH. As the repulsive forces increased between protein peptide and membrane surface, the fouling effect could be reduced and increased the transmission of peptide as the pH increased. This trend is illustrated in Figure 10, in which peptide transmission increased as the pH adjusted away from the IEP. Meanwhile, as the pH decreased and dropped below the IEP, the carboxyl group from MPH remained undissociated. This caused the negative charge on the chain and the positive charge from the protonation of amine groups to interact. This interaction enhanced the adsorption of the protein on the membrane surface and reduced the peptide transmission [53]. A low yield in peptide transmission at pH 2 could also be due to the transmission of a significant proportion of protein in permeate and protein participation in membrane fouling, as mentioned by [56]. Besides that, Nanda et al. [57], who studied the effect of pH on the membrane performance, found that any changes in pH could alter the membrane’s density and, hence, result in a change in repulsive force encountered by the retained particles. In the acidic region, a relatively sticky deposit membrane that was difficult to remove was obtained compared to the loose and easily removable deposit formed in the alkaline region. The sticky deposit in the acidic solution made the transmission of peptide through the membrane difficult compared to the alkaline solution. This explains why the peptide transmission was observed to be much lower in the acidic solution than in the alkaline.
For the two-stage 10/5 kDa membrane, the peptide transmission’s trend was not in the same pattern as the permeate flux. The highest peptide transmission was obtained at pH 2 (79.26 ± 0.50%) and decreased at pH 4 (28.91 ± 0.38%) and pH 7 (22.16 ± 1.49%). As the pH approached pH 9, the peptide transmission was increased to 35.79 ± 0.70%, and it dropped to 31.39 ± 0.48% at pH 11. This result decreased significantly from the acidic to the neutral region, which might be related to consistency in the repulsive force between the peptide and the membrane surface. Thus, the transmission of peptide in the acidic region was higher compared to that in the alkaline region. However, when approaching the alkaline region, the transmission of peptide increased slightly from pH 7 to pH 9 and then decreased at pH 11. At pH below the IEP (pH 11) the effect of ionic strength of MPH was shielding the charges on the peptide. If the charges were shielded by the counter ions in the solution, the ranges of both attractive and repulsive electrostatic interactions were reduced. Thus, an increase in peptide transmission was expected at pH 9 [53].

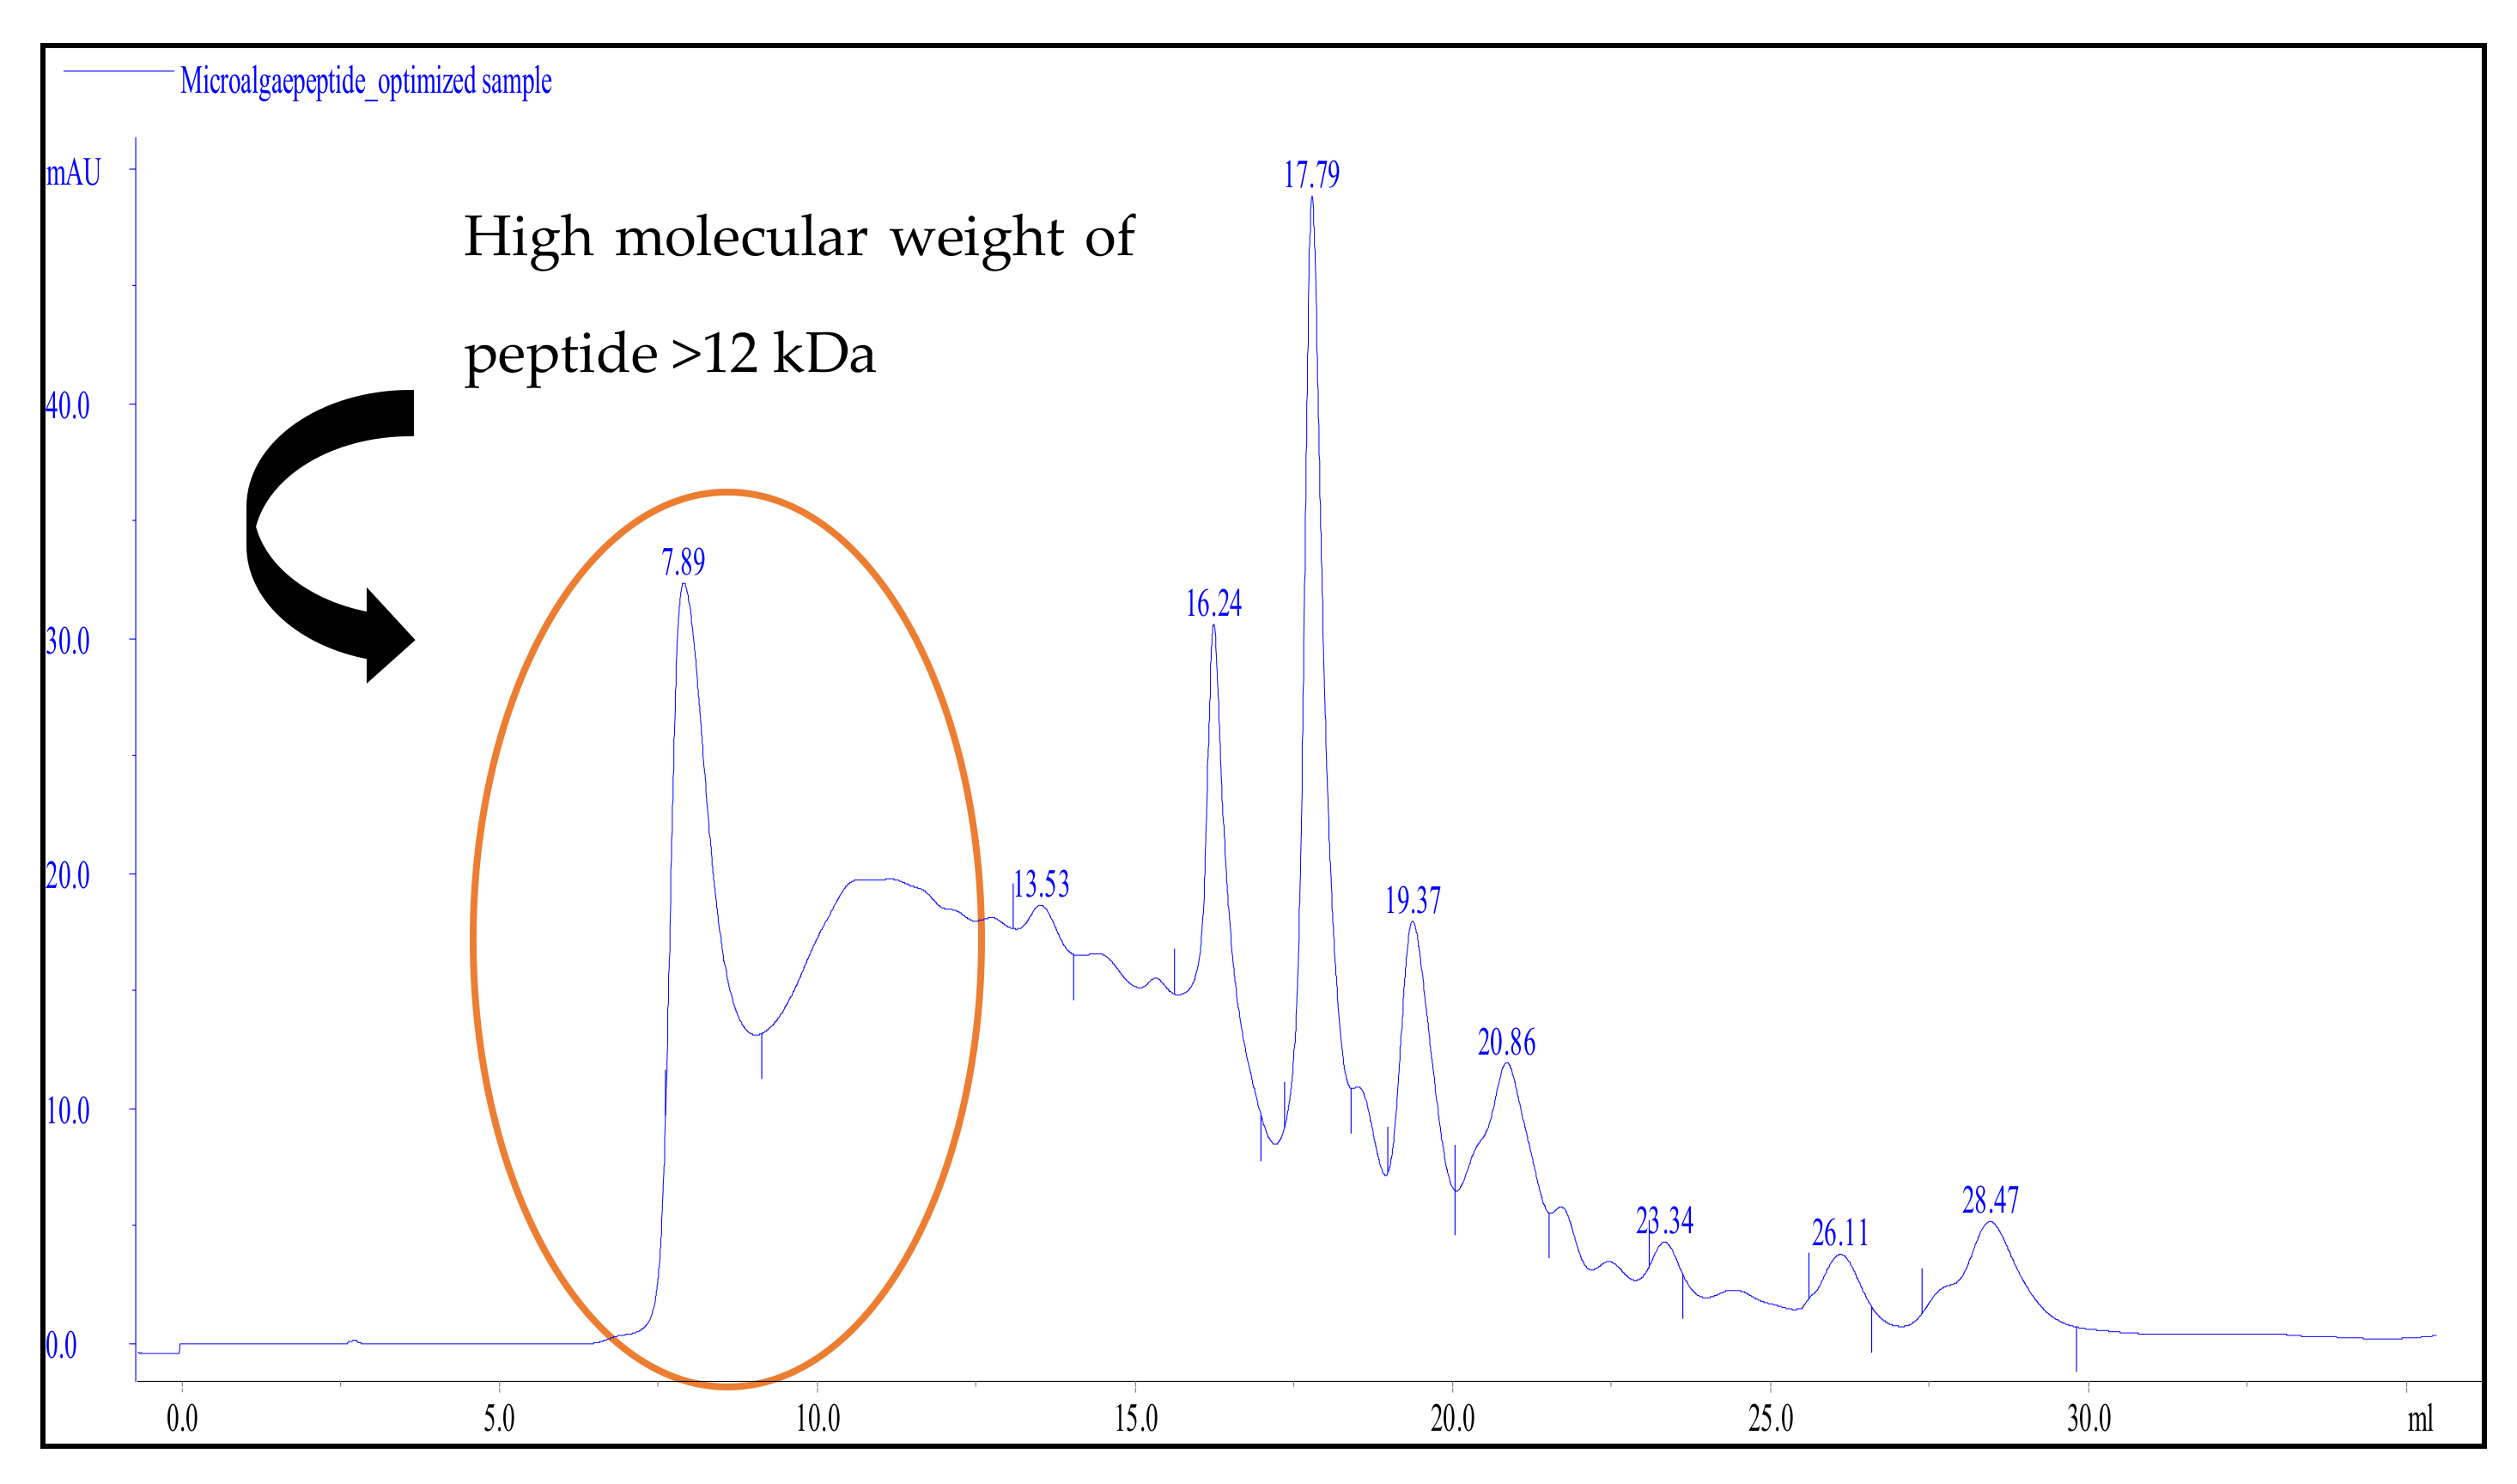
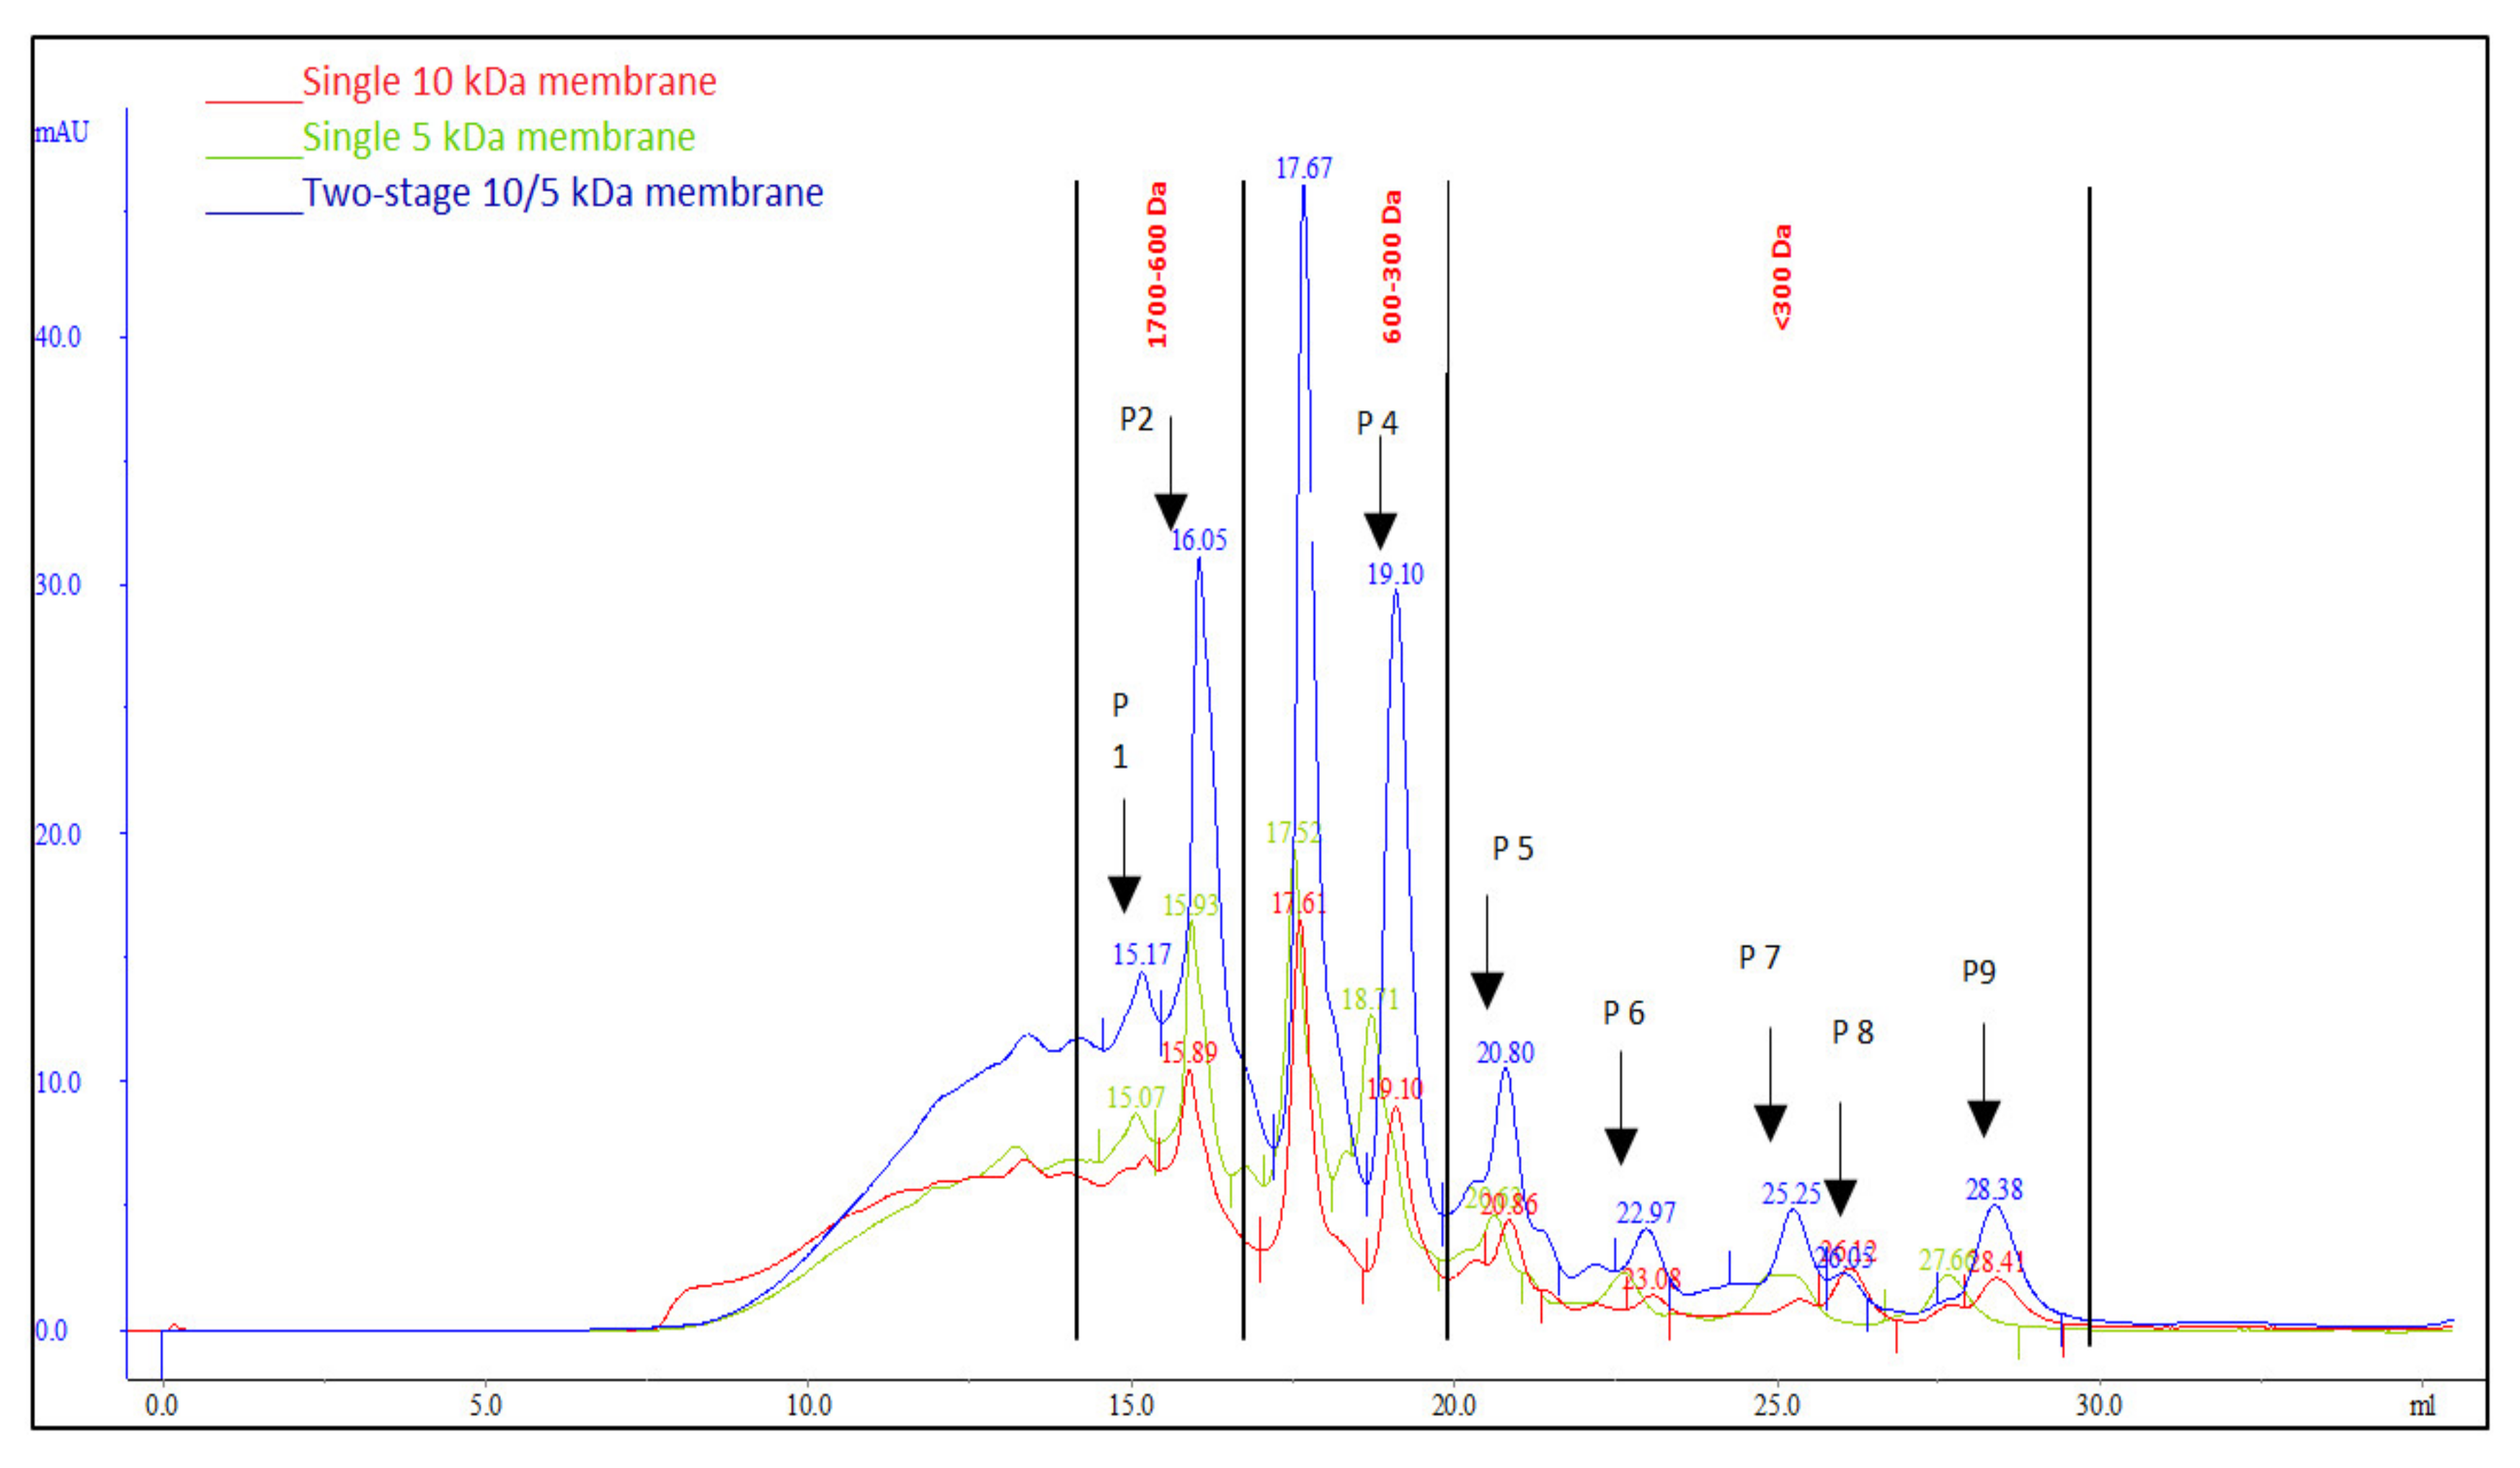
3.4. Peptide Selectivity of MPH Fractionation

The operational parameters of MPH fractionation, which determine the permeate flux, had a significant influence on the retention of peptides and on membrane selectivity of the peptide [58]. Figure 11 and Figure 12 show the FPLC chromatogram of microalgae protein hydrolysate before fractionation and permeate after fractionation using UF membrane, respectively.
The elution profile shows that the fraction of microalgae protein hydrolysate before the UF membrane was resolved into nine main peaks. Based on the principle of size-exclusion chromatography, particles with larger diameters would elute earlier than the smaller particles [59]. The earlier elution for MPH was observed at 7.89 mL and 13.53 mL, which resembled peptide with a molecular weight of more than 12 kDa. However, after passing through the UF membrane, there were no peaks observed before elution at 13.53 mL, and the first elution was observed at 15.89 mL (for the 10 kDa membrane), 15.07 mL (for the 5 kDa membrane), and 15.17 mL (for the two-stage 10/5 kDa membrane). This explains why the application of UF membrane in fractionation of MPH had possibly retained peptide sizes larger than 12 kDa.
Nevertheless, a details study on the effect of membrane pore size and configuration on peptide selectivity has been evaluated, and the results are shown in Table 1. To estimate the molecular weight of the peptide, the column was calibrated with peptides with known molecular weights (GLY-TYR, 238.2 g/mol; VAL-TYR-VAL, 379.5 g/mol; methionine enkephalin acetate, 573.7 g/mol; leucine enkephaline, 555.6 g/mol; angiotensin II actate, 1046.2 g/mol; neurotensin, 1672.92 g/mol; and cytochrome C, 12,327 g/mol) and overlaid with the permeate of MPH chromatogram. There were 7 peaks noticed for the single (10 and 5 kDa) membrane and 9 peaks for the two-stage 10/5 kDa membrane. All permeate from fractionation using UF membrane consisted of peptides with molecular weights less than 1700 Da, which shows that peptides with high molecular weights had been successfully removed, and only peptides with low molecular weights were allowed to pass through the membrane. This shows that the fouling and concentration polarization effect existed during fractionation due to peptide accumulation, which resulted in the formation of a dynamic layer on the membrane surface. As a consequence, peptides with sizes larger than the membrane pore size were unable to pass through the membrane and be detected by the FPLC chromatogram [30].
According to Table 1, all the peaks were divided into three main peptide fractions, consisting of peptide ranges of 1700–600 Da, 600–300 Da, and less than 300 Da. The permeate, either from single or two-stage membrane, were mainly composed of peptides with less than 300 Da. Permeate from the two-stage 10/5 kDa membrane was composed of 77.49% of peptides less than 300 Da, followed by the single membrane 10 kDa, with 75.45%, and 5 kDa, with 75.07%. Performing two-stage membrane fractionation could improve the selectivity towards low molecular weight peptides. If compared to the 5 kDa membrane, permeate from the two-stage membrane had 2.53% peptide size less than 1700 Da, which was lower than the 5 kDa membrane, indicating that, by having two-stage filtration, large peptides could be reduced and smaller peptides increased. A study done by Turgeon and Gauthier [60] found that fractionation of whey protein concentrate hydrolysate using two-step filtration using 30 kDa and 1 kDa was able to produce permeate that was rich with a low molecular weight of peptides less than 2000 Da, together with amino acids. Butylina [61] also reported that two-stage membrane filtration, consisting of ultrafiltraion (10 kDa membrane) in the first stage and nanofiltration (1 kDa) in the second stage, successfully separated and isolated peptide fractions of sweet whey with a molecular weight range of 500 to 1800 Da. For single membrane configurations, it was found that, for the 5 kDa membrane, the total peptide range of 600–300 Da and less than 300 Da was lower compared to the 10 kDa membrane. This was because, when using a membrane with a small pore size (5 kDa), the possibility of a high molecular weight of peptide being retained on the membrane surface was higher, and this would result in difficulty for low molecular weight peptides to pass through the membrane. Hence, less peptides with molecular weights less than 300 Da were noticed in the chromatogram. On the contrary, the 5 kDa membrane had higher composition of peptides less than 1700 Da compared to the 10 kDa membrane, which might be related to the non-detectable peak 1 in the 10 kDa membrane. This could be due to the unsmooth separation of peptides with a similar molecular weight during the analysis.
The performance of MPH fractionation using single and two-stage membrane in terms of selectivity and enrichment of peptide were compared and are shown in Table 2. There was some enrichment of peptide when using the two-stage 10/5 kDa membrane from a peptide fraction range of 1700–600 Da and less than 300 Da, where the fractionation using the two-stage 10/5 kDa membrane was able to increase peptide at peak 2, 5, and 6, with enrichments of 7.14%, 20.18%, and 510.27%, respectively compared to the 10 kDa membrane. Meanwhile, when comparing the two-stage 10/5 kDa with the 5 kDa membrane, fractionation using the two-stage 10/5 kDa membrane managed to enrich peptides with a size of 600–300 Da and less than 300 Da, with enrichments at peak 3 (48.86%) and peak 5 (15.41%). The negative values show that there was no improvement in the peptide fraction. Both comparisons revealed that the fractionation using the two-stage membrane could enrich peptide with a size less than 300 Da, which might have good biological properties. Another study showed that this stepwise ultrafiltration could have high selectivity by enriching the phosphopeptide in the casein permeate used as calcium bioavailability in the small intestine, teeth, and bone mineralization [11]. Roger [62], in their patent, discovered the success of stepwise ultrafiltration in enriching the phospopeptides fraction from milk or milk retentate. The milk hydrolysate was subjected to an ultrafiltration membrane with a MWCO of 10 kDa at the first stage to retain the phosphopeptides while permitting the peptides to pass through it. The milk retentate then underwent the acidification process to disaggregate phospopeptides. At the second stage of the ultrafiltration membrane with a MWCO of 5 kDa, the phospopeptides were separated from their hydrolysis by-products, such as residual enzymes and protein residues. The resulting products were beneficial as therapeutic nourishment and medication, as well as food nutrition. Therefore, it was proved that the two-stage ultrafiltration membrane could be employed to enhance the separation and developed process with high peptide selectivity [11].

4. Conclusions

In conclusion, low molecular weight peptide from microalgae protein hydrolysate of N. gaditana was successfully fractionated using a cross-flow ultrafiltration membrane. The performance of the cross-flow ultrafiltration membrane was influenced by the membrane configuration and operating parameters: flow rate, trans-membrane pressure, and pH of the solution. The best operating parameters in the fractionation of microalgae protein hydrolysate were found at a flow rate of 23 mL/min, a trans-membrane pressure of 1.5 bar, and at pH 9 for both single membranes (10 and 5 kDa). Meanwhile, the best operating parameters in the fractionation of microalgae protein hydrolysate using two-stage (10/5 kDa) ultrafiltration membrane were at a flow rate of 23 mL/min, trans-membrane pressure of 1.5 bar, and pH 9. The two-stage ultrafiltration membrane configuration shows an improvement in terms of permeate flux and peptide transmission compared to the single membrane configuration. A reduction in viscosity of feed during second stage filtration caused a decrease in concentration polarization in the two-stage UF membrane. Thus, more peptides could be transmitted through the membrane and hence improve the filtration process. Membrane fouling and concentration polarization were the major problems in membrane fractionation that reduced the permeate flux and peptide transmission. Thus, a better understanding and control of the operating parameters could improve the fractionation process and hence enrich the yield with low molecular weight peptide.

Author Contributions

Conceptualization, N.I.M.S., W.A.W.A.K.G., S.M.M.K., and R.H.; formal analysis, N.I.M.S.; investigation, N.I.M.S.; methodology, N.I.M.S. and S.M.M.K.; project administration, W.A.W.A.K.G., S.M.M.K., and R.H.; supervision, W.A.W.A.K.G.; writing—original draft preparation, N.I.M.S.; writing—review and editing, W.A.W.A.K.G., S.M.M.K., and R.H.; funding acquisition, W.A.W.A.K.G. All authors have read and agreed to the published version of the manuscript.

Funding

This research was funded by the Engineering and Physical Sciences Research Council through the BEFEW project, grant number EP/P018165/1.

Acknowledgments

Material characterization laboratory and bioreactor engineering laboratory.

Conflicts of Interest

The authors declare no conflict of interest.

References

  1. Chen, C.Y.; Zhao, X.Q.; Yen, H.W.; Ho, S.H.; Cheng, C.L.; Lee, D.J.; Bai, F.W.; Chang, J.S. Microalgae-based carbohydrates for biofuel production. Biochem. Eng. J. 2013, 78, 1–10. [Google Scholar] [CrossRef]
  2. Demirbas, A. Use of algae as biofuel sources. Energy Convers. Manag. 2010, 51, 2738–2749. [Google Scholar] [CrossRef]
  3. Shebis, Y.; Iluz, D.; Kinel-Tahan, Y.; Dubinsky, Z.; Yehoshua, Y. Natural Antioxidants: Function and Sources. Food Nutr. Sci. 2013, 4, 643–649. [Google Scholar] [CrossRef] [Green Version]
  4. De Jesus Raposo, M.F.; de Morais, R.M.S.C.; de Morais, A.M.M.B. Health applications of bioactive compounds from marine microalgae. Life Sci. 2013, 93, 479–486. [Google Scholar] [CrossRef] [PubMed]
  5. Munir, N.; Sharif, N.; Naz, S.; Manzoor, F. Algae: A potent antioxidant source. Sky J. Microbiol. Res. 2013, 1, 22–31. [Google Scholar]
  6. Molino, A.; Iovine, A.; Casella, P.; Mehariya, S.; Chianese, S.; Cerbone, A.; Rimauro, J.; Musmarra, D. Microalgae Characterization for Consolidated and New Application in Human Food, Animal Feed and Nutraceuticals. Int. J. Environ. Res. Public Health 2018, 15, 2436. [Google Scholar] [CrossRef] [PubMed] [Green Version]
  7. De Morais, M.G.; Vaz, B.D.S.; de Morais, E.G.; Costa, J.A.V. Biologically Active Metabolites Synthesized by Microalgae. BioMed Res. Int. 2015, 2015, 1–15. [Google Scholar] [CrossRef] [Green Version]
  8. Korhonen, H.; Pihlanto, A. Bioactive peptides: Production and functionality. Int. Dairy J. 2006, 16, 945–960. [Google Scholar] [CrossRef]
  9. Liu, Y.; Wan, S.; Liu, J.; Zou, Y.; Liao, S. Antioxidant Activity and Stability Study of Peptides from Enzymatically Hydrolyzed Male Silkmoth. J. Food Process. Preserv. 2017, 41, e13081. [Google Scholar] [CrossRef]
  10. Wijesinghe, W.A.J.P.; Jeon, Y.J. Fitoterapia Enzyme-assistant extraction (EAE) of bioactive components: A useful approach for recovery of industrially important metabolites from seaweeds: A review. Fitoterapia 2012, 83, 6–12. [Google Scholar] [CrossRef]
  11. Bazinet, L.; Firdaous, L. Membrane Processes and Devices for Separation of Bioactive Peptides. Recent Pat. Biotechnol. 2009, 3, 61–72. [Google Scholar] [CrossRef] [PubMed]
  12. Fan, J.; He, J.; Zhuang, Y.; Sun, L. Purification and Identification of Antioxidant Peptides from Enzymatic Hydrolysates of Tilapia (Oreochromis niloticus) Frame Protein. Molecules 2012, 17, 12836–12850. [Google Scholar] [CrossRef] [PubMed]
  13. Kumar, P.; Sharma, N.; Ranjan, R.; Kumar, S.; Bhat, Z.F.; Jeong, D.K. Perspective of Membrane Technology in Dairy Industry: A Review. J. Anim. Sci. 2013, 26, 1347–1358. [Google Scholar] [CrossRef] [Green Version]
  14. Firdaous, L.; Dhulster, P.; Amiot, J.; Gaudreau, A.; Lecouturier, D.; Kapel, R.; Lutin, F.; Vézina, L.-P.; Bazinet, L. Concentration and selective separation of bioactive peptides from an alfalfa white protein hydrolysate by electrodialysis with ultrafiltration membranes. J. Membr. Sci. 2009, 329, 60–67. [Google Scholar] [CrossRef]
  15. Microdyn-Nadir. Membrane Filtration Proceses Dead-End vs Cross-Flow Bulletin; Microdyn-Nadir: Wiesbaden, Germany, 2017. [Google Scholar]
  16. Hasan, A.; Peluso, C.R.; Hull, T.S.; Fieschko, J.; Chatterjee, S.G. A surface-renewal model of cross-flow microfiltration. Braz. J. Chem. Eng. 2013, 30, 167–186. [Google Scholar] [CrossRef]
  17. Poulin, J.-F.; Amiot, J.; Bazinet, L. Impact of Feed Solution Flow Rate on Peptide Fractionation by Electrodialysis with Ultrafiltration Membrane. J. Agric. Food Chem. 2008, 56, 2007–2011. [Google Scholar] [CrossRef]
  18. Poulin, J.-F.; Amiot, J.; Bazinet, L. Improved peptide fractionation by electrodialysis with ultrafiltration membrane: Influence of ultrafiltration membrane stacking and electrical field strength. J. Membr. Sci. 2007, 299, 83–90. [Google Scholar] [CrossRef]
  19. Atkinson, A.J.; Wang, J.; Grzebyk, K.; Zhang, Z.; Jung, D.; Zeng, D.; Pollard, A.; Gold, A.; Coronell, O. Scalable fabrication of anti-biofouling membranes through 2-aminoimidazole incorporation during polyamide casting. J. Membr. Sci. 2019, 579, 151–161. [Google Scholar] [CrossRef]
  20. Khairkar, S.R.; Pansare, A.V.; Shedge, A.A.; Chhatre, S.Y.; Suresh, A.K.; Chakrabarti, S.; Patil, V.R.; Nagarkar, A.A. Chemosphere Hydrophobic interpenetrating polyamide-PDMS membranes for desalination, pesticides removal and enhanced chlorine tolerance. Chemosphere 2020, 258, 127179. [Google Scholar] [CrossRef] [PubMed]
  21. Firouzjaei, M.D.; Seyedpour, S.F.; Aktij, S.A.; Giagnorio, M.; Bazrafshan, N.; Mollahosseini, A.; Samadi, F.; Ahmadalipour, S.; Firouzjaei, F.D.; Esfahani, M.R.; et al. Recent advances in functionalized polymer membranes for biofouling control and mitigation in forward osmosis. J. Membr. Sci. 2020, 596, 117604. [Google Scholar] [CrossRef]
  22. Roslan, J.; Kamal, S.M.M.; Yunos, K.F.M.; Abdullah, N. Assessment on multilayer ultrafiltration membrane for fractionation of tilapia by-product protein hydrolysate with angiotensin I-converting enzyme (ACE) inhibitory activity. Sep. Purif. Technol. 2017, 173, 250–257. [Google Scholar] [CrossRef]
  23. Cheang, B.; Zydney, A.L. A two-stage ultrafiltration process for fractionation of whey protein isolate. J. Membr. Sci. 2004, 231, 159–167. [Google Scholar] [CrossRef]
  24. Nor, M.Z.M.; Ramchandran, L.; Duke, M.; Vasiljevic, T. Performance of a Two-Stage Membrane System for Bromelain Separation from Pineapple Waste Mixture as Impacted by Enzymatic Pretreatment and Diafiltration. Food Technol. Biotechnol. 2017, 56, 218–227. [Google Scholar] [CrossRef]
  25. Safi, C.; Liu, D.Z.; Yap, B.H.J.; Martin, G.J.O.; Vaca-Garcia, C.; Pontalier, P.Y. A two-stage ultrafiltration process for separating multiple components of Tetraselmis suecica after cell disruption. J. Appl. Phycol. 2014, 26, 2379–2387. [Google Scholar] [CrossRef] [Green Version]
  26. Agrawal, H.; Joshi, R.; Gupta, M. Isolation and characterisation of enzymatic hydrolysed peptides of green tender sorghum and their antioxidant activities. LWT Food Sci. Technol. 2017, 84, 1–9. [Google Scholar] [CrossRef]
  27. Cheung, R.C.F.; Ng, T.B.; Wong, J.H. Marine Peptides: Bioactivities and Applications. Mar. Drugs 2015, 13, 4006–4043. [Google Scholar] [CrossRef]
  28. Wang, Y.-N.; Tang, C.Y. Fouling of Nanofiltration, Reverse Osmosis, and Ultrafiltration Membranes by Protein Mixtures: The Role of Inter-Foulant-Species Interaction. Environ. Sci. Technol. 2011, 45, 6373–6379. [Google Scholar] [CrossRef]
  29. Zain, M.M.; Mohammad, A.W.; Hairom, N.H.H. Flux and Permeation Behaviour of Ultrafiltration in Sugaring Out Cellulose Hydrolysate Solution: A Membrane Screening. J. Phys. Sci. 2017, 28, 25–38. [Google Scholar] [CrossRef] [Green Version]
  30. Roslan, J.; Kamal, S.M.M.; Yunos, K.F.M.; Abdullah, N. Evaluation on performance of dead-end ultrafiltration membrane in fractionating tilapia by-product protein hydrolysate. Sep. Purif. Technol. 2017, 195, 21–29. [Google Scholar] [CrossRef]
  31. Yunos, K.M.; Field, R. Rejection amplification in the ultrafiltration of binary protein mixtures using sandwich configurations. Chem. Eng. Process. Process Intensif. 2008, 47, 1053–1060. [Google Scholar] [CrossRef]
  32. Church, F.C.; Swaisgood, H.E.; Porter, D.H.; Catignani, G.L. Spectrophotometric Assay Using o-Phthaldialdehyde for Determination of Proteolysis in Milk and Isolated Milk Proteins. J. Dairy Sci. 1983, 66, 1219–1227. [Google Scholar] [CrossRef]
  33. Hernández, M.J.M.; Camañas, R.M.V.; Cuenca, E.M.; Alvarez-Coque, M.C.G. Determination of the protein and free amino acid content in a sample using o-phthalaldehyde and N-acetyl-L-cysteine. Analyst 1990, 115, 1125–1128. [Google Scholar] [CrossRef] [PubMed]
  34. Spellman, D.; McEvoy, E.; O’Cuinn, G.; Fitzgerald, R. Proteinase and exopeptidase hydrolysis of whey protein: Comparison of the TNBS, OPA and pH stat methods for quantification of degree of hydrolysis. Int. Dairy J. 2003, 13, 447–453. [Google Scholar] [CrossRef]
  35. Gerardo, M.L.; Oatley-Radcliffe, D.L.; Lovitt, R.W. Integration of membrane technology in microalgae biorefineries Integration of membrane technology in microalgae biore fi neries. J. Membr. Sci. 2015, 464, 86–99. [Google Scholar] [CrossRef]
  36. Hwang, K.-J.; Liao, C.-Y.; Tung, K.-L. Effect of membrane pore size on the particle fouling in membrane filtration. Desalination 2008, 234, 16–23. [Google Scholar] [CrossRef]
  37. Siddiqui, M.U.; Arif, A.F.M.; Bashmal, S. Permeability-Selectivity Analysis of Microfiltration and Ultrafiltration Membranes: Effect of Pore Size and Shape Distribution and Membrane Stretching. Membranes 2016, 6, 40. [Google Scholar] [CrossRef] [Green Version]
  38. Hughes, D.; Field, R. Crossflow filtration of washed and unwashed yeast suspensions at constant shear under nominally sub-critical conditions. J. Membr. Sci. 2006, 280, 89–98. [Google Scholar] [CrossRef]
  39. D’souza, N.; Wiley, D.E. Whey ultrafiltration: Effect of operating parameters on flux and rejection. In Proceedings of the 5th International Membrane Science and Technology Conference, Sydney, Australia, 10–14 November 2003; pp. 1–6. [Google Scholar]
  40. Tanaka, T.; Yamagiwa, Y.; Nagano, T.; Taniguchi, M.; Nakanishi, K. Relationship between Cake Structure and Membrane Pore Size in Crossflow Filtration of Microbial Cell Suspension Containing Fine Particles. J. Chem. Eng. Jpn. 2001, 34, 1524–1531. [Google Scholar] [CrossRef]
  41. Tanaka, T.; Usui, K. Formation of the Gel Layer of Polymers and Its Effect on the Permeation Flux in Crossflow Filtration ofCorynebacterium glutamicumBroth. Sep. Sci. Technol. 2008, 33, 707–722. [Google Scholar] [CrossRef]
  42. Sofuwani, Z.N.; Aslina, H.S.; Mazlina, M.S. Separation of lactose from raw goat’s milk by cross-flow hollow fiber ultrafiltration membrane. Int. Food Res. J. 2016, 23, 209–219. [Google Scholar]
  43. Taddei, C.; Aimar, P.; Daufin, G.; Sanchez, V. Factors affecting fouling of an inorganic membrane during sweet whey ultrafiltration. Le Lait 1988, 68, 157–176. [Google Scholar] [CrossRef] [Green Version]
  44. Piry, A.; Heino, A.; Kühnl, W.; Grein, T.; Ripperger, S.; Kulozik, U. Effect of membrane length, membrane resistance, and filtration conditions on the fractionation of milk proteins by microfiltration. J. Dairy Sci. 2012, 95, 1590–1602. [Google Scholar] [CrossRef] [PubMed]
  45. Carić, M.Đ.; Milanović, S.D.; Krstić, D.M.; Tekic, M.N. Fouling of inorganic membranes by adsorption of whey proteins. J. Membr. Sci. 2000, 165, 83–88. [Google Scholar] [CrossRef]
  46. Bacchin, P.; Aimar, P.; Field, R. Critical and sustainable fluxes: Theory, experiments and applications. J. Membr. Sci. 2006, 281, 42–69. [Google Scholar] [CrossRef] [Green Version]
  47. Suwal, S. Fractionation of Peptides from Protein Hydrolysate by Electrodialysis with Filtration Membrane: Process Optimization, Fouling Characterization and Control. Ph.D. Thesis, Laval University, Québec, QC, Canada, 2015. [Google Scholar]
  48. Cassano, A. Recovery Technologies for Water-Soluble Bioactives: Advances in Membrane-Based Processes. In Engineering Foods for Bioactives Stability and Delivery. Food Engineering Series; Roos, Y.H., Livney, Y.D., Eds.; Springer: New York, NY, USA, 2017; pp. 51–83. [Google Scholar]
  49. Chabeaud, A.; Vandanjon, L.; Bourseau, P.; Jaouen, P.; Chaplain-Derouiniot, M.; Guérard, F. Performances of ultrafiltration membranes for fractionating a fish protein hydrolysate: Application to the refining of bioactive peptidic fractions. Sep. Purif. Technol. 2009, 66, 463–471. [Google Scholar] [CrossRef]
  50. Das, R.; Bhattacherjee, C.; Ghosh, S. Effects of operating parameters and nature of fouling behavior in ultrafiltration of sesame protein hydrolysate. Desalination 2009, 237, 268–276. [Google Scholar] [CrossRef]
  51. Saidi, S.; Deratani, A.; Ben Amar, R.; Belleville, M.-P. Fractionation of a tuna dark muscle hydrolysate by a two-step membrane process. Sep. Purif. Technol. 2013, 108, 28–36. [Google Scholar] [CrossRef]
  52. Pouliot, Y.; Wijers, M.; Gauthier, S.; Nadeau, L. Fractionation of whey protein hydrolysates using charged UF/NF membranes. J. Membr. Sci. 1999, 158, 105–114. [Google Scholar] [CrossRef]
  53. Lim, Y.P.; Mohammad, A.W. Influence of pH and Ionic Strength during Food Protein Ultrafiltration: Elucidation of Permeate Flux Behavior, Fouling Resistance, and Mechanism. Sep. Sci. Technol. 2012, 47, 446–454. [Google Scholar] [CrossRef]
  54. Andrade, L.H.; Pires, W.L.; Grossi, L.B.; Aguiar, A.O.; Amaral, M.C. Integration of two-stage nanofiltration with arsenic and calcium intermediate chemical precipitation for gold mining effluent treatment. Environ. Technol. 2019, 40, 1644–1656. [Google Scholar] [CrossRef]
  55. Robertson, B.C.; Zydney, A.L. Protein adsorption in asymmetric ultrafiltration membranes with highly constricted pores. J. Colloid Interface Sci. 1990, 134, 563–575. [Google Scholar] [CrossRef]
  56. Fouzia, Y.; Abdelouahab, N.; Amal, K.; Slimane, B. Whey Ultrafiltration: Effect of pH on Permeate Flux and Proteins Retention. World Appl. Sci. J. 2015, 33, 744–751. [Google Scholar]
  57. Nanda, D.; Tung, K.-L.; Li, Y.-L.; Lin, N.-J.; Chuang, C.-J. Effect of pH on membrane morphology, fouling potential, and filtration performance of nanofiltration membrane for water softening. J. Membr. Sci. 2010, 349, 411–420. [Google Scholar] [CrossRef]
  58. Muro, C.; Riera, F.A.; Fernandez, A. Advancements in the Fractionation of Milk Biopeptides by Means of Membrane Processes. In Bioactive Food Peptides in Health and Disease; IntechOpen: London, UK, 2013; pp. 241–266. [Google Scholar]
  59. Collins, L.A.; Mirza, S.P.; Kissebah, A.H.; Olivier, M. Integrated approach for the comprehensive characterization of lipoproteins from human plasma using FPLC and nano-HPLC-tandem mass spectrometry. Physiol. Genom. 2010, 40, 208–215. [Google Scholar] [CrossRef] [PubMed] [Green Version]
  60. Turgeon, S.L.; Gauthier, S.F. Whey Peptide Fractions Obtained with a Two-Step Ultrafiltration Process: Production and Characterization. J. Food Sci. 1990, 55, 106–110. [Google Scholar] [CrossRef]
  61. Butylina, S.; Luque, S.; Nyström, M. Fractionation of whey-derived peptides using a combination of ultrafiltration and nanofiltration. J. Membr. Sci. 2006, 280, 418–426. [Google Scholar] [CrossRef]
  62. Brule, G.; Roger, L.; Fauquant, J.; Piot, M. Phosphopeptides from casein-based raw material. United States Patent 4980450, 25 December 1990. [Google Scholar]
Figure 1. Schematic diagram of cross-flow ultrafiltration membrane.
Processes 09 00610 g001
Figure 2. Standard curve serine for measuring peptide content.
Processes 09 00610 g002
Figure 3. Total permeate flux at different feed flow rate for single and two stage ultrafiltration (UF) membrane.
Processes 09 00610 g003
Figure 4. Peptide transmission at different feed flow rates for single and two stage UF membrane.
Processes 09 00610 g004
Figure 5. Total permeate flux at different trans-membrane pressures for single and two-stage UF membranes.
Processes 09 00610 g005
Figure 6. Peptide transmission at different trans-membrane pressure for single and two stage UF membrane.
Processes 09 00610 g006
Figure 7. Total permeate flux at different pH for single and two stage UF membrane.
Processes 09 00610 g007
Figure 8. Schematic drawing of peptide structure and membrane surface state for single membrane.
Processes 09 00610 g008
Figure 9. Schematic drawing of peptide structure and membrane surface state for the two-stage membrane.
Processes 09 00610 g009
Figure 10. Peptide transmission at different pH for single and two stage UF membranes.
Processes 09 00610 g010
Figure 11. Fast Pressure Liquid Chromatography (FPLC) chromatogram of microalgae protein hydrolysate before fractionation using ultrafiltration membrane at a wavelenghth of 734 nm.
Processes 09 00610 g011
Figure 12. FPLC chromatogram of microalgae protein hydrolysate after fractionation using ultrafiltration membrane for single (10 and 5 kDa membrane) and two-stage 10/5 kDa membranes at a wavelength of 734 nm.
Processes 09 00610 g012
Table 1. Peptide composition of microalgae protein hydrolysate (MPH) at different membrane configurations.
Peptide Compositions (%)
Membrane configurations105Two-stage 10/5 kDa
Peptide fraction (1700–600 Da)
Peak 1 (1672.92 Da)ND2.250.73
Peak 2 (1672.92 Da)1.684.821.80
Peptide fraction (600–300 Da)
Peak 319.7312.2418.22
Peak 43.145.621.76
Peptide fraction (<300 Da)
Peak 525.4226.4730.55
Peak 62.6326.9816.05
Peak 7NDND10.64
peak 825.90ND2.40
peak 921.4921.6217.86
Total (1700–600 Da)1.687.072.53
Total (600–300 Da)22.8717.8619.98
Total (<300 Da)75.4575.0777.49
ND = not detected.
Table 2. Enrichment of peptide using two-stage membrane.
Enrichment of Peptide Using Two-Stage Membrane (%)
Membrane configurations10 kDa vs. Two-stage 10/5 kDa5 kDa vs. Two-stage 10/5 kDa
Peptide fraction (1700–600 Da)
Peak 1 (1672.92 Da)-−67.56
Peak 2 (1672.92 Da)7.14−62.66
Peptide fraction (600–300 Da)
Peak 3−7.6548.86
Peak 4−43.95−68.68
Peptide fraction (<300 Da)
Peak 520.1815.41
Peak 6510.27−40.51
Peak 7--
peak 8−90.73-
peak 9−16.89−17.39
Total (1700–600 Da)50.60−64.21
Total (600–300 Da)−12.6411.87
Total (<300 Da)2.683.22
Publisher’s Note: MDPI stays neutral with regard to jurisdictional claims in published maps and institutional affiliations.

