Abstract
The effects of water jet height and end dipping on cooling rate and hardenability in the Jominy end quench test were investigated to understand the Jominy test in more detail. Experimental tests were conducted under end dipping cooling condition as well as for specific water jet heights of 35, 65, and 100 mm. The thermal behavior and mechanical properties of the Jominy specimen with region were evaluated using thermocouples and hardness measurements, respectively. The effect of the water jet height on the thermal and hardness behaviors was not large; especially, the influence of water jet height was negligible when the water jet height was over 50 mm. These observations indicate that the uncertainty of the water jet height is not important during the standard Jominy end quench test. Meanwhile, during the standard Jominy test, we cannot neglect the heat flow along the radial direction of the specimen because the temperature difference between the center and surface area was not small; the maximum temperature difference was approximately 50 °C. Based on the comparative study between the standard Jominy cooling and the end dipping cooling processes, the thermal gradient along the radial direction of the specimen can be reduced with the more stable cooling condition on the Jominy end. However, the effect of temperature deviation along the radial direction of the Jominy specimen on the hardness distribution along the longitudinal direction was not large, which shows the high reliability of the Jominy end quench test.
1. Introduction
Hardenability is defined as the hardening depth of a material after heat treatment. It is one of the crucial indicators for selecting the material in industrial fields. The end quench hardenability test, or the Jominy end quench test [1], is a common and reliable method to quantitatively evaluate the hardenability of materials, thus it is widely used for many alloys such as steel [2], aluminum [3], titanium [4], copper [5], and zirconium [6]. According to ASTM A255 [7], the cylindrical specimen of 101.6 mm in length and 25.4 mm in diameter is austenitized in a furnace, and then one end, i.e., quenched end, is exposed to the specified water jet of height 65 mm. After cooling, the hardenability is evaluated by measuring the hardness along the longitudinal direction of a specimen.
To understand the Jominy end quench test, many researchers have studied the overall phenomena of heat transfer; the phase transformation of austenite; and the estimation of hardness with distance from the quenched end during the Jominy test via the mathematical model, numerical algorithm, experimental test, empirical approach, continuous cooling transformation (CCT) diagram, and finite element (FE) method [2,8,9,10,11,12,13,14,15]. Homberg [8] presented a numerical algorithm for simulating the Jominy end quench test and deriving a CCT diagram based on a model for the diffusive austenite-pearlite coupled with the non-diffusive austenite-martenite phase transition. Additionally, the model was validated using the two plain carbon steels. Lee et al. [10] developed a kinetics model for austenite decomposition in a 1045 steel based on the FE method. They reported that the developed model predicts the microstructure and hardness more accurately compared to the previous models by Li et al. [2] based on the experimental comparison of microstructures and hardness using the Jominy end quench test. They insisted that this is due to the used customized kinetics model based on the real measured kinetic data. Chen et al. [12] investigated the correlation among hardness, cooling rate, and microstructure of a marine crankshaft S34MnV steel using the Jominy end quenching test and CCT test. They showed that the specimen cools at a faster rate near the quenched end, resulting in high hardness with generating the martensite phase. As the distance increases from the quenched end of the sample, the cooling rate decreases, resulting in the lower hardness with the lower hardness microstructures such as bainite, pearlite, and ferrite. Nunura et al. [11] investigated the effect of austenitizing temperature on the hardenability of American Iron and Steel Institute (AISI) 1045 steel using Jominy end quench test based on both the numerical and experimental approaches. They showed that the Jominy hardness profile increased with increasing austenitizing temperature, and they obtained the equations by regression numerical methods to estimate the phases and hardness. Irani et al. [15] proposed a practical method for adjusting and optimizing isothermal transformation (IT) diagrams using the Jominy test based on a FE optimization procedure, and they proved the feasibility and reliability of the method using the standard Jominy test of AISI 52100 bearing steel, including temperature, hardness, and phase fraction. Most of the studies on the Jominy end quench test have focused on the estimation of the hardness and microstructures of the specimen along the longitudinal direction.
Meanwhile, the heat transfer coefficient on the quenched end surface is important because the cooling starts from the end of a specimen [16,17,18]. Therefore, cooling conditions such as the height of water jet, temperature of water, and surface roughness of a specimen are of great importance in the Jominy end quench test. In particular, the height of water jet has a dominant effect on the cooling rate of the specimen. However, there are some errors in setting the water jet height in experiments due to the measurement difficulties, which leads to uncertainty in the results of temperature and hardness. Therefore, it is necessary to evaluate the influence of water jet height on the cooling performance of a specimen to obtain reliable experimental data. Cakir and Ozsoy [19] reported that the hardenability decreases in AISI 1050 steel when the height of water jet decreases from 65 mm to 32.5 mm. They also showed that the hardenability formed by the air–water mixture in the Jominy sample was higher than the hardenability formed during standard cooling process based on the temperature measurement and microstructural evolution. Hardenability increased with the accelerating heat transfer from the quenched end by the air–water mixture cooling media. While only a few studies evaluate the effect of water jet height on the Jominy end quench test, there are many studies on impinging jets because they are encountered in many industrial cooling processes. For instance, several researchers [20,21,22] have studied the influence of the distance between the nozzle and object on the local Nusselt number by impinging jets. Their results indicate that the local heat transfer decreases when the distance increases, which means that the cooling rate will increase with an increase in the water jet height during the Jominy end quench test.
Meanwhile, in the Jominy test, the hardenability of a material is mainly evaluated by measuring the hardness along the longitudinal direction of a specimen from the quenched end, indicating that only the lengthwise temperature gradient of the specimen is considered to evaluate the hardenability. In other words, the Jominy test assumes that the radial heat flow of the specimen is negligible [2,3,6,8,23,24]. Newkirk and MacKenzie [3] suggested that heat transfer along the radial direction of a specimen is insignificant based on the result of hardness profile along the radial direction of the specimen. However, few researchers such as Masson et al. [17], Chen et al. [16], and Pietrzyk and Kuziak [25] considered the different heat transfer characteristics along the radial direction of the specimen during the Jominy end quench test. Based on the author’s experiences, the radial temperature gradient or heat flow of the Jominy specimen occurred during the Jominy end quench test due to the heat loss from the side of the specimen and the jet-type water cooling in this test [26]. However, only limited information is available on the cooling features along the radial direction of the specimen during the Jominy end quench test. In addition, to the best of the author’s knowledge, most of the studies on the Jominy test have focused on metallurgical issues since the Jominy test is typically used in the fields of materials science and engineering. On the other hand, the Jominy end quench process itself has received less attention although several studies are in existence on the holding time [27], austenitizing temperature during the reheating process [11], and cooling media during the cooling process [19].
The aforementioned literature review and the author’s experiences have driven the author to study this fundamental measurement topic. Therefore, this study aims to evaluate the effect of water jet height on the cooling rate of a specimen and the temperature deviation along the radial direction of a specimen to understand the Jominy end quench test in more detail.
2. Experimental Procedures
The Jominy end quenching tests were conducted based on ASTM A255 [7]. The typical Jominy specimen of 101.6 mm in length and 25.4 mm in diameter (Figure 1a) was used to evaluate the thermal and hardness behaviors under specific cooling conditions. The specimen was heated in the austenitic domain at 910 °C for 1800 s in a reheating furnace under Ar gas, and then it was rapidly placed in the Jominy cooling device, followed by cooling via several heights of water jet on its lower end, as shown in Figure 2a. That is, the tests were conducted at the specific water jet height of 35, 65, and 100 mm. For convenience, these cooling conditions are referred to as the low height (LH), standard height (SH), and high height (HH), as described in Figure 2a, respectively. A water jet height of 65 mm is the standard cooling condition for the Jominy end quench test [7]. Meanwhile, the Jominy specimen was cooled by dipping the lower end up to 5 mm, as shown in Figure 2b, which is called the end dipping (ED) cooling condition for convenience. The temperature of water and air is approximately 21 °C.
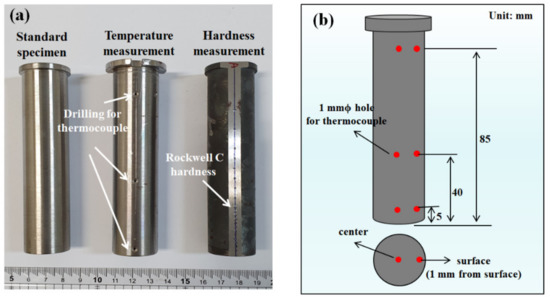
Figure 1.
(a) Photograph of the Jominy specimen for temperature and hardness measurements and (b) schematic description of the measurement points of temperature in the Jominy end quench specimen using thermocouples in this study.
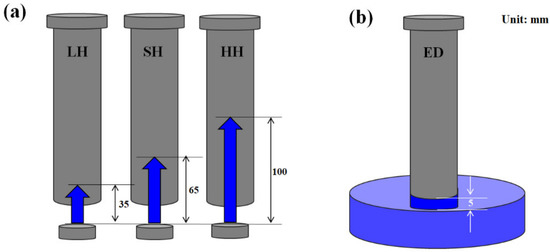
Figure 2.
Schematics of the cooling conditions in this study: (a) the influence of water jet height and (b) the influence of end dipping cooling process.
To understand the cooling behavior during the Jominy end quench test under cooling conditions, the temperature was measured in several regions by using thermocouples. Figure 1 shows the image and schematic of the temperature measurement points in the Jominy specimen using sheathed K-type thermocouples. The temperatures at six regions of the Jominy specimen were measured as shown in Figure 1b, i.e., both center and surface temperatures at the lower, middle, and upper regions. After drilling a 1 mm-diameter hole to the 12.7 and 1 mm in depth from the surface of the specimen, thermocouples of 1 mm-diameter were embedded to reduce the external thermal disturbance. Hwang [28,29] successfully measured the temperature of the steels under the various cooling rates and process conditions using the above-mentioned method, although temperature measurement using a thermocouple is very sensitive to the cooling conditions and measurement methods. Regarding the uncertainty in temperature measurements, the accuracy of the thermocouple position within the Jominy specimen was determined to be approximately ±0.2 mm, and the standard limit of error in this K-type thermocouple is about 0.75% of the measured temperature within the temperature range of 20 to 950 °C. Temperature data were stored by a data recorder apparatus with a sampling time of 0.2 s. The error of the data recorder device is approximately ±0.05%.
After cooling, the Jominy specimen was polished on both sides along the longitudinal direction of the specimen, and the Rockwell C hardness (HRC) measurement was carried out along the longitudinal axis with distance from the quenched end to obtain a hardness profile [7], as shown in Figure 1. Low carbon steel with the chemical composition of Fe-0.02C-0.025Mn-0.03Si in weight percent was used to evaluate the thermal behavior because this steel is mainly transformed to ferrite phase during the cooling process due to the low carbon content. Therefore, we have little need to consider the influence of complex temperature rise during the phase transform of steels in the cooling process. High alloy steel, AISI 4137, was used for the hardness test since this steel is mainly used after quenching and tempering heat treatments and exhibits several microstructures such as martensite, bainite, pearlite, and ferrite with the cooling rate during the heat treatments. Accordingly, the hardness variations in the Jominy specimen are easily detected with cooling rate. The chemical compositions analyzed by spark optical emission spectrometer (S-OES) are listed in Table 1.

Table 1.
Chemical composition (weight percent) of the steels used in the present study.
3. Results and Discussion
3.1. Thermal and Hardness Behaviors of a Specimen during the Standard Jominy Test
Figure 3a shows the cooling curves of the standard Jominy specimen with regions. The quenched end (QE) was cooled rapidly, and the upper regions were cooled slowly irrespective of the center and surface areas. Figure 3b compares the temperature differences between the center and surface area at each region, i.e., the center temperature minus the surface temperature. Obviously, the temperature difference between the center and surface areas was not small: the maximum temperature difference was approximately 50 °C. The center area tends to be cooled slowly compared to the surface area because much water was arrested in the center area during cooling. Chen et al. [16] also reported that the surface temperature is lower than the center temperature during the Jominy test.
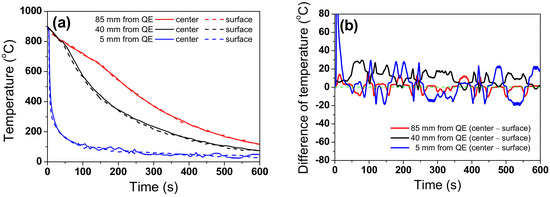
Figure 3.
Comparison of (a) temperature profiles and (b) temperature difference between the center and surface area of the standard Jominy specimen with cooling time and region.
To better understand the cooling behavior of the Jominy end quench test, the cooling curves of the standard Jominy specimen were compared to the cooling curves of the directly water quenched and air-cooled specimens, as shown in Figure 4. In the case of direct water quenching, the whole Jominy specimen was quenched directly after heating, while the Jominy specimen was cooled at room temperature (21 °C) in the case of air-cooling condition. As expected, the specimen cooled by water quenching cooled faster and that by air cooling cooled slower. Figure 4b compares the cooling rates of the specimen with regions at a temperature of 700 °C. The cooling rate of the specimen by the standard Jominy end quench test was similar to that of the water quenching condition at the QE, while it was similar to the air cooling condition in the upper regions of the specimen, which means that the cooling rate of the standard Jominy specimen ranged between the water quenching condition and the air cooling condition with region. That is, the range of cooling rate of the standard Jominy specimen is 2–100 °C/s with region. The author believes that this wide range of cooling rates with regions of the Jominy specimen is the main reason for the wide use of the Jominy test in the fields of materials science. Currently, the Jominy end quench test is also frequently used to correlate the cooling rate with microstructures or mechanical properties stemming from the wide range of cooling rates of the Jominy specimen with regions using a simple experiment. Meanwhile, it is worth noting that the cooling rate at the QE of the Jominy specimen was slightly higher than that under the water quenching condition because the boiling film or vapor phase was easily removed by the jet cooling during the Jominy cooling test.
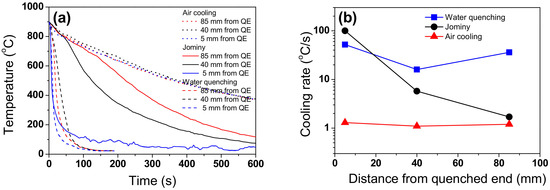
Figure 4.
Comparison of (a) temperature profiles and (b) cooling rates of the standard Jominy specimen with the different cooling conditions: water quenching, standard Jominy cooling, and air cooling. Cooling rate was measured at the temperature of 700 °C.
Figure 5 compares the results of the hardness measurement with regions. The region around QE presented high values of hardness owing to the formation of martensite stemming from the high cooling rate by the water jet, and the hardness decreased with increasing the distance from the QE due to the formation of weaker phases such as ferrite, pearlite, and bainite stemming from the lower cooling rate. Consequently, similar to the thermal history, the hardness values of the water-quenched specimen and the air-cooled specimen were the upper and lower limits of the standard Jominy specimen, respectively.
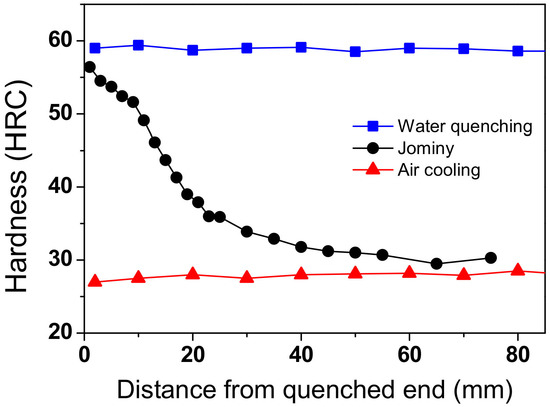
Figure 5.
Comparison of hardness profiles of specimen with the different cooling conditions: water quenching, standard Jominy cooling, and air cooling.
3.2. The Influence of Water Jet Height
Figure 6a–c shows the temperature profiles of the Jominy specimen with the different water jet heights, i.e., 35, 65, and 100 mm, and Figure 6d compares the temperature histories at the center areas with the water jet height. All temperature profiles had a similar pattern with region regardless of the water jet height. Surprisingly, the temperatures were similar regardless of the water jet height; in particular, the temperatures of the SH specimen were almost equal to those of the HH specimen. Additionally, the cooling rate of the three specimens had a similar pattern to that of temperature, and the cooling rates of the SH specimen were similar to those of the HH specimen, as shown in Figure 7. The LH specimen showed slightly lower cooling rates compared with others, which is consistent with the results of Cakir and Ozsoy [19]. They reported that the cooling rate slightly decreases as the water jet height is reduced from 65 mm to 32.5 mm.
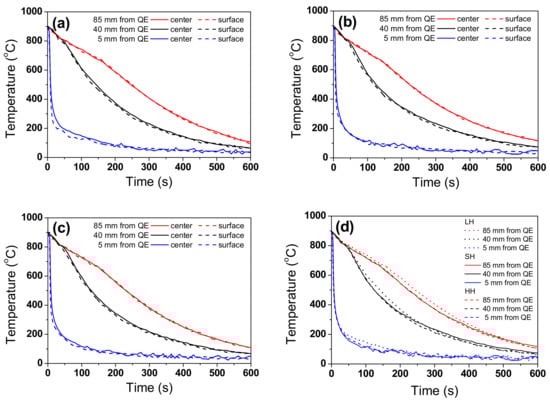
Figure 6.
Temperature profiles of the Jominy specimen with the cooling conditions of the (a) low height (LH), (b) standard height (SH), (c) high height (HH), and (d) comparison of temperature profiles at the center areas of the Jominy specimen with the height of water jet.
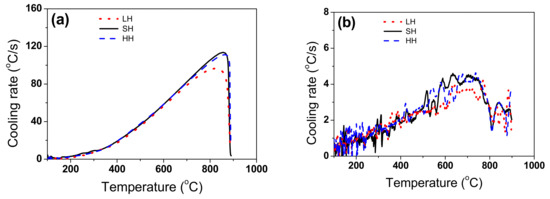
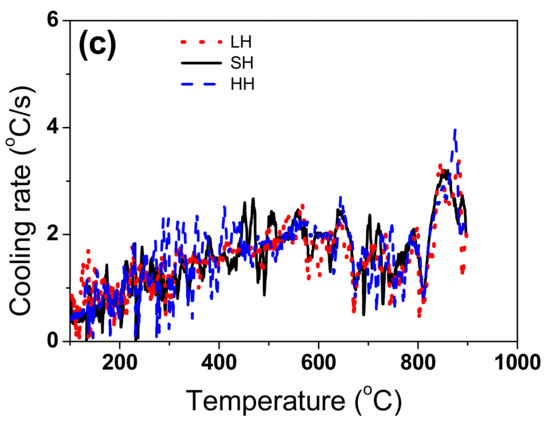
Figure 7.
Comparison of cooling rate at the center areas of the Jominy specimen with the water jet height as a function of region: (a) 5 mm, (b) 40 mm, and (c) 85 mm from the quenched end (QE).
Figure 8a compares the profiles of measured hardness with the water jet height, and Figure 8b shows the hardness difference with the water jet height. The hardness difference was calculated by subtracting the hardness values of the SH specimen from the hardness values of the LH and HH specimens. The LH specimen had the lowest hardness values, and the HH specimen had the highest hardness values with region since the effect of film boiling on cooling was weaker with increasing the height of water jet. However, the difference in hardness was small: the maximum hardness difference between the LH and the SH specimens was approximately 5 HRC and that between the HH and the SH specimen was about 3 HRC, as shown in Figure 8b. Based on the thermal and hardness behaviors, it can be deduced that the influence of the water jet height was not large, especially when the water jet height was over 50 mm. This result indicates that the uncertainty of water jet height is insignificant for the standard Jominy test, which is greatly useful for experiments because the uncertainty of the water jet height always remains due to the difficulty in measuring the height of water jet. However, it should be noted that the behaviors of the mechanical properties of the material are highly related to the variation of the microstructures during heat treatment and the related strengthening mechanism. Therefore, microstructural analysis should be conducted to obtain reliable results, especially at the quenched end where the change in cooling rate is large. For example, steels with a critical phase change in this cooling rate based on the CCT diagram may have different results with the water jet height. Unfortunately, microstructural analysis was not performed in this study. Accordingly, further researches are necessary to get results that are more convincing.
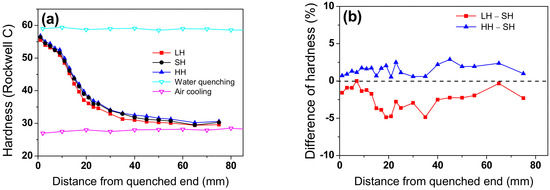
Figure 8.
Comparison of (a) hardness profiles and (b) hardness difference of the Jominy specimen with the different water jet height.
3.3. Temperature Deviations along the Radial Direction of a Specimen
Figure 9 shows the standard deviation of temperature along the radial direction of an SH specimen based on the Figure 3b. Clearly, the temperature difference between the center and surface areas was not small in SH specimen, which will affect the reliability of standard Jominy end quenching test because the radial heat flow of the specimen assumes negligibility in the Jominy end quench test. Masson et al. [17] developed a numerical method for the estimation of a convective heat treatment coefficient for a rapid metallurgical heat treatment during the Jominy end quench test. They reported that the heat transfer coefficient was varied along the radial direction of the specimen, indicating that the temperature deviation is in existence between center and surface of the Jominy specimen.
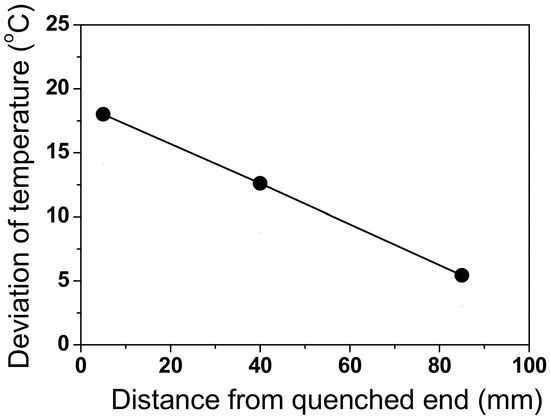
Figure 9.
The standard deviation of temperature between the center and surface area of the standard Jominy specimen with cooling time and region.
Figure 10a shows the temperature profiles of the Jominy specimen under the end dipping cooling condition, and Figure 10b compares the temperature profiles at the center areas between the standard Jominy cooling condition and the ED cooling condition. Interestingly, the temperature profiles were very similar between the two cooling conditions, but a close inspection shows that the cooling rate of the ED condition was slightly lower than that of the SH condition. In particular, the difference in cooling rate increased with cooling time because the temperature of water at the QE of the ED specimen increased with cooling time. In addition, the ED condition increased the influence of the film-boiling stage during the cooling process [30].
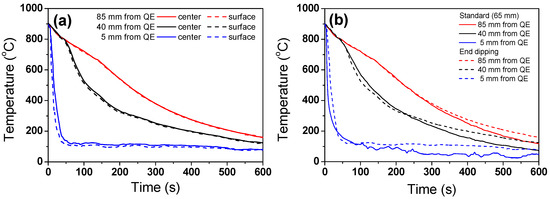
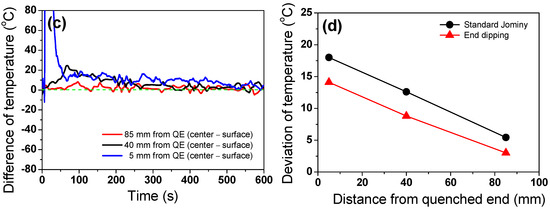
Figure 10.
(a) Temperature profiles of the Jominy specimen with end dripping (ED) cooling condition, (b) comparison of temperature profiles at the center areas between the SH and ED specimen, (c) temperature difference between center and surface area of the ED specimen with cooling time and region, and (d) comparison of the standard deviation of temperature between the SH and ED specimen with region.
The temperature difference between the center and surface area of the ED specimen is shown in Figure 10c with region. Compared with the SH condition in Figure 3b, the temperature difference along the radial direction of the ED specimen was reduced. For a better comparison of the radial temperature difference in the Jominy specimen between SH and ED conditions, the standard deviation of temperature along the radial direction was also calculated by region as shown in Figure 10d. Clearly, the temperature deviation along the radial direction of the ED specimen was lower than that of the SH specimen because the thermal disturbance on the QE decreased during the ED condition. This means that the more stable cooling condition on the Jominy end reduced the thermal gradient along the radial direction of a specimen during the Jominy end quench test. Figure 11a compares the measured hardness profiles, and Figure 11b shows the hardness difference with cooling condition. The hardness difference was calculated by subtracting the hardness values of the SH specimen from the hardness values of the ED specimen. Similar to the thermal histories, the ED specimen tended to have lower hardness values compared to the SH specimen. However, the difference in hardness was not large. It is worth noting that the influence of temperature deviation along the radial direction of the Jominy specimen on the hardness distribution along the longitudinal direction was not large, resulting in the high reliability of the Jominy end quench test. This is why Newkirk and MacKenzie [3] reported that the heat transfer of the radial direction of the Jominy specimen needs not be considered during Jominy test based on the only hardness test. From the point of view of the ED cooling process, the temperature and hardness can be controlled by the amount of agitation during the ED condition [31], indicating that a similar cooling rate to the SH condition can be obtained by optimizing the agitation during the ED condition.
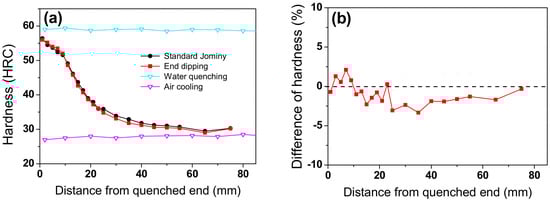
Figure 11.
Comparison of (a) hardness profiles and (b) hardness difference of the Jominy specimen during the SH and ED cooling conditions.
4. Conclusions
Based on the systematic study of the influences of water jet height and end dipping cooling conditions on the thermal and hardness behaviors during the Jominy end quench test, the following conclusions are drawn:
- The effect of the water jet height on the thermal and hardness behaviors is not large, especially it becomes negligible when the water jet height is over 50 mm, indicating that the uncertainty of the water jet height is insignificant during the standard Jominy end quench test.
- During the standard Jominy end quench test, we cannot neglect the thermal gradient along the radial direction of the specimen because the temperature difference between the center and surface area is not small. The maximum temperature difference is approximately 50 °C. The center area tends to cool slower than the surface area.
- Based on the comparative study between the standard Jominy cooling and the end dipping cooling processes, the thermal gradient along the radial direction of the specimen can be reduced with the more stable cooling condition on the Jominy end. However, the influence of temperature deviation along the radial direction of the Jominy specimen on the hardness distribution along the longitudinal direction was not large, which shows the high reliability of the Jominy end quench test.
Funding
This work was supported by the National Research Foundation of Korea (NRF) grant funded by the Korea government (MSIT, South Korea) (Grant No. 2018R1D1A1B07050103).
Conflicts of Interest
The author declares no conflict of interest.
References
- Ueno, M.; Nakamura, K.; Ito, K.; Minematsu, H. Development of Automatic Jominy Test Apparatus. Tetsu-to-Hagane 1982, 68, 155–161. [Google Scholar] [CrossRef]
- Li, M.V.; Niebuhr, D.V.; Meekisho, L.L.; Atteridge, D.G. A computational model for the prediction of steel hardenability. Metall. Mater. Trans. B 1998, 29, 661–672. [Google Scholar] [CrossRef]
- Newkirk, J.W.; MacKenzie, D.S. The Jominy end quench for light-weight alloy development. J. Mater. Eng. Perform. 2000, 9, 408–415. [Google Scholar] [CrossRef]
- Ahmed, T.; Rack, H.J. Phase transformations during cooling in α+β titanium alloys. Mater. Sci. Eng. A 1998, 243, 206–211. [Google Scholar] [CrossRef]
- Toda, T. The Critical Cooling Rates Determined by the Jominy Tests in the Age-Hardening Cu–Cr, Cu–Be and Cu–Co2Si Alloys. Trans. Jpn. Inst. Met. 1970, 11, 24–29. [Google Scholar] [CrossRef]
- Ammar, Y.B.; Aoufi, A.; Darrieulat, M. Influence of the cooling rate on the texture and the microstructure of Zircaloy-4 studied by means of a Jominy end-quench test. Mater. Sci. Eng. A 2012, 556, 184–193. [Google Scholar] [CrossRef]
- ASTM International. Standard test methods for determining hardenability of steel. In Annual Book of ASTM Standards ASTM A255; ASTM International: West Conshohocken, PA, USA, 2014. [Google Scholar]
- Hömberg, D. A numerical simulation of the Jominy end-quench test. Acta Mater. 1996, 44, 4375–4385. [Google Scholar] [CrossRef]
- Lapin, J.; Marek, K. Effect of continuous cooling on solid phase transformations in TiAl-based alloy during Jominy end-quench test. J. Alloys Compd. 2018, 735, 338–348. [Google Scholar] [CrossRef]
- Lee, S.J.; Pavlina, E.J.; Van Tyne, C.J. Kinetics modeling of austenite decomposition for an end-quenched 1045 steel. Mater. Sci. Eng. A 2010, 527, 3186–3194. [Google Scholar] [CrossRef]
- Nunura, C.R.N.; dos Santos, C.A.; Spim, J.A. Numerical–Experimental correlation of microstructures, cooling rates and mechanical properties of AISI 1045 steel during the Jominy end-quench test. Mater. Des. 2015, 76, 230–243. [Google Scholar] [CrossRef]
- Chen, Z.; Nash, P.; Zhang, Y. Correlation of Cooling Rate, Microstructure and Hardness of S34MnV Steel. Metall. Mater. Trans. B 2019, 50, 1718–1728. [Google Scholar] [CrossRef]
- Ghrib, T.; Bejaoui, F.; Hamdi, A.; Yacoubi, N. Correlation between thermal properties and hardness of end-quench bars for C48, 42CrMo4 and 35NiCrMo16 steels. Thermochim. Acta 2008, 473, 86–91. [Google Scholar] [CrossRef]
- Vermeulen, W.G.; Van der Wolk, P.J.; De Weijer, A.P.; van der Zwaag, S. Prediction of Jominy hardness profiles of steels using artificial neural networks. J. Mater. Eng. Perform. 1996, 5, 57–63. [Google Scholar] [CrossRef]
- Irani, M.; Chung, S.; Kim, M.; Lee, K.; Joun, M. Adjustment of Isothermal Transformation Diagrams Using Finite-Element Optimization of the Jominy Test. Metals 2020, 10, 931. [Google Scholar] [CrossRef]
- Chen, S.G.; Weng, C.I.; Lin, J. Inverse estimation of transient temperature distribution in the end quenching test. J. Mater. Process. Technol. 1999, 86, 257–263. [Google Scholar] [CrossRef]
- Masson, P.L.; Loulou, T.; Artioukhine, E.; Rogeon, P.; Carron, D.; Quemener, J.J. A numerical study for the estimation of a convection heat transfer coefficient during a metallurgical “Jominy end-quench” test. Int. J. Therm. Sci. 2002, 41, 517–527. [Google Scholar] [CrossRef]
- Li, H.; Zhao, G.; He, L.; Mu, Y. High-speed data acquisition of the cooling curves and evaluation of heat transfer coefficient in quenching process. Measurement 2008, 41, 676–686. [Google Scholar] [CrossRef]
- Çakir, M.; Özsoy, A. Investigation of the correlation between thermal properties and hardenability of Jominy bars quenched with air–water mixture for AISI 1050 steel. Mater. Des. 2011, 32, 3099–3105. [Google Scholar] [CrossRef]
- Lytle, D.; Webb, B.W. Air jet impingement heat transfer at low nozzle-plate spacings. Int. J. Heat Mass Transf. 1994, 37, 1687–1697. [Google Scholar] [CrossRef]
- Anwarullah, M.; Raob, V.V.; Sharmac, K.V. Effect of nozzle spacing on heat transfer and fluid flow characteristics of an impinging circular jet in cooling of electronic components. Intent. J. Therm. Environ. Eng. 2012, 1, 7–12. [Google Scholar] [CrossRef]
- Choo, K.; Friedrich, B.K.; Glaspell, A.W.; Schilling, K.A. The influence of nozzle-to-plate spacing on heat transfer and fluid flow of submerged jet impingement. Int. J. Heat Mass Transf. 2016, 97, 66–69. [Google Scholar] [CrossRef]
- Yazdi, A.Z.; Sajjadi, S.A.; Zebarjad, S.M.; Nezhad, S.M.M. Prediction of hardness at different points of Jominy specimen using quench factor analysis method. J. Mater. Process. Technol. 2008, 199, 124–129. [Google Scholar] [CrossRef]
- Ko, D.H.; Ko, D.C.; Lim, H.J.; Kim, B.M. Application of QFA coupled with CFD analysis to predict the hardness of T6 heat treated Al6061 cylinder. J. Mech. Sci. Technol. 2013, 27, 2839–2844. [Google Scholar] [CrossRef]
- Pietrzyk, M.; Kuziak, R. Computer aided interpretation of results of the Jominy test. Arch. Civ. Mech. Eng. 2011, 11, 707–722. [Google Scholar] [CrossRef]
- Hwang, J.K. Effects of nozzle shape and arrangement on the cooling performance of steel wire rod in the Stelmor cooling process. Appl. Therm. Eng. 2020, 164, 114461. [Google Scholar] [CrossRef]
- Fong, H.S. Further observations on the Jominy end quench test. J. Mater. Process. Technol. 1993, 38, 221–226. [Google Scholar] [CrossRef]
- Hwang, J.K. The temperature distribution and underlying cooling mechanism of steel wire rod in the Stelmor type cooling process. Appl. Therm. Eng. 2018, 142, 311–320. [Google Scholar] [CrossRef]
- Hwang, J.K. Thermal Behavior of a Rod during Hot Shape Rolling and Its Comparison with a Plate during Flat Rolling. Processes 2020, 8, 327. [Google Scholar] [CrossRef]
- Heming, C.; Xieqing, H.; Jianbin, X. Comparison of surface heat-transfer coefficients between various diameter cylinders during rapid cooling. J. Mater. Process. Technol. 2003, 138, 399–402. [Google Scholar] [CrossRef]
- Fernandes, P.; Prabhu, K.N. Effect of section size and agitation on heat transfer during quenching of AISI 1040 steel. J. Mater. Process. Technol. 2007, 183, 1–5. [Google Scholar] [CrossRef]
Publisher’s Note: MDPI stays neutral with regard to jurisdictional claims in published maps and institutional affiliations. |
© 2021 by the author. Licensee MDPI, Basel, Switzerland. This article is an open access article distributed under the terms and conditions of the Creative Commons Attribution (CC BY) license (https://creativecommons.org/licenses/by/4.0/).