Abstract
As the complexity of supply chains increases, the enhancement of resilience for mitigating sustainable disruption risks in supply chains is an important issue. Quality function deployment (QFD) has been successfully applied in many domains to solve multicriteria decision-making (MCDM) problems. However, research on developing two houses of quality to connect sustainable supply chain disruption risks, resilience capacities, and resilience-enhancing features in elevator manufacturing supply chains by using the MCDM approach is lacking. This study aims to develop a framework for exploring useful decision-making by integrating the MCDM approach and QFD. By applying the framework, supply chain resilience can be improved by identifying the major sustainable risks and the key resilience to mitigate these risks. Important managerial insights and practical implications are obtained from the framework implementation in a case study of the elevator manufacturing industry. To strengthen resilience and thus mitigate key risks, the most urgent tasks are to connect the working site and the backstage to enhance product development and design and to share real-time job information. When these features are strengthened, agility, capacity, and visibility can be improved. Finally, unexpected events lead to changes in supplier delivery dates, and factors such as typhoon and lack of critical capacities/skilled employees with the greatest impact can be alleviated. This framework will provide an effective and pragmatic approach for constructing sustainable supply chain risk resilience in the elevator manufacturing industry.
1. Introduction
In today’s global economy, enterprises strive to stay responsive to evolving customer demands. Enterprises are obliged to work together in networks instead of competing as isolated entities [1]. In response to international competition and operations, manufacturers need to closely cooperate with their suppliers, distributors, and customers to construct a robust supply chain system [2]. As a result, manufacturers should design a supply chain system to obtain the required production resources and establish strategies to operate worldwide [3]. However, this operational strategy will increase the complexity of supply chains in terms of coordination and collaboration [4]. The increasing complexity and instability of supply chain systems in the face of risks have a significant negative influence on sustainable supply chain performance [5]. Furthermore, incorrect risk management can cause serious damage to businesses and lead to increased costs [6,7]. In 2015, the United Nations put forward the 2030 Agenda for Sustainable Development, which emphasized sustainable development and the role of enterprises in ensuring sustainable production and consumption patterns, namely, the importance of a sustainable supply chain (Goal 12, United Nations 2015). Faced with global competition, supply chain management academia and practitioners have focused on how to cope with sustainable supply chain disruption risks (SSCDRs) [8].
To overcome SSCDRs, resilience is an effective way to manage risks and recover from a supply chain disruption [9,10]. To mitigate these risks, resilient supply chains must be designed from a multidimensional and multidisciplinary perspective, including the preparation of events before they occur; providing an efficient and effective response when events occur and capacity to respond to events after they occurred. Resilient supply chains can return to their original state or to an improved state [11]. Thus, today’s enterprises are facing major challenges in terms of how to construct resilient supply chains to reduce risks [12,13].
Hosseini et al. (2019) proposed the hierarchical structure of a resilient supply chain, in which the bottom level is occupied by resilience-enhancing features (RFs), which enhance resilience capacities (RCs) [9]. Scholars have proposed the concept of RCs in different fields [14,15,16,17,18,19]; however, RFs are rarely included [9]. RFs and RCs to SSCDRs are of paramount importance to supply chains. However, the interactions between the two have not been thoroughly explored [9]. Although perceptible intersections exist between resilience and sustainability issues, very few papers have been published [9]. Multicriteria decision-making (MCDM) methods have been applied by researchers to resilient supplier problems [20,21], but MCDM methods have not been well-studied in the field of resilient supply chains [9]. In recent years, quality function deployment (QFD) has been successfully applied in many domains to solve MCDM problems, such as knowledge system selection [22], green building assessment [23], bike-sharing program evaluation [24], technical attribute prioritization [25], and fashion risk reduction [26]. However, research on developing two houses of quality (HoQs) to connect SSCDRs, RCs, and RFs for building the supply chain risk resilience of elevator manufacturing by integrating the MCDM approach and QFD is lacking. To address this gap, the present study discusses the following research questions.
- (a)
- What are the key SSCDRs, RCs, and RFs in elevator manufacturing supply chains?
- (b)
- How can supply chain risk resilience be built through integrative MCDM and QFD to provide decision support for elevator manufacturing supply chains?
- (c)
- How do the relationships between these three sets of variables affect finding feasible resilience solutions for mitigating SSCDRs for elevator manufacturing supply chains?
- (d)
- How can elevator manufacturers effectively improve supply chain resilience to address SSCDRs through the proposed framework?
Therefore, the objective of this study is to develop an MCDM-QFD framework for elevator manufacturing supply chains (EMSCs) to explore useful resilient decision making. By applying the framework, supply chain resilience can be improved by identifying the major SSCDRs and the RCs and RFs to mitigate these risks. The aim is also to investigate the relationships between these three sets of variables (SSCDRs, RCs, and RFs) and ultimately to prioritize resilience approaches for EMSCs. One of the largest elevator manufacturers in Taiwan is studied to demonstrate the validity of this framework. This framework provides managers with a clear idea of where to improve their sustainable supply chain resilience in response to their supply chain risks. This study also provides a practical contribution for enterprises in implementing resilient supply chains. The business and performance of other actors and stakeholders involved in EMSCs are affected by resilience level; thus, they will be interested in the results of this study.
The rest of this study is organized as follows: Section 2 identifies SSCDRs, RCs, and RFs from a review of the literature. Section 3 describes the integrated framework. Section 4 demonstrates a case implementation and discussion. Finally, Section 5 concludes the main contributions and the limitations of the study.
2. Literature Review
As an emerging discipline, SSCDRs and resilience have gained more attention recently among researchers. Major resilience directions for future research based on 155 articles published across 20 international peer-reviewed journals, as classified by Ali and Gölgeci (2019), include (1) drivers, barriers, and consequences; (2) moderators and mediators; (3) theoretical underpinnings; and (4) research methods [27]. These directions are interconnected. The exploration of mechanisms that explicate proposed relationships of supply chain resilience with other variables is an area of weakness in the current literature [28]. Thus, this study draws the link between SSCDRs, RCs, and RFs for EMSCs to construct supply chain risk resilience.
2.1. Sustainable Supply Chain Disruption Risks (SSCDRs)
Traditional sustainability includes social, environmental, and economic dimensions [29]. However, these three dimensions do not address the entire system of an organization. Therefore, Iddrisu and Bhattacharyya (2015) propose a five-dimensional sustainable development model that takes into account social, environmental, economic, technological, and institutional dimensions [30]. Valinejad and Rahmani (2018) used a five-dimensional approach to assess risks in the telecommunications sector [31]. Moktadir (2021) also used the five-dimensional method to identify 30 potential risk factors for the leather industry in Bangladesh [8].
Supply chain sustainability ensures the success and improvement of overall supply chain management in the long run. To ensure the sustainability of the supply chain, considering risk management is sufficient [5]. In the modern globalized era, disruption risks involved in supply chains cover a wider range and are more complex than before [32,33]. There are many studies that focus on risk management to obtain sustainable supply chains. To make the concept of risks easier to understand and manage, various scholars from different perspectives have proposed different classification methods.
The study by Mitroff and Alpaslan (2003) classified risks into three categories: natural disasters, events of vandalism, and human-designed system failures [34]. Christopher and Peck (2004) suggested that risks can be divided into five categories: process risk, control risk, supply risk, demand risk, and environmental risk [35]. Norrman and Lindroth (2004) and Vanany et al. (2008) categorized risks into three categories: operational accident risk, operational disaster risk, and strategic uncertainty risk [36,37]. Olson and Wu (2010) also classified risks into two categories: external and internal risks. The former includes natural risks, political system risks, competitor, and market risks; the latter includes available capacity risks, internal operational risks, and information system risks [38]. Sawik (2011) categorized risks into disruptive and operational risks. Disruptive risks include unplanned outages, unexpected events, and sudden breakdowns of material supply, while operational risks occur due to the uncertainty of internal operations [39]. Probohudono and Tower (2013) divided risks into five categories: business risk, strategic risk, operational risk, market risk, and credit risk [40]. Rangel et al. (2015) sorted 56 risk types according to existing conceptual similarities and then related to the five management processes intrinsic in a functional supply chain (plan, source, make, deliver, and return), which are mainly advocated by the supply chain operations reference model [41]. Ho et al. (2015) defined two kinds of risks: (i) macro-risks are adverse and relatively rare external events that may have strong and negative impacts (e.g., catastrophes such as 9/11, Hurricane Katrina, or the Tsunami in 2004). (ii) micro-risks refer to relatively periodic events, originating from internal activities of companies or relationships within partners (e.g., supplier losses or quality problems) [42]. Hudnurkar et al. (2017) classified risks into five categories: product characteristics, supply chain processes, supply chain infrastructure, external environment, and human resources [43]. Truong Quang and Hara (2018) classified risks into four categories: environment, flows of supply chains, degree of impact, and probability [44]. Mital et al. (2018) also sorted 17 risk types according to five categories: quality risks, cost risks, continuity of supply risks, supplier service risks, and buyer–supplier partnership risks [45]. Rostamzadeh et al. (2018) identified 44 risk types and classified risks into seven categories: environmental risks, organizational risks, supply risks, production/manufacturer risks, distribution risks, recycling risks, and information technology-related risks [46]. Abdel-Basset et al. (2019) classified risks into two categories: internal risks (managed risks) and external risks (uncontrolled risks). The former includes manufacturing risks, business risks, planning and control risks, mitigation and contingency risks, and cultural risks; the latter includes demand risks, supply risks, environmental risks, business risks, and physical plant risks [33].
On the basis of the above discussion and a comprehensive review of the literature [47,48,49,50,51,52,53,54,55,56,57], 130 risks concerning sustainable risks are listed and selected in this study (Appendix A). We suggest that SSCDRs can be categorized as follows: (1) external risks: including human disasters, operational risks, legal, and political risks, supplier and customer risks, environment and natural disasters and market trend risks (6 dimensions and 62 risks); and (2) internal risks: including physical accident risks, operational risks, personnel risks, strategic management risks, and information management risks (5 dimensions and 68 risks).
Given that different scholars have developed many different classifications, risk is classified into external and internal risk according to the criteria of whether the risk occurs inside or outside the enterprise. For example, human disasters are external risks. It covers 11 risks such as terrorist attacks, intellectual property risks, theft of goods, the impact of local events, flight accidents, power supply interruption, gas interruption, abnormal external IT equipment, incorrect repair or maintenance of equipment by outsourcing manufacturers, cultural and social factors, and incorrect media reports on the company. In addition, after analysis, these internal and external risks are all included in a five-dimensional sustainable development. Therefore, this study mitigates these SSCDRs and builds sustainable supply chains by virtue of resilience. These sustainable risks are evaluated in Section 4.
2.2. Resilience Capacities (RCs)
The theoretical underpinning pinning of this paper comes from the theory of resilience. The theory of resilience is one way of describing a system’s ability to cope with changing circumstances or disruptions. The theory helps to provide an understanding of whether a system can return to an equilibrium state after disruption or how a system must be transformed into a new desirable system if the change is irreversible [58]. The notion of resilience was first proposed by Holling (1973) and used to describe the stability of an ecosystem and its response to environmental disturbances [59]. Holling differentiates between two different types of resilience to take the existing understating of resilience into account. The first type is based on the understanding of resilience in materials science and is called “engineering resilience”. The second type of resilience is known as “ecological resilience” and describes the resilience of complex adaptive systems [58]. The theory of resilience can be found in many different fields, especially psychology [60], ecology [61], social sciences [62], and environmental science [63], and is being applied to the analysis of various systems.
On the basis of the resilience theory view, resilience considers the response to particular disruptions, that is, when the event is outside the range of changes and interruptions that the system can handle and the event is an accident [64]. Supply chains may be susceptible to a number of risks leading to different types of supply, production, and logistics disruptions [65]. Resilience plays an important role in supply chain risk management. Resilience is generally understood as the supply chain’s ability to withstand disruptions and recover after disruption [9,11]. Supply chain disruption risks and resilience has been developed as a well-defined area of research and has produced a wealth of academic results [66].
One of the first studies on supply chain resilience was presented by Fiksel (2003). Fiksel (2003) argued that the development of a resilient system is based on comprehensive system thinking, defined as the ability of the system to tolerate interference while maintaining its structure and function. Therefore, the basic properties of a resilient system are as follows: (1) diversity: there are many forms and behaviors; (2) efficiency: the ability to have low consumption of resources; (3) adaptability: flexibility to respond and adjust to new pressures; (4) cohesion: the ability to unify or connect systems [67].
Regarding what capacity should be covered within resilience, different research proposals cover different capacities. Reinmoeller and Van Baardwijk (2005) suggested that resilience consists of four capacities: adaptability, anticipation, flexibility, and knowledge [68]. Pereira (2009) defined resilience as a function of flexibility, agility, visibility, information sharing, and risk awareness [69]. Jüttner and Maklan (2011) proposed that RCs can improve flexibility, visibility, velocity, and collaboration [11]. Ponis and Koronis (2012) defined RCs that include agility, resilience, velocity, visibility, availability, redundancy, resource mobility, collaboration, and supply chain structure knowledge [70]. Simangunsong et al. (2012) subdivided RCs into flexibility, agility, capacity, adaptability, collaboration, information sharing, integration, financial strength, supply chain design, and risk awareness [71]. Soni et al. (2014) proposed ten enablers of resilience properties: agility, collaboration, information sharing, sustainability, risk and revenue sharing, trust, visibility, risk management culture, adaptive capacity, and structure [12]. Kamalahmadi and Parast (2016) suggested that resilience consists of 11 capacities: agility, flexibility, redundancy, velocity, visibility, collaboration, information sharing, financial strength, product stewardship, risk awareness, and knowledge [72]. Chowdhury and Quaddus (2017) defined resilience as a function of flexibility, capacity, velocity, efficiency, responsiveness, recovery, dispersion, collaboration, market position, information sharing, security, financial strength, and product stewardship [73]. Singh et al. (2019) subdivided RCs into flexibility, agility, redundancy, velocity, visibility, adaptability, collaboration, information sharing, market position, and security [74]. Based on the above, scholars believe that resilience has multidimensional capacities.
On the basis of the above discussion and a comprehensive review of the literature [9,69,75,76,77,78,79,80,81,82,83,84,85,86,87,88,89,90,91,92,93], this study aggregates 20 RCs, as shown in Table 1. The definitions for the chosen RCs are shown in Appendix B. These capacities will be evaluated in Section 4.

Table 1.
The constituent elements of resilience capacities by scholars.
2.3. Resilience-Enhancing Features (RFs)
Hosseini et al. (2019) present a resilience hierarchy for supply chain resilience, as illustrated in Figure 1. The bottom layer is occupied by RFs that enhance RCs, such as the manufacturer’s surplus stock or having a backup supplier. Identifying RFs helps to better understand the resilience of supply chains. The vulnerability and recoverability of a supply chain is a function of resilience capacity. The supply chain with higher resilience is less vulnerable to disruption and requires less recovery effort. Supply chains that have less resilience capacity are more vulnerable and need to work harder to recover. Finally, supply chain resilience is located at the top of the hierarchy and is a function of the vulnerability and recoverability of the supply chain [9].
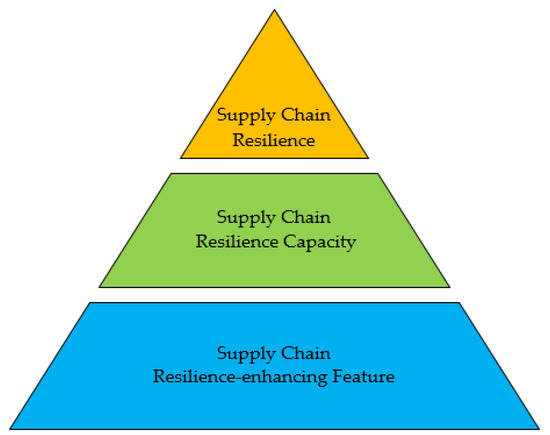
Figure 1.
The hierarchy for supply chain resilience (Modified from [9]).
At present, no unified regulation has been developed on the related terms of resilience among various scholars. For example, some scholars call RFs resilience measures. Lam and Bai (2016) developed an original QFD method that connects customer requirements, maritime risks, and resilience measures simultaneously [94]. He et al. (2020) incorporated the results obtained by the Kano model and DEMATEL into QFD, converted customer requirements into risk factors and then into resilience measures [95]. Lücker and Seifert (2017) built up resilience in a pharmaceutical supply chain through inventory, dual sourcing, and agility capacity [96]. Chen et al. (2020) also established three resilience measures in the supply chain, namely, additional inventory, dual sourcing procurement, and agility [97]. They then discussed the correlation between the three. Other studies on resilience measures include postponement and flexible transport [98], multi-source procurement and safety stocks [99], information sharing between partners [100], robustness [101].
Some scholars call RFs resilience strategies. To cope with supply chain risks, resilience strategies can enhance the ability of a supply chain to recover after disruption. Resilience strategies can be used for emergency risk management of supply and demand sides of the supply chain [102]. Different scholars have proposed different strategies for resilience. Chopra and Sodh (2004) proposed eight resilience strategies: (1) add capacity, (2) add inventory, (3) redundant suppliers, (4) increase responsiveness, (5) increase flexibility, (6) aggregate or pool demand, (7) increase capabilities, and (8) have more customer accounts [103]. Tang (2006) proposed nine resilience strategies: (1) postponement, (2) strategic stock, (3) flexible supply base, (4) make and buy, (5) economic supply incentives, (6) flexible transportation, (7) revenue management, (8) dynamic assortment planning, and (9) silent product rollover [98]. Chowdhury and Quaddus (2015) proposed eight resilience strategies: (1) back-up capacity, (2) building relation with buyers and suppliers, (3) quality control, (4) skill and efficiency development, (5) ICT adoption, (6) demand forecasting, (7) responsiveness to customers, and (8) security system improvement [104]. Other studies on resilience strategies include contingency, sourcing contingency rerouting, and demand switching [105], increasing human resource skills through training and cross-skills training [106], change of supply chain management responsibilities, implementing hierarchical management of suppliers, seeking coordinated implementation of inventory management mode, and improving the pre-risk identification system [107]. In addition, the most discussed resilience strategies in supply chains are alternative markets, capacity extensions, and flexible allocations or flexible rerouting strategies [102,108,109,110,111,112,113].
Given that RFs are concrete measures to improve RCs, the meaning of RCs is difficult for decision-makers to understand. Furthermore, because this study requires decision-makers to understand the specific measures to enhance RCs, specific RFs must be identified first. On the basis of actual demand, the case company’s experts were interviewed on how RFs could enhance RCs. This study lists 22 explored RFs that the case company plans to adopt in this study. These features will be evaluated in Section 4.
2.4. Integrating Resilience and Sustainability for Supply Chain
The term resilience is often used in conjunction with terms such as sustainability. Resilience is focused on the response of a system to persistent stress or extreme disturbances. In contrast, sustainability is focused on the quality of life for present and future generations with respect to social, economic, and environmental factors [58]. Research on supply chain management supports the analysis of the relationship between resilience and sustainability [114]. Marchese et al. (2018) argue that resilience analysis is a necessary prerequisite for achieving sustainability. They believe that the activities of the firm are sustainable on the condition that the core activities are resilient to destructive events [115]. If supply chains are to meet the dimensions of sustainability, their operational processes need to be resilient in this sense. This requires an analysis of the impact of implementing resilience strategies in terms of sustainability. Therefore, business decision-makers need to explore resilience strategies by considering the dimensions of sustainability. They seek to establish effective responses to eliminate the impact of potential disruptions [116], while maintaining the sustainable dimensions of the supply chains [117,118,119].
In recent years, the relevant supply chain resilience and sustainability studies are as follows. Fahimnia and Jabbarzadeh (2016) developed a multi-objective optimization model for resiliently sustainable supply chains [117]. Ramezankhani et al. (2018) proposed a dynamic network data envelopment analysis framework to assess a supply chain performance from both sustainability and resilience viewpoints [116]. Ivanov (2018) analyzed disruption propagation in the supply chain with consideration of sustainability factors in order to design a resilient supply chain structure [118]. Zavala-Alcívar et al. (2018) developed a conceptual framework that integrates the fundamental elements for analyzing, measuring, and managing resilience to increase sustainability in the supply chain [120]. Khot and Thiagarajan (2019) evaluated supply chain management practices for effective sustainable and resilience practices in the automobile industry of India [121]. Shin and Park (2019) applied an interpretive structural modeling approach to identify and design improvement planning for supply chain resilience for a higher level of sustainability and competitive advantage [122]. Thaiprayoon et al. (2019) investigated the impact of supply chain resilience on sustainability performance and the mediating role of sustainability consciousness in Thailand’s manufacturing sector [123]. Ivanov (2020) offered a viable supply chain framework by integrating agility, resilience, and sustainability perspectives [124].
As supply chains become more complex, managing disruption risks and achieving resilience have become more critical. A desirable supply chain design should consider not only sustainability issues, but also consider the proactive and reactive resilience strategies in the case of disruptions. [9]. Research on supply chain resilience and sustainability has become increasingly common in various fields, but research in a manufacturing context is still relatively sparse. Based on the above literature discussion, this study proposes the concept of enhanced resilience strategy for risk mitigation of sustainable supply chain as shown in Figure 2.
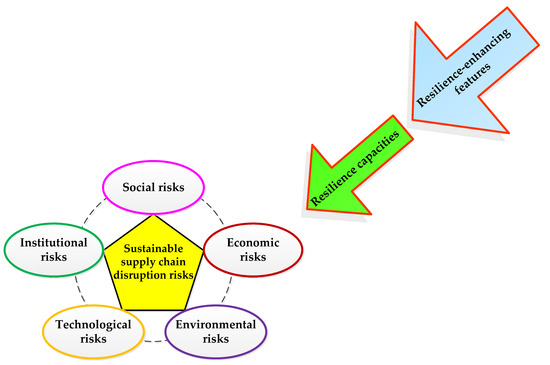
Figure 2.
The resilience-enhancing strategy to mitigate risk for sustainable supply chain.
3. Methodology
In this section, we first give a short literature review on the proposed MCDM-QFD approach, and then present the methodologies used in the later presentation. The methodologies of this paper are the focus group method (FGM), fuzzy Delphi method (FDM), failure mode and effect analysis (FMEA), and the VlseKriterijumska Optimizacija I Kompromisno Resenje (VIKOR) method.
3.1. The Proposed MCDM-QFD Approach
QFD is used to solve the design challenges of new services and products to effectively meet customer expectations [22,23]. A valid technique for converting customer requirements to technical attributes is through a relational matrix called the house of quality (HoQ). HoQ is the basic structure of QFD, including technical attributes, customer requirements’ importance weights, technical attributes, and the relationship matrix between customer requirements and technical attributes [24,25,26]. The first step in constructing the HoQ is to clarify the customer requirements so that they are well understood. Not all customer requirements have the same level of importance to customers, so a weighting technique should be used to weight customer requirements. Technical attributes are associated with customer requirements. The relationship matrix represents how each customer requirement affects its associated technical attributes, helping to determine the final importance of the technical attributes [125].
Among the numerous approaches available for conflict management, one of the most prevalent is MCDM. MCDM may be considered a complex and dynamic process [126]. To improve the practicality of QFD, scholars have integrated MCDM into QFD and proposed valuable extensions [22,24,127,128,129,130]. The VIKOR method is a highly useful MCDM technique and is used to solve discrete decision-making problems with non-commensurable and conflicting criteria. This method focuses on ranking and selecting from a set of alternatives and identifying compromise solutions to a problem with conflicting criteria, helping decision-makers make the final decision [131]. A compromise solution is the closest possible solution to an ideal situation, and a compromise means an agreement built through mutual concessions. The main advantage of the VIKOR method is that it introduces a multi-criteria ranking index to the ideal solution based on a specific measure of “closeness”, and the resulting compromise solution provides maximum group utility for the “majority” and minimum individual regret for the “opponents” [132,133]. Owing to its characteristics and functions, the VIKOR method has been widely studied and applied to group decision-making problems in recent years [134,135,136,137,138,139]. Therefore, this study proposed that the integrated FGM-FMEA-FDM-VIKOR framework-based QFD approach to building a sustainable risk resilience that can provide decision support for EMSCs by integrating MCDM and QFD.
This study has two HoQs in the QFD framework. We propose an integrated framework to elaborate the connections between SSCDRs and RCs and the connections between RCs and RFs, which are used for improving RCs and mitigating SSCDRs. The first HoQ links SSCDRs into RCs. Hence, SSCDRs appear as ‘whats’ in this HoQ, because manufacturing systems should initially identify what the risk affects; whereas RCs appear as ‘hows’, because they directly affect the way by which SSCDRs are treated. Then, the second HoQ identifies the RFs that can improve the RCs defined in the first HoQ. Hence, the RCs represent resilient requirements to improve and appear as ‘whats’ in the second HoQ, whereas the RFs are listed as ‘hows’ because they are practical measures that the manufacturing system can use to improve the RCs. Moreover, as shown in Figure 3, the weights of the RCs calculated in the first HoQ are the starting point in constructing the second HoQ and can be directly used as importance weights in the second HoQ. Thus, the second HoQ can be constructed following similar steps as in the first HoQ. These steps in this study are shown in Figure 3 and Figure 4. The symbols in the text from ① to ⑪ correspond to the steps illustrated in Figure 3 and Figure 4.
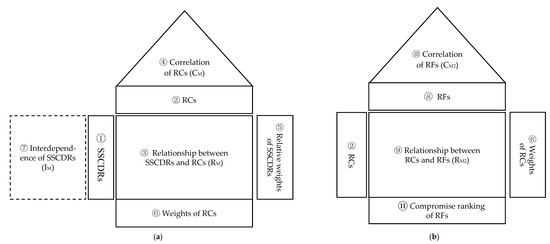
Figure 3.
Structure of the two-phase houses of quality (HoQs). (a) First HoQ; (b) Second HoQ.
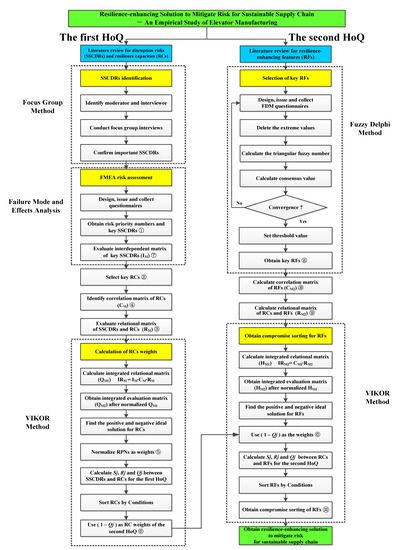
Figure 4.
Proposed framework to build sustainable risk resilience for elevator manufacturing supply chains.
3.2. HoQ 1: Linking SSCDRs and RCs
On the basis of the interview steps of FGM [140], a panel of experts initially determined important SSCDRs. Then, these experts confirmed potential causes and effects and further designed an FMEA questionnaire. Secondly, FMEA was used to obtain the RPNs. On the basis of the RPN value (weights), the top SSCDRs would be listed as key disruption risks ① These selected key disruption risks were further used to conduct the interdependent matrix (IM) ⑦. Based on the literature review in Table 1, key RCs, which were cited by at least five scholars, were selected for analysis ②. Then, we identified the correlation matrix of RCs (CM) ④ and the relational matrix of the key SSCDRs and RCs (RM) ③ Given that risks are interactional with one another [141,142,143], the integrated relational matrix of SSCDRs and RCs (IRM) is obtained by using Formula (1).
Finally, we normalized RPNs as relative weights of key SSCDRs ⑤ and used the VIKOR method to obtain the weights and ranks of the RCs ⑥.
3.3. HoQ 2: Linking RCs and RFs
We used FDM to select key RFs ⑧ by experts’ threshold value. Then, we calculated the correlation matrix of the RFs ⑩ and the relational matrix of the RCs and the RFs ⑨. The VIKOR method normalized the integrated evaluation matrix, and the positive and negative ideal solutions were found. We used (1 − ) as the weights ⑥ and calculated group utility, individual regret, and benefit ratio. Then, the VIKOR method proceeded with compromise sorting by conditional judgments for the RFs. Finally, we obtained the optimal scheme of the RFs to improve the RCs and mitigate the disruption risks. The proposed framework is shown in Figure 4.
3.4. Focus Group Method (FGM)
FGM has been a highly effective qualitative research tool; it makes it possible to gather detailed information regarding participant perceptions, opinions, beliefs, and attitudes regarding particular phenomena [144]. This method is well suited to explore and better understand the processes and intentions that drive supply chain members to determine SSCDRs, as interaction within the group helps participants better express and clarify their views [140]. The steps are described as follows [145]:
- Step A: Write down goals.
- Step B: Define target audience.
- Step C: Find a venue.
- Step D: Recruit participants.
- Step E: Design the questions.
- Step F: Moderate the group.
- Step G: Analyze.
3.5. FMEA
FMEA was proposed by NASA in 1963. This method has been extended and applied in various industries, assisting companies in identifying and quantifying potential deficiencies in the design stage [146]. The empirical evidence shows that the negative effects of supply chain disturbances can be categorized into a number of supply chain failure modes [78]. Therefore, we focused on the SSCDRs identified using FGM to determine the potential causes and effects. Given that different manufacturing systems are exposed to different disruption risks, their degree of occurrence and influence varies. Accordingly, the three criteria of severity (S), occurrence (O), and detection (D), should be discussed depending on the situation. This study referred to the corresponding semantic levels of international standards to design the FMEA questionnaire and calculate the risk priority numbers (RPNs) by using Formula (2).
RPN = S × O × D
3.6. Fuzzy Delphi Method (FDM)
Murray et al. (1985) developed an optimized FDM, which combines the traditional Delphi method and the fuzzy theory [147]. Experts’ judgments in FDM are represented by fuzzy numbers. This study used FDM to screen key RFs with experts’ threshold, because it can (1) reduce the survey numbers, (2) express the opinions of experts entirely, (3) become more rational in keeping with the needs, and (4) save more time and costs [148]. The steps are detailed as follows.
Step A: The FDM questionnaire was developed for the confirmed RFs. Each expert was requested to evaluate the content of each feature. The value range was indicated to target the level of importance of the evaluation targets. The minimum value of this value range represents the ‘most conservative cognitive value’ by the experts. By contrast, the maximum value of the value range represents the ‘most optimistic cognitive value’.
Step B: We calculated the most conservative value and the most optimistic value given by all the experts. Fuzzy theory was adopted to calculate the minimum value, geometric mean, and maximum value in the conservative value, as well as the minimum value , geometric mean , and maximum value in the optimistic value.
Step C: In accordance with Step B, the conservative value of the triangular fuzzy number for every assessment item i,and the triangular fuzzy number of the ‘most optimistic cognitive value’ were obtained, .
Step D: The consensus level was calculated. refers to the ‘value importance level that has reached a consensus’ as far as opinions of experts are concerned. The higher the is, the higher the consensus on a particular assessment criterion among the experts will be. can be calculated in the following three ways.
(1) If the triangular fuzzy numbers show no overlap, then signifies that the opinion intervals of the experts possess a consensus section. If so, then the evaluation item i ‘value importance level that has reached a consensus’ equals the average of and , which is expressed as.
(2) If two triangular fuzzy numbers overlap, then and , where and . In addition, the grey area of the fuzzy relationship is smaller than the interval between the experts’ evaluation criteria, ‘optimist cognitive of the geometric mean’, and ‘conservative cognitive of the geometric mean’. In that case, the ‘value importance that has reached a consensus’ of the assessment item is calculated based on Formula (3) [149].
(3) If two triangular fuzzy numbers show an overlap, then and. This condition indicates a grey area with a fuzzy relationship () is less than the interval range of evaluation criteria, ‘optimistic cognition of the geometric mean’ and ‘conservative cognition of the geometric mean’ (). Thus, the opinion interval values of the experts had no consensus, and the opinions of the experts that gave extreme values and the opinions of other experts showed great disparities, leading to opinion divergence. Hence, criteria that have not undergone convergence were repeated (Steps A–D) until all criteria reached convergence and obtained the ‘value importance reached the consensus’ .
Step E: All criteria that did not reach the threshold value were deleted after setting the threshold value of .
3.7. VIKOR Method
The VIKOR method, proposed by Opricovic (1998), is a compromise sorting method in MCDM [150]. Though there are many approaches to handle issues related to business management, when there are conflict or substitution situations between indicators, it may cause deviations in the results [149]. The VIKOR method can overcome this problem and be used for ranking, sorting, and selecting a set of conflicting alternatives. The advantage of VIKOR can reflect the subjective preferences of decision-makers and determine more valid results than other methods for issues with conflicting criteria, as it is characterized by maximizing “group utility” and minimizing “individual regrets” of the “opponent” [132].
The VIKOR method evaluates every feasible alternative based on each criterion function. In Figure 5, is the ideal solution, is the ideal value of the first evaluation criterion, and is the ideal value of the second evaluation criterion. When the two assessment criteria have conflicting characteristics, in order to achieve the desired value of the first criterion, the performance of the second criterion must be sacrificed, and vice versa. Therefore, a compromise must be sought for the two conflicting criteria to reach an agreement. In the arc (non-inferior solution set), is a feasible solution closest to in the feasible solution, so is the best solution after a compromise has been reached.
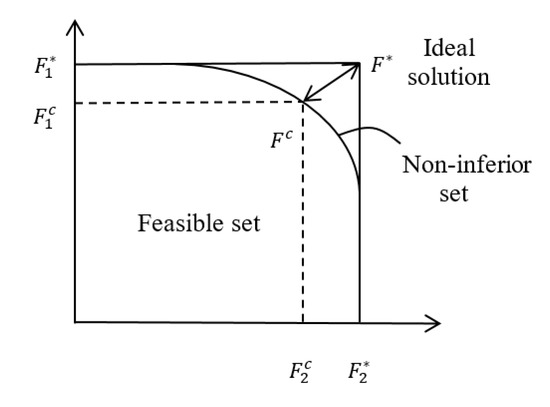
Figure 5.
Basic concept of the VIKOR method.
The steps are as follows:
Step A. Normalize the original data
Taking the first HoQ as an example, the original data are normalized as rij, where B is the set of criteria, m is the number of disruption risks, and n is the number of RCs.
Step B. Find the positive ideal and negative ideal solution
In the above formula, is the performance evaluation value of the alternative j on the i evaluation criteria, is a set of benefit-oriented criteria, is the set of cost-oriented criteria, is the positive ideal solution, and is the negative ideal solution.
Step C. Calculate the group utilityand the individual regret
where is the relative weight of disruption risks i. In this study, the normalized RPN values of FMEA were taken as the relative weights of disruption risks in the first HoQ. The sorting weights of the first HoQ were taken as the relative weights of RCs in the second HoQ.
Step D. Calculate:denotes the benefit ratio that can be generated by the alternative j.
where ; . v ∈ [0, 1] is the decision-making mechanism coefficient, used as the weight of the strategy, where v > 0.5 indicates the basis of maximizing the group utility, v < 0.5 represents the basis of minimizing the individual regret, and v = 0.5 represents the basis of consensus decision-making.
Step E. According to the relationships of,, andproceed to the ranking of the alternatives
When the following two conditions are satisfied, we can sort the alternatives according to the value of (the smaller the better).
Condition 1: Acceptable benefits of the threshold conditions
In the above Formula (10), according to the sorting of Qj, Q’ represents the Qj value of the first-ranked alternative, Q” represents the Qj value of the second-ranked alternative, and J is the number of alternatives. This formula indicates that the difference between the two benefit rate () values of the two adjacent alternatives must exceed the threshold 1/(J − 1) in order to confirm that the first-ranked alternative is significantly better than the second.
Condition 2: Acceptable decision reliability
After considering the ranking of Q values, the S value (S’) of the first-ranked alternative must also be better than the S value (S”) of the second-ranked alternative; or the R value (R’) of the first-ranked alternative must also be better than the R value (R”) of the second-ranked alternative. When there are several alternatives to be compared at the same time, using the above procedures, the following two alternatives should be examined to check if they are in line with Condition 2.
Step F. Decision rules
If the relationship between the first and the second-ranked alternatives is in line with Conditions 1 and 2 simultaneously, then the first alternative is accepted as the best one; if the relationship between the first-ranked alternative and the second-ranked alternative “only meets Condition 2”, then both the first and second-ranked alternatives are accepted as the best alternatives.
4. Empirical Study
This study focuses on the elevator manufacturer industry in Taiwan, which will allow us to verify the proposed framework. Given its product characteristics, the case company’s supply chain length is short, but its components come from many different types of supplier. The current case company’s supply chain is facing internal and external risks that have worried the managers. In this study, in-depth structured interviews were conducted with experts from different departments. The selected departments were chosen because they were the most relevant to the topic of SSCDRs and resilience. Views from different departments were gathered to make a holistic judgment. The data obtained were converted into two-phase HoQs.
4.1. First HoQ linking SSCDRs and RCs
Stage I: Confirmation of important SSCDRs using FGM
On the basis of the FGM, we invited eight experts to take part in a focus group interview to confirm the suitability of disruption risks affecting the supply chain. We screened a comprehensive list of 130 SSCDRs to form a list of 22. On the basis of these 22 important SSCDRs, the experts were invited to confirm the possible causes and effects and then further designed an FMEA questionnaire, as indicated in Table 2.
Table 2.
Important SSCDRs selected by FGM and causes and effects.
As seen in the examples of the SSCDRs numbers 8 and 17, a successful supply chain largely depends on the consumption of products by downstream customers. Customer loyalty is largely influenced by retail prices and retail services, ultimately helping enterprises build a strong brand image based on product quality [151]. Procurement strategies are widely used to manage supply risks when firms face supply disruptions from upstream suppliers [152]. For the case company, the risk of product price may result in an improper product price affecting the consumer market, and the improper purchase price of upstream raw materials affecting suppliers. The possible reason for this result is that the overall control of the product cost is not good or the price strategy of the enterprise is not good. When faced with random demand, participants in the supply chain will increase their focus on risk. Examples include production, pricing, and investment in quality or service. In addition, different participants in the supply chain may have different degrees of risk aversion [153]. If strategic alliances and partnerships with suppliers are needed, not only punishment mechanisms but also incentive mechanisms should be considered [154]. A strike is a collective refusal of work by workers to express their protest [155]. For example, in 2019, United Auto Workers (UAW) and General Motors failed to reach an agreement on a new labor contract, and 46,000 workers went on strike. The strike shut down all factories in the US and affected the network of manufacturers that produce components. These suppliers were left with little to do but wait out the strike. For the case company, the lack of a perfect incentive mechanism may lead to effects such as the low morale/satisfaction of employees, the inability to retain/attract talent, and difficulty in attracting good suppliers, which may be caused by defects of the system or obstacles to various practical factors.
Stage II: Obtainment of key SSCDRs and RPNs using FMEA
Different manufacturing systems involve distinctive disruption risks, different possibilities of occurrence, and various degrees of influence. Accordingly, the three failure measurement items of severity (S), occurrence (O), and detection (D) should be discussed depending on the situation under investigation. This study referred to the international standard MIL-STD-882 to design an /FMEA questionnaire and calculate the RPNs. Finally, the questionnaires were completed, and the RPNs were calculated using Formula (2). According to the RPN values (weights), the top-10 factors will be listed as the key SSCDRs. Table 3 shows the calculation results. These key SSCDRs would be included in Part ① of the first HoQ, as shown in Figure 3, Figure 4, and Figure 6. As shown in Table 3, the three SSCDRs with the highest RPN values are ‘unexpected events lead to changes in supplier delivery dates’, ‘typhoon’, and ‘lack of critical capacities/skilled employees’.
Table 3.
FMEA screening results of key SSCDRs and RPNs.
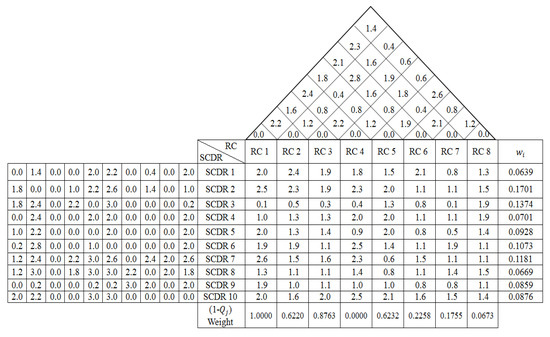
Figure 6.
First house of quality (HoQ) between SSCDRs and RCs.
Stage III: Evaluation of interdependent matrix between SSCDRs (IM)
Relevant studies show that risks contain interdependent effects [141,142,143]. To investigate the interdependent effects of SSCDRs, the expert panel was asked to evaluate the interdependent matrix. Taking the results of the FMEA, 10 key SSCDRs were further used to conduct the interdependent analysis. The assessors should consider whether a mutual influence exists between the risks, and they were required to use 0–1–2–3 scale for the evaluation. We took the total average of the evaluations as the final result. Table 4 shows the results. The interdependent matrix would be included in Part ⑦ of the first HoQ, as shown in Figure 3, Figure 4, and Figure 6.
Table 4.
Interdependent matrix of key SSCDRs (IM).
Stage IV: Identification of correlation matrix between RCs (CM)
Based on the review of RCs in Table 1, we only cited key RCs that have been proposed by more than five scholars in the reviewed literature. Eight RCs were selected in this study. The key RCs would be included in Part ② of the first HOQ, as shown in Figure 3, Figure 4, and Figure 6.
Relevant field experts were also invited to assess the correlation of RCs to understand whether they complement or conflict with one another. The degree of correlation between RCs was assessed using assessment scales of 0–1–2–3, which represent low, moderate, and high correlation, respectively. The correlation matrix shown in Table 5 would be included in Part ④ of the first HOQ, as shown in Figure 3, Figure 4, and Figure 6.
Table 5.
Correlation matrix of key RCs (CM).
Stage V: Evaluation of relational matrix between SSCDRs and RCs (RM)
The experts were further asked to assess the relationship between the SSCDRs and the RCs to depict the interrelated situation between the two groups of items. The degree of the relationship was also determined using assessment scales of 0–1–2–3. The relational matrix shown in Table 6 would be included in Part ③ of the first HoQ, as shown in Figure 3, Figure 4, and Figure 6.
Table 6.
Relational matrix of SSCDRs and RCs (RM).
Stage VI: Calculation of integrated evaluation matrix between SSCDRs and RCs (QM1)
In this study, the VIKOR method was applied to calculate the weights of the RCs that need to be used to cope with the SSCDRs identified by the case company. As mentioned in the aforementioned literature, risks are interactional with one another. Therefore, the interdependence matrix (IM) was considered in addition to the correlation matrix (CM) and the relational matrix (RM). Using Formula (1), the interdependence matrix (IM) of the SSCDRs was multiplied by the correlation matrix (CM) of the RCs and then multiplied by the relational matrix (RM) between the SSCDRs and the RCs. The integrated evaluation matrix (QM1) is shown in Table 7.
Table 7.
Integrated evaluation matrix of SSCDRs and RCs (QM1).
Stage VII: RC prioritization
The sorting weights and ranks of the RCs for resisting SSCDRs could be obtained using the VIKOR method. Suggestions of RCs were proposed to the decision-makers in response to the effects of the SSCDRs in this study. The processes of the VIKOR method are as follows.
A. Normalize the original data:
The integrated evaluation matrix (QM1) of Table 7 was inserted into Formula (4) for normalization. After normalization, the matrix (QM2) would fall between [0, 1]. Table 8 shows the results.
Table 8.
Integrated evaluation matrix (QM2) after normalized (QM1).
B. Find the positive and negative ideal solutions:
The normalized matrix (QM2) of Table 8 was introduced into Formulas (5) and (6) to obtain the positive ideal solution and the negative ideal solution of the RCs, respectively. Table 9 shows the results.
Table 9.
Positive ideal solution and negative ideal solution of RCs.
C. Calculate group utilityand individual regret:
In this process, group utility and individual regret were calculated using Formulas (7) and (8), respectively, where is the relative weights of the normalized RPN of FMEA in Table 3. The relative weights of the SSCDRs shown in Table 10 would be included in Part ⑤ of the first HoQ, as shown in Figure 3, Figure 4, and Figure 6.
Table 10.
Relative weights of SSCDRs after normalization.
Then, the relative weights were substituted into Formulas (7) and (8) to calculate group utility and individual regret , respectively. Table 11 shows the results.
Table 11.
Results of group utility and individual regret .
D. Calculate the benefit ratio:
We used Formula (9) to calculate the value of . We set v to 0.5 in VIKOR to maximize group utility and minimize individual regret. The calculation results of benefit ratio are shown in Table 12.
Table 12.
Calculation results of benefit ratio .
E. Sort RCs:
According to the two conditions of Section 3.7, in Table 12 was inserted into Formula (10). If the two conditions are true, then they can be sorted on the basis of the value of .
Based on Table 13, the first two values of were inserted into Formula (10), and the difference was , which is less than 1/(8 − 1) and thus does not meet Condition 1.
Table 13.
Sorting results of RCs.
As shown in Table 13, the S1 value of agility is 0.6468, which is less than the S3 value of capacity (0.6478). Therefore, S1 shows better performance than S3. In addition, the agility R1 value (0.1216) is less than the capacity of R3 (0.1229), and R1 performance is better. Therefore, Condition 2 is met.
From the two results relating to the value of the top two R1 and R3, according to the decision rules, the two RCs should be accepted as the best alternative simultaneously. This study aims to obtain the weight of each RC. Thus, we used the value directly. However, the smaller the value of is, the better the result will be. Thus, we used as the sorting weights of the RCs in the first HoQ for the next HoQ. The sorting results shown in Table 13 would be included in Part ⑥ of the first HoQ, as shown in Figure 3, Figure 4, and Figure 6.
Table 13 shows that the three RCs with the highest sorting weights are RC1 (agility), RC3 (capacity), and RC5 (visibility).
After the completion of the FGM, FDM, and VIKOR method in the first HoQ, the sorting weights and ranks of the RCs could be obtained. The first HoQ results in this framework are shown in Figure 6.
4.2. Second HoQ linking RCs and RFs
Stage I: Selection of key RFs using fuzzy Delphi method
The second HoQ in this study was adopted to connect the RCs and RFs by FDM and VIKOR method.
Table 14 lists 22 explored RFs that the case company plans to adopt. The RFs at five dimensions were screened by FDM. Firstly, the designed FDM questionnaire was distributed to the supply chain experts of the case company, and they were asked to evaluate the minimum and maximum values of each feature according to their judgment of experience in a 0−10 range. After the questionnaires were collected, the extreme values beyond twice the standard deviation were removed. The results show that the questionnaire data are within the range of two standard deviations, and no extreme values exist. Table 14 shows the results.
Table 14.
Fuzzy Delphi method (FDM) results of key RFs.
The higher the level of is, the higher the consensus of the experts on the RFs will be. If the consensus level is extremely low or below the threshold, the RFs should be removed. The threshold in this study was 6.5 according to the needs of the case company. The remaining 13 RFs were removed. These selected RFs, as shown in Table 14, would be included in Part ⑧ of the second HoQ, as shown in Figure 7. They would be used in the construction of the second HoQ.
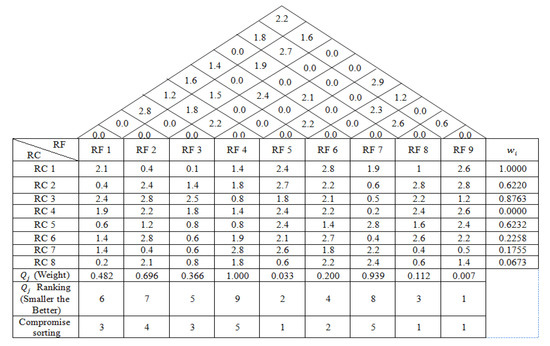
Figure 7.
Second HoQ between RCs and RFs.
Stages II–V of the second HoQ are the same as those of the first HoQ. These same stages include: (1) correlation matrix between RFs, (2) relational matrix between the RCs and the RFs, (3) integrated relational matrix between the RCs and the RFs and (4) compromise ranking of the RFs.
The ranking weight (1 − ) of the RCs from the first HoQ was inputted into the second HoQ to calculate the ranking of the RFs. Table 15 and Figure 7 show the results of the entire process. The second HoQ shows that the most important RFs were ‘Connection of the working site and the backstage’ (RF5), ‘Product development and design enhancement’ (RF8), and ‘Real-time sharing of job information’ (RF9), followed by ‘Choose to support and motivate employees’ (RF6). ‘Allocation and input of enterprise resources’ (RF1) and ‘Establish a clear incentive and reward system’ (RF3) ranked third.
Table 15.
Compromise sorting of RFs.
4.3. Implications and Recommendations
In this study, the QFD-based integration framework provides a risk-driven tool for building risk resilience solutions by converting SSCDRs to resilience capacities and resilience capacities to resilience-enhancing features. With such a decision framework, a manufacturing system’s risk resilience solutions can be risk-oriented and proactive, because the framework enables manufacturers to plan resilience solutions ahead of time in response to SSCDRs.
In terms of supply chain risks and resilience capacities in the first HoQ, Table 3 shows that the top-three risks are ‘unexpected events lead to changes in supplier delivery dates’, ‘typhoon’, and ‘lack of critical capacities/skilled employees’. The ranking weights and compromise ranking of resilience capacities, as shown at the bottom of Table 13, reveal that agility, capacity, and visibility are the top concerns perceived. As shown in Figure 6, prioritizing important resilience will go a long way towards mitigating the top-three supply chain risks. The results show that agility ranks on the top position, because it has the highest group utility and the lowest individual regret. Thus, an enhancement in agility to mitigate SSCDRs is the most effective strategy for the case company. Agility emphasizes perceived ability and responsiveness. When a company is in a dynamic and rapidly changing environment, accurate perception of the changes and a quick response are important factors for companies to survive. This result conforms to the argument in the literature that agility is considered one of the most effective strategies to mitigate SSCDRs. Capacity and visibility rank second and third in the VIKOR results. To cope with SSCDRs, the case company needs to have sufficient capacity and visibility to overcome these internal and external factors from the FMEA. Furthermore, the other resilience capacities after compromise sorting can also be provided to the case company for reference for mitigating SSCDRs.
In terms of resilience capacities and resilience-enhancing features in the second HoQ, resilience capacities act as the intermediary for the other two variables. However, each resilience capacity is a proper noun, which can be difficult for decision-makers to understand. Therefore, decision-makers do not know how to improve the resilience of the supply chain. The top three resilience-enhancing features are ‘the connection of the working site and the backstage (RF9)’ and ‘product development and design enhancement (RF5)’, and ‘real-time sharing of job information (RF8)’. The compromise sorting of the three resilience-enhancing features is also ranked first. Resilience is a multidimensional concept; thus, it covers various capacities. Therefore, enhancing resilience by improving a single capacity is impossible. The case company should focus on consolidating the three features, namely, RF9, RF5, and RF8, to improve resilience capacities. Supply chain risks (especially the top-three SSCDRs) can also be mitigated when the resilience capacities are improved. RF9 enables the case company to quickly detect changes and predict them. With accurate and timely information flowing seamlessly between business units, decision-makers will have visibility into what is going on inside and outside the enterprise in real-time, as well as have a more effective control over all parts of the supply chain. When managers decide, they need RF8. Employees can quickly and actively cooperate with the execution to minimize the effects of risks or even completely avoid the occurrence of risks. Enterprises with RF5 enjoy long-term success and growth. The case company can save money and improve the quality of supply with a lower cost by implementing the stage early in the product development and design to examine supply chain risks. Good product development and design have procedures in place to evaluate disruption risks and mitigate them. The next RF is ‘choose to support and motivate employees (RF6)’ followed by ‘allocation and input of enterprise resources (RF1)’ and ‘establish a clear incentive and reward system (RF3)’. After compromise sorting, these resilience-enhancing features can also be provided to the case company for reference for enhancing resilience capacities and mitigating SSCDRs.
Given the limited resources, the Pareto effect can be applied to the results based on this framework. Elevator manufacturers can initially strengthen the most important resilience-enhancing features and jointly enhance the most important resilience capacities, thereby, mitigating the most important SSCDRs. This action not only strengthens resilience-enhancing features but also indirectly enhances and mitigates the effect of other minor resilience capacities and risks. Alternatively, once the top-three resilience-enhancing features have been enhanced, the other resilience-enhancing features can be further enhanced sequentially, thereby continuing to affect resilience capacities and SSCDRs. Finally, when all resilience-enhancing features can be valued and strengthened, the enhancement for the overall resilience capacities and risk mitigation can considerably improve risk resilience for manufacturing systems.
On this basis, resilience is an organizational ability that cannot be gained by market purchases. Manufacturing systems must continuously invest capital and time to gradually expand the scale of supply chain resilience. In this manner, any SSCR can be readily solved and even converted into new opportunities, such that manufacturing systems can achieve the objective of resilient supply chains.
5. Conclusions
In a competitive global market with increasing sustainable supply chain disruption risks, manufacturers have recognized the necessity of creating resilient supply chains for manufacturing systems. This study widens the perspective on sustainable risk resilience management in elevator manufacturing supply chains by considering the principal sustainable supply chain disruption risks, resilience capacities, and resilience-enhancing features from a supply chain viewpoint. Through an empirical investigation, the key findings are as follows.
- The top-three sustainable supply chain disruption risks are respectively ‘unexpected events lead to changes in supplier delivery dates’, ‘typhoon’, and ‘lack of critical capacities/skilled employees’.
- The top-three resilience capacities are respectively agility, capacity, and visibility.
- The top-three resilience-enhancing features are respectively ‘connection of the working site and the backstage’ and ‘product development and design enhancement’ and ‘real-time sharing of job information’.
The following are the main contributions of this study are described as follows:
Firstly, the integrated FGM–FMEA–FDM–VIKOR framework-based QFD approach is proposed to build a supply chain risk resilience that can provide decision support for elevator manufacturing supply chains by integrating MCDM and QFD.
Secondly, sustainable supply chain disruption risks, resilience capacities, and resilience-enhancing features are integrated into the framework to investigate and explore the interrelationships between different variables thoroughly, which can provide comprehensive insights into constructing feasible resilience solutions for sustainable supply chain risk mitigation for elevator manufacturing supply chains.
Thirdly, through the proposed framework, elevator manufacturers can effectively adjust their strategies, operations, and management for manufacturing systems with a clear idea of where to improve their supply chain resilience in response to sustainable supply chain disruption risks.
In terms of related research on resilience before 2020, Lam and Bai (2016) adopted a two-stage HoQ to enhance the resilience of maritime supply chains to investigate customer requirements, maritime risks and resilience measures, and finally determine the priority of the resilient solutions of shipping companies [94]. He et al. (2020) also adopt a two-stage HoQ to enhance the resilience of white goods supply chains to investigate customer requirements, risk factors, and resilience measures and finally determine the effective design of elastic solutions for home appliance companies [95]. All these papers have contributed to the study of resilience. Although these papers are all about finding important measures for resilience, they do not consider the connection to resilience capacities. These resilience capacities are important parts of resilience. In addition to investigating the relationship between the three groups of variables (sustainable supply chain disruption risks, resilience capacities, and resilience-enhancing features), this study also places special emphasis on the connection with resilience capacities. Thus, the resilience-enhancing features adopted can be fully correlated with resilience capacities. Through the full discussion between the two, we can fully grasp the spirit of resilience and find out important resilience measures to improve risk resilience for elevator manufacturing supply chains.
This study provides two suggestions for future research. Firstly, manufacturing systems in different industries can use the framework for risk resilience solutions. However, the different characteristics of the industry under examination must be considered to identify its distinctive risks, which can then be imported into the proposed framework. Finally, a user-friendly decision support system can be developed for the framework to enable manufacturers and manufacturing systems to effectively establish supply chain risk resilience and improve the level of automation of related activities.
The study has some limitations. This study is based on the case company as the research object. However, owing to the limitation of time and cost and other factors, if the number of companies can be increased, the reference value for the industry will be increased. In addition, if the analysis of the resilience-enhancing solution can increase the cost and benefit will benefit decision-makers.
Author Contributions
Conceptualization, C.-H.H. and R.-Y.Y.; methodology, C.-H.H. and A.-Y.C.; software, R.-Y.Y. and W.-H.C.; validation, C.-H.H., R.-Y.Y. and A.-Y.C.; formal analysis, C.-H.H. and W.-L.L.; investigation, R.-Y.Y. and W.-H.C.; resources, C.-H.H. and W.-L.L.; data curation, R.-Y.Y. and W.-H.C.; writing—original draft preparation, R.-Y.Y. and W.-H.C.; writing—review and editing, C.-H.H. and R.-Y.Y.; visualization, C.-H.H. and W.-L.L.; supervision, C.-H.H. and A.-Y.C.; project administration, C.-H.H. and A.-Y.C.; funding acquisition, C.-H.H. All authors have read and agreed to the published version of the manuscript.
Funding
This paper was supported by Natural Science Foundation of Fujian Province of China (Grant No. 2019J01790) and the Education and Scientific Research Foundation of Fujian Province Finance Department of China (Grant No. GY-Z21001).
Institutional Review Board Statement
Not applicable.
Informed Consent Statement
Not applicable.
Data Availability Statement
Not applicable.
Acknowledgments
The authors are very much indebted to the Editor-in-Chief and anonymous referees who greatly helped to improve this paper with their valuable comments and suggestions.
Conflicts of Interest
The authors declare no conflict of interest.
Abbreviations
| Elevator manufacturing supply chains | EMSCs |
| Sustainable supply chain disruption risks | SSCDRs |
| Resilience capacities | RCs |
| Resilience-enhancing features | RFs |
| Multicriteria decision-making | MCDM |
| Quality function deployment | QFD |
| Houses of quality | HoQ |
| Focus group method | FGM |
| Failure mode and effect analysis | FMEA |
| Risk priority numbers | RPNs |
| Fuzzy Delphi method | FDM |
| VlseKriterijumska Optimizacija I Kompromisno Resenje | VIKOR |
Appendix A
Table A1.
Scholars have proposed internal supply chain risk factors.
Table A1.
Scholars have proposed internal supply chain risk factors.
| Risk Factors for Internal Disruption (68 Items) | A | B | C | D | E | F | G | H | I | J | K | L | M | N | O | P | Q | R | S | T | U | |
|---|---|---|---|---|---|---|---|---|---|---|---|---|---|---|---|---|---|---|---|---|---|---|
| Physical accident | Damaged handling equipment (stacker, crane, elevator) | ● | ● | ● | ● | ● | ● | ● | ● | ● | ● | ● | ||||||||||
| Damage to operating equipment causing temporary or permanent inoperability | ● | ● | ● | ● | ● | ● | ● | ● | ● | ● | ● | ● | ||||||||||
| Storage space damage (outdoor tents, indoor cabinets) | ● | ● | ● | ● | ● | ● | ||||||||||||||||
| Damage of air conditioning equipment (especially refrigeration space) | ● | ● | ● | ● | ● | |||||||||||||||||
| Fire (esp. in a warehouse or machine room) | ● | |||||||||||||||||||||
| Improper storage of explosive and flammable materials | ● | |||||||||||||||||||||
| Product damage during storage | ● | ● | ||||||||||||||||||||
| Operating risk | Interruption in administrative/data file flow process | ● | ||||||||||||||||||||
| Product safety and quality | ● | ● | ● | ● | ● | ● | ● | ● | ● | ● | ● | ● | ● | ● | ||||||||
| Reduction or loss of the value of a commodity | ● | |||||||||||||||||||||
| Inventory increase, longer storage time | ● | ● | ● | ● | ||||||||||||||||||
| Disruption of supply to customers | ● | ● | ● | |||||||||||||||||||
| Limited supply capacity | ● | ● | ● | ● | ● | |||||||||||||||||
| Inventory shortage | ● | ● | ● | ● | ● | ● | ● | ● | ● | ● | ● | |||||||||||
| Labor not being used efficiently | ● | ● | ● | ● | ● | ● | ● | |||||||||||||||
| Mission failing to complete | ● | ● | ||||||||||||||||||||
| Improper or incorrect inventory management | ● | ● | ● | |||||||||||||||||||
| Unsmooth production due to equipment conversion or technical change | ● | ● | ● | ● | ● | ● | ● | |||||||||||||||
| Long lead time and inelastic process | ● | |||||||||||||||||||||
| Reliance on a single supplier, contingencies leading to delays in delivery | ● | ● | ● | ● | ● | ● | ● | ● | ● | |||||||||||||
| Elevated work/storage | ● | ● | ● | ● | ● | ● | ● | ● | ● | ● | ● | ● | ||||||||||
| Insufficient storage space | ● | ● | ● | ● | ● | ● | ● | ● | ● | ● | ||||||||||||
| Spending too much time with bad clients | ● | |||||||||||||||||||||
| Spending too much time and resources on bad employees | ● | |||||||||||||||||||||
| Poor location (limited storage of goods at a given location) | ● | ● | ● | ● | ● | |||||||||||||||||
| Omitted supervision during operation | ● | ● | ● | ● | ● | ● | ● | ● | ● | ● | ● | ● | ● | ● | ● | |||||||
| Unexpected investment required by the business prior to maintenance | ● | |||||||||||||||||||||
| Lack of spare parts | ● | ● | ||||||||||||||||||||
| Excessive dependence on small customers | ● | ● | ● | ● | ● | ● | ● | ● | ● | ● | ||||||||||||
| Abnormal customer order information and cognitive errors in the product | ● | ● | ||||||||||||||||||||
| Personnel risk | Worsening employee relations | ● | ||||||||||||||||||||
| Improper personal characteristics or poor quality of the employee | ● | ● | ● | ● | ● | ● | ||||||||||||||||
| Loss of business records, statements, bills | ● | ● | ||||||||||||||||||||
| Lack of staff with key abilities/skills | ● | ● | ● | ● | ● | ● | ● | |||||||||||||||
| Employee accidents at work | ● | ● | ● | ● | ||||||||||||||||||
| Employees unfamiliar with how to respond to workplace accidents | ● | ● | ● | |||||||||||||||||||
| Internal equipment theft/loss | ● | ● | ● | |||||||||||||||||||
| New employees (unskilled employees) cause delays in delivery | ● | ● | ● | ● | ● | ● | ● | ● | ● | ● | ● | ● | ||||||||||
| Negative personnel changes | ● | |||||||||||||||||||||
| Confidential information was leaked by an insider | ● | ● | ● | |||||||||||||||||||
| The employee not managing the equipment professionally or not detecting any abnormality in the operation | ● | ● | ● | ● | ● | ● | ● | ● | ||||||||||||||
| Employees not sharing the company’s vision and not belonging to the company | ● | |||||||||||||||||||||
| Low staff morale and increased stress | ● | |||||||||||||||||||||
| Internal strike | ● | ● | ● | ● | ● | ● | ||||||||||||||||
| Strategic management risks | Credit losses | ● | ● | ● | ● | ● | ● | |||||||||||||||
| Poor product design or manufacturing process | ● | ● | ● | ● | ● | ● | ● | |||||||||||||||
| Supplier selection/outsourcing risks | ● | ● | ● | ● | ● | ● | ● | ● | ● | ● | ||||||||||||
| Short product life cycle | ● | |||||||||||||||||||||
| Wrong management policy and marketing strategy | ● | ● | ● | ● | ||||||||||||||||||
| The product price | ● | ● | ● | |||||||||||||||||||
| Management changes or poor organizational management | ● | ● | ● | ● | ● | ● | ● | ● | ● | |||||||||||||
| Incentives not in place or insufficient (bonuses, promotions, etc.) | ● | |||||||||||||||||||||
| Improper salary levels | ● | ● | ● | ● | ● | |||||||||||||||||
| The problem of joining and cooperation | ● | ● | ||||||||||||||||||||
| Changes in shareholder structure | ● | ● | ● | ● | ● | ● | ● | ● | ● | ● | ● | ● | ● | |||||||||
| The organization not training staff in time (education and training) | ● | ● | ● | ● | ● | ● | ||||||||||||||||
| Business interruption (interruption of a specific business process, such as warehousing, loading, etc.) | ● | ● | ||||||||||||||||||||
| Reduced production projects | ● | ● | ● | ● | ● | ● | ● | ● | ||||||||||||||
| Information system | Managers losing contact with employees, causing production delays | ● | ● | |||||||||||||||||||
| Introducing or changing IT systems, failure to adapt results in reduced efficiency | ● | ● | ● | ● | ● | ● | ● | ● | ● | ● | ● | ● | ||||||||||
| Corruption of internal IT infrastructure or intrusion of information system (virus, software exception) | ● | ● | ● | ● | ● | ● | ● | ● | ● | ● | ● | ● | ● | ● | ● | |||||||
| Inadequate methods, concepts, and tools for enterprise information applications | ● | ● | ● | ● | ● | ● | ● | ● | ● | ● | ● | |||||||||||
| Overreliance on data | ● | |||||||||||||||||||||
| Interference or shutdown of wireless network | ● | ● | ||||||||||||||||||||
| No upstream/downstream communication has been established | ● | ● | ● | ● | ● | ● | ||||||||||||||||
| Inefficient network communication | ● | ● | ● | ● | ● | ● | ● | ● | ● | ● | ● | ● | ● | |||||||||
| Incorrect integration or accuracy of information leads to incorrect predictions | ● | ● | ● | ● | ● | ● | ● | ● | ● | ● | ● | ● | ||||||||||
| Data loss, unable to render information | ● | ● | ● | ● | ● | ● | ||||||||||||||||
| Scholar | A: Koblen, Ivan et al. (2015) [156]; B: Wagner and Bode(2008) [157]; C: Tang et al. (2011) [48]; D:Christopher and Lee (2001) [158]; E: Juttner et al. (2003) [159]; F: Van Landeghem and Vanmaele (2002) [160]; G: Alhawari et al. (2012) [49]; H: Jereb et al. (2012) [50]; I: Thun and Hoenig (2011) [47]; J: Mohammaddust et al. (2015) [54]; K:Song et al. (2015) [52]; L: Ouyang et al. (2015) [161]; M:Isaksson and Seifert et al. (2016) [162]; N:Dominguez et al. (2016) [163]; O: Mackelprang and Malhotra. (2015) [164]; P: Cheng et al. (2015) [165]; Q: Cao et al. (2014) [51]; R:Helmi et al. (2017) [166]; S:Gautam et al. (2018) [167]; T:Ali et al. (2019) [168]; U:Cai et al. (2020) [169]. | |||||||||||||||||||||
Table A2.
Scholars have proposed external supply chain risk factors.
Table A2.
Scholars have proposed external supply chain risk factors.
| Risk Factors for External Disruption (62 Items) | A | B | C | D | E | F | G | H | I | J | K | L | M | N | O | P | Q | R | S | T | U | |
|---|---|---|---|---|---|---|---|---|---|---|---|---|---|---|---|---|---|---|---|---|---|---|
| Man-made disasters | Terrorist attacks | ● | ● | ● | ● | ● | ● | |||||||||||||||
| Forgery, intellectual property risk | ● | ● | ||||||||||||||||||||
| Goods stolen or lost | ● | ● | ● | ● | ● | ● | ||||||||||||||||
| The impact of local events (labor strikes, industrial accidents) leading to supply disruptions or loss of production capacity | ● | ● | ● | ● | ● | ● | ● | |||||||||||||||
| Air traffic accident | ● | |||||||||||||||||||||
| Power interruption (unexpected interruption of power) | ● | ● | ● | ● | ● | ● | ● | ● | ||||||||||||||
| Gas supply interruption (unexpected interruption of gas) | ● | ● | ||||||||||||||||||||
| Exceptions to external IT infrastructure | ● | ● | ● | |||||||||||||||||||
| Outsourced manufacturer did not repair or maintain the equipment correctly | ● | |||||||||||||||||||||
| Culture, social factors, customs | ● | ● | ● | ● | ||||||||||||||||||
| A bad or incorrect portrayal of the company by the media | ● | |||||||||||||||||||||
| Suppliers meet with customers | Delayed goods due to changes in the supplier’s owner or management or policy adjustments | ● | ● | ● | ● | ● | ● | ● | ● | ● | ● | |||||||||||
| Supplier’s raw materials or parts supply interruption causing the delivery time to be delayed or unable to deliver | ● | ● | ● | ● | ● | ● | ● | ● | ● | ● | ● | |||||||||||
| Supply quality not being up to standard, need to return or reprocessing affecting downstream manufacturers or customers | ● | ● | ● | ● | ● | ● | ● | ● | ● | ● | ● | |||||||||||
| Unexpected accidents from the supplier lead to changes in delivery time | ● | ● | ● | ● | ● | ● | ● | ● | ● | |||||||||||||
| Poor supply capacity of the supplier | ● | ● | ● | ● | ● | ● | ● | ● | ● | ● | ● | ● | ● | ● | ||||||||
| Relationship with supplier partners | ● | ● | ||||||||||||||||||||
| Without ownership in the supply chain, horizontal integration being incomplete or difficult to control | ● | |||||||||||||||||||||
| Financial management ability of partner or owner | ● | ● | ● | ● | ● | ● | ● | ● | ● | ● | ● | |||||||||||
| Customer payment being insufficient | ● | |||||||||||||||||||||
| Customers’ temporary change of requirements | ● | |||||||||||||||||||||
| Confusion in customer or supplier relationships | ● | ● | ||||||||||||||||||||
| Insufficient enough information about customer orders to fully understand customer needs | ● | ● | ||||||||||||||||||||
| Long delivery date | ● | ● | ● | ● | ● | ● | ● | ● | ||||||||||||||
| Loss of key customers | ● | |||||||||||||||||||||
| Failure to actively communicate when problems arise, resulting in cognitive errors between customers and suppliers | ● | ● | ● | ● | ● | |||||||||||||||||
| Total cost of purchasing supplier products increased (product cost, logistics cost, quality cost) | ● | ● | ● | ● | ● | ● | ● | ● | ● | ● | ● | |||||||||||
| Profitability to work with suppliers | ● | ● | ● | ● | ● | |||||||||||||||||
| Vendor not providing problem resolution and support | ● | ● | ● | ● | ||||||||||||||||||
| Operating risk | Unusable repair service (maintenance service does not guarantee maintenance or service within an acceptable time frame) | ● | ||||||||||||||||||||
| Materials moving slowly through the supply chain | ● | ● | ● | ● | ● | ● | ● | ● | ● | ● | ● | ● | ||||||||||
| Distribution/transport supplier transport equipment failure | ● | ● | ● | ● | ● | |||||||||||||||||
| Product being damaged or lost in transit due to poor service quality of the logistics company | ● | ● | ● | ● | ● | ● | ● | ● | ● | ● | ● | ● | ||||||||||
| Poor planning of transportation routes leading to wasted time and delayed delivery | ● | ● | ● | ● | ● | ● | ● | ● | ||||||||||||||
| Shipment being wrong and delayed | ● | ● | ● | ● | ● | ● | ● | ● | ● | ● | ||||||||||||
| Legal and political | Legislative or regulatory changes | ● | ● | ● | ● | ● | ● | ● | ● | ● | ● | ● | ● | ● | ● | ● | ● | ● | ||||
| Government instability | ● | ● | ● | ● | ● | ● | ● | ● | ● | ● | ● | ● | ● | |||||||||
| Changes in taxation | ● | ● | ● | ● | ● | |||||||||||||||||
| Customs barrier | ● | ● | ● | ● | ● | ● | ||||||||||||||||
| Customers or manufacturers due to international standards, business practices incompatible | ● | ● | ● | ● | ||||||||||||||||||
| Green environmental protection policy | ● | ● | ||||||||||||||||||||
| Environmental and natural disasters | Flood | ● | ● | ● | ● | ● | ● | ● | ● | ● | ● | ● | ● | ● | ● | |||||||
| Earthquake/Tsunami | ● | ● | ● | ● | ● | ● | ● | ● | ● | ● | ● | ● | ● | ● | ||||||||
| Typhoon | ● | ● | ● | ● | ● | ● | ● | ● | ● | ● | ● | ● | ● | ● | ||||||||
| Lightning | ● | ● | ● | ● | ● | ● | ● | ● | ● | ● | ● | ● | ● | ● | ||||||||
| Epidemic disease | ● | ● | ● | ● | ● | ● | ● | ● | ● | ● | ● | ● | ● | ● | ||||||||
| Environmental pollution | ● | ● | ● | ● | ● | ● | ● | ● | ||||||||||||||
| Global warming | ● | ● | ● | ● | ● | ● | ● | ● | ||||||||||||||
| Climate of the four seasons | ● | ● | ● | ● | ● | |||||||||||||||||
| Stray animals (birds, insects, etc.) | ● | ● | ● | ● | ||||||||||||||||||
| Excessively high or low ambient temperature | ● | ● | ● | ● | ● | |||||||||||||||||
| Delivery time being delayed due to an abnormal transportation route (accidents, traffic jams) | ● | ● | ● | ● | ● | ● | ● | ● | ● | ● | ● | |||||||||||
| The market trend | Exposure to adverse market movements (securities, exchange rates, interest rate spreads) | ● | ● | ● | ● | ● | ● | ● | ● | ● | ● | ● | ||||||||||
| Economic transformation, recession | ● | ● | ● | |||||||||||||||||||
| Human resources, natural resources, capital | ● | ● | ● | ● | ● | ● | ● | ● | ||||||||||||||
| Unexpected rise or fall in product demand (demand fluctuation) | ● | ● | ● | ● | ● | ● | ||||||||||||||||
| Threats from competitors | ● | ● | ||||||||||||||||||||
| Unfair competition (dumping, etc.) | ● | |||||||||||||||||||||
| New product not being well received by customers | ● | ● | ● | ● | ● | |||||||||||||||||
| Unstable business environment (emerging industries) | ● | ● | ● | ● | ● | |||||||||||||||||
| Impact of seasonality and tide on supply and demand | ● | ● | ● | ● | ● | ● | ● | |||||||||||||||
| Fluctuations in energy prices (e.g., fuel, electricity, etc., have a direct effect on operations) | ● | ● | ||||||||||||||||||||
| Scholar | A: Koblen, Ivan et al. (2015) [156]; B: Wagner and Bode (2008) [157]; C: Tang et al. (2011) [48]; D:Christopher and Lee(2001) [158]; E: Juttner et al. (2003) [159]; F: Van Landeghem and Vanmaele (2002) [160]; G: Alhawari et al. (2012) [49]; H: Jereb et al. (2012) [50]; I: Thun and Hoenig (2011) [47]; J: Mohammaddust et al. (2015) [54]; K:Song et al. (2015) [52]; L: Ouyang et al. (2015) [161]; M:Isaksson and Seifert et al. (2016) [162]; N:Dominguez et al. (2016) [163]; O: Mackelprang and Malhotra. (2015) [164]; P: Cheng et al. (2015) [165]; Q: Cao et al. (2014) [51]; R:Helmi et al. (2017) [166]; S:Gautam et al. (2018) [167]; T:Ali et al. (2019) [168]; U:Cai et al. (2020) [169]. | |||||||||||||||||||||
Appendix B
Table A3.
The definitions for the chosen resilience capacities.
Table A3.
The definitions for the chosen resilience capacities.
| Resilience Capacity | Definition | Reference |
|---|---|---|
| Agility | Agility is the capability to quickly sense and respond to market dynamics and sustainable customers. In addition, agility emphasizes the ability to sense change, quickly respond to change, quickly reduce product development cycles or total time to delivery, quickly improve the level of product customization, quickly improve customer level, quickly improve delivery reliability, and quickly improve the ability to respond to changing market needs. | Al-Zabidi et al. (2021) [170]; Shekarian et al. (2020) [171]. |
| Flexibility | Flexibility is the capability of a firm to respond to long-term or fundamental changes in the supply chain and market environment by adjusting the configuration of the supply chain. It represents an investment in people skills and infrastructure, a production system that can accommodate a wide range of products and flexibility in procurement and order fulfillment. | Shekarian et al. (2020) [171]; da Silva Poberschnigg et al. (2020) [93]; Hosseini, S et al. (2019) [9]. |
| Redundancy | Redundancy in the supply chain refers to the creation or retention of excess capacity or backups throughout the supply chain, using safety stocks to maintain the ability to respond to any disruptions in the supply chain in the event of any adverse event. Redundancy includes significant and serious utilization of additional stock that can be called upon to accommodate emergencies. Redundancy establishes flexibility and encourages responsiveness through a flexible way of organizing assets. | Singh et al. (2019) [74]; Yazdanparast et al. (2018) [87]. |
| Capacity | As a general business term, capacity in supply chain management refers to an entity’s capability to generate output over a predetermined period. It also refers to the availability of assets that maintain levels of production and the ability of the firm to survive, adapt, and grow in turbulent change. | Han et al. (2020) [92]; Lucker and Seifert (2017) [96]. |
| Velocity | Supply chain speed is the response speed of the supply chain to change. The concept of speed is inherent to agility, and speed in risk events determines the amount of loss per unit of time. Compared with flexibility, speed places more emphasis on efficiency than on the effectiveness of supply chain response and recovery. | Singh et al. (2019) [74]; Kamalahmadi and Parast (2016) [72]. |
| Efficiency | Efficiency is the ability to produce output with minimal resource requirements. It is described as a comprehensive assessment of quality, delivery, cost, and overall capability, not only planned and reviewed in relationships, but also measured in relationships. Efficiency means developing interdependence, reliability, and control over resources. | Miocevic (2008) [172]. |
| Responsiveness | Ability to identify changes and respond to them quickly, reactively, or proactively, and also to recover from them. It is related to market sensitiveness and quick response to real demand. It involves the ability of the process to respond to unexpected events by moving, stabilizing, and resynchronizing within a reasonable time frame. | Carvalho et al. (2012b) [78]. |
| Competence | Ability to efficiently and effectively respond to market changes in terms of volume and variety. It involves the efficiency/redundancy tradeoff. Capacity and inventories can provide a cushion to support an appropriate response to turbulence. However, they can hamper improvements in supply chain efficiency. | Carvalho et al. (2012b) [78]. |
| Visibility | Visibility is defined as the identity, location, and status of the entity passing the SC, captured in a timely message about events, and the planned and actual date/time of those events. SC visibility is also defined as a transparent view of upstream and downstream inventories, demand and supply conditions, and production and procurement schedules. Visibility is a mediation tool that allows managers the opportunity to respond quickly to the effects of disruption or uncertainty, allowing for accurate, ongoing evaluation. | Hosseini, S et al. (2019) [9]; Singh et al. (2019) [74]. |
| Adaptability | Adaptability is the ability of an organization to make changes in its operations to meet challenges or seize opportunities. It is characterized by tolerance for the certainty of progress and the establishment of a framework suitable for adjusting new conditions and objectives. If a supply chain has the ability to easily adapt to things, it can return to its original or enhanced state after an interruption. | da Silva Poberschnigg et al. (2020) [93]; Singh et al. (2019) [74]. |
| Anticipation | The ability to identify potential future events or situations. Supply chain and operations managers should anticipate interruptions and prepare the supply chain for any anticipated and unexpected changes in the environment. The effects of disturbances should be fully understood and the probability of their occurrence must be minimized. To deal with emergencies, an emergency plan should be in place. | Kamalahmadi and Parast (2016) [72]. |
| Recovery | Recovery is the ability to quickly return to normal operating conditions. In other words, recovery is the ability to use the supply chain’s absorptive and adaptive capabilities to reduce external effects, minimize disruptions, and return supply chain performance to normal operating conditions in a cost-effective manner. Recovery can be measured in terms of recovery time, cost, interruption absorption, and ability to reduce the effect of losses. | Chowdhury and Quaddus (2017) [73]. |
| Dispersion | The ability to distribute or disperse assets widely. For manufacturing firms, decentralized manufacturing is the practice of breaking down the manufacturing process into multiple stages and distributing them to geographically dispersed locations to gain a competitive advantage. Distributed manufacturing greatly increases the complexity of supply chain design and may affect the impact of supply chain risk management practices on operational performance. | Abraham Zhang et al. (2013) [173]. |
| Collaboration | Collaborative forecasting, relationship management with customers, and internal and external communication. A close link exists between this capability and the literature on cross-functional integration in relation to formal and informal mechanisms. In a supply chain, collaboration simply means that the operation of the supply chain is planned and executed jointly by two or more independent enterprises for mutual benefit. It involves collaboration across each partner’s core business processes, as well as company-specific demand and supply-side issues. | da Silva Poberschnigg et al. (2020) [93]; Hosseini, S et al. (2019) [9]; Singh et al. (2019) [74]. |
| Market position | Market position is the state of an organization or its products, variable costs, and customer willingness. A stronger market position can lead to benefits from resources on a wide basis. Having a strong market position can build the ability of the association and help to maintain the relationship with customers. | Singh et al. (2019) [74]; Yazdanparast et al. (2018) [87]. |
| Information sharing | Information sharing is the sharing of information in advance or in real-time about any events that may or have occurred in an organization’s assets or a particular part of the supply chain. Information sharing can help supply chains reduce risks in the event of disruption and reduce the bullwhip effect. It also helps managers make better decisions to increase the profitability of the supply chain. | Hosseini, S et al. (2019) [9]. |
| Security | Safety is an essential element of any supply chain and should be designed in advance to minimize disruption. Developing security in operations means protecting one’s company from the different types of failures associated with human outages, whether they be cyber or physical. Security can be enhanced by working with supply chain partners and public–private partners. | Singh et al. (2019) [74]; Karl et al. (2018) [89]. |
| Financial strength | Financial strength is the ability to absorb fluctuations in cash flow. In a supply chain, financial strength can be defined as the ability to optimally plan, manage, and control supply chain cash flow to facilitate efficient material flow in the supply chain. At the same time, it is also the capital resources for enterprises to enter the market. | Chowdhury and Quaddus (2017) [73]; Pettit et al. (2013) [79]. |
| Product stewardship | Flexible production arrangements according to order quantity and production schedule have the ability to produce and supply new products to different customer groups. The ultimate goal of product stewardship is to minimize the effect of the product on the environment during its life cycle. | Kamalahmadi and Parast (2016) [72]. |
| Risk awareness | Many risks cannot be predicted or avoided, but vulnerabilities can be mitigated by anticipating, monitoring, and mitigating risks, thereby leading managers to minimize the risk of supply disruptions. Suppliers should be aware of the different levels of risk, such as those related to assets, processes, organizations, and environments. Risk awareness helps them to act in an emergency, improving the resilience of suppliers. | Karl et al. (2018) [89]; Rajesh and Ravi (2015) [80]. |
| Knowledge | Understanding supply chain operations, needs and threats, as well as human and capital resources, is a key element in creating a resilient supply chain. This process involves the use and utilization of existing knowledge within the organization. Responsibility for such innovation strategies usually rests with the top management of knowledge creation and protection programs, as well as with units that promote knowledge management, such as human resources or information technology. | Karl et al. (2018) [89]; Reinmoeller and Van Baardwijk (2005) [73]. |
References
- Tian, Q.; Guo, W. Reconfiguration of manufacturing supply chains considering outsourcing decisions and supply chain risks. J. Manuf. Syst. 2019, 52, 217–226. [Google Scholar] [CrossRef]
- Olhager, J.; Pashaei, S.; Sternberg, H. Design of global production and distribution networks. Int. J. Phys. Distrib. Logist. Manag. 2015, 45, 138–158. [Google Scholar] [CrossRef]
- Kim, M.; Chai, S. The impact of supplier innovativeness, information sharing and strategic sourcing on improving supply chain agility: Global supply chain perspective. Int. J. Prod. Econ. 2017, 187, 42–52. [Google Scholar] [CrossRef]
- Turner, N.; Aitken, J.; Bozarth, C. A framework for understanding managerial responses to supply chain complexity. Int. J. Oper. Prod. Manag. 2018, 38, 433–1466. [Google Scholar] [CrossRef]
- Abdel-Basset, M.; Mohamed, R. A novel plithogenic TOPSIS-CRITIC model for sustainable supply chain risk management. J. Clean. Prod. 2020, 247, 119586. [Google Scholar] [CrossRef]
- Carbonara, R.; Pellegrino, R. How do supply chain risk management flexibility-driven strategies perform in mitigating supply disruption risks? Int. J. Integr. Supply Manag. 2017, 11, 354–379. [Google Scholar] [CrossRef]
- Jabbarzadeh, A.; Fahimnia, B.; Sabouhi, F. Resilient and sustainable supply chain design: Sustainability analysis under disruption risks. Int. J. Prod. Res. 2018, 56, 5945–5968. [Google Scholar] [CrossRef]
- Moktadir, M.A.; Dwivedi, A.; Khan, N.S.; Paul, S.K.; Khan, S.A.; Ahmed, S.; Sultana, R. Analysis of risk factors in sustainable supply chain management in an emerging economy of leather industry. J. Clean. Prod. 2021, 283, 124641. [Google Scholar] [CrossRef]
- Hosseini, S.; Ivanov, D.; Dolgui, A. Review of quantitative methods for supply chain resilience analysis. Transp. Res. Part E 2019, 125, 285–307. [Google Scholar] [CrossRef]
- Hasan, M.; Jiang, D.; Ullah, A.S.; Alam, N.-E. Resilient supplier selection in logistics 4.0 with heterogeneous information. Expert Syst. Appl. 2020, 139, 112799. [Google Scholar] [CrossRef]
- Jüttner, U.; Maklan, S. Supply chain resilience in the global financial crisis: An empirical study. Supply Chain Manag. Int. J. 2011, 16, 246–259. [Google Scholar] [CrossRef]
- Soni, U.; Jain, V.; Kumar, S. Measuring supply chain resilience using a deterministic modeling approach. Comput. Ind. Eng. 2014, 74, 11–25. [Google Scholar] [CrossRef]
- Bottani, E.; Murino, T.; Schiavo, M.; Akkerman, R. Resilient food supply chain design: Modelling framework and metaheuristic solution approach. Comput. Ind. Eng. 2019, 135, 177–198. [Google Scholar] [CrossRef]
- Chen, L.; Miller-Hooks, E. Resilience: An indicator of recovery capability in intermodal freight transport. Transp. Sci. 2012, 46, 109–123. [Google Scholar] [CrossRef]
- Eltantawy, R. Towards sustainable supply management: Requisite governance and resilience capacities. J. Strateg. Mark. 2016, 24, 118–130. [Google Scholar] [CrossRef]
- Birkie, S.E.; Trucco, P.; Campos, P.F. Effectiveness of resilience capacities in mitigating disruptions: Leveraging on supply chain structural complexity. Supply Chain Manag. Int. J. 2017, 22, 506–521. [Google Scholar] [CrossRef]
- Parker, H.; Ameen, K. The role of resilience capacities in shaping how firms respond to disruptions. J. Bus. Res. 2018, 88, 535–541. [Google Scholar] [CrossRef]
- Hosseini, S.; Morshedlou, N.; Ivanov, D.; Sarder, M.D.; Barker, K.; Al Khaled, A. Resilient supplier selection and optimal order allocation under disruption risks. Int. J. Prod. Econ. 2019, 213, 124–137. [Google Scholar] [CrossRef]
- Jain, P.; Pasman, H.J.; Mannan, M.S. Process system resilience: From risk management to business continuity and sustainability. Int. J. Bus. Contin. Risk Manag. 2020, 10, 47–66. [Google Scholar] [CrossRef]
- Mizgier, K.J.; Pasia, J.M.; Talluri, S. Multiobjective capital allocation for supplier development under risk. Int. J. Prod. Res. 2017, 55, 5243–5258. [Google Scholar] [CrossRef]
- Amindoust, A. A resilient-sustainable based supplier selection model using a hybrid intelligent method. Comput. Ind. Eng. 2018, 126, 122–135. [Google Scholar] [CrossRef]
- Li, M.; Jin, L.; Wang, J. A new MCDM method combining QFD with TOPSIS for knowledge management system selection from the user’s perspective in intuitionistic fuzzy environment. Appl. Soft Comput. 2014, 21, 28–37. [Google Scholar] [CrossRef]
- Ignatius, J.; Rahman, A.; Yazdani, M. An integrated fuzzy ANP–QFD approach for green building assessment. J. Civ. Eng. Manag. 2016, 22, 551–563. [Google Scholar] [CrossRef]
- Tian, Z.P.; Wang, J.Q.; Wang, J.; Zhang, H.Y. A multi-phase QFD-based hybrid fuzzy MCDM approach for performance evaluation: A case of smart bike-sharing programs in Changsha. J. Clean. Prod. 2018, 171, 1068–1083. [Google Scholar] [CrossRef]
- Wang, X.; Fang, H.; Song, W.Y. Technical attribute prioritisation in QFD based on cloud model and grey relational analysis. Int. J. Prod. Res. 2019, 58, 5751–5768. [Google Scholar] [CrossRef]
- Hsu, C.-H.; Chang, A.-Y.; Zhang, T.-Y.; Lin, W.-D.; Liu, W.-L. Deploying Resilience Enablers to Mitigate Risks in Sustainable Fashion Supply Chains. Sustainability 2021, 13, 2943. [Google Scholar] [CrossRef]
- Ali, I.; Gölgeci, I. Where is supply chain resilience research heading? A systematic and co-occurrence analysis. Int. J. Phys. Distrib. Logist. Manag. 2019, 49, 793–815. [Google Scholar] [CrossRef]
- Gölgeci, I.; Kuivalainen, O. Does social capital matter for supply chain resilience? The role of absorptive capacity and marketing-supply chain management alignment. Ind. Mark. Manag. 2019, 84, 63–74. [Google Scholar] [CrossRef]
- Boussemart, J.P.; Leleu, H.; Shen, Z.; Valdmanis, V. Performance analysis for three pillars of sustainability. J. Product. Anal. 2020, 53, 305–320. [Google Scholar] [CrossRef]
- Iddrisu, I.; Bhattacharyya, S.C. Sustainable Energy Development Index: A multi-dimensional indicator for measuring sustainable energy development. Renew. Sustain. Energy Rev. 2015, 50, 513–530. [Google Scholar] [CrossRef]
- Valinejad, F.; Rahmani, D. Sustainability risk management in the supply chain of telecommunication companies: A case study. J. Clean. Prod. 2018, 203, 53–67. [Google Scholar] [CrossRef]
- Kilubi, I. The strategies of supply chain risk management: A synthesis and classification. Int. J. Logist. Res. Appl. 2016, 19, 604–629. [Google Scholar] [CrossRef]
- Abdel-Basset, M.; Gunasekaran, M.; Mohamed, M.; Chilamkurti, N. A framework for risk assessment, management and evaluation: Economic tool for quantifying risks in supply chain. Future Gener. Comput. Syst. 2019, 90, 489–502. [Google Scholar] [CrossRef]
- Mitroff, I.I.; Alpaslan, M.C. Preparing for Evil; Harvard Business School Pub.: Boston, MA, USA, 2003; Volume 81, pp. 109–115. [Google Scholar]
- Christopher, M.; Peck, H. Building the resilient supply chain. Int. J. Logist. Manag. 2004, 15, 1–14. [Google Scholar] [CrossRef]
- Norrman, A.; Lindroth, R. Categorization of supply chain risk and risk management. Supply Chain Risk 2004, 15, 14–27. [Google Scholar]
- Vanany, I.; Zailani, S.; Pujawan, N. Supply chain risk management: Literature review & future research. Int. J. Inf. Syst. Supply Chain Manag. 2008, 2, 16–33. [Google Scholar]
- Olson, D.L.; Wu, D.D. A review of enterprise risk management in supply chain. Kybernetes 2010, 39, 694–706. [Google Scholar] [CrossRef]
- Sawik, T. Selection of supply portfolio under disruption risks. Omega 2011, 39, 194–208. [Google Scholar] [CrossRef]
- Probohudono, A.N.; Tower, G. Diversity in risk communication. Australas. Account. Bus. Financ. J. 2013, 7, 43–58. [Google Scholar] [CrossRef]
- Rangel, D.A.; de Oliveira, T.K.; Leite, M.S.A. Supply chain risk classification: Discussion and proposal. Int. J. Prod. Res. 2015, 53, 6868–6887. [Google Scholar] [CrossRef]
- Ho, W.; Zheng, T.; Yildiz, H.; Talluri, S. Supply chain risk management: A literature review. Int. J. Prod. Res. 2015, 53, 5031–5069. [Google Scholar] [CrossRef]
- Hudnurkar, M.; Deshpande, S.; Rathod, U.; Jakhar, S.K. Supply chain risk classification schemes: A literature review. Opertions Spply Chain Manag. Int. J. 2017, 10, 182–199. [Google Scholar] [CrossRef]
- Truong, Q.H.; Hara, Y. Risks and performance in supply chain: The push effect. Int. J. Prod. Res. 2018, 56, 1369–1388. [Google Scholar] [CrossRef]
- Mital, M.; Giudice, D.M.; Papa, A. Comparing supply chain risks for multiple product categories with cognitive mapping and analytic hierarchy process. Technol. Forecast. Soc. Chang. 2018, 131, 159–170. [Google Scholar] [CrossRef]
- Rostamzadeh, R.; Ghorabaee, M.K.; Govindan, K.; Esmaeili, A.; Nobar, H.B.K. Evaluation of sustainable supply chain risk management using an integrated fuzzy TOPSIS-CRITIC approach. J. Clean. Prod. 2018, 175, 651–669. [Google Scholar] [CrossRef]
- Thun, J.H.; Hoenig, D. An empirical analysis of supply chain risk management in the German automotive industry. Int. J. Prod. Econ. 2011, 131, 242–249. [Google Scholar] [CrossRef]
- Tang, O.; Musa, S.N. Identifying risk issues and research advancements in supply chain risk management. Int. J. Prod. Econ. 2011, 133, 25–34. [Google Scholar]
- Alhawari, S.; Karadsheh, L.; Talet, A.N.; Mansour, E. Knowledge-based risk management framework for information technology project. Int. J. Inf. Manag. 2012, 32, 50–65. [Google Scholar] [CrossRef]
- Jereb, B.; Cvahte, T.; Rosi, B. Mastering supply chain risks. Serb. J. Manag. 2012, 7, 271–285. [Google Scholar]
- Cao, J.; Peng, L.; Li, R.; Chen, Y.; Li, X.; Mo, B.; Li, X. Nutritional risk screening and its clinical significance in hospitalized children. Clin. Nutr. 2014, 33, 432–436. [Google Scholar]
- Song, S.; Zuo, Z.; Cao, Y.; Wang, L. Analysis of social risk causes of rail transit construction projects based on DEMATEL-ISM. In Proceedings of the Fifth International Conference on Transportation Engineering, Dalian, China, 26–27 September 2015; pp. 1868–1875. [Google Scholar]
- Ortegoli, A.; Ghadim, M.R.K. The effect of disruption risks on the green supply chain and prioritizing of the effects by using AHP. Int. J. Humanit. Cult. Stud. 2016, 1478–1493. [Google Scholar]
- Mohammaddust, F.; Rezapour, S.; Farahani, R.Z.; Mofidfar, M.; Hill, A. Developing lean and responsive supply chains: A robust model for alternative risk mitigation strategies in supply chain designs. Int. J. Prod. Econ. 2017, 183, 632–653. [Google Scholar] [CrossRef]
- Macdonald, J.R.; Zobel, C.W.; Melnyk, S.A.; Griffis, S.E. Supply chain risk and resilience: Theory building through structured experiments and simulation. Int. J. Prod. Res. 2018, 56, 4337–4355. [Google Scholar] [CrossRef]
- Yang-Ngam, C.; Chankoson, T.; Aodton, P. Influence of internal and external factors on supply chain information system risk management implementation. Int. J. Supply Chain Manag. 2019, 8, 612–623. [Google Scholar]
- Nakano, M.; Lau, A.K. A systematic review on supply chain risk management: Using the strategy-structure-process-performance framework. Int. J. Logist. Res. Appl. 2020, 23, 443–473. [Google Scholar] [CrossRef]
- Jesse, B.J.; Heinrichs, H.U.; Kuckshinrichs, W. Adapting the theory of resilience to energy systems: A review and outlook. Energy Sustain. Soc. 2019, 9, 1–19. [Google Scholar] [CrossRef]
- Holling, C.S. Resilience and stability of ecological systems. Annu. Rev. Ecol. Syst. 1973, 4, 1–23. [Google Scholar]
- Yates, T.M.; Tyrell, F.A.; Masten, A.S. Resilience Theory and the Practice of Positive Psychology from Individuals to Societies, 2nd ed.; John Wiley & Sons, Inc.: Hoboken, NJ, USA, 2015; pp. 773–788. [Google Scholar]
- Fenton, N.J. Applied ecology in Canada’s boreal: A holistic view of the mitigation hierarchy and resilience theory. Botany 2016, 94, 1009–1014. [Google Scholar] [CrossRef]
- Masten, A.S. Resilience theory and research on children and families: Past, present, and promise. J. Fam. Theory Rev. 2018, 10, 12–31. [Google Scholar] [CrossRef]
- Sun, H.; Zhen, F.; Jiang, Y. Study on the characteristics of urban residents’ commuting behavior and influencing factors from the perspective of resilience theory: Theoretical construction and empirical analysis from Nanjing, China. Int. J. Environ. Res. Public Health 2020, 17, 1475. [Google Scholar] [CrossRef]
- Woods, D.D. Four concepts for resilience and the implications for the future of resilience engineering. Reliab. Eng. Syst. Saf. 2015, 141, 5–9. [Google Scholar] [CrossRef]
- Sawik, T. A portfolio approach to supply chain disruption management. Int. J. Prod. Res. 2017, 55, 1970–1991. [Google Scholar] [CrossRef]
- Katsaliaki, K.; Galetsi, P.; Kumar, S. Supply chain disruptions and resilience: A major review and future research agenda. Ann. Oper. Res. 2021, 1–38. [Google Scholar] [CrossRef]
- Fiksel, J. Designing resilient, sustainable systems. Environ. Sci. Technol. 2003, 37, 5330–5339. [Google Scholar] [CrossRef] [PubMed]
- Reinmoeller, P.; Baardwijk, V.N. The link between diversity and resilience. MIT Sloan Manag. Rev. 2005, 46, 61–65. [Google Scholar]
- Pereira, J.V. The new supply chain’s frontier: Information management. Int. J. Inf. Manag. 2009, 29, 372–379. [Google Scholar] [CrossRef]
- Ponis, S.T.; Koronis, E. Supply chain resilience: Definition of concept and its formative elements. J. Appl. Bus. Res. 2012, 28, 921–929. [Google Scholar]
- Simangunsong, E.; Hendry, L.C.; Stevenson, M. Supply-chain uncertainty: A review and theoretical foundation for future research. Int. J. Prod. Res. 2012, 50, 4493–4523. [Google Scholar]
- Kamalahmadi, M.; Parast, M.M. A review of the literature on the principles of enterprise and supply chain resilience: Major findings and directions for future research. Int. J. Prod. Econ. 2016, 171, 116–133. [Google Scholar] [CrossRef]
- Chowdhury, M.M.H.; Quaddus, M. Supply chain resilience: Conceptualization and scale development using dynamic capability theory. Int. J. Prod. Econ. 2017, 188, 185–204. [Google Scholar] [CrossRef]
- Singh, C.S.; Soni, G.; Badhotiya, G.K. Performance indicators for supply chain resilience: Review and conceptual framework. J. Ind. Eng. Int. 2019, 15, 105–117. [Google Scholar] [CrossRef]
- Sheffi, Y.; Rice, J.J.B. A supply chain view of the resilient enterprise. MIT Sloan Manag. Rev. 2005, 47, 41–48. [Google Scholar]
- Priya, D.P.; Christopher, M.; Allen, P. Agent-based modelling of complex production/distribution systems to improve resilience. Int. J. Logist. Res. Appl. 2007, 10, 187–203. [Google Scholar] [CrossRef]
- Carvalho, H.; Azevedo, S.G.; Cruz-Machado, V. Agile and resilient approaches to supply chain management: Influence on performance and competitiveness. Logist. Res. 2012, 4, 49–62. [Google Scholar] [CrossRef]
- Carvalho, H.; Maleki, M.; Cruz-Machado, V. The links between supply chain disturbances and resilience strategies. Int. J. Agil. Syst. Manag. 2012, 5, 203–234. [Google Scholar] [CrossRef]
- Pettit, T.J.; Croxton, K.L.; Fiksel, J. Ensuring supply chain resilience: Development and implementation of an assessment tool. J. Bus. Logist. 2013, 34, 46–76. [Google Scholar] [CrossRef]
- Rajesh, R.; Ravi, V. Supplier selection in resilient supply chains: A grey relational analysis approach. J. Clean. Prod. 2015, 86, 343–359. [Google Scholar] [CrossRef]
- Wicher, P.; Zapleta, F.; Lenort, R.; Staš, D. Measuring the metallurgical supply chain resilience using fuzzy analytic network process. Metalurgija 2016, 55, 783–786. [Google Scholar]
- Rajesh, R. Forecasting supply chain resilience performance using grey prediction. Electron. Commer. Res. Appl. 2016, 20, 42–58. [Google Scholar] [CrossRef]
- Sahu, A.K.; Datta, S.; Mahapatra, S.S. Evaluation of performance index in resilient supply chain: A fuzzy-based approach. Benchmarking 2017, 24, 118–142. [Google Scholar] [CrossRef]
- Ali, A.; Mahfouz, A.; Arisha, A. Analysing supply chain resilience: Integrating the constructs in a concept mapping framework via a systematic literature review. Supply Chain Manag. 2017, 22, 16–39. [Google Scholar] [CrossRef]
- Brusset, X.; Teller, C. Supply chain capacities, risks, and resilience. Int. J. Prod. Econ. 2017, 184, 59–68. [Google Scholar] [CrossRef]
- Jain, V.; Kumar, S.; Soni, U.; Chandra, C. Supply chain resilience: Model development and empirical analysis. Int. J. Prod. Res. 2017, 55, 6779–6800. [Google Scholar] [CrossRef]
- Yazdanparast, R.; Tavakkoli-Moghaddam, R.; Heidari, R.; Aliabadi, L. A hybrid Z-number data envelopment analysis and neural network for assessment of supply chain resilience: A case study. Cent. Eur. J. Oper. Res. 2018, 4, 1131–1152. [Google Scholar] [CrossRef]
- Kochan, C.G.; Nowicki, D.R. Supply chain resilience: A systematic literature review and typological framework. Int. J. Phys. Distrib. Logist. Manag. 2018, 48, 842–865. [Google Scholar] [CrossRef]
- Karl, A.A.; Micheluzzi, J.; Leite, L.R.; Pereira, C.R. Supply chain resilience and key performance indicators: A systematic literature review. Producao 2018, 28, 1–16. [Google Scholar] [CrossRef]
- Sabahi, S.; Parast, M.M. Firm innovation and supply chain resilience: A dynamic capability perspective. Int. J. Logist. Res. Appl. 2020, 23, 254–269. [Google Scholar] [CrossRef]
- López, C.; Ishizaka, A. A hybrid FCM-AHP approach to predict impacts of offshore outsourcing location decisions on supply chain resilience. J. Bus. Res. 2019, 103, 495–507. [Google Scholar] [CrossRef]
- Han, Y.; Chong, W.K.; Li, D. A systematic literature review of the capacities and performance metrics of supply chain resilience. Int. J. Prod. Res. 2020, 58, 4541–4566. [Google Scholar] [CrossRef]
- Da Silva Poberschnigg, T.F.; Pimenta, M.L.; Hilletofth, P. How can cross-functional integration support the development of resilience capacities? The case of collaboration in the automotive industry. Supply Chain Manag. Int. J. 2020, 25, 789–801. [Google Scholar] [CrossRef]
- Lam, J.S.L.; Bai, X. A quality function deployment approach to improve maritime supply chain resilience. Transp. Res. Part E Logist. Transp. Rev. 2016, 92, 16–27. [Google Scholar] [CrossRef]
- He, L.; Wu, Z.; Xiang, W.; Goh, M.; Xu, Z.; Song, W.; Ming, X.; Wu, X. A novel Kano-QFD-DEMATEL approach to optimise the risk resilience solution for sustainable supply chain. Int. J. Prod. Res. 2020, 58, 1–22. [Google Scholar]
- Lücker, F.; Seifert, R.W. Building up resilience in a pharmaceutical supply chain through inventory, dual sourcing and agility capacity. Omega 2017, 73, 114–124. [Google Scholar] [CrossRef]
- Chen, L.; Dui, H.; Zhang, C. A resilience measure for supply chain systems considering the interruption with the cyber-physical systems. Reliab. Eng. Syst. Saf. 2020, 199, 106869. [Google Scholar]
- Tang, C.S. Robust strategies for mitigating supply chain disruptions. Int. J. Logist. Res. Appl. 2006, 9, 33–45. [Google Scholar]
- Iakovou, E.; Vlachos, D.; Xanthopoulos, A. An analytical methodological framework for the optimal design of resilient supply chains. Int. J. Logist. Econ. Glob. 2007, 1, 1–20. [Google Scholar]
- Cardoso, S.R.; Barbosa-Póvoa, A.P.; Relvas, S.; Novais, A.Q. Resilience metrics in the assessment of complex supply-chains performance operating under demand uncertainty. Omega 2015, 56, 53–73. [Google Scholar] [CrossRef]
- Chen, Z.; Wu, J.; Xia, Y.; Zhang, X. Robustness of interdependent power grids and communication networks: A complex network perspective. IEEE Trans. Circuits Syst. II Express Briefs 2017, 65, 115–119. [Google Scholar] [CrossRef]
- Behzadi, G.; O’Sullivan, M.J.; Olsen, T.L. On metrics for supply chain resilience. Eur. J. Oper. Res. 2020, 287, 145–158. [Google Scholar] [CrossRef]
- Chopra, S.; Sodhi, M.S. Supply-chain breakdown. MIT Sloan Manag. Rev. 2004, 46, 53–61. [Google Scholar]
- Chowdhury, M.M.H.; Quaddus, M.A. A multiple objective optimization based QFD approach for efficient resilient strategies to mitigate supply chain vulnerabilities: The case of garment industry of Bangladesh. Omega 2015, 57, 5–21. [Google Scholar] [CrossRef]
- Tomlin, B. Disruption-management strategies for short life-cycle products. Nav. Res. Logist. 2009, 56, 318–347. [Google Scholar] [CrossRef]
- Utami, I.D.; Santosa, I.; Leila, M.V. Priority Resilience Strategy for Micro, Small, and Medium Enterprises for Dealing with Natural Disasters. Int. J. Disaster Risk Reduct. 2021, 55, 102074. [Google Scholar] [CrossRef]
- Luo, Y.; Zhu, J.J. Resilience Strategy Optimization for Large Aircraft Supply Chain Based on Probabilistic Language QFD. Int. J. Inf. Syst. Supply Chain Manag. 2020, 13, 23–46. [Google Scholar]
- Asian, S.; Nie, X. Coordination in supply chains with uncertain demand and disruption risks: Existence, analysis, and insights. IEEE Trans. Syst. Man Cybern. Syst. 2014, 44, 1139–1154. [Google Scholar] [CrossRef]
- Cai, X.; Zhou, X. Optimal policies for perishable products when transportation to export market is disrupted. Prod. Oper. Manag. 2014, 23, 907–923. [Google Scholar] [CrossRef]
- Wiedenmann, S.; Geldermann, J. Supply planning for processors of agricultural raw materials. Eur. J. Oper. Res. 2015, 242, 606–619. [Google Scholar] [CrossRef]
- Behzadi, G.; O’Sullivan, M.J.; Olsen, T.L.; Scrimgeour, F.; Zhang, A. Robust and resilient strategies for managing supply disruptions in an agribusiness supply chain. Int. J. Prod. Econ. 2017, 191, 207–220. [Google Scholar] [CrossRef]
- Behzadi, G.; O’Sullivan, M.J.; Olsen, T.L.; Zhang, A. Allocation flexibility for agribusiness supply chains under market demand disruption. Int. J. Prod. Res. 2018, 56, 3524–3546. [Google Scholar] [CrossRef]
- Fattahi, M.; Govindan, K.; Keyvanshokooh, E. Responsive and resilient supply chain network design under operational and disruption risks with delivery lead-time sensitive customers. Transp. Res. Part E Logist. Transp. Rev. 2017, 101, 176–200. [Google Scholar] [CrossRef]
- Edgeman, R.; Wu, Z. Supply chain criticality in sustainable and resilient enterprises. J. Model. Manag. 2016, 11, 869–888. [Google Scholar] [CrossRef]
- Marchese, D.; Reynolds, E.; Bates, M.E.; Morgan, H.; Clark, S.S.; Linkov, I. Resilience and sustainability: Similarities and differences in environmental management applications. Sci. Total Environ. 2018, 613, 1275–1283. [Google Scholar] [CrossRef]
- Ramezankhani, M.J.; Torabi, S.A.; Vahidi, F. Supply chain performance measurement and evaluation: A mixed sustainability and resilience approach. Comput. Ind. Eng. 2018, 126, 531–548. [Google Scholar] [CrossRef]
- Fahimnia, B.; Jabbarzadeh, A. Marrying supply chain sustainability and resilience: A match made in heaven. Transp. Res. Part E Logist. Transp. Rev. 2016, 91, 306–324. [Google Scholar] [CrossRef]
- Ivanov, D. Revealing interfaces of supply chain resilience and sustainability: A simulation study. Int. J. Prod. Res. 2018, 56, 3507–3523. [Google Scholar] [CrossRef]
- Bouloiz, H. Sustainable performance management using resilience engineering. Int. J. Eng. Bus. Manag. 2020, 12, 12. [Google Scholar]
- Zavala-Alcívar, A.; Verdecho, M.J.; Alfaro-Saiz, J.J. A Conceptual Framework to Manage Resilience and Increase Sustainability in the Supply Chain. Sustainability 2020, 12, 6300. [Google Scholar] [CrossRef]
- Khot, S.; Thiagarajan, S. Resilience and sustainability of supply chain management in the Indian automobile industry. Int. J. Data Netw. Sci. 2019, 3, 339–348. [Google Scholar] [CrossRef]
- Shin, N.; Park, S. Evidence-based resilience management for supply chain sustainability: An interpretive structural modelling approach. Sustainability 2019, 11, 484. [Google Scholar] [CrossRef]
- Thaiprayoon, K.; Mitprasat, M.; Jermsittiparsert, K. Sustainability consciousness dimensions for achieving sustainability performance in Thailand: Role of supply chain resilience. Int. J. Supply Chain Manag. 2019, 8, 622–634. [Google Scholar]
- Ivanov, D. Viable supply chain model: Integrating agility, resilience and sustainability perspectives—lessons from and thinking beyond the COVID-19 pandemic. Ann. Oper. Res. 2020, 1–21. [Google Scholar] [CrossRef] [PubMed]
- Zhang, Z.; Liao, H.; Chang, J.; Al-barakati, A. Green-duilding-material supplier selection with a rough-set-enhanced quality function deployment. Sustainability 2019, 11, 7153. [Google Scholar] [CrossRef]
- Duckstein, L.; Opricovic, S. Multiobjective optimization in river basin development. Water Resour. Res. 1980, 16, 14–20. [Google Scholar] [CrossRef]
- Liu, H.T. Product design and selection using fuzzy QFD and fuzzy MCDM approaches. Appl. Math. Model. 2011, 35, 482–496. [Google Scholar] [CrossRef]
- Dursun, M.; Karsak, E.E. A QFD-based fuzzy MCDM approach for supplier selection. Appl. Math. Model. 2013, 37, 5864–5875. [Google Scholar] [CrossRef]
- Yazdani, M.; Zolfani, S.H.; Zavadskas, E.K. New integration of MCDM methods and QFD in the selection of green suppliers. J. Bus. Econ. Manag. 2016, 17, 1097–1113. [Google Scholar] [CrossRef]
- Yazdani, M.; Chatterjee, P.; Zavadskas, E.K.; Zolfani, S.H. Integrated QFD-MCDM framework for green supplier selection. J. Clean. Prod. 2017, 142, 3728–3740. [Google Scholar] [CrossRef]
- Opricovic, S. Fuzzy VIKOR with an application to water resources planning. Expert Syst. Appl. 2011, 38, 12983–12990. [Google Scholar] [CrossRef]
- Opricovic, S.; Tzeng, G.H. Compromise solution by MCDM methods: A comparative analysis of VIKOR and TOPSIS. Eur. J. Oper. Res. 2004, 156, 445–455. [Google Scholar] [CrossRef]
- Opricovic, S.; Tzeng, G.H. Extended VIKOR method in comparison with outranking methods. Eur. J. Oper. Res. 2007, 178, 514–529. [Google Scholar] [CrossRef]
- Li, X.; Song, W. A rough VIKOR-based QFD for prioritizing design attributes of product-related service. Math. Probl. Eng. 2016, 2016, 1–11. [Google Scholar] [CrossRef]
- Zhang, X.; Xing, X. Probabilistic Linguistic VIKOR Method to Evaluate Green Supply Chain Initiatives. Sustainability 2017, 9, 1231. [Google Scholar] [CrossRef]
- Malviya, R.K.; Kant, R. Prioritising the solutions to overcome the barriers of green supply chain management implementation: A hybrid fuzzy AHP-VIKOR framework approach. J. Decis. Syst. 2018, 27, 275–320. [Google Scholar] [CrossRef]
- Jing, S.; Niu, Z.; Chang, P.C. The application of VIKOR for the tool selection in lean management. J. Intell. Manuf. 2019, 30, 2901–2912. [Google Scholar] [CrossRef]
- Rathore, R.; Thakkar, J.J.; Jha, J.K. Evaluation of risks in foodgrains supply chain using failure mode effect analysis and fuzzy VIKOR. Int. J. Qual. Reliab. Manag. 2020, 38, 551–580. [Google Scholar] [CrossRef]
- Liu, H.C.; You, J.X.; Fan, X.J.; Chen, Y.Z. Site selection in waste management by the VIKOR method using linguistic assessment. Appl. Soft Comput. 2014, 21, 453–461. [Google Scholar] [CrossRef]
- Dekkers, R.; de Boer, R.; Gelsomino, L.M.; de Goeij, C.; Steeman, M.; Zhou, Q.; Sinclair, S.; Souter, V. Evaluating theoretical conceptualisations for supply chain and finance integration: A Scottish focus group. Int. J. Prod. Econ. 2020, 220, 107451. [Google Scholar] [CrossRef]
- Qazi, A.; Quigley, J.; Dickson, A.; Ekici, Ş.Ö. Exploring dependency based probabilistic supply chain risk measures for prioritising interdependent risks and strategies. Eur. J. Oper. Res. 2017, 259, 189–204. [Google Scholar] [CrossRef]
- Jung, K.; Song, M.; Park, H.J. The dynamics of an Interorganizational emergency management network: Interdependent and independent risk hypotheses. Public Adm. Rev. 2019, 79, 225–235. [Google Scholar]
- Kuper, G.; Massacci, F.; Shim, W.; Williams, J. Who should pay for interdependent risk? Policy implications for security interdependence among airports. Risk Anal. 2020, 40, 1001–1019. [Google Scholar] [CrossRef] [PubMed]
- Morrison, D.; Lichtenwald, K.; Tang, R. Extending the online focus group method using web-based conferencing to explore older adults online learning. Int. J. Res. Method Educ. 2020, 43, 78–92. [Google Scholar] [CrossRef]
- Nowicki, P.; Ćwiklicki, M.; Kafel, P.; Wojnarowska, M. Credibility of certified environmental management systems: Results from focus group interviews. Environ. Impact Assess. Rev. 2021, 88, 106556. [Google Scholar] [CrossRef]
- Patil, R.B.; Kothavale, B.S. Failure modes and effects analysis (FMEA) of computerized numerical control (CNC) turning center. Int. Rev. Mech. Eng. 2018, 12, 78–87. [Google Scholar] [CrossRef]
- Murray, T.J.; Pipino, L.L.; van Gigch, J.P. A pilot study of fuzzy set modification of Delphi. Hum. Syst. Manag. 1985, 5, 76–80. [Google Scholar] [CrossRef]
- Rejab, M.M.; Azmi, N.F.M.; Chuprat, S. Fuzzy Delphi Method for evaluating HyTEE model. Int. J. Adv. Comput. Sci. Appl. 2019, 10, 529–535. [Google Scholar]
- Hsu, C.H.; Chang, A.Y.; Luo, W. Identifying key performance factors for sustainability development of SMEs–integrating QFD and fuzzy MADM methods. J. Clean. Prod. 2017, 161, 629–645. [Google Scholar] [CrossRef]
- Opricovic, S. Multicriteria optimization of civil engineering systems. Fac. Civ. Eng. Belgrade 1998, 2, 5–21. [Google Scholar]
- Ali, S.M.; Rahman, M.H.; Tumpa, T.J.; Rifat, A.A.M.; Paul, S.K. Examining price and service competition among retailers in a supply chain under potential demand disruption. J. Retail. Consum. Serv. 2018, 40, 40–47. [Google Scholar] [CrossRef]
- Giri, B.C.; Sarker, B.R. Coordinating a multi-echelon supply chain under production disruption and price-sensitive stochastic demand. J. Ind. Manag. Optim. 2019, 15, 1631. [Google Scholar]
- Qin, J.; Zhao, Y.; Xia, L. Carbon emission reduction with capital constraint under greening financing and cost sharing contract. Int. J. Environ. Res. Public Health 2018, 15, 750. [Google Scholar] [CrossRef] [PubMed]
- Wang, W.; Zhang, Y.; Zhang, W.; Gao, G.; Zhang, H. Incentive mechanisms in a green supply chain under demand uncertainty. J. Clean. Prod. 2020, 279, 123636. [Google Scholar] [CrossRef]
- Doutch, M. A gendered labour geography perspective on the Cambodian garment workers’ general strike of 2013/2014. Globalizations 2021, 1–14. [Google Scholar] [CrossRef]
- Koblen, I.; Škůrková, K.L. Selected Aspects of the Risk in the Supply Chain In Context Of The Supplier Quality Management. Res. Pap. Fac. Mater. Sci. Technol. Slovak Univ. Technol. 2015, 23, 167–178. [Google Scholar]
- Wagner, S.M.; Bode, C. An empirical examination of supply chain performance along several dimensions of risk. J. Bus. Logist. 2008, 29, 307–325. [Google Scholar] [CrossRef]
- Christopher, M.; Lee, H. Supply Chain Confidence; Working Paper; Cranfield School of Management: Bedford, UK, 2001. [Google Scholar]
- Jüttner, U.; Peck, H.; Christopher, M. Supply chain risk management: Outlining an agenda for future research. Int. J. Logist. Res. Appl. 2003, 6, 197–210. [Google Scholar] [CrossRef]
- Van Landeghem, H.; Vanmaele, H. Robust planning: A new paradigm for demand chain planning. J. Oper. Manag. 2002, 20, 769–783. [Google Scholar] [CrossRef]
- Ouyang, A.J.; Lv, Y.N.; Zhong, H.L.; Wen, J.H.; Wei, X.H.; Peng, H.W.; Zhou, J.; Liu, L.L. Meta-analysis of digoxin use and risk of mortality in patients with atrial fibrillation. Am. J. Cardiol. 2015, 115, 901–906. [Google Scholar] [CrossRef] [PubMed]
- Isaksson, O.H.; Seifert, R.W. Quantifying the bullwhip effect using two-echelon data: A cross-industry empirical investigation. Int. J. Prod. Econ. 2016, 171, 311–320. [Google Scholar] [CrossRef]
- Dominguez-Bello, M.G.; De Jesus-Laboy, K.M.; Shen, N.; Cox, L.M.; Amir, A.; Gonzalez, A.; Mendez, K. Partial restoration of the microbiota of cesarean-born infants via vaginal microbial transfer. Nat. Med. 2016, 22, 250–253. [Google Scholar] [CrossRef]
- Mackelprang, A.W.; Malhotra, M.K. The impact of bullwhip on supply chains: Performance pathways, control mechanisms, and managerial levers. J. Oper. Manag. 2015, 36, 15–32. [Google Scholar]
- Cheng, Y.J.; Nie, X.Y.; Chen, X.M.; Lin, X.X.; Tang, K.; Zeng, W.T.; Liu, J. The role of macrolide antibiotics in increasing cardiovascular risk. J. Am. Coll. Cardiol. 2015, 66, 2173–2184. [Google Scholar] [CrossRef]
- Helmi, M.N.; Masri, M.N. Risk mapping and mitigation design of small and medium enterprises clothing products using supply chain risk management. IOP Conf. Ser. Mater. Sci. Eng. 2017, 277, 012061. [Google Scholar] [CrossRef]
- Gautam, A.; Prakash, S.; Soni, U. Supply chain risk management and quality: A case study and analysis of Indian automotive industry. Int. J. Intell. Enterp. 2018, 5, 194–212. [Google Scholar] [CrossRef]
- Ali, S.M.; Moktadir, M.A.; Kabir, G.; Chakma, J.M.; Rumi, J.U.M.; Islam, T. Framework for evaluating risks in food supply chain: Implications in food wastage reduction. J. Clean. Prod. 2019, 228, 786–800. [Google Scholar]
- Cai, X.; Qian, Y.; Bai, Q.; Liu, W. Exploration on the financing risks of enterprise supply chain using Back Propagation neural network. J. Comput. Appl. Math. 2020, 367, 112457. [Google Scholar] [CrossRef]
- Al-Zabidi, A.; Rehman, A.U.; Alkahtani, M. An Approach to Assess Sustainable Supply Chain Agility for a Manufacturing Organization. Sustainability 2021, 13, 1752. [Google Scholar] [CrossRef]
- Shekarian, M.; Nooraie, S.V.R.; Parast, M.M. An examination of the impact of flexibility and agility on mitigating supply chain disruptions. Int. J. Prod. Econ. 2020, 220, 107438. [Google Scholar] [CrossRef]
- Miocevic, D. Organizational buying effectiveness in supply chain environment: A conceptual framework. J. Bus. Mark. Manag. 2008, 2, 171–185. [Google Scholar] [CrossRef]
- Zhang, A.; Luo, H.; Huang, G.Q. A bi-objective model for supply chain design of dispersed manufacturing in China. Int. J. Prod. Econ. 2013, 146, 48–58. [Google Scholar] [CrossRef]


Publisher’s Note: MDPI stays neutral with regard to jurisdictional claims in published maps and institutional affiliations. |
© 2021 by the authors. Licensee MDPI, Basel, Switzerland. This article is an open access article distributed under the terms and conditions of the Creative Commons Attribution (CC BY) license (http://creativecommons.org/licenses/by/4.0/).