Article

Creating Values from Biomass Pyrolysis in Sweden: Co-Production of H2, Biocarbon and Bio-Oil

1
Department of Material Sciences and Engineering, KTH Royal Institute of Technology, Brinellvägen 23, 11428 Stockholm, Sweden
2
Envigas AB, Industrivägen 53, 93252 Bureå, Sweden
*
Author to whom correspondence should be addressed.
Processes 2021, 9(3), 415; https://doi.org/10.3390/pr9030415
Submission received: 11 January 2021 / Revised: 18 February 2021 / Accepted: 20 February 2021 / Published: 25 February 2021
(This article belongs to the Special Issue Process Design of Biomass Thermochemical Conversion)

Abstract

:
Hydrogen and biocarbon are important materials for the future fossil-free metallurgical industries in Sweden; thus, it is interesting to investigate the process that can simultaneously produce both. Process simulations of biomass pyrolysis coupled with steam reforming and water-gas-shift to produce H2, biocarbon, and bio-oil are investigated in this work. The process simulation is performed based on a biomass pyrolysis plant currently operating in Sweden. Two co-production schemes are proposed: (1) production of biocarbon and H2, and (2) production of biocarbon, H2, and bio-oil. Sensitivity analysis is also performed to investigate the performance of the production schemes under different operating parameters. The results indicated that there are no notable differences in terms of the thermal efficiency for both cases. Varying the bio-oil condenser temperature only slightly changes the system’s thermal efficiency by less than 2%. On the other hand, an increase in biomass moisture content from 7 to 14 wt.% can decrease the system’s efficiency from 79.0% to 72.6%. Operating expenses are evaluated to elucidate the economics of 3 different cases: (1) no bio-oil production, (2) bio-oil production with the condenser at 50 °C, and (3) bio-oil production with the condenser at 130 °C. Based on operation expenses (OPEX) and revenue alone, it is found that producing more bio-oil helps improving the economics of the process. However, capital costs and the cost for post-processing of bio-oil should also be considered in the future. The estimated minimum selling price for biocarbon based on OPEX alone is approx. 10 SEK, which is within the range of the current commercial price of charcoal and coke.

1. Introduction

Metal production is one of the main industries highly dependent on fossil fuels and emitting a large amount of CO2. In 2019, Sweden produced 29 million tons of iron [1] which resulted in approximately 57 million tons of CO2 emission (1.97 ton CO2/ton steel) [2]. A significant part of CO2 comes from coal, coke, oil, and natural gas used in steel production processes including sintering, coke making and blast furnace [3]. Blast furnaces, which account for the largest CO2 emission in the steel plant, approximately consume 250–300 kg of coke per ton hot metal produced [4]. Some of the methods to reduce CO2 emission from metallurgical processes are to apply new technologies and to use renewable fuels. This includes the use of H2 as a reduction agent instead of coke (HYBRIT project [5]) and the replacement of coal and coke with biocarbon/charcoal from biomass [6].
Sweden has abundant forest resources as their forest accounts for 57% of the total land area [7]. Forest industry in Sweden is well managed with about 120 and 90 million cubic meters of the forest grew and felled every year [7]. In 2020, it was estimated that the Swedish productive forest could provide a total energy of about 450 TWh/year, which is significantly higher than the total energy demand in Sweden (370 TWh/year) [8]. The main forest industries are timber production for furniture and construction, and the pulp and paper industry. The availability of forest and forest residue and the demand for renewable fuels for Swedish metallurgical industries provide a good incentive for turning biomass into biocarbon and renewable H2.
The main process for biocarbon production is pyrolysis of biomass [3,9] which is the application of heat to a feedstock in the absence of oxygen. Some specific properties are required to produce biocarbon for metallurgical processes, including high fixed carbon content, low moisture/volatile content, low CO2 reactivity, and high mechanical strength [3,10]. The pyrolysis process parameters must be adjusted to achieve these required properties [9]. In the pyrolysis process, pyrolysis vapor which consists of bio-oil and gas is also produced. This vapor could be upgraded/reformed to produce H2 [11]. Although there are many processes for producing renewable H2 such as the electrolysis of water [12], biomass/waste steam gasification [13,14], and supercritical water gasification [15], H2 production via the upgrading of pyrolysis vapor presents a very attractive option [11] as H2 is co-produced together with biocarbon, and the reforming process can be adjusted independently of the pyrolysis process. The process also has a potential to be appended to the already existing large scale pyrolysis plant. Besides in-line reforming of pyrolysis vapor, H2 can also be produced via pyrolysis by catalytic steam reforming of bio-oil or its fractions [16,17], and pyrolysis using biochar as an in situ catalyst to promote H2 formation [18].
Table 1 summarizes previous experimental works of woody biomass pyrolysis processes with in-line pyrolysis vapor reforming for H2 production. These works include catalytic upgrading of pyrolysis vapor [19,20] and catalytic steam reforming of pyrolysis vapor [21,22,23,24]. Pyrolysis temperature is in the range of 500–750 °C, while the catalytic steam reformer temperature is in the range of 600–900 °C. In most cases, Ni-based catalyst is employed together with steam to biomass ratio (S/B) of 4. The highest H2 yield is around 10–11 wt.% which is close to the maximum theoretical yield based on steam reforming of pyrolysis vapor of around 11 wt.% of dry biomass (depending on the elemental analysis of different biomasses). This result is achieved when the liquid/bio-oil is fully converted as in [21,24]. As shown in Table 1, when the vapor is not fully converted, bio-oil could be produced, and a high CO concentration is observed. The CO content can be further converted to H2 via the water-gas shift (WGS) reaction by adding more steam [11]. It should be noted that catalyst deactivation could also be a problem during an operation as in [21] where deactivation occurs after 1 h of operation. This will be further discussed in the next section when we consider process schemes.
Considering the review above, the application of pyrolysis for co-production of biocarbon and H2 is beneficial since both products are necessary for future metallurgical processes. Therefore, further investigation of this process based on its energy efficiency and economy aspect is crucial for process design. Process simulation is an important tool for feasibility evaluation and process design. To the best of the authors’ knowledge, process simulations investigating co-production of biocarbon and H2 via biomass pyrolysis and subsequence vapor upgrading are rarely available in the literature. The following literature is some related works. Situmorang et al. [26] reported a process simulation to produce H2 from pyrolysis vapor via steam reforming combined with biochar gasification using chemical looping. Jones et al. [27] reported a process design to convert biomass into hydrocarbon fuels. Fast pyrolysis was employed with char combustion to supply energy to the process. A part of the process gas was converted to H2 by steam reforming of C2+ compounds. Larsson et al. [28] performed a process simulation of slow pyrolysis to produce biochar and CH4.
In this study, different co-production scenarios of biocarbon, hydrogen, and bio-oil based on the biomass pyrolysis process are technically evaluated employing process simulation. Furthermore, preliminary operation expense (OPEX) of each scenario are calculated to find the strategy that offers the most economic benefit. The economic calculation is carried out within the scope of Sweden.

2. Materials and Methods

2.1. Process Description of the Proposed Co-Production Systems

In this study, an intermediate pyrolysis process with electrically heated screw reactor is chosen in the simulation to resemble Envigas pyrolysis process for biocarbon production. The pyrolysis vapor is then reformed in an electrically heated reformer and converted to H2 through a WGS reaction (Equation (1)) in a WGS reactor. The output gas is then separated using pressure swing absorption (PSA).
Water - gas   shift   reaction   CO   +   H 2 O     CO 2   +   H 2
According to Table 1, most of the H2 production process from pyrolysis vapor only used one reformer which serves as a reactor for steam reforming. Most of the previous works were done on lab-scale, which did not incorporate WGS reactors [11]. However, on a pilot or an industrial process, WGS reactors might be necessary to increase the yield and purity of hydrogen stream according to Equation (1). To assess the necessity of having WGS reactors, the amount of CO at the steam reformer outlet should be known. If the CO level is high, the WGS reactor is required. Table 1 shows that the range of CO vol% after steam reformer is very wide due to the different catalysts and operating conditions. Therefore, a WGS reactor is added to our proposed process.
Another vital operation issue is the deactivation of the catalyst. Due to the high concentration of bio-oil vapor compared to natural gas stream and low temperature for steam reforming (600 °C), catalyst deactivation in the steam reforming process occurs quickly, e.g., within 1 hr. in a lab-scale test [29]. Deactivation can be slowed down using a calcined dolomite guard catalyst bed before the Ni-catalyst bed [30,31]. Steam is added to the guard bed kept at higher than 800 °C to allow thermal cracking and steam gasification. The less complicated gas/vapor stream is then fed to Ni-catalyst bed. It seems that carbon deposition occurs in dolomite guard bed to some extent, and a regeneration process of guard bed was performed by treatment with pure steam at 800 °C for 30 min [30].
Some works suggest removing pyrolytic lignin fraction from bio-oil before steam reforming to slow down catalyst deactivation. Some methods for in-line removal of this fraction are (1) fractional condensation [32], and (2) thermal treatment [33]. Fractional condensation removes pyrolytic lignin and other heavy compounds in bio-oil as a liquid. On the other hand, thermal treatment turns pyrolytic lignin fraction into coke, which is then removed from the system.
From the above literature reviews, we proposed to investigate two co-production schemes as follow:
Scheme 1: to produce biocarbon with H2. As shown in Figure 1, the whole pyrolysis vapor will be used for hydrogen production. One steam reformer unit is used to model the dolomite guard bed and the Ni-catalyst bed with a thermodynamic equilibrium model.
Scheme 2: to produce biocarbon with bio-oil and H2. As shown in Figure 2, fractional condensation will be applied to condense heavy fraction of bio-oil. The light fraction of bio-oil will be used for H2 production.

2.2. Materials and Products Analysis

The elemental analysis of raw biomass and char from the Envigas biocarbon pilot plant in Bureå, Sweden, was performed by an external laboratory (Eurofins, Sweden) following ASTM-D5373:2016 and ASTM-D5142:2009 standards. The typical standard deviation of the analysis is 5–10% as reported by the external laboratory. The results are shown in Table 2. Unfortunately, bio-oil and gas were not analyzed. Therefore, their compositions and yields are obtained by using assumptions from literature and elemental balance.

2.3. Calculation/Simulation

The process simulations conducted in this study are carried out using the Aspen Plus version 9.0 (Aspen Technology, Inc., Bedford, MA, USA) process simulation package. The simulations are performed under the following general conditions and assumptions:
  • The biomass feed input is 1000 kg/h.
  • The process is operated under steady-state conditions.
  • Gases are treated as ideal gases, and the ambient pressure is 101.325 kPa.
  • The property method selected is Peng-Robinson for the all-reactor modules.
  • The efficiency of the compressor and pump are 90 and 75%, respectively [36].
The minimum temperature approach ( Δ T m i n ) of heat exchangers is 10 °C [36].
The pyrolysis mass and energy balance are obtained from the pilot plant operation at Envigas. The data is then used as an input for the remaining downstream processes in the Aspen Plus.

2.4. Assumptions and Basis for Calculations

2.4.1. Pyrolysis Yields

Figure 3 shows a pyrolysis process at Envigas biocarbon pilot plant in Bureå, Sweden. An intermediate pyrolysis process of 100 kg/h biomass was performed in an electrically heated screw reactor with the pyrolysis temperature of 550–650 °C. The char (biocarbon) yield is obtained directly from the process by recording weights of the feedstock and the produced biocarbon. The char yield is 23.0 ± 2.5 wt.%. Liquid and gas yields are rounded values from a reference [19] in the case of pyrolysis without any catalyst. The pyrolysis yields are given in Equations (2) and (3).
100   wt . %   Biomass     6.6 wt . %   Moisture + 0.24   wt. %   Ash + 93.16 wt . % Biomass   ( daf )
100   wt . %   Biomass   ( daf )     23 wt . %   Char + 43 wt . %   Bio - oil + 34 wt . % Gas

2.4.2. Liquid and Gas Compositions

Pyrolysis vapor consists of bio-oil and non-condensable gases. Elemental compositions of pyrolysis vapor are calculated via the difference of those of biomass and char. The composition of liquid given in Table 3 is based on middle values from a literature [37]. As for intermediate pyrolysis, the water content in bio-oil is usually in the range of 40–60 wt.% [38]. Considering the moisture content in the raw feedstock of 6.6 wt.% (Table 2) and the yield of bio-oil of 43 wt.% of dry biomass (Equation (3)), the calculated water content of bio-oil (dry biomass basis) of 35 wt.% will give the final moisture content in bio-oil (wet biomass basis) of approx. 41 wt.%, according to the range in the literature [37]. The high molecular weight lignin and hybrid oligomer (HMWLIG) represents a lump of all heavy compounds from pyrolytic lignin, hybrid oligomers and humins. Its elemental composition (Table 4) is calculated by the elemental balance of the pyrolysis products and the feedstock, given that the H/C ratio is less than 2. In the Aspen Plus, the HMWLIG is represented by a non-conventional solid compound.
The balance H is added to H2 gas. Since the reformer is simulated using Gibbs reactor, the final H2 content will not be affected by this initial adjustment. The gas composition shown in Table 5 is based on rounded values from reference [39]. The gas composition was adjusted to achieved elemental balance.

2.4.3. Bio-Oil Condenser

In Scheme 2, the hot vapor products are directly condensed to collect bio-oil before the steam reforming process. In Envigas pilot plant, the condenser system consists of a scrubber that can be operated at different temperatures (see Figure 3). As seen in Figure 4b, the condenser system can be modeled by using a flash block module (“COND”) in Aspen Plus. The composition and mass flow of the “PYRO1” stream coming into the flash block is defined based on the pyrolysis yield calculation, as explained in the previous section. In this study, the condenser temperature is varied within the range of 50–130 °C. The HMWLIG in the pyrolysis vapor is assumed to fully condense into “BIO-OIL” stream for all operating temperatures. Although the rest of the fraction condenses differently based on the operating temperature.
On the other hand, no “COND” block is required for Scheme 1 as the whole pyrolysis vapor goes directly into the steam reformer.

2.4.4. Steam Reformer

The steam reformer is operated at 850 °C and the ambient pressure with monolith Ni-catalysts. At this temperature, Zhang et al. reported that the coke deposition on the surface of Ni-catalyst could be extensively limited [17]. Monolith catalysts are considered for the process as they can reduce pressure drop, easy to be installed, durable, and able to withstand various conditions [30,41]. Furthermore, a successful application of monolith catalysts for steam reforming has been proved at an industrial scale [41]. As explained before, it should be noted that the addition of a guard bed before the Ni-catalyst bed might be crucial in Scheme 1 due to the heavy fraction of bio-oil which cause rapid catalyst deactivation [30,31].
For the simulation purpose, thermodynamic equilibrium is used to model the steam reformer, represented by an RGibbs block (“REFORM”) in the Aspen Plus flowsheet. In the case of Scheme 1, an additional RYield block (“DECOMP”) is needed prior the reformer to convert the non-conventional high MW lignin-derived compound into their basic molecules (i.e., C, H2, and O2). As seen in Figure 4a, this can be done by splitting the “PYRO2” stream into two different streams through a separation block (“SEP1”). After that, the “HMWLIG1” stream that contains the high MW lignin compounds flows to the “DECOMP” block, in which it would be converted based on their ultimate composition. Finally, all streams are subjected to the steam reforming process with the steam-to-carbon (S/C) ratio of 5 [30]. The ratio is defined as the molar flow rate of H2O from both the existing pyrolysis vapor and the external steam supply (“H2O-REF1”) to the molar flow rate of carbon atom in the pyrolysis vapor that goes into the reformer. Thereafter, the hot syngas produced from the steam reforming reactions is used to preheat the steam and pyrolysis vapor feed streams through a series of heat exchangers (“HX1” and “HX2”). More details of those blocks and streams used in the reforming section, as well as in the WGS and PSA sections, are summarized in Table 6.

2.4.5. WGS Reactor

Subsequently, the reformer’s cooled gas products are fed to a high-temperature (HT) WGS reactor. The flowsheet diagram of the process can be seen in Figure 5. The WGS reactor uses a Fe/Cr-based commercial catalyst that has been successfully tested to produce H2 from a tar-rich syngas generated from gasification of biomass [42]. The reactor is operated at 425 °C and ambient pressure. A molar steam to dry gas ratio of 1.5 is used to prevent coking and carbon deposition on the catalyst surface [43]. The molar amount of steam fed to the WGS reactor is calculated by writing a FORTRAN code, which is executed before the unit operation (“WGS” block). The code is written in a calculator block based on the following formula,
n H 2 O W G S ˙ = [ 1.5   ( n C O ˙ + n C O 2 ˙ + n C H 4 ˙ ) ] n H 2 O s y n g a s ˙
where n H 2 O W G S is the molar rate (kmol/h) of the steam supply needed for the WGS reactor; and n C O , n C O 2 , n C H 4 , and n H 2 O s y n g a s are the molar rate (kmol/h) of the CO, CO2, CH4, and existing steam in the syngas input stream to the WGS reactor, respectively. The HT WGS reactor is simulated using an adiabatic stoichiometric model (RStoic) with a CO conversion rate of 0.92 [42]. The amount of required catalyst for WGS process is calculated based on the gas hourly space velocity (GHSV) constant of 479 h−1 [42]. This constant is determined as the ratio of the volumetric dry gas flow rate at the inlet of the WGS reactor to the catalyst volume.

2.4.6. Pressure Swing Absorber (PSA)

The gas stream produced from the WGS reactor is then cooled to condense the steam fraction. The dried gas is then compressed to 1 MPa and fed to the PSA module operated at 50 °C. In this simulation, the PSA model is simplified using a separator block (“PSA”).

2.5. System Evaluation

The performance of the proposed co-production systems is evaluated by using H2 ( η H 2 ) , bio-oil ( η b i o o i l ) , and total thermal ( η t h ) efficiencies which are formulated as follow:
η H 2 =   L H V H 2   ·   m ˙ H 2 E i n
η b i o o i l =   L H V b i o o i l   ·   m ˙ b i o o i l E i n
η t h =   L H V H 2   ·   m ˙ H 2 +   L H V b i o o i l   ·   m ˙ b i o o i l +   L H V b i o c a r b o n   ·   m ˙ b i o c a r b o n E i n
E i n = ( L H V b i o m a s s   ·   m ˙ b i o m a s s )   +   W p y r o l y s i s   +   W r e f o r m e r   +   W a u x i l i a r i e s
where L H V b i o m a s s , L H V H 2 , L H V b i o o i l , and L H V b i o c a r b o n are the LHV (kJ/kg) of biomass, H2, bio-oil, and biocarbon, respectively; m ˙ b i o m a s s , m ˙ H 2 , m ˙ b i o o i l , and m ˙ b i o c a r b o n are the mass flow rate (kg/h) of biomass, H2, bio-oil, and biocarbon, respectively; W p y r o l y s i s is the electrical power (kW) to heat the pyrolysis reactor, W r e f o r m e r   is the electrical power (kW) to heat the steam reformer, and W a u x i l i a r i e s is the duties (kW) of compressors and pumps.

3. Results and Discussion

3.1. Mass and Energy Flow

3.1.1. Scheme 1

Figure 6a shows the mass flow diagram of production system Scheme 1, in which biocarbon and H2 are produced from 1000 kg/h of biomass. In the pyrolysis reactor, the biomass with a moisture content of 7 wt.% can be converted into 217.2 kg of biocarbon. The remaining vapor fraction (782.8 kg/h) is then fed into the steam reforming, where 393.4 of steam is added into the reaction to meet the required S/C ratio. The steam amount in the reformer’s outlet stream is insufficient to reach a molar steam to dry gas ratio of 1.5 required for the WGS reactor; hence, 263.1 kg/h of steam is added to the WGS process. At the final stream outlet, 93.5 kg/h of H2 can be produced or equal to 10.0 wt.% of dry biomass input (see Table 7); while 943.2 kg/h of CO2 can be separated from the stream which corresponds to 101.1 wt.% of dry biomass.
The energy flow diagram of Scheme 1 is shown in Figure 7a. To operate the pyrolyzer at 550 °C, 420 kW of power is needed as an electrical heating source, which is equal to 1.6 MJ/kg of dry biomass input. This value is in the same range of heat required for pyrolysis of pine of 1.5–1.9 MJ/kg reported in the literature [44,45]. Meanwhile, 699.7 kW of electrical power is required to maintain the steam reformer at 850 °C. The reformer’s reactions are endothermic; thus, a significant amount of energy is needed, especially when the reactor is set to a high temperature. On the other hand, no additional energy is needed to operate the WGS reactor as the WGS reaction is exothermic and the heat required to generate steam input can be easily supplied through the heat exchanger (HX3). Overall, the values of η H 2 and η t h of Scheme 1 are 47.1 and 79.0, respectively.

3.1.2. Scheme 2

Figure 6b shows the mass flow diagram of Scheme 2, in which bio-oil is collected by condensing the pyrolysis vapor at 50 °C. At the condenser, slightly more than half of the pyrolysis vapor weight can be condensed into bio-oil. This result corresponds to approximately 46.0 wt.% of dry biomass flowrate. Nevertheless, the condensed bio-oil’s water content reaches 41.7 wt.%, which cause a relatively low LHV of 5.9 MJ/kg. As the H2O mostly condense to the bio-oil fraction, the light vapor that goes to the steam reformer contains only dry gases. Thus, a higher amount of additional steam is needed at the reformer’s inlet than that of Scheme 1, to satisfy the required S/C ratio. However, no additional steam is required for the WGS reactor as the reformer’s syngas contains enough steam. Overall, the system needs a 41.8% lower amount of make-up water than Scheme 1. The final value of H2 yield is almost half of Scheme 1’s value which is approximately 4.7 wt.% dry biomass.
Figure 7b presents the energy flow diagram of Scheme 2. Even though the reforming process needs a higher flow rate of steam, the total heat needed for the process is lower (20.9% lower) than Scheme 1. This is because the amount of pyrolysis vapor stream input is lower compared to Scheme 1. As seen in Figure 6b, stream input’s mass flow is 353.7 kg/h, which is 54.8% lower than that of Scheme 1. Accordingly, the reformer requires lower energy to maintain the reaction at 850 °C. Lastly, the production system can achieve η H 2 and η b i o o i l values of 22.9 and 23.1, respectively. Meanwhile, there are not any differences regarding the value of η t h , as the value for both systems is 79.0%.

3.2. Sensitivity Analysis

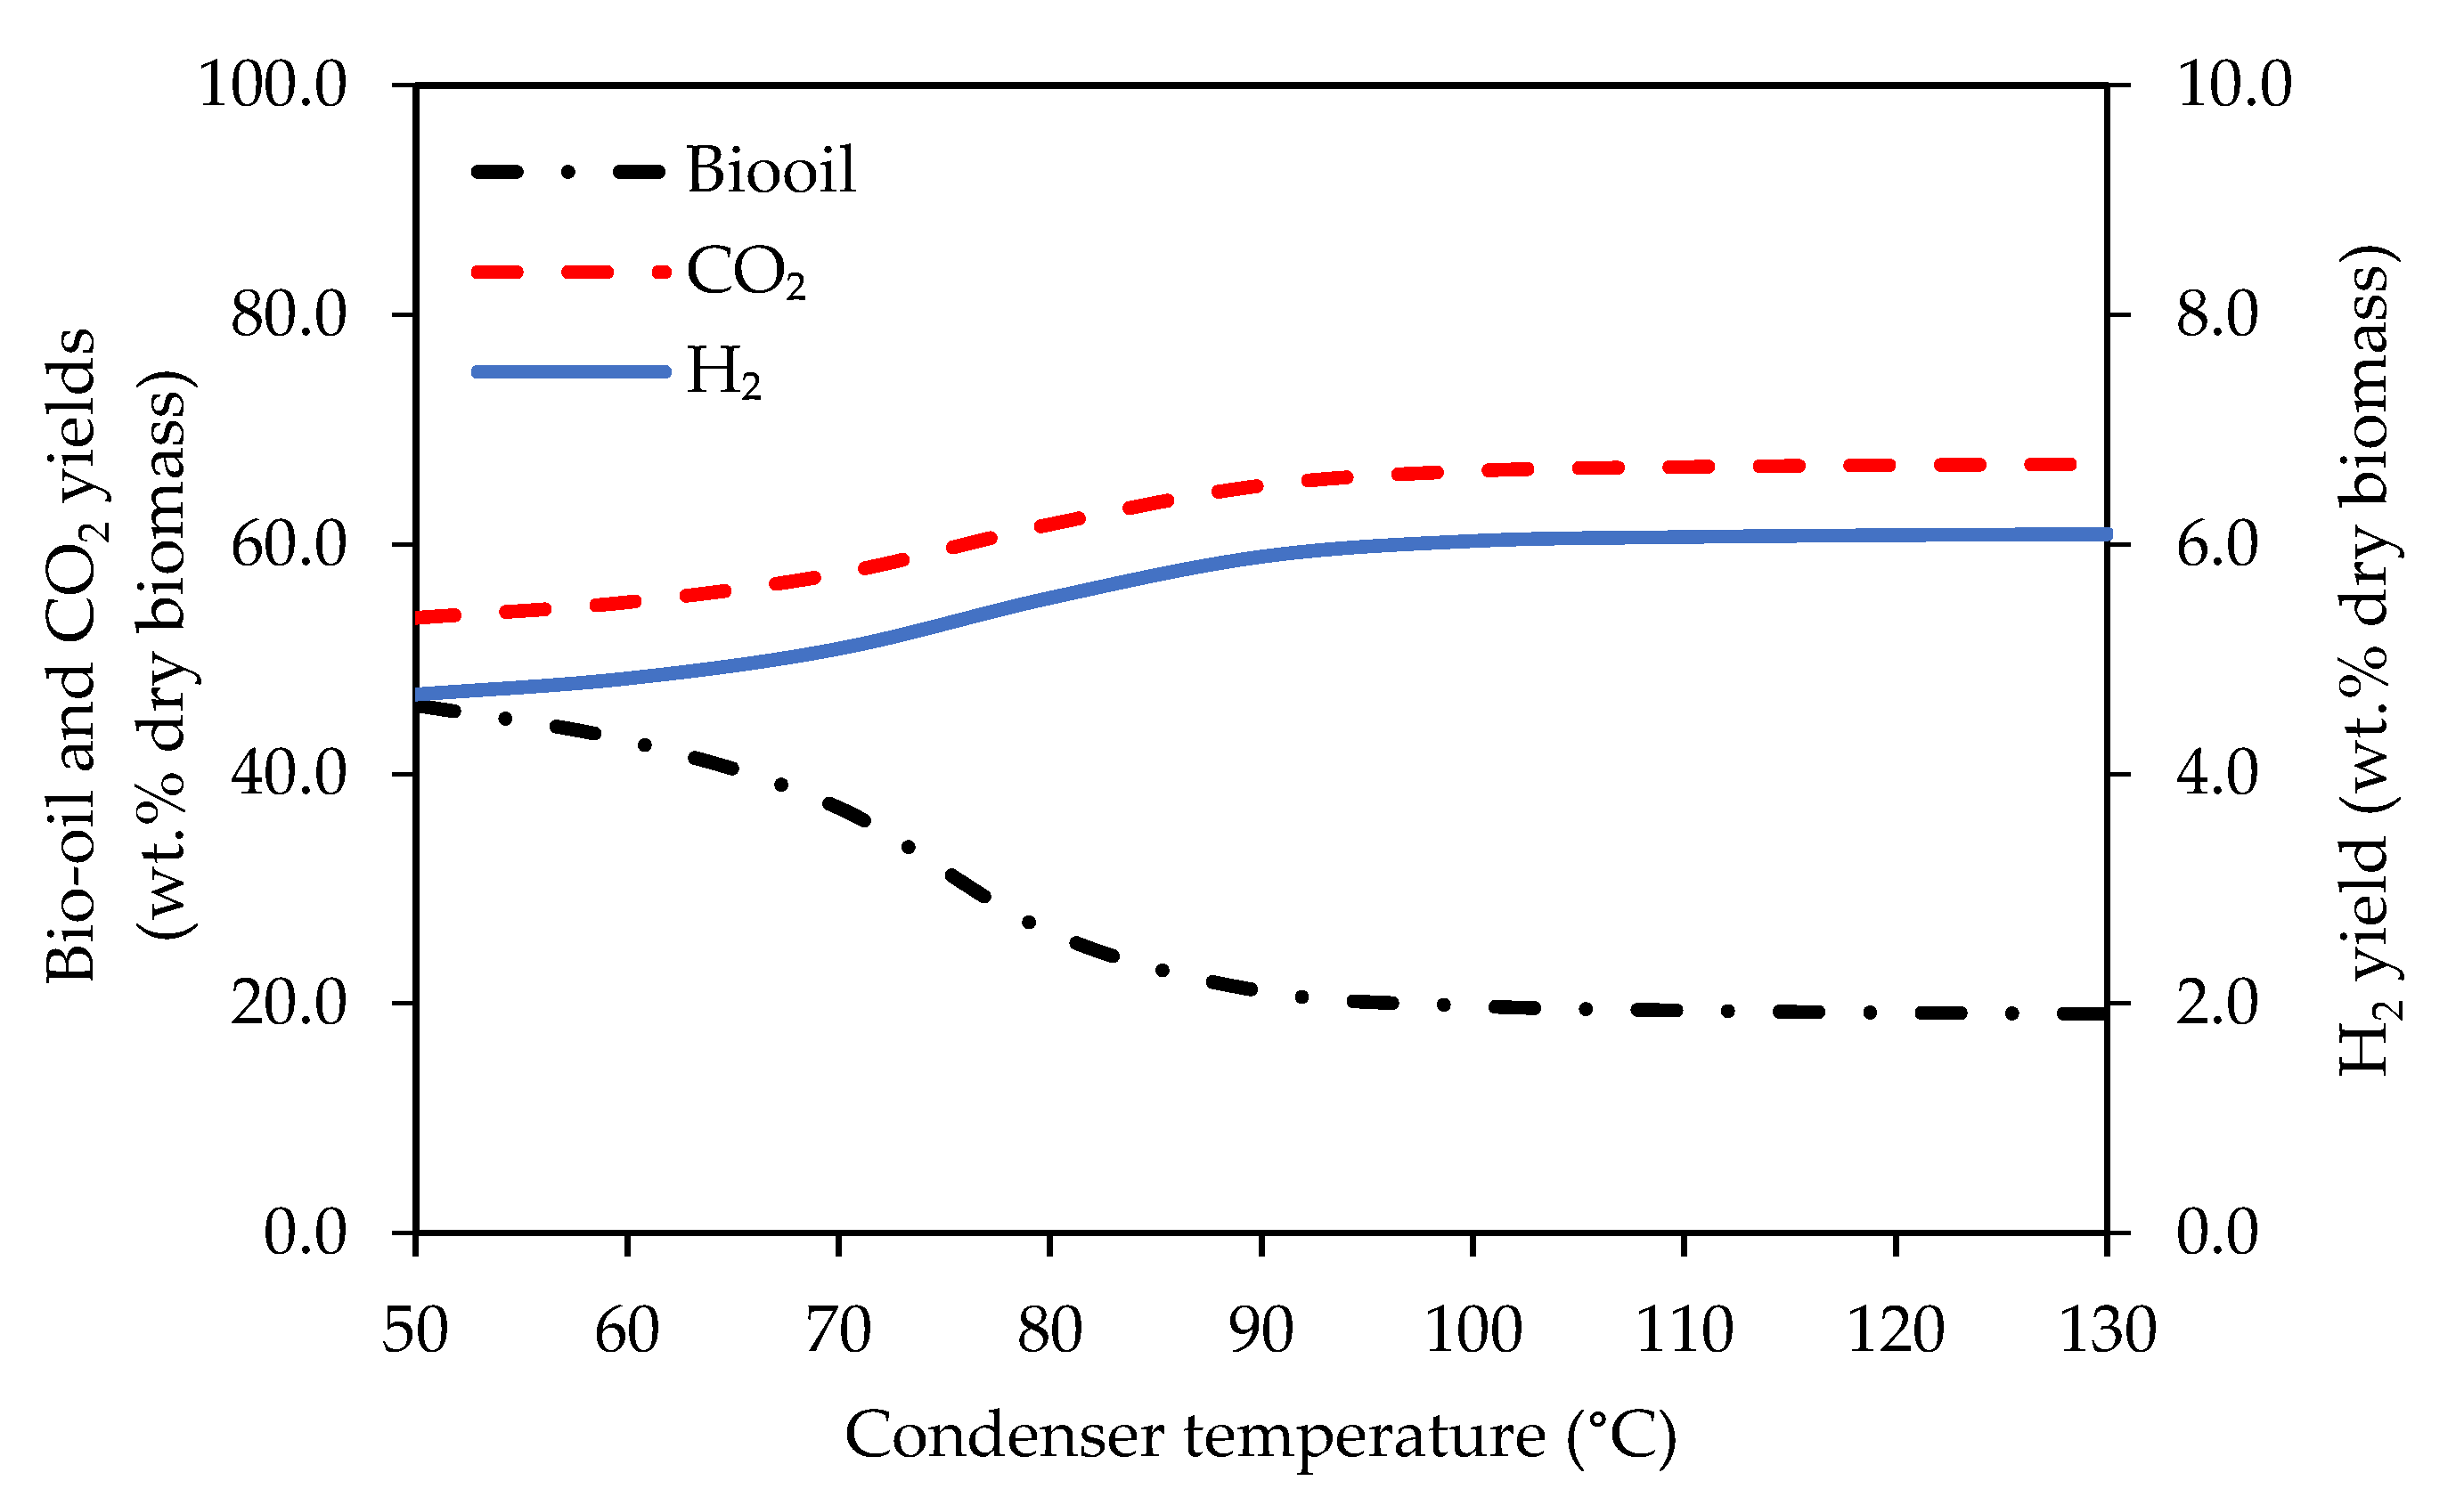
3.2.1. Effect of Temperature of the Bio-Oil Condenser

The temperature of the bio-oil condenser is varied between 50–130 °C to investigate its effect on the system performance of Scheme 2. As seen in Figure 8, changing the condenser temperature obviously affects the product distribution. At 50 °C, the bio-oil yield value is 46.0 wt.% dry biomass which notably decreases with the raise of condenser temperature until 100 °C. At a temperature above 100 °C, no significant reduction can be observed for the bio-oil yield. At the highest temperature of 130 °C, the bio-oil yield is equal to 19.1 wt.% dry biomass. It should be noted that in this simulation, the lumped high MW lignin-derived fraction of bio-oil is assumed as a non-conventional compound which fully condenses within the investigated temperature range. The application of a more accurate model of this compound’s condensation characteristics might result in a shifted bio-oil yield.
Figure 9 depicts the LHV and the water content of bio-oil collected from different condenser temperature. More steam can be condensed at a lower condenser temperature, which causes the water content of bio-oil to increase. As seen in the figure, at 50 °C, the bio-oil contains an approximately 41.7 wt.% of water content, while less than 1 wt.% of water content is obtained in the case of 130 °C. The high content of water consequently causes the bio-oil to have a low LHV. For instance, in the case of 50 °C, the LHV is only 5.9 MJ/kg, which is 27.0% lower than that of 130 °C.
Operating the condenser at a different temperature only slightly affects the total thermal efficiency of the system. As seen in Figure 10, at a higher condenser operating temperature, Scheme 2 has a higher η t h value. Raising the condenser temperature from 50 to 130 °C results in a merely 1% higher of η t h value. This small change is mainly caused by the lower amount of heat loss at the condenser when it set to a higher operating temperature.

3.2.2. Effect of Moisture Content of Biomass

Table 8 shows the performance parameters’ values of Scheme 2 when the biomass feed has different moisture contents of 7 and 14 wt.%. This sensitivity analysis is performed with the assumption of a condenser temperature of 50 °C. A higher biomass moisture content obviously reduces the system performance of Scheme 2, at which the value of η t h decrease from 79.0% to 72.6% as the moisture content increase from 7 to 14 wt.%. The efficiency value decreases mainly due to the reduction of the products’ total energy value at lower yield values. For instance, the calorific value of biocarbon, bio-oil, and H2 are 1945.5, 1361.1, and 1345.3 kW, respectively, when there is a 14 wt.% of moisture content in biomass. These values are approximately 8% lower than that of 7% biomass moisture content. The H2 and CO2 yields do not show different values for both cases regarding the dry weight of biomass, suggesting that the product distribution at the reformer and WGS reactor is similar.

3.3. Operating Expense Evaluation

Operating expense (OPEX) is calculated to evaluate the economics of the process partially. The OPEX is calculated for three different cases as follows.
Case 1: In this case, Scheme 1 is used to produce only biocarbon and H2.
Case 2: In this case, Scheme 2 is used in which the condenser before the steam reformer is operated at a low temperature of 50 °C to collect bio-oil.
Case 3: In this case, Scheme 2 is used in which the condenser before the steam reformer is operated at a high temperature of 130 °C.
Table 9 lists the assumptions for the OPEX calculation. Reformer catalyst is assumed to be a monolith catalyst; therefore, the make-up catalyst is not required. Occasionally every 1–3 months, the monolith catalyst will require regeneration or cleaning [41]. WGS catalyst is assumed to be in the form of pellets. The amount of catalyst load is determined based on the GHSV constant of 479 h−1, which are 3566, 1827, and 2362 kg for Case 1, Case 2, and Case 3, respectively. Table 10 summarizes the main process parameters used in the OPEX calculation. Bio-oil prices in case 2 and 3 are calculated based on water content and dry bio-oil price.
Annual operation costs are shown in Table 11. The feedstock and personnel costs are the main expenses and are same for all cases, while the costs for reformer and WGS vary depending on the amount of vapor going into reformer in each case. Case 1 has the highest operating cost due to the higher amount of vapor going into the reformer. Moreover, Case 1 also has the lowest revenue. This results in Case 1 being the least economical based on operating cost alone. However, the capital cost for Case 1 is expected to be lower than Case 2 and 3 because a bio-oil condenser is not required in Case 1. Another operational cost not considered is the reformer catalyst regeneration cost which is expected to be higher in Case 1 due to the larger volume of the pyrolysis vapor needed to be reformed.
The loss/gain based on OPEX without considering CO2 as a commodity suggests that the most economical process is Case 2 with the gain of 0.31 SEK/kg-biomass fed. This assumes that the bio-oil with high water content could be sold without further processing.
When considering CO2 as a commodity, the total revenue doubles in Case 2 and 3, and increases four times in Case 1. The loss/gain based on OPEX is then positive for all cases with more than 10 SEK/kg of biomass. Nevertheless, CO2 is not usually considered a commodity but as an emission that could arguably be carbon neutral.
A minimum biocarbon selling price for Case 1 is calculated based on the biocarbon price that gives zero loss/gain based on OPEX alone. The value is 10.11 SEK/kg, which is comparable to retail prices for grill charcoal in Sweden of 12–35 SEK/kg [51]. It is also comparable to the price of coking coal, which is around 10–20 SEK/kg, while coal’s commercial price is 5–10 SEK/kg [52].
The minimum biocarbon selling price for Case 1 was used in Case 2 and 3 to calculate the minimum selling price for bio-oil. It was found that the prices are 3.44 and 5.59 SEK/kg, respectively. The bio-oil price for Case 3 is comparable to that of crude oil. Nevertheless, the application of bio-oil in existing refinery still needs more study and testing. An initiative to refine bio-oil on an industrial scale is on-going in Sweden [53]. For bio-oil with high water content as in Case 2 with 41.7 wt.% water, post-processing is needed to reduce water content or fractionate the oil. Fermentation is another pathway to use high water content bio-oil [54].
Although Case 2 is the most economical cases based on OPEX, there is still some future consideration that might hinder this process’s economics. First, Case 2 (and 3) requires capital investment for a condenser. Second, Case 2 compared to Case 3 requires post-processing of bio-oil due to the high water content.

4. Conclusions

In this study, two different co-production schemes of H2, biocarbon, and bio-oil are proposed based on the 1000 kg/h biomass pyrolysis plant available at Envigas, Sweden. Two production schemes are proposed: (1) to produce biocarbon and H2 and (2) to produce biocarbon, H2 and bio-oil. Process simulations using Aspen Plus were carried out to assess those schemes under different operating parameters. The results indicate that both Scheme 1 and Scheme 2 exhibit a similar value of total thermal efficiency despite their different H2 and bio-oil yields. Varying the bio-oil condenser temperature only slightly changes the system’s thermal efficiency by less than 2%. On the other hand, an increase in biomass moisture content from 7 to 14 wt.% can decrease the system’s efficiency from 79.0 to 72.6%.
Furthermore, operating expense is evaluated to clarify the economics of 3 different cases which are (1) no bio-oil production, (2) bio-oil production with the condenser at 50 °C, and (3) bio-oil production with the condenser at 130 °C. Based on OPEX and revenue alone, it is found that producing more bio-oil can improve the economic feasibility of the process. However, capital costs and the cost for post-processing of bio-oil should also be considered in the future. The estimated minimum selling price for biocarbon based on only OPEX is approximately 10 SEK, which is within a price range of commercial charcoal and coke in Sweden.

Author Contributions

Conceptualization, all; methodology, I.N.Z. and N.S.; software, I.N.Z.; validation, all; formal analysis, I.N.Z. and N.S.; investigation, I.N.Z. and N.S.; resources, K.S. and W.Y.; writing—original draft preparation, I.N.Z. and N.S.; writing—review and editing, all; visualization, I.N.Z. and N.S.; supervision, K.S. and W.Y.; funding acquisition, K.S. and W.Y. All authors have read and agreed to the published version of the manuscript.

Funding

This research received financial supports from the Swedish Energy Agency (Energimyndigheten).

Institutional Review Board Statement

Not applicable.

Informed Consent Statement

Not applicable.

Data Availability Statement

Not applicable.

Acknowledgments

N.S. would like to thank DPST project, Thailand, for mental support.

Conflicts of Interest

The authors declare no conflict of interest. The funders had no role in the design of the study; in the collection, analyses, or interpretation of data; in the writing of the manuscript, or in the decision to publish the results.

References

  1. Sveriges Geologiska Undersökning (SGU) Bergverksstatistik 2019: Statistics of the Swedish Mining Industry. 2019. Available online: http://resource.sgu.se/bergsstaten/bergverksstatistik-2019.pdf (accessed on 11 November 2020).
  2. Sandberg, H.; Lagneborg, R.; Lindblad, B.; Axelsson, H.; Bentell, L. CO2 emissions of the Swedish steel industry. Scand. J. Metall. 2001, 30, 420–425. [Google Scholar] [CrossRef] [Green Version]
  3. Suopajärvi, H.; Umeki, K.; Mousa, E.; Hedayati, A.; Romar, H.; Kemppainen, A.; Wang, C.; Phounglamcheik, A.; Tuomikoski, S.; Norberg, N.; et al. Use of biomass in integrated steelmaking—Status quo, future needs and comparison to other low-CO2 steel production technologies. Appl. Energy 2018, 213, 384–407. [Google Scholar] [CrossRef] [Green Version]
  4. Babich, A.; Senk, D. Coke in the iron and steel industry. In New Trends in Coal Conversion; Elsevier: Amsterdam, The Netherlands, 2019; pp. 367–404. [Google Scholar]
  5. Pei, M.; Petäjäniemi, M.; Regnell, A.; Wijk, O. Toward a fossil free future with hybrit: Development of iron and steelmaking technology in Sweden and Finland. Metals 2020, 10, 972. [Google Scholar] [CrossRef]
  6. Mousa, E.; Wang, C.; Riesbeck, J.; Larsson, M. Biomass applications in iron and steel industry: An overview of challenges and opportunities. Renew. Sustain. Energy Rev. 2016, 65, 1247–1266. [Google Scholar] [CrossRef]
  7. Sveaskog Brief Facts 1: What is Swedish Forestry? Available online: https://www.sveaskog.se/en/forestry-the-swedish-way/short-facts/brief-facts-1/ (accessed on 26 January 2021).
  8. Swedish Bioenergy Assn (Svebio). Roadmap Bioenergy—Meeting the Demand for Bioenergy in a Fossil Free SWEDEN. 2020. Available online: https://www.svebio.se/app/uploads/2020/03/Roadmap-Bioenergy-2020.pdf (accessed on 26 January 2021).
  9. Phounglamcheik, A.; Wang, L.; Romar, H.; Kienzl, N.; Broström, M.; Ramser, K.; Skreiberg, Ø.; Umeki, K. Effects of Pyrolysis Conditions and Feedstocks on the Properties and Gasification Reactivity of Charcoal from Woodchips. Energy Fuels 2020, 34, 8353–8365. [Google Scholar] [CrossRef]
  10. Sophonrat, N.; Brink, T.; Sjöblom, K. PyNe 45 Newsletter—IEA Bioenergy Task 34. 2019, pp. 13–17. Available online: https://task34.ieabioenergy.com/wp-content/uploads/sites/3/2019/12/PyNe-45_final.pdf (accessed on 30 November 2020).
  11. Arregi, A.; Amutio, M.; Lopez, G.; Bilbao, J.; Olazar, M. Evaluation of thermochemical routes for hydrogen production from biomass: A review. Energy Convers. Manag. 2018, 165, 696–719. [Google Scholar] [CrossRef]
  12. Shiva Kumar, S.; Himabindu, V. Hydrogen production by PEM water electrolysis—A review. Mater. Sci. Energy Technol. 2019, 2, 442–454. [Google Scholar] [CrossRef]
  13. Zaini, I.N.; Nurdiawati, A.; Aziz, M. Cogeneration of power and H2 by steam gasification and syngas chemical looping of macroalgae. Appl. Energy 2017, 207, 134–145. [Google Scholar] [CrossRef]
  14. Zaini, I.N.; Gomez-Rueda, Y.; García López, C.; Ratnasari, D.K.; Helsen, L.; Pretz, T.; Jönsson, P.G.; Yang, W. Production of H2-rich syngas from excavated landfill waste through steam co-gasification with biochar. Energy 2020, 207, 118208. [Google Scholar] [CrossRef]
  15. Nurdiawati, A.; Zaini, I.N.; Irhamna, A.R.; Sasongko, D.; Aziz, M. Novel configuration of supercritical water gasification and chemical looping for highly-efficient hydrogen production from microalgae. Renew. Sustain. Energy Rev. 2019, 112, 369–381. [Google Scholar] [CrossRef]
  16. Czernik, S.; Evans, R.; French, R. Hydrogen from biomass-production by steam reforming of biomass pyrolysis oil. Catal. Today 2007, 129, 265–268. [Google Scholar] [CrossRef]
  17. Zhang, S.P.; Li, X.J.; Li, Q.Y.; Xu, Q.L.; Yan, Y.J. Hydrogen production from the aqueous phase derived from fast pyrolysis of biomass. J. Anal. Appl. Pyrolysis 2011, 92, 158–163. [Google Scholar] [CrossRef]
  18. Norouzi, O.; Jafarian, S.; Safari, F.; Tavasoli, A.; Nejati, B. Promotion of hydrogen-rich gas and phenolic-rich bio-oil production from green macroalgae Cladophora glomerata via pyrolysis over its bio-char. Bioresour. Technol. 2016, 219, 643–651. [Google Scholar] [CrossRef] [PubMed]
  19. Adrados, A.; Lopez-Urionabarrenechea, A.; Solar, J.; Requies, J.; De Marco, I.; Cambra, J.F. Upgrading of pyrolysis vapours from biomass carbonization. J. Anal. Appl. Pyrolysis 2013, 103, 293–299. [Google Scholar] [CrossRef]
  20. Adrados, A.; Lopez-Urionabarrenechea, A.; Acha, E.; Solar, J.; Caballero, B.M.; de Marco, I. Hydrogen rich reducing gases generation in the production of charcoal from woody biomass carbonization. Energy Convers. Manag. 2017, 148, 352–359. [Google Scholar] [CrossRef]
  21. Arregi, A.; Lopez, G.; Amutio, M.; Barbarias, I.; Bilbao, J.; Olazar, M. Hydrogen production from biomass by continuous fast pyrolysis and in-line steam reforming. RSC Adv. 2016, 6, 25975–25985. [Google Scholar] [CrossRef]
  22. Chen, F.; Wu, C.; Dong, L.; Vassallo, A.; Williams, P.T.; Huang, J. Characteristics and catalytic properties of Ni/CaAlOx catalyst for hydrogen-enriched syngas production from pyrolysis-steam reforming of biomass sawdust. Appl. Catal. B Environ. 2016, 183, 168–175. [Google Scholar] [CrossRef]
  23. Efika, C.E.; Wu, C.; Williams, P.T. Syngas production from pyrolysis-catalytic steam reforming of waste biomass in a continuous screw kiln reactor. J. Anal. Appl. Pyrolysis 2012, 95, 87–94. [Google Scholar] [CrossRef]
  24. Xiao, X.; Meng, X.; Le, D.D.; Takarada, T. Two-stage steam gasification of waste biomass in fluidized bed at low temperature: Parametric investigations and performance optimization. Bioresour. Technol. 2011, 102, 1975–1981. [Google Scholar] [CrossRef]
  25. Ochoa, A.; Arregi, A.; Amutio, M.; Gayubo, A.G.; Olazar, M.; Bilbao, J.; Castaño, P. Coking and sintering progress of a Ni supported catalyst in the steam reforming of biomass pyrolysis volatiles. Appl. Catal. B Environ. 2018, 233, 289–300. [Google Scholar] [CrossRef]
  26. Situmorang, Y.A.; Zhao, Z.; An, P.; Yu, T.; Rizkiana, J.; Abudula, A.; Guan, G. A novel system of biomass-based hydrogen production by combining steam bio-oil reforming and chemical looping process. Appl. Energy 2020, 268, 115122. [Google Scholar] [CrossRef]
  27. Jones, S.; Meyer, P.; Snowden-Swan, L.; Susanne, K.J.; Pimphan, M.; Asanga, P.; Eric, T.; Abhijit, D.; Jacob, J. Process Design and Economics for the Conversion of Lignocellulosic Biomass to Hydrocarbon Fuels: Fast Pyrolysis and Hydrotreating Bio-Oil Pathway. U.S. Department of Energy Bioenergy Technologies Office. 2013. Available online: https://www.nrel.gov/docs/fy14osti/61178.pdf (accessed on 1 May 2020).
  28. Larsson, M.; Görling, M.; Grönkvist, S.; Alvfors, P. Bio-methane upgrading of pyrolysis gas from charcoal production. Sustain. Energy Technol. Assess. 2013, 3, 66–73. [Google Scholar] [CrossRef]
  29. Arregi, A.; Lopez, G.; Amutio, M.; Artetxe, M.; Barbarias, I.; Bilbao, J.; Olazar, M. Role of operating conditions in the catalyst deactivation in the in-line steam reforming of volatiles from biomass fast pyrolysis. Fuel 2018, 216, 233–244. [Google Scholar] [CrossRef]
  30. Lónyi, F.; Valyon, J.; Someus, E.; Hancsók, J. Steam reforming of bio-oil from pyrolysis of MBM over particulate and monolith supported Ni/γ-Al2O3 catalysts. Fuel 2013, 112, 23–30. [Google Scholar] [CrossRef]
  31. Wu, C.; Huang, Q.; Sui, M.; Yan, Y.; Wang, F. Hydrogen production via catalytic steam reforming of fast pyrolysis bio-oil in a two-stage fixed bed reactor system. Fuel Process. Technol. 2008, 89, 1306–1316. [Google Scholar] [CrossRef]
  32. Wang, D.; Czernik, S.; Montané, D.; Mann, M.; Chornet, E. Biomass to Hydrogen via Fast Pyrolysis and Catalytic Steam Reforming of the Pyrolysis Oil or Its Fractions. Ind. Eng. Chem. Res. 1997, 36, 1507–1518. [Google Scholar] [CrossRef]
  33. Remiro, A.; Valle, B.; Aguayo, A.T.; Bilbao, J.; Gayubo, A.G. Steam reforming of raw bio-oil in a fluidized bed reactor with prior separation of pyrolytic lignin. Energy Fuels 2013, 27, 7549–7559. [Google Scholar] [CrossRef]
  34. Guo, W.; Lim, C.J.; Bi, X.; Sokhansanj, S.; Melin, S. Determination of effective thermal conductivity and specific heat capacity of wood pellets. Fuel 2013, 103, 347–355. [Google Scholar] [CrossRef]
  35. Haseli, Y.; Van Oijen, J.A.; De Goey, L.P.H. Modeling biomass particle pyrolysis with temperature-dependent heat of reactions. J. Anal. Appl. Pyrolysis 2011, 90, 140–154. [Google Scholar] [CrossRef]
  36. Nurdiawati, A.; Zaini, I.N.; Amin, M.; Sasongko, D.; Aziz, M. Microalgae-based coproduction of ammonia and power employing chemical looping process. Chem. Eng. Res. Des. 2019, 146, 311–323. [Google Scholar] [CrossRef]
  37. Pinheiro Pires, A.P.; Arauzo, J.; Fonts, I.; Domine, M.E.; Fernández Arroyo, A.; Garcia-Perez, M.E.; Montoya, J.; Chejne, F.; Pfromm, P.; Garcia-Perez, M. Challenges and opportunities for bio-oil refining: A review. Energy Fuels 2019, 33, 4683–4720. [Google Scholar] [CrossRef]
  38. Li, B.; Lv, W.; Zhang, Q.; Wang, T.; Ma, L. Pyrolysis and catalytic upgrading of pine wood in a combination of auger reactor and fixed bed. Fuel 2014, 129, 61–67. [Google Scholar] [CrossRef]
  39. Ningbo, G.; Baoling, L.; Aimin, L.; Juanjuan, L. Continuous pyrolysis of pine sawdust at different pyrolysis temperatures and solid residence times. J. Anal. Appl. Pyrolysis 2015, 114, 155–162. [Google Scholar] [CrossRef]
  40. Goteti, A. Experimental Investigation and Systems Modeling of Fractional Catalytic Pyrolysis of Pine. Ph.D. Dissertation, Georgia Institute of Technology, Atlanta, GA, USA, 2010; p. 218. [Google Scholar]
  41. Voss, B.; Madsen, J.; Hansen, J.B.; Andersson, K.J. Topsøe Tar Reforming in Skive—The tough get going. Catal. Rev. 2016, 29, 7–14. [Google Scholar]
  42. Kraussler, M.; Binder, M.; Hofbauer, H. 2250-H Long Term Operation of a Water Gas Shift Pilot Plant Processing Tar-Rich Product Gas From an Industrial Scale Dual Fluidized Bed Biomass Steam Gasification Plant. Int. J. Hydrogen Energy 2016, 41, 6247–6258. [Google Scholar] [CrossRef]
  43. Yao, J.; Kraussler, M.; Benedikt, F.; Hofbauer, H. Techno-economic assessment of hydrogen production based on dual fluidized bed biomass steam gasification, biogas steam reforming, and alkaline water electrolysis processes. Energy Convers. Manag. 2017, 145, 278–292. [Google Scholar] [CrossRef]
  44. Nugrahany, F. Modelling of Biomass Pyrolysis with Ex-situ Catalytic Upgrading for Bio-crude Production. Master’s Thesis, KTH Royal Institute of Technology, Stockholm, Sweden, 2018. [Google Scholar]
  45. Yang, H.; Kudo, S.; Kuo, H.P.; Norinaga, K.; Mori, A.; Mašek, O.; Hayashi, J.I. Estimation of enthalpy of bio-oil vapor and heat required for pyrolysis of biomass. Energy Fuels 2013, 27, 2675–2686. [Google Scholar] [CrossRef]
  46. Storaenso Köp Pellets i Bulk. Available online: https://www.storaenso.com/sv-se/products/pellets/pellets-for-residential-heating/buy-pellets-bulk?gclid=Cj0KCQjw-O35BRDVARIsAJU5mQWPi4PVUc_o2b5eQWinuRbbl7q-kiDdlMGuMGIG_g3Yo9QKJ-WOSkoaAndNEALw_wcB (accessed on 29 November 2020).
  47. Avfall Sverige. Swedish Waste Management 2018. 2018. Available online: https://www.avfallsverige.se/fileadmin/user_upload/Publikationer/Avfallshantering_2018_EN.pdf (accessed on 29 November 2020).
  48. Glenk, G.; Reichelstein, S. Economics of converting renewable power to hydrogen. Nat. Energy 2019, 4, 216–222. [Google Scholar] [CrossRef]
  49. BOC Industrial Gases Price List (ex. VAT). 1 January 2020. Available online: https://www.boconline.co.uk/en/images/industrial-gases-price-list-uk_tcm410-512096.pdf (accessed on 29 November 2020).
  50. Sönnichsen, N. Prices of Electricity for Industry in Sweden from 1996 to 2018. Available online: https://www.statista.com/statistics/596262/electricity-industry-price-sweden/ (accessed on 29 November 2020).
  51. Prisjakt Grillkol—Grilltillbehör. Available online: https://www.prisjakt.nu/c/grilltillbehor?98091=31484 (accessed on 5 January 2021).
  52. IEA Coal 2020 Analysis and Forecast to 2025. Available online: https://www.iea.org/reports/coal-2020/prices-and-costs (accessed on 5 January 2021).
  53. Setra Pyrocell. Available online: http://www.setragroup.com/en/pyrocell/ (accessed on 5 January 2021).
  54. Jarboe, L.R.; Wen, Z.; Choi, D.; Brown, R.C. Hybrid thermochemical processing: Fermentation of pyrolysis-derived bio-oil. Appl. Microbiol. Biotechnol. 2011, 91, 1519–1523. [Google Scholar] [CrossRef] [Green Version]
Figure 1. Scheme 1: production of H2 and biocarbon.
Processes 09 00415 g001
Figure 2. Scheme 2: production of H2, bio-oil, and biocarbon.
Processes 09 00415 g002
Figure 3. Envigas pilot plant process for biocarbon production: (1) biomass storage, (2) dosing screw, (3) electrically heated pyrolysis screw reactor, (4) char cooling screw, (5) emergency flare, (6) condenser, (7) off-gas burner, (8) exhaust pipe.
Processes 09 00415 g003
Figure 4. Flowsheet diagram of the steam reforming process in (a) Scheme 1 and (b) Scheme 2.
Processes 09 00415 g004
Figure 5. Flowsheet diagram of the WGS and PSA processes.
Processes 09 00415 g005
Figure 6. Mass flow diagrams for production scheme of (a) biocarbon and H2 (scheme 1); and (b) biocarbon, bio-oil, and H2 with condenser temperature of 50 °C (scheme 2).
Processes 09 00415 g006
Figure 7. Energy flow diagrams for production scheme of (a) biocarbon and H2 (Scheme 1); and (b) biocarbon, bio-oil, and H2 with condenser temperature of 50 °C (Scheme 2).
Processes 09 00415 g007
Figure 8. The yield of bio-oil, H2, and CO2 obtained from Scheme 2 production system at different bio-oil condenser temperatures.
Processes 09 00415 g008
Figure 9. LHV and water content of bio-oil obtained from different condenser temperatures.
Processes 09 00415 g009
Figure 10. H2 ( η H 2 ) and total thermal ( η t h ) efficiencies of Scheme 2 production system at different temperatures of the bio-oil condenser.
Processes 09 00415 g010
Table 1. Biomass pyrolysis with in-line reforming of pyrolysis vapor for H2 production.
Configuration and Operating ParametersPyrolysis
Reactor/Steam
Reforming Reactor
CatalystH2 Yield (wt.%)H2 Concentration (vol.%)CO Concentration after Reformer (vol.%)Liquid Yield (wt.%)Ref.
Wood sawdust, Pyrolysis (500 °C) + steam reformer (600 °C, 20 gcat min/gvolatile, S/B = 4 (S/C~8))Spouted bed/fluidized bed,
Lab-scale
Ni commercial1166
(94% of stoic)
30
(100% conversion) 1
[21]
Wood sawdust, Pyrolysis (500 °C) + steam reformer (800 °C, S/B ~4)Fixed bed/fixed bed,
Lab-scale
Ni/CaAlOx2.845441–5[22]
Wood pellet,
Pyrolysis (500 °C) + steam reformer (760 °C, S/B = NA)
Screw reactor/fixed bed,
Bench-scale
NiO/Al2O3 443027[23]
Wood chip,
Pyrolysis (600 °C) + steam reformer (650 °C, S/C=3)
Fluidized bed/fixed bed, Lab-scaleNi/Al2O3,
Ni-brown coal char
Approx. 1060Approx. 10<1[24]
Olive tree cuttings, Pyrolysis (750 °C) + catalytic reactor (900 °C, no additional steam)Non-stirred batch/fixed bed, Lab-scaleBiochar + Ni/Al2O3-CeO2 17.647.433.8[19,20]
1 Catalyst deactivation occurs after 1 h of operation, and the conversion drops to ~50% after 1.5 hof operation [25]. S/B = steam to biomass ratio by weight, S/C = molar ratio of steam to carbon in volatiles fed into the reformer.
Table 2. Properties of raw biomass and char.
BiomassChar
Moisturewt.%, as *6.6<2
Ashwt.%, as0.241.2
Cwt.%, daf **51.7 ± 2.6
Hwt.%, daf6.18 ± 0.62
O #wt.%, daf42.12 ± 2.66
Cwt.%, waf 95.24 ± 4.76
Hwt.%, waf 1.32 ± 0.13
O #wt.%, waf 3.44 ± 4.76
LHVMJ/kg, af19.1 ± 1.034.5 ± 1.7
Heat of formation MJ/kg−5.2741.688
Heat capacityJ/kgK1190 [34]1300 [35]
# calculated from 100-C-H, * as = as received, ** daf = dry ash-free basis, waf = wet ash-free basis, Calculated based on LHV.
Table 3. Pyrolysis liquid compositions used in this work.
CompoundsRef. [37]Values Used in This Study (wt.% of Bio-Oil)
Water(19–30 wt.%)35
C2-C4 light molecules(10–22 wt.%)
Acetic acid2–62
Hydroxyacetaldehyde1–147
Hydroxyacetone (Acetol)5–97
Formic acid<1
2-Butenoic acid 2
Monofurans(1 wt.%)
Furfural0.1–0.21
2(5H)-Furanone0.2–0.8
Monophenols(1–5 wt.%)
Phenol0.1
Guaiacol0.2–0.5
Cresol0.1–0.41
Syringol0.4
Isoeugenol0.1–0.21
Anhydrosugar(10–20 wt.%)
LevoglucosanNA10
CellobiosanNA
Maltose 10
Pyrolytic lignin(15–27 wt.%)
Hybrid oligomers(11–18 wt.%)
Humins(3–7 wt.%)
High molecular weight lignin and hybrid oligomers (HMWLIG) 24
Total 100
Table 4. Properties of the high molecular weight lignin-derived compounds (HMWLIG).
High MW Lignin-Derived Compoundwt.%Formula (mol)
C67.120
H11.038.935
O21.94.913
LHV *MJ/kg33.25
Heat of formation MJ/kg−6.72
Heat capacity J/kgK1970 [40]
* Calculate using Dulong formula for HHV; Calculate from LHV. From the reference of bio-oil with 10 wt.% moisture, calculate for the dry basis.
Table 5. Pyrolysis gas composition used in the simulation.
Gas Compositionswt.%
H21.2
CO45.00
CO235.00
CH412.00
C2H62.00
C3H84.80
Table 6. Summary of blocks and streams used in the Aspen Plus model.
AbbreviationsType of BlockFunction
Blocks
COOL1HeaterSyngas cooling before being fed to the WGS reactor.
COOL2HeaterCooling of the WGS reactor’s H2-rich gas products.
COOL3HeaterAn intra-cooling unit for the PSA module.
COMP1CompressorCompression of the H2-rich vapor to 1 MPa prior to the PSA module.
CONDFlash2Bio-oil condenser prior to the reforming process.
DECOMPRYieldConversion of the non-conventional bio-oil’s high molecular weight lignin fraction to its basic molecules (C, H2, and O2). Only for Scheme 1.
HX1HeatXRecovering the heat of reformer’s syngas to preheat the pyrolysis vapor stream.
HX2HeatXFurther heat recovery of reformer’s syngas to generate steam input for the reforming process.
HX3HeatXGeneration of WGS steam input by recovering the sensible heat of the WGS outlet stream.
MIX1MixerMixing of the condensed water and the make-up water.
REFORMRGibbsCatalytic steam reforming of pyrolysis vapor at 850 °C.
SEP1SepSeparation of pyrolysis vapor stream into a light fraction (conventional) and a high molecular weight lignin fraction (non-conventional).
SEP2SepCondenser to separate water from the H2-rich dry gases.
PSASepPSA module operated at 1 MPa and 50 °C.
PUMP1PumpWater supply to the steam reformer.
PUMP2PumpWater supply to the WGS reactor.
WGSRStoicWGS reactor operated at 425 °C and ambient pressure.
Streams
HMWLIG1 The non-conventional bio-oil’s high molecular weight lignin fraction.
HMWLIG2 Basic molecules of the non-conventional bio-oil’s high molecular weight lignin fraction.
H2 Final H2 product from the PSA module.
H2O-COND Condensed water separated from the WGS reactor product.
H2O-MAKE Make-up water needed for the co-production system.
H2O-REF1 Water supply for the reforming process.
H2O-REF2 Pumped water supply for the reforming process.
H2O-REF3 Steam input for the reforming process.
H2O-SPLY Water supply for the entire co-production system.
H2O-WGS1 Water supply for the WGS reactor.
H2O-WGS2 Pumped water supply for the WGS reactor.
H2O-WGS3 Steam input for the WGS reactor.
LIGHT Separated light fraction of the pyrolysis vapor. Contains all the uncondensed gases and bio-oil compounds except the high molecular weight lignin fraction.
PYRO1 Pyrolysis vapor produced from the biomass pyrolysis. The content of this stream is determined based on the experimental and calculation results.
PYRO2 In Scheme 1: Preheated pyrolysis vapor going into the reformer.In Scheme 2: Uncondensed pyrolysis vapor going into the heat exchanger.
PYRO3 Preheated pyrolysis vapor going into the reformer. Only in Scheme 2.
REST Contains of mostly CO2 with minor fraction of CO and CH4.
VP1 High-temperature syngas (850 °C) produced from the reformer. The stream consists of H2, CO, CO2, and CH4.
VP2 Cooled syngas after heat exchanger “HX1”.
VP3 Cooled syngas after heat exchanger “HX2”.
VP4 Syngas input for the WGS reactor.
VP5 H2-rich gases produced by the WGS reactor.
VP6 Cooled H2-rich gases.
VP7 Cooled H2-rich gases.
VP8 Dry H2-rich gases.
VP9 Compressed dry H2-rich gases.
VP10 Dry H2-rich gases input for PSA module.
Table 7. Product yields and efficiencies of Schemes 1 and 2.
ParametersScheme 1Scheme 2 *
H2 yield (wt.% dry biomass)10.04.7
CO2 yield (wt.% dry biomass)101.153.6
Bio-oil yield (wt.% dry biomass)-46.0
η H 2 (%)47.122.9
η b i o o i l (%)-23.1
η t h (%)79.079.0
* temperature of the bio-oil condenser at 50 °C.
Table 8. Product yields and efficiencies of Scheme 2 with different moisture contents of biomass and bio-oil condenser temperature of 50 °C.
ParametersMoisture Content of Biomass (wt.%)
714
H2 yield (wt.% dry biomass)4.74.7
CO2 yield (wt.% dry biomass)53.653.7
H2 yield (wt.% wet biomass)4.44.0
CO2 yield (wt.% wet biomass)50.046.1
η b i o o i l (%)23.121.2
η H 2 (%)22.921.0
η t h (%)79.072.6
Table 9. The assumption for the OPEX calculation.
ParameterAssumptionReferences
Duration of operation8000 h/yr
Raw materials
Biomass pellet6.6 wt.% moisture content
3 SEK/kgRetail price [46]
Reformer catalystMonolith catalyst[41]
No make-up catalyst required
WGS catalyst0.215 SEK/kg[27]
0.02 wt.% hourly make-up
Solid disposal3.9 SEK/kg[47]
(spent catalyst)
Products
H233 SEK/kg[48]
Biocarbon8 SEK/kgEnvigas
Bio-oil crude9 SEK/kg dry oilEnvigas
CO211.1Retail price [49]
Utilities
Electricity0.7 SEK/kWh[50]
Water9.75 SEK/m3
Personnel
Plant manager (1 person)70,000 SEK/person/month
Plant engineer (1 person)50,000 SEK/person/month
Shift operators (12 person)30,000 SEK/person/month
Overheads90% of total salaries
Table 10. Summary of the main process parameters for OPEX calculation.
ParameterCase 1Case 2Case 3
Pyrolysis
Biomass pellet (kg/h)100010001000
Reactor heating (kW) 420.3 420.3 420.3
Bio-oil condenser
Recirculation pump (kW)-7.5 7.5
Reformer
Reactor heating (kW)699.70553.80464.30
Water supply (kg/h)287.60350.57202.88
WGS reactor
Make-up catalyst (kg/h)0.710.370.47
Water supply (kg/h)0.000.000.00
Solid disposal (kg/h)0.710.370.47
PSA
Compressor and utilities (kW)178.5086.40111.10
Products yields
Biocarbon (kg/h)217.20217.20217.20
H2 (kg/h)93.5543.8357.00
Bio-oil (kg/h)0.00429.69178.15
CO2 (kg/h)944.39500.32628.18
Bio-oil price
Water content in bio-oil (wt.%) 41.70%0.64%
Bio-oil price based on water content-5.258.94
Table 11. Annual operation costs for the co-production process of biocarbon, hydrogen, and bio-oil.
ParameterCase 1Case 2Case 3
Variable operating cost (MSEK/year)
Pyrolysis
Biomass pellet24.0024.0024.00
Reactor heating2.352.352.35
Bio-oil condenser
Recirculation pump-0.040.04
Reformer
Reactor heating3.923.102.60
Water supply0.020.030.02
WGS reactor
Make-up catalyst0.0010.0010.001
Solid disposal0.0220.0110.015
PSA
Compressor and utilities1.000.480.62
Fixed operating cost (MSEK/year)
Salary5.765.765.76
Overhead5.1845.1845.184
Products values (MSEK/year)
Biocarbon13.9013.9013.90
H224.7011.5715.05
Bio-oil0.0017.1912.83
CO283.8644.4355.78
Total OPEX (MSEK/year)42.2640.9640.59
Total revenue (MSEK/year)38.6042.6641.78
Total revenue including CO2 (MSEK/year)122.4687.0997.56
Gross production cost 1 (SEK/kg-biomass)5.285.125.07
Loss/Gain based on OPEX 2 (SEK/kg-biomass)−0.460.320.14
Loss/Gain based on OPEX2 with CO2
(SEK/kg-biomass)
23.8513.9716.92
Minimum biocarbon selling price 3 (SEK/kg)10.11
Minimum bio-oil selling price 4 (SEK/kg) 3.445.59
1 Gross production cost = Total OPEX/kg-biomass fed. 2 Loss/Gain based on OPEX = (Total revenue—Total OPEX)/kg-biomass fed. 3 Not including capital investment. 4 Not including capital investment. In addition, using the same biocarbon price as case 1.
Publisher’s Note: MDPI stays neutral with regard to jurisdictional claims in published maps and institutional affiliations.

