Article

Thermal Control Processes by Deterministic and Network-Based Models for Energy Use and Control Accuracy in a Building Space

School of Architecture and Design Convergence, Hankyong National University, Anseong 17579, Korea
Processes 2021, 9(2), 385; https://doi.org/10.3390/pr9020385
Submission received: 11 January 2021 / Revised: 11 February 2021 / Accepted: 15 February 2021 / Published: 20 February 2021
(This article belongs to the Special Issue Various Sustainable Energy Technologies in Buildings)

Abstract

:
Various control approaches for building thermal controls have been studied to improve the energy use which determines a large part of the spatial thermal quality. This research compares the performance of deterministic models and a network-based model to examine the aspects of both energy consumption and thermal comfort. The single-switch deterministic model immediately responds to indoor thermal conditions, but the network-based model sends better-fit signals derived from learned data reflecting seven different climate conditions. As a result, the network-based model improves the thermal comfort level by about 6.1% to 9.4% and the energy efficiency by about 1.8% to 39.5% as compared to a thermostat and a fuzzy model. In the case of a specific weather condition, it can be confirmed that the process of finding efficient control values based on the network-based learning algorithm is more efficient than the conventional deterministic models.

1. Introduction

1.1. Building Control Systems

For the performance improvement of heating, ventilating, and air-conditioning (HVAC) systems, various control methods have been studied in terms of mass, pressure, and speed of air and fluid in energy supply systems. In order to precisely control them, several mathematical and statistical approaches have tested their specific operating schedules and tuning rules to optimize air and fuel use into boilers, generators, turbines, air handling units, and even distribution networks [1,2]. Several statistical approaches were able to produce effective results if they dealt with limited variables in their control processes. However, if the number of variables that need to be addressed is over a certain level, the time and manpower to calculate the results will increase exponentially. Thus, as with building new algorithms, it has been consistently studied how to efficiently complement existing algorithms through the calibration of tuning rules [3,4]. Complementing the control algorithms has successfully helped to improve the conventional systems through the process of analyzing numerical data to adjust variables and revise internal algorithms. The method has been used in mechanical control systems to optimize the amount of fuel and supply air reflecting regression analyses from experimental and simulated studies [5,6]. The fast growth of computing devices has helped several research frameworks to use data-driven methods that inevitably result in complex calculations. A thermostat which consists of two different pieces of metal bolted together to form a bi-metal strip operates as a bridge in the electrical circuit connected to the entire system. It has been widely used in the field of thermal control due to the economic feasibility of manufacturing, installation, and maintenance costs. However, this method is a form of operating mechanical switch that physically responds to external conditions, and there is a limit to its use in the field of sensitive controls based on the huge amount of data [7,8].

1.2. Thermal Control Methods

The fuzzy inference system (FIS) and the artificial neural network (ANN) have been utilized to efficiently manage data handled in several control processes. They have optimized systems’ complex control strategies in the areas that require specific deterministic algorithms in some ambiguous situations and network-based approaches in hidden relationships [9,10]. The system performance from several models mixing the thermal dynamics and the FIS models was frequently compared to define the efficiency of fuel usage in boilers. Plant-level control systems have been preferred due to the intuitive and immediate economic benefits by the reduction of fuel costs. With some systematic strategies of combining the statistical regression and the FIS models, parametric variations were examined to define the efficient control rules of fuel use in boiler systems [10,11]. Data-driven control approaches were developed to investigate fuel distribution for boiler or generation systems by using the FIS deterministic process. Some refined methods by genetic algorithms to combine the FIS and the ANN models were able to mitigate possible errors derived from sensitive controls for valves and dampers in the energy supply networks [12]. The control efficiency of genetic algorithms for fuzzy linguistic models and specific membership functions was compared to the conventional controls with stepwise tuning rules at the various types of buildings [13]. The linguistic models were able to deal with ambiguous situations which cannot be defined by fixed numbers. In particular, the models have provided quite effective solutions in a specific environmental situation where conventional approaches are difficult to find clear control and tuning rules [14]. Various advanced control methods of the combining fan and damper systems were investigated to reach the thermal demands of indoor environments using specific weather conditions. The fast improvement of computer technology has made the ANN algorithm possible to approach the various complex problems. Before using the ANN, they had not been solved due to the difficulty of explosive increases in calculations to be handled with every single increase in variables. Because of such advantages, the ANN algorithm has successfully assisted in solving the issues dealing with lighting, equipment, and envelopes. The components of the building system can impact on energy consumption, air quality, and gas emission requiring the analyses of possible hidden correlations derived from huge data. By combining conventional and advanced algorithms, several improved approaches were tested to respond to various demands at specific geometries or climate conditions for buying electricity, natural gas, and petrol, and their actual costs. While there are methodological approaches to find a best-fit model by testing various algorithms in one experimental model, there are methods to find optimized conditions for a specific control algorithm by applying various experimental and simulated results [15,16].

1.3. Thermal Comfort Index

Unlike the mechanical approaches in controlling energy-related factors, the improvement of the control accuracy is closely related to the indoor thermal comfort in buildings. Through various experimental studies, it has been confirmed that various factors influence the constancy of the indoor thermal comfort such as building geometry, system operation, and occupant behavior. In order to accurately measure the comfort levels, various methods to quantify the factors have been studied. As one of the intuitive ways, survey studies that investigate and analyze users’ responses have been conducted according to specific characteristics of location, climate condition, and building type and size. Although the level of objectification of indicators was not high enough, the approaches have continued to be made to objectify users’ subjective responses as effective comfort indicators in various directions [17,18,19]. In order to minimize the deterministic subjectivity in such studies, the predicted mean vote (PMV) was frequently utilized with mathematical models and functions to define realistic thermal sensation [20,21]. Although the conditions were limited in the office building with simplified geometries, a theoretical model was developed to save about 30% on energy use, improving indoor thermal comfort by 16% to 29% compared to existing controls [22]. For the improvement of building control models to satisfy thermal regulations, many different types of energy efficiency measures were studied in a building’s performance to improve of space types, building envelopes, and thermal systems associated with human factors [23]. Since the existing PMV index cannot be interpreted as a principle or best-fit model that perfectly reflects resident comfort, there have been several approaches such as genetic or adaptive algorithms for refining factors. In addition, data-driven genetic algorithms were adopted to refine the FIS or ANN models for making structures precise and realistic by use of co-simulation programs. In addition, by means of instantly connecting occupant responses, adaptive and predictive models for increasing thermal sensation satisfaction were investigated to define the performance of mathematical and mechanical control strategies for the reduction of energy consumption [24,25].

1.4. Problem Statement

The advantages of the recent technologies in terms of energy efficiency and control methodologies have been consistently studied to satisfy thermal requirements. However, there have not been comprehensive studies between the energy use and indoor thermal comfort, which are bound to influence each other [26]. Moreover, in-depth studies are not being conducted on whether conventional single-switch models such as thermostats are only at a disadvantage in all aspects in this comprehensive control area. Therefore, it is imperative to analyze the differences in the performance of each model associated with the control accuracy for both energy consumption and thermal comfort. The investigation is carried out on how efficient or inefficient the network-based model that has learned the specific climate data is compared to switch models that perform an immediate on and off. This direction can be an effective way to approach the comprehensive process that combines users’ thermal satisfaction and the building’s physical performance.

2. Methodology

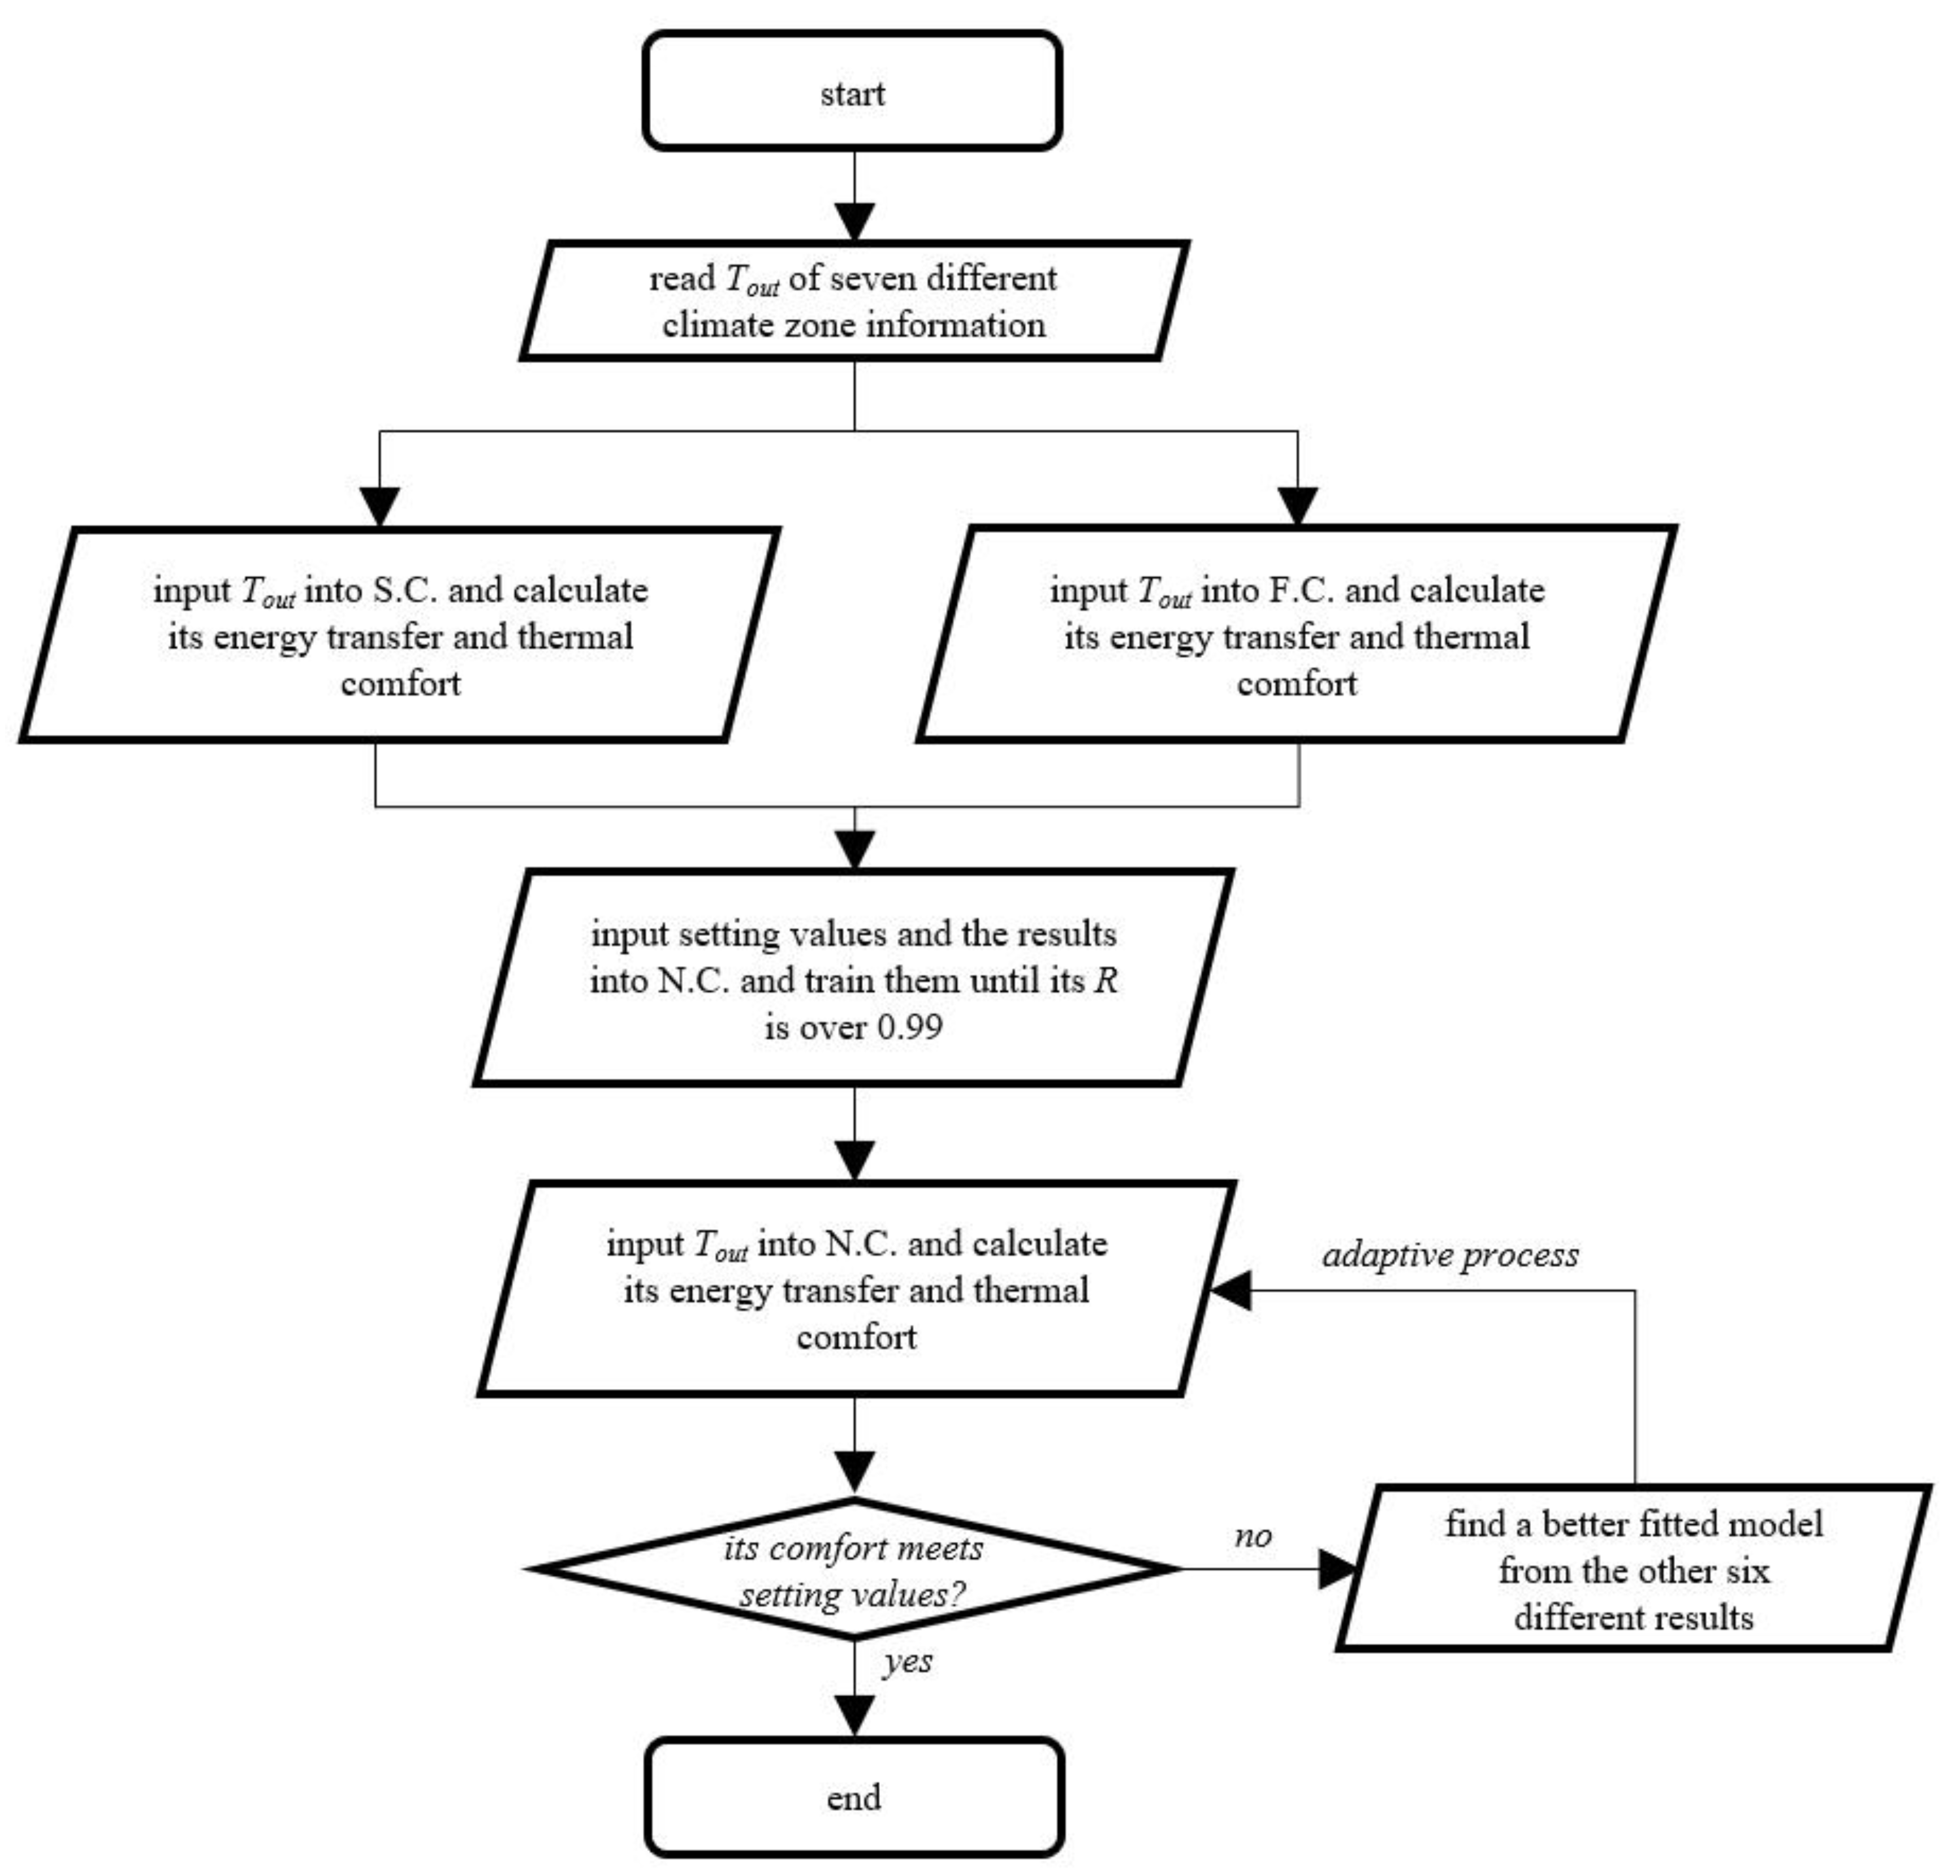
2.1. Simulation Process

As indicated in Figure 1, the simulation process utilized seven outdoor temperature conditions from weather data of the US Department of Energy, Washington D.C. such as hot-humid, hot-dry, mixed-dry, cold, very-cold, and marine. Based on the energy transfer between indoor and outdoor, six thermal factors were used to calculate thermal comfort levels such as dry-bulb temperature, mean radiant temperature, relative humidity, external work rate, metabolic rate, and occupant clothing insulation. For the deterministic models, the single-switch controller (SC) and the fuzzy controller (FC) were used, and for the network-based controller (NC), the ANN algorithm was trained by using the results of the two different controllers as seven different Tout conditions. According to the results in association with the PMV setting values, an adaptive process worked to adjust its Tset.
The SC model adopted a typical thermostat dead-band setting as 1.0 °C threshold for each Tset for heating and cooling [27,28]. In the case of NC, a total of 70 different weather information points as seven climate zones were obtained from the website of the US Department of Energy, which stores the weather data used by simulation applications. In the cases that an optimized value for supply air conditions was not found in a trained model, the process used the other trained model in different Tout conditions to find a more appropriate value. For better performances of this simulation, there are some assumptions to reduce resources in this simulation: this room is an independent module equipped with one heating and cooling system with a dual duct work; the pressure variations of indoor air speed are neglected; the air leakage within a building’s duct systems and air flow in spaces are neglected. As indicated in Table 1 and Figure 2, simulation parameters including the climate condition of Shanghai, China from the International Weather for Energy Calculation (IWEC) data, were referred from design manuals and guidelines in building simulation studies. Then, some values were fixed like air speed as 0.1 m/s, external work rate as 0 W/m2, metabolic rate as 1.2 W/m2, and clothing insulation (clo) as 1.2 m2·K/W [29,30].
The control algorithms in the FC and the NC utilized the result values from membership functions using the temperature difference (E) between Tset and Troom, and the derivative of the temperature differences (ΔE). When given certain external conditions, the FC sent out an immediate result derived from the fuzzy membership functions, but the NC sent out the most appropriate signal after comparing the learning results of the weather condition including other six different weather conditions. A building space model was derived from an ongoing network model, and the weather data at April 28th in Shanghai, China was chosen for the investigation of mid-spring when air conditioning and heating occur at the same time [31,32].

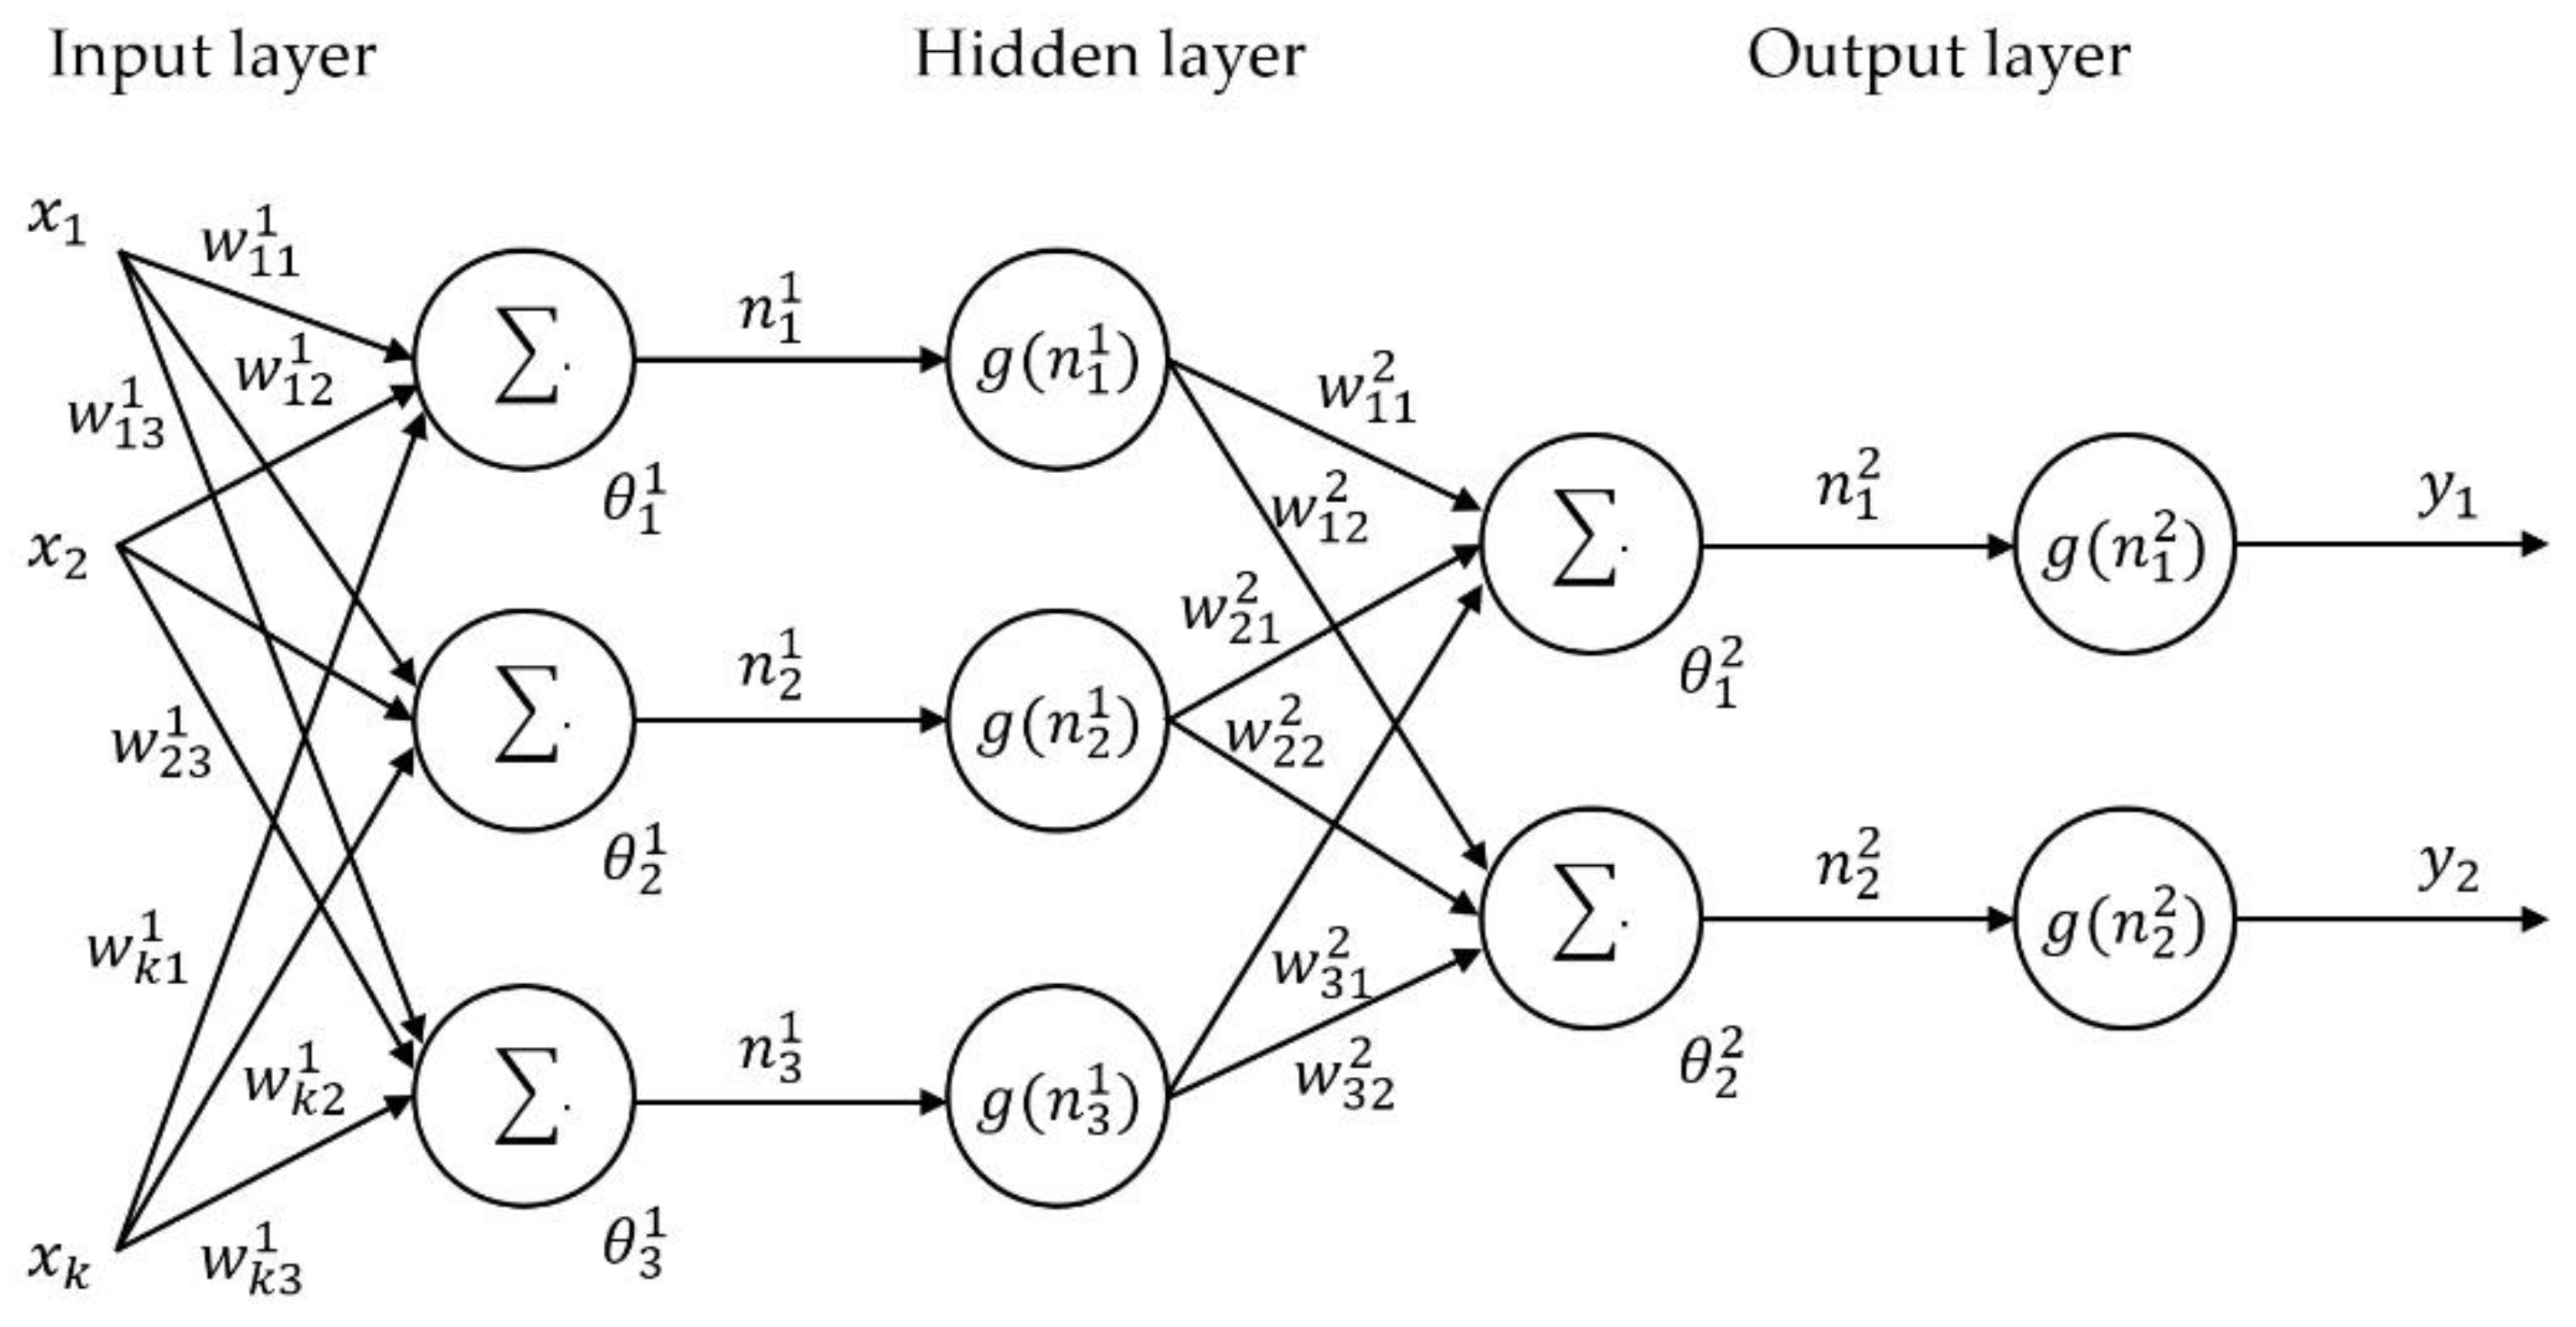
2.2. Thermal and Comfort Models

The energy transfer function of the building system is given as Equation (1). For the higher effectiveness of using simulation resources, this thermal model used some assumptions. This system does not work in association with the mass flow rate and enthalpy. The flow rate in the space, from the conservation of mass flow rate, is not changed. In addition, the thermal energy loss of this building space only occurs in the conduction through the solid walls and fenestrations.
d T r m d t = 1 m r o o m C v ( ( T r o o m T o u t 1 / ( h o u t A ) + D / ( k A ) + 1 / ( h o u t A ) ) + ( h t C p ( T h t T r o o m ) ) )
Commonly in several related studies, human comfort is quantified by the PMV. In addition, the predicted percentage of dissatisfied (PPD) is utilized to complement some weaknesses of the PMV. The functions are developed by the exponential of metabolic rate reflecting some major factors and the amount of thermal load as follows [33,34]. The numerical results are used without supplementing the existing PMV model or conducting surveys to validate the results.
P M V = 3.155 ( 0.303 e 0.114 M + 0.028 ) L
L = q m , h f c l h c ( T c l T a ) f c l h r ( T c l T r ) 156 ( W s k , r e q W a ) 0.42 ( q m , h 18.43 ) 0.00077 M ( 93.2 T a ) 2.78 M ( 0.0365 W a )
P P D = 100 95 e ( 0.03353 P M V 4 0.2179 P M V 2 )
where M is the metabolic rate, L is the thermal load, fcl is the ratio of clothed surface area to DuBois surface area (Acl/AD), hc is the convection heat transfer coefficient, Tcl is the average surface temperature of clothed body, Ta is the air temperature, hr is the radiative heat transfer coefficient, Tr is the mean radiant temperature, Wa is the air humidity ratio, and Wsk is the humidity ratio at the skin temperature.
As indicated, three different signals are sent to the system for thermal controls for energy consumption and indoor comfort. The SC is a typical system utilized in real buildings over the world, which is switched on and off by the initial setting for appropriate cooling and heating temperature. The FC is to calculate the optimized conditions and values of the supply air determined by the difference between setpoint and room temperature. Equations (5) and (6) explain two inputs wherein the temperature difference between the setpoint and the room temperature (E) is used for the calculation of a derivative of the temperature difference (ΔE) [35,36,37]:
E = T s e t T r o o m
Δ E = ( E n E n 1 ) Δ t
In the FC, for the amount of air and its temperature as two outputs, total five membership functions were utilized for each input in accordance with the setting values as 0% to 100% for mass and −10 °C to 10 °C for temperature. It was assumed that the range of controlling the amount of mass in the output variable was 0 (0%) to 1 (100%). The first layer, which consists of inputs 1 and 2, supplies the input values to the next layer. In the FIS, a triangle membership function is defined for a range of the outputs as the maximum equal to 1 and the minimum equal to 0. A detailed computational process for outputting in the fuzzy membership function can be found in several studies [35,36,37].
( x ) = t r i a n g l e ( x ; a i ,   b i ,   c i ) =   { x a i 0 a i x b i   ( x a i ) ( b i a i ) b i x c i   ( c i x ) ( c i b i ) c i x 0
Based on the above, the intersections of each expression of zero, low, medium, and large occurring at an interval were defined. When E and ΔE are estimated as 0.1 and −10, the model sends the signal for the indoor temperature as a very small change with positive (+) and a big change with negative (−), respectively. Next, it interprets the signals as zero for amount of air and low for air temperature. Then, the model converts the linguistic values into numbers as about 0% for the amount of air and about −1 °C for air temperature, respectively.
The NC using the ANN includes a large class of different inner structures, and the selections of a nonlinear mapping function x with a network. In function approximation, the neural network is the multilayer perception which consists of 2 inputs, 10 neurons in 1 hidden layer, and 1 output. Figure 3 displays a flow diagram in the neural network.
The inputs of x1,…xk to the neuron are multiplied by the weights wki. Then, they are summed up with the constant bias term of θi. By the process, the calculation result of ni is the input to the activation function g(nki) in Equation (8) [38].
n = i = 1 K x i ω i     θ
The NC utilizing the ANN model uses the two inputs of E and ΔE from each simulation output of the FIS with the threshold setting values from −1 to +1. The ten single nodes in the multilayer perception network are utilized for the hidden layers within the output and inputs.

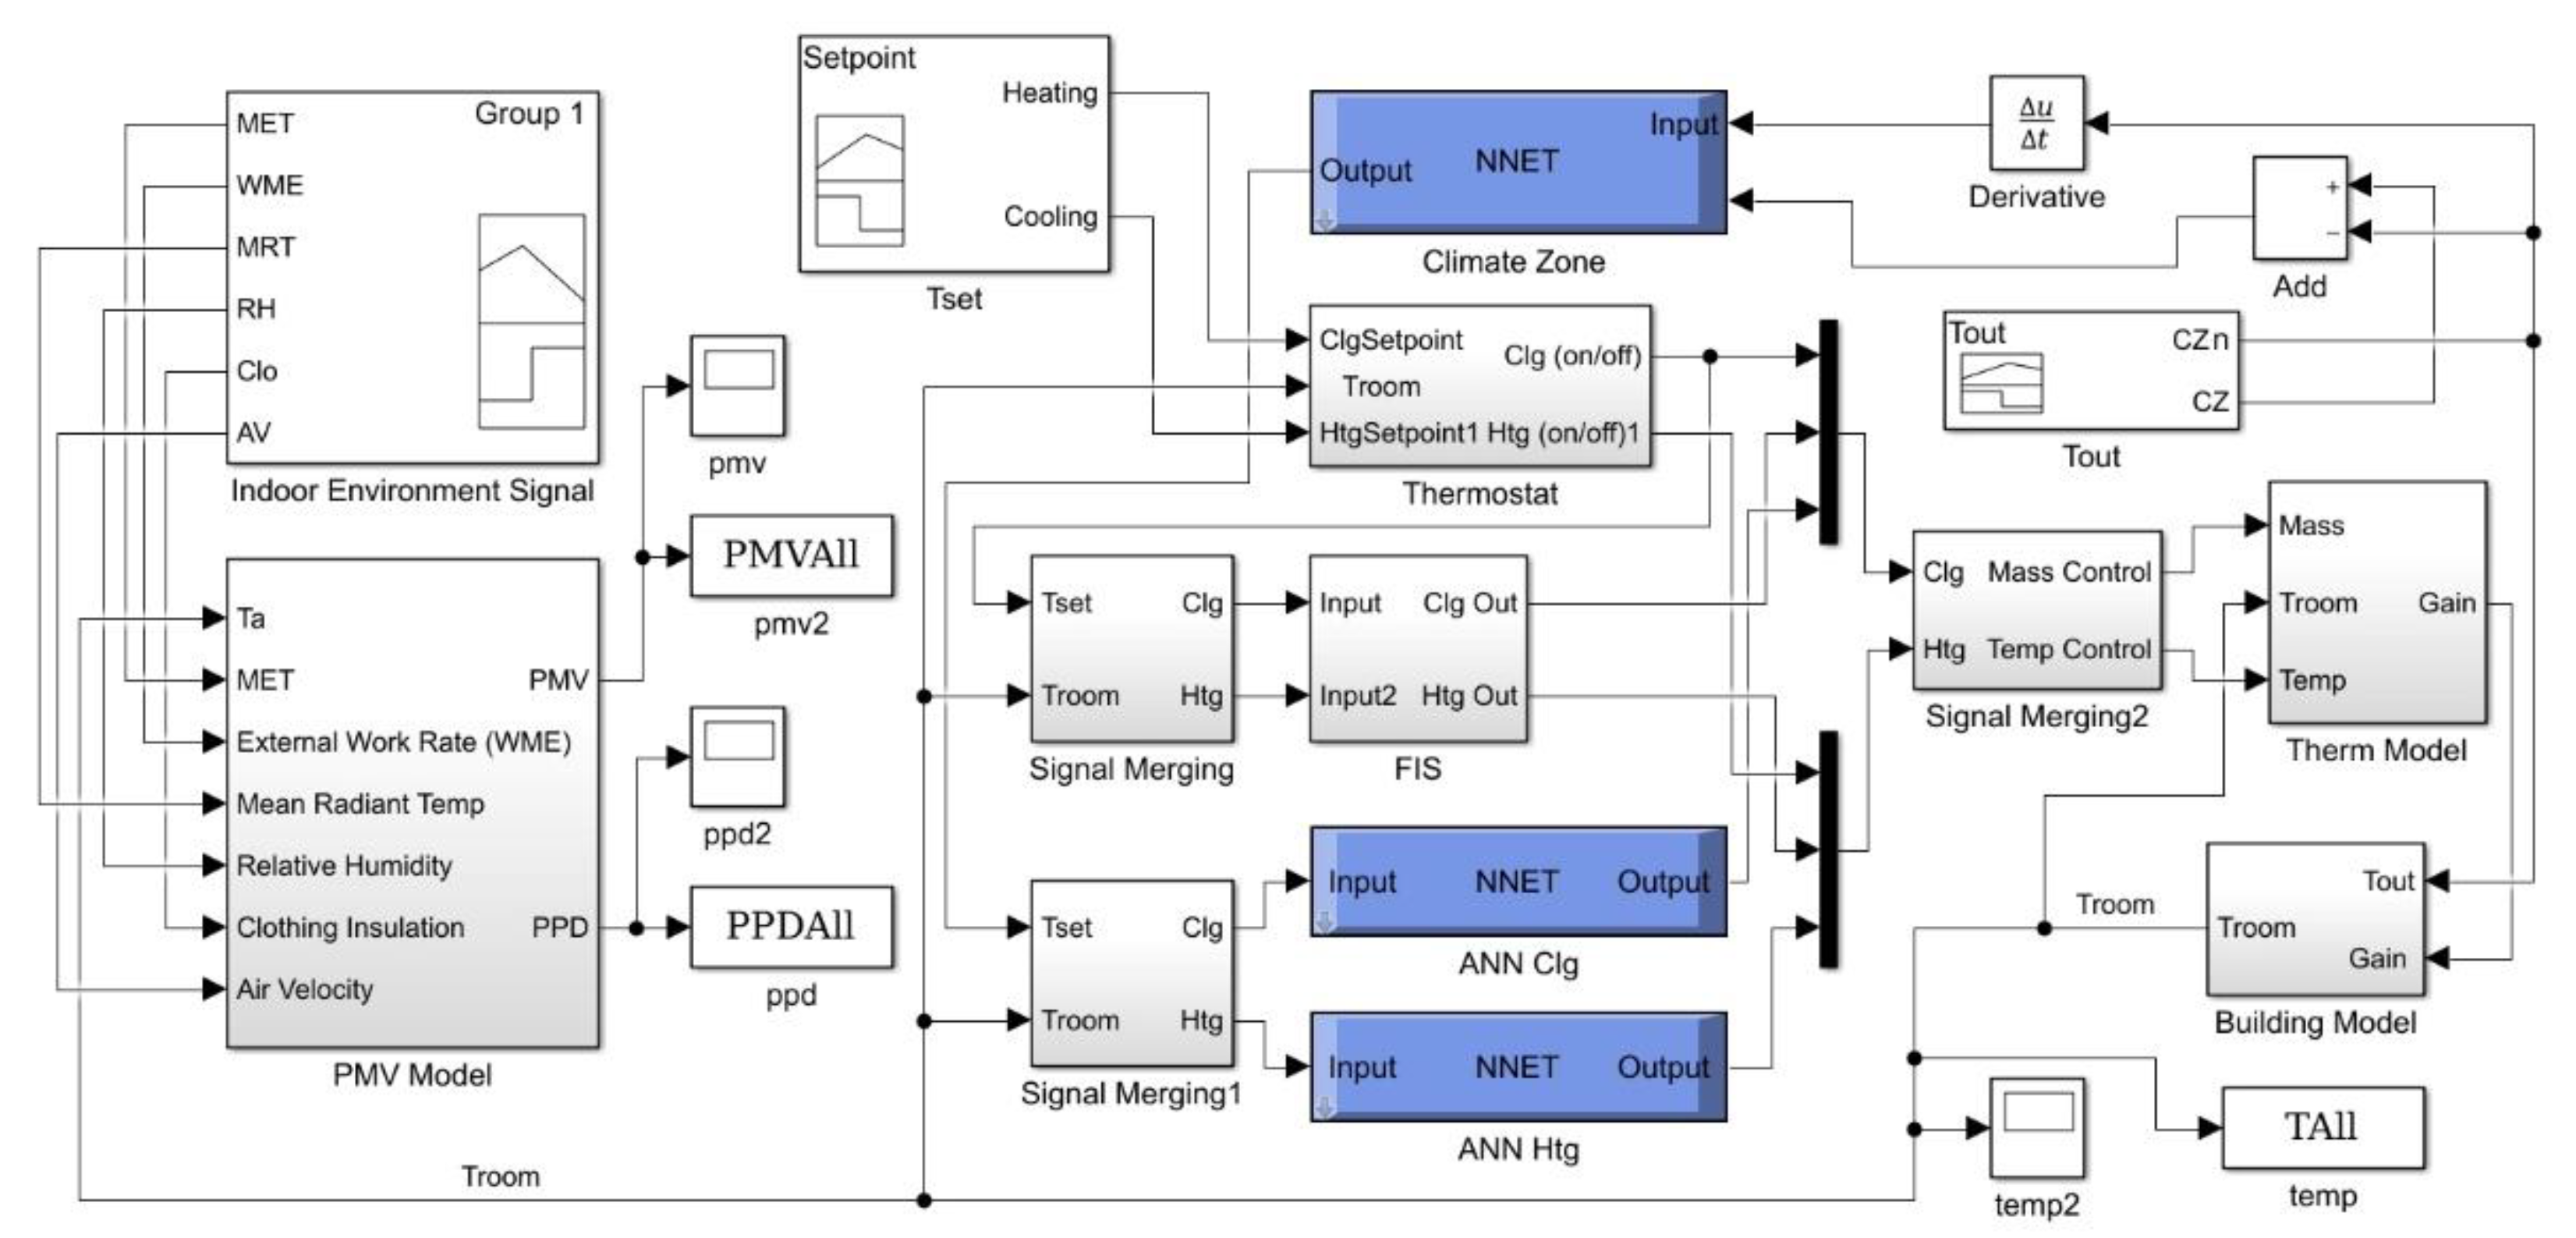
2.3. Simulation Block Model

In order to find the optimized control strategies, this research analyzes the control characteristics of the single switch and network-based models with a combined simulation model. There are three independent models (thermostat as SC, FIS as FC, and ANN as NC) working in the simulation process by a programming language application. After reading the indoor and outdoor thermal conditions, the SC sends the control signals directly into the thermal transfer model, and the FC separates the cooling and heating signals and optimizes them through the membership functions inside by the temperature difference (E) and the derivative of the differences (ΔE). By using the same E and ΔE, the NC separate the cooling and heating signals from the control models, which have learned the control patterns of the two models. When reading the outdoor condition, the other ANN model, which learned patterns of seven different climate conditions, finds the most similar pattern, and sends the values at that point. For better simulation performance, calculating the results of the PMV models through indoor conditions determined by these controlled signals was repeated within the simulation configuration to investigate the control patterns of a day, 28th April.
In brief, the simulation process is summarized as follows:
(1)
Create simulation modules of building, thermal, PMV, SC, and FC.
(2)
Using weather data from seven different climatic zones, the energy use and the comfort levels of the SC and FC modules are simulated.
(3)
With the results, the ANN module is learned and the NC module is built.
(4)
Different weather condition is inputted into the entire simulation model including the SC, FC, and NC modules.
(5)
With the results, their performances of energy use and thermal comfort are compared.
This simulation design scenario and process are visualized by a simulation block diagram in Figure 4. As a simulation configuration of the ANN training, a scale conjugate gradient algorithm, 1000 times iterations, and 7 epochs were utilized. From the simulation results, it was confirmed that the R2 values were calculated as much as 0.99668 for air mass and 0.99027 for air temperature as quite high values for the statistical validation.

3. Results and Discussions

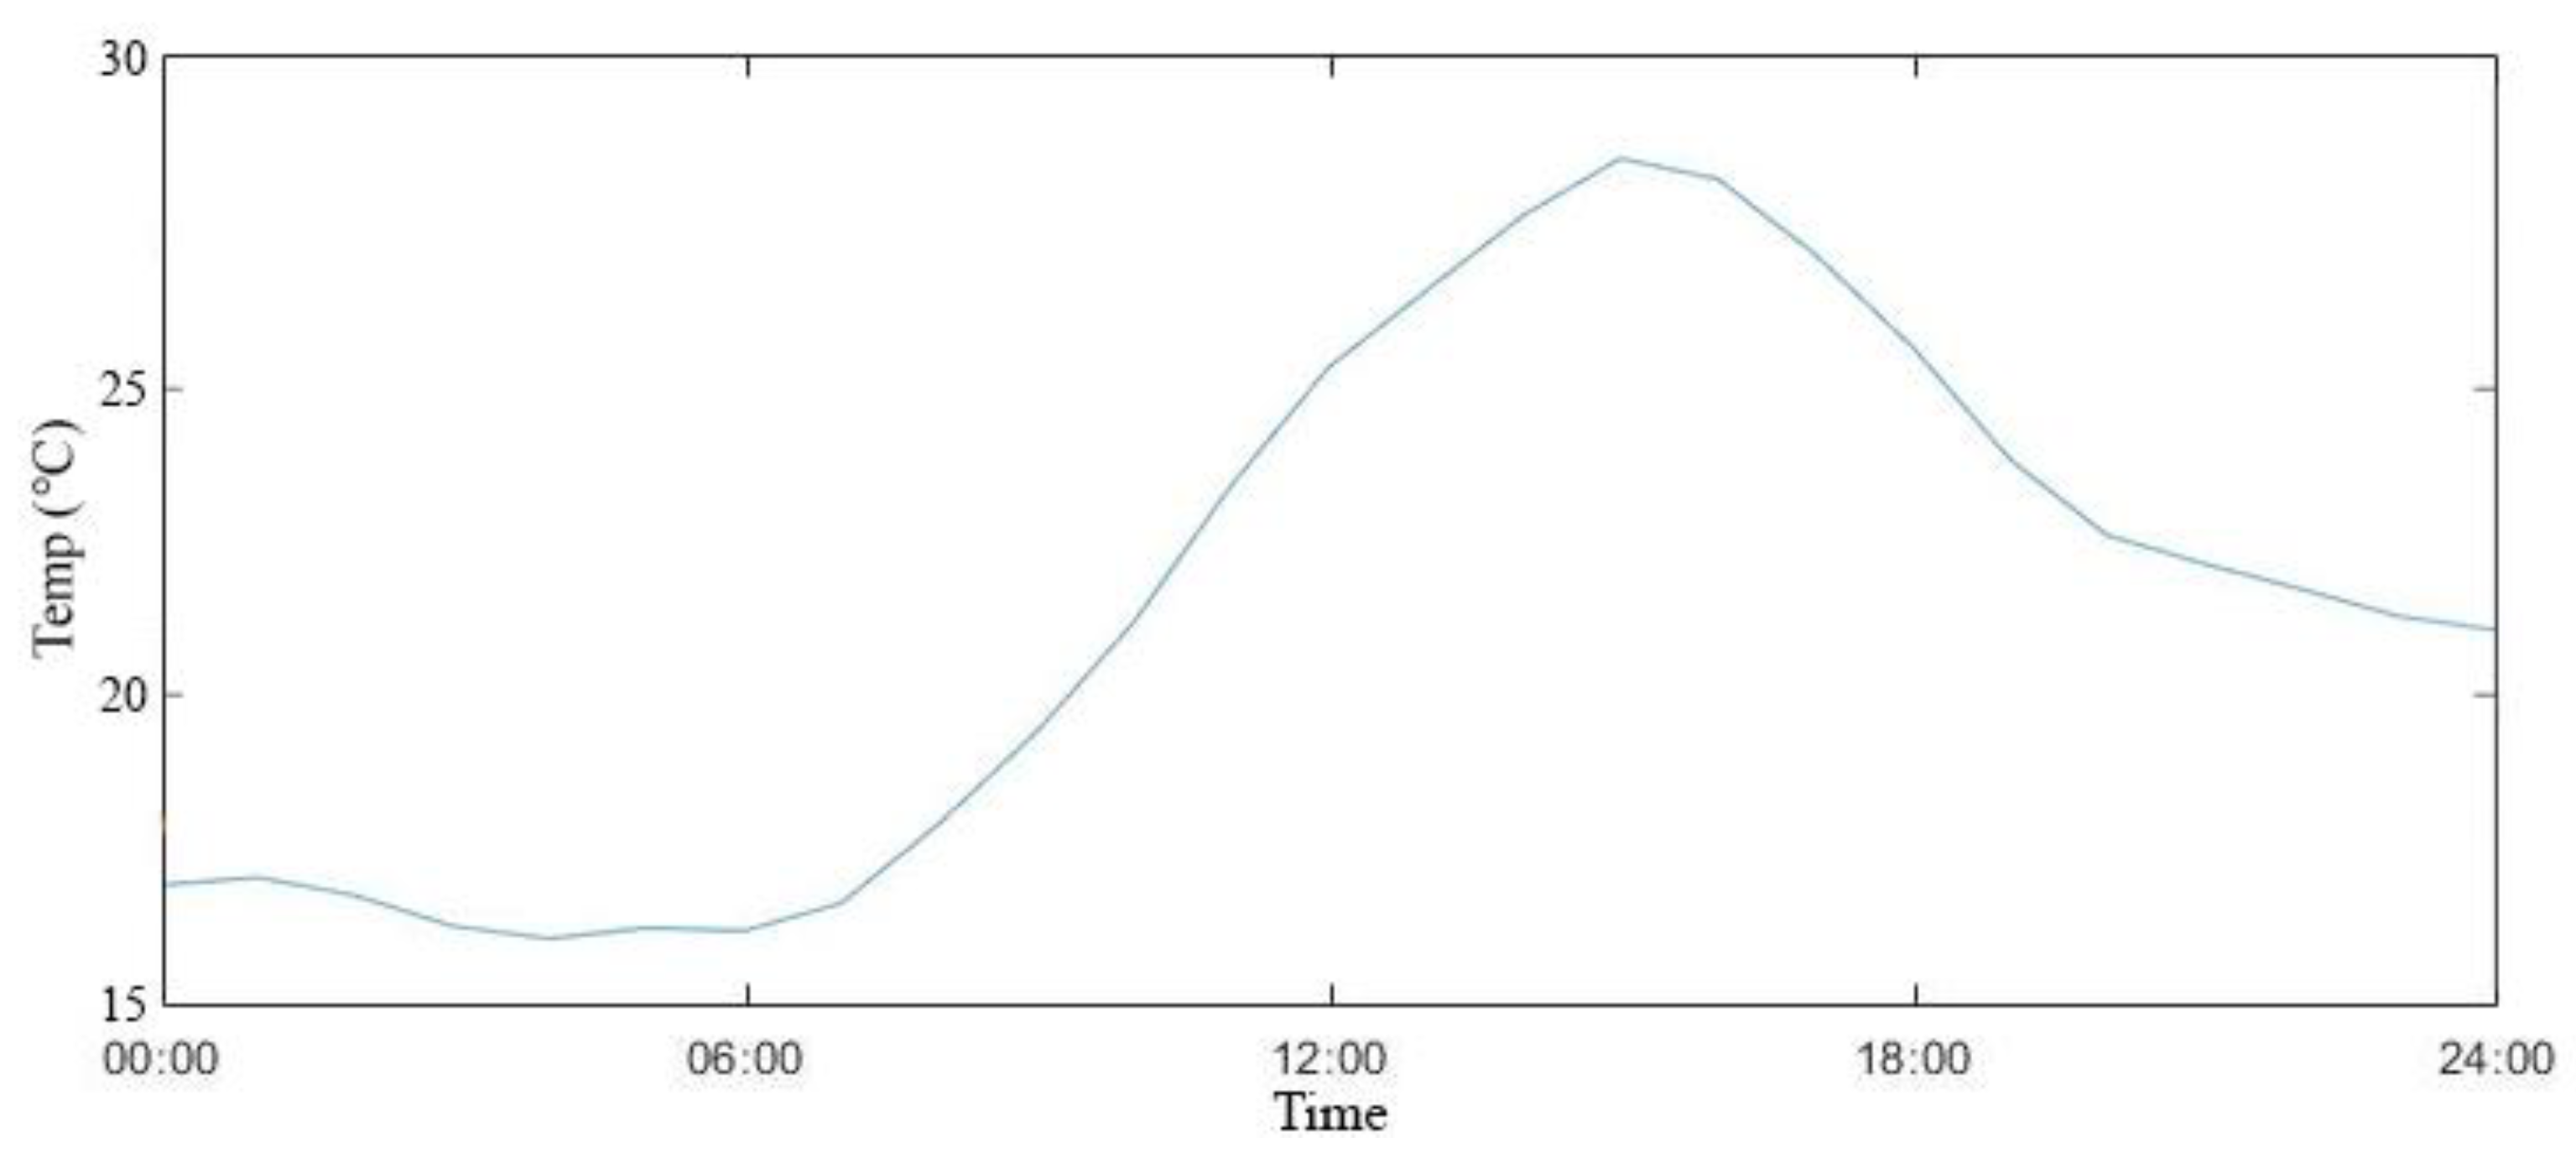
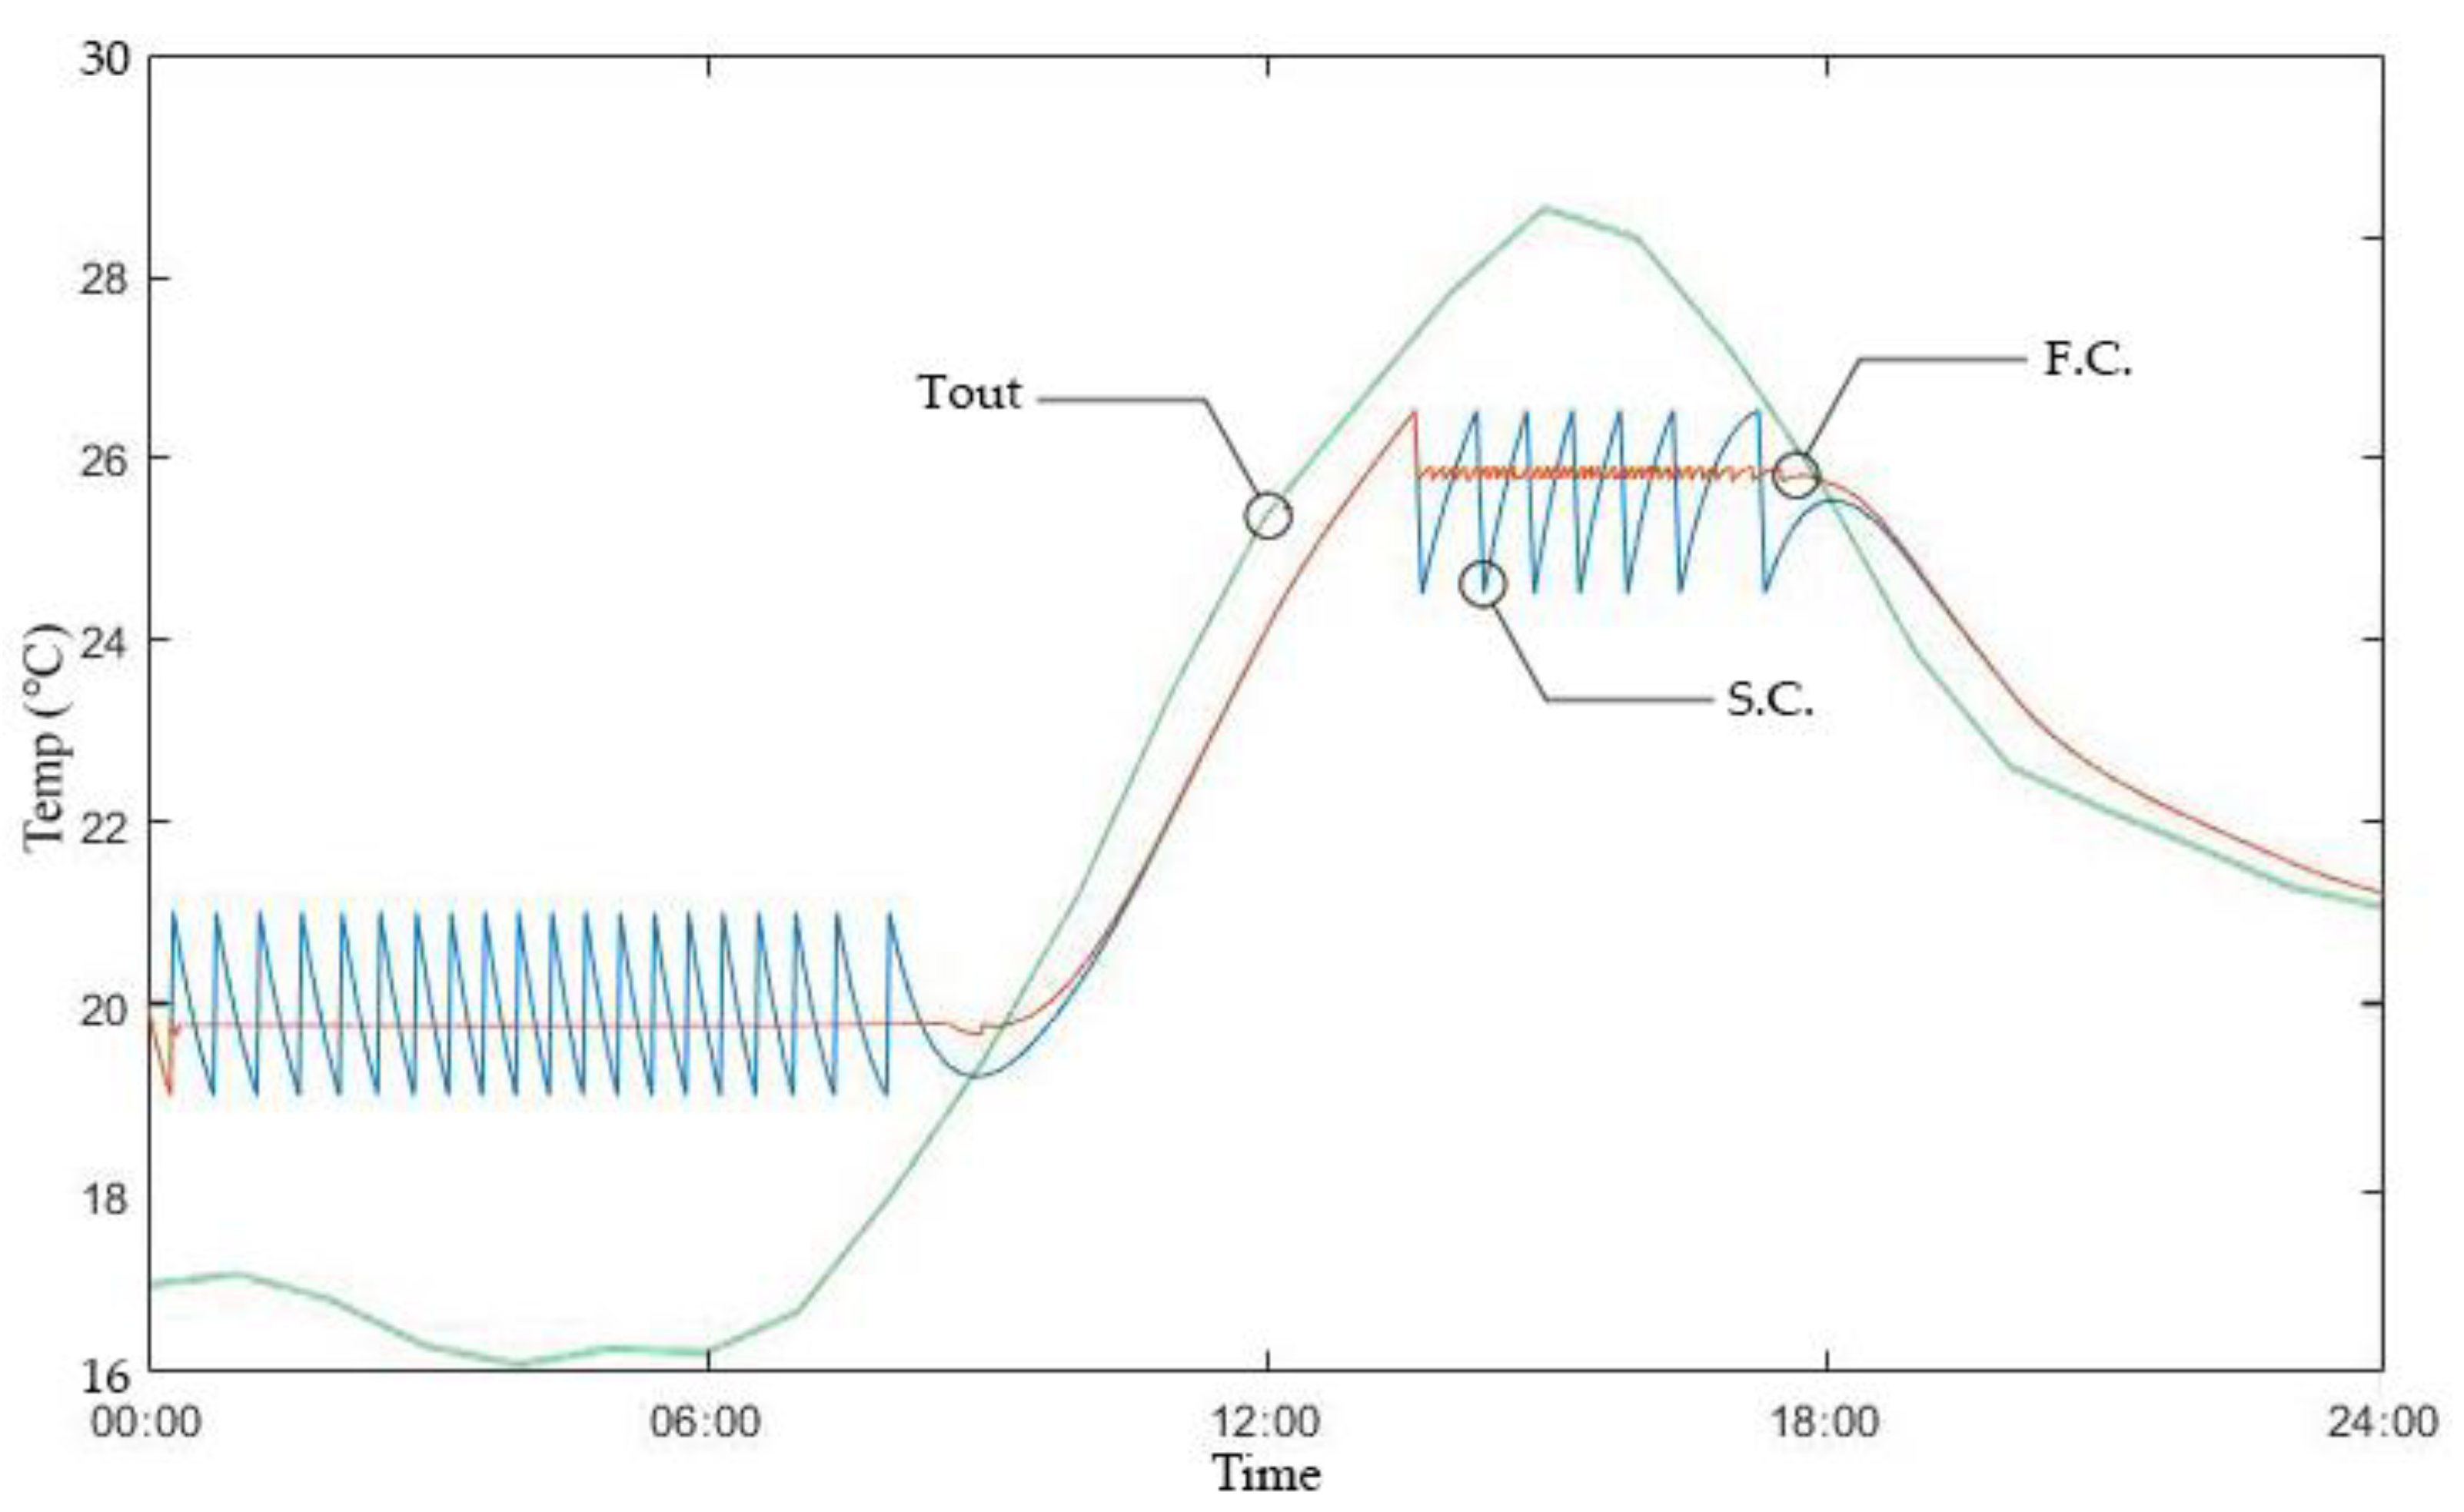
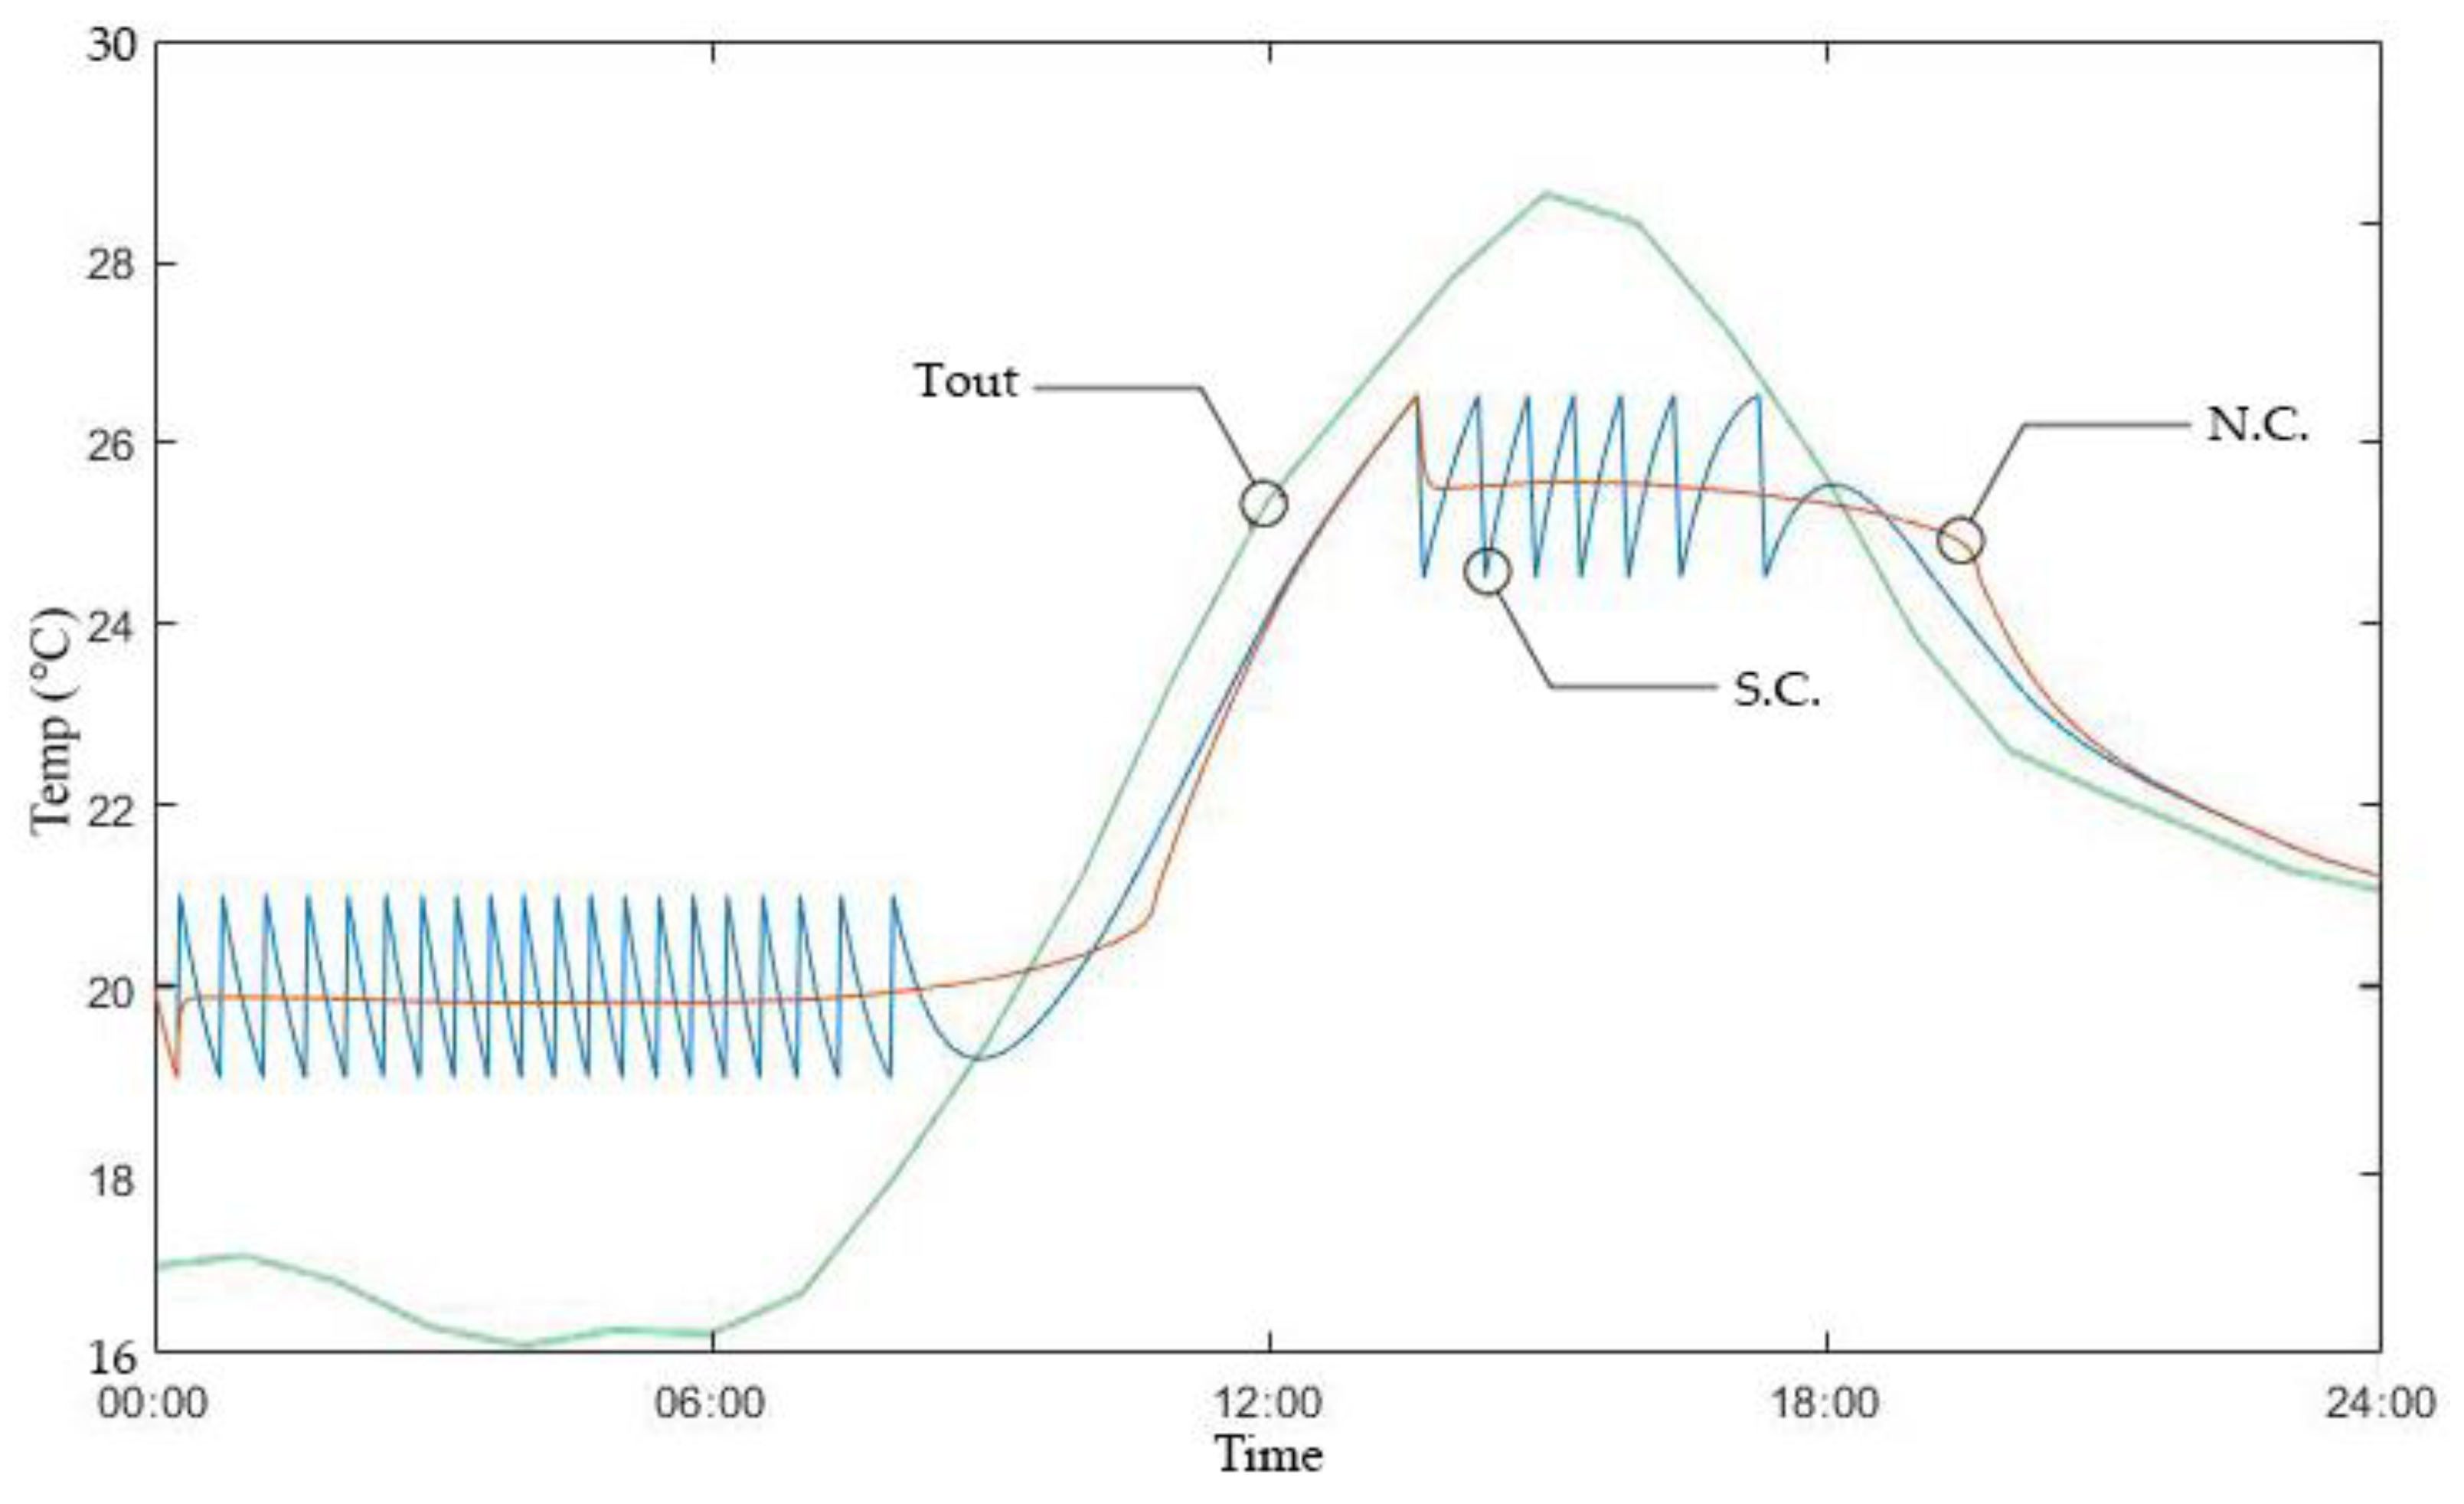
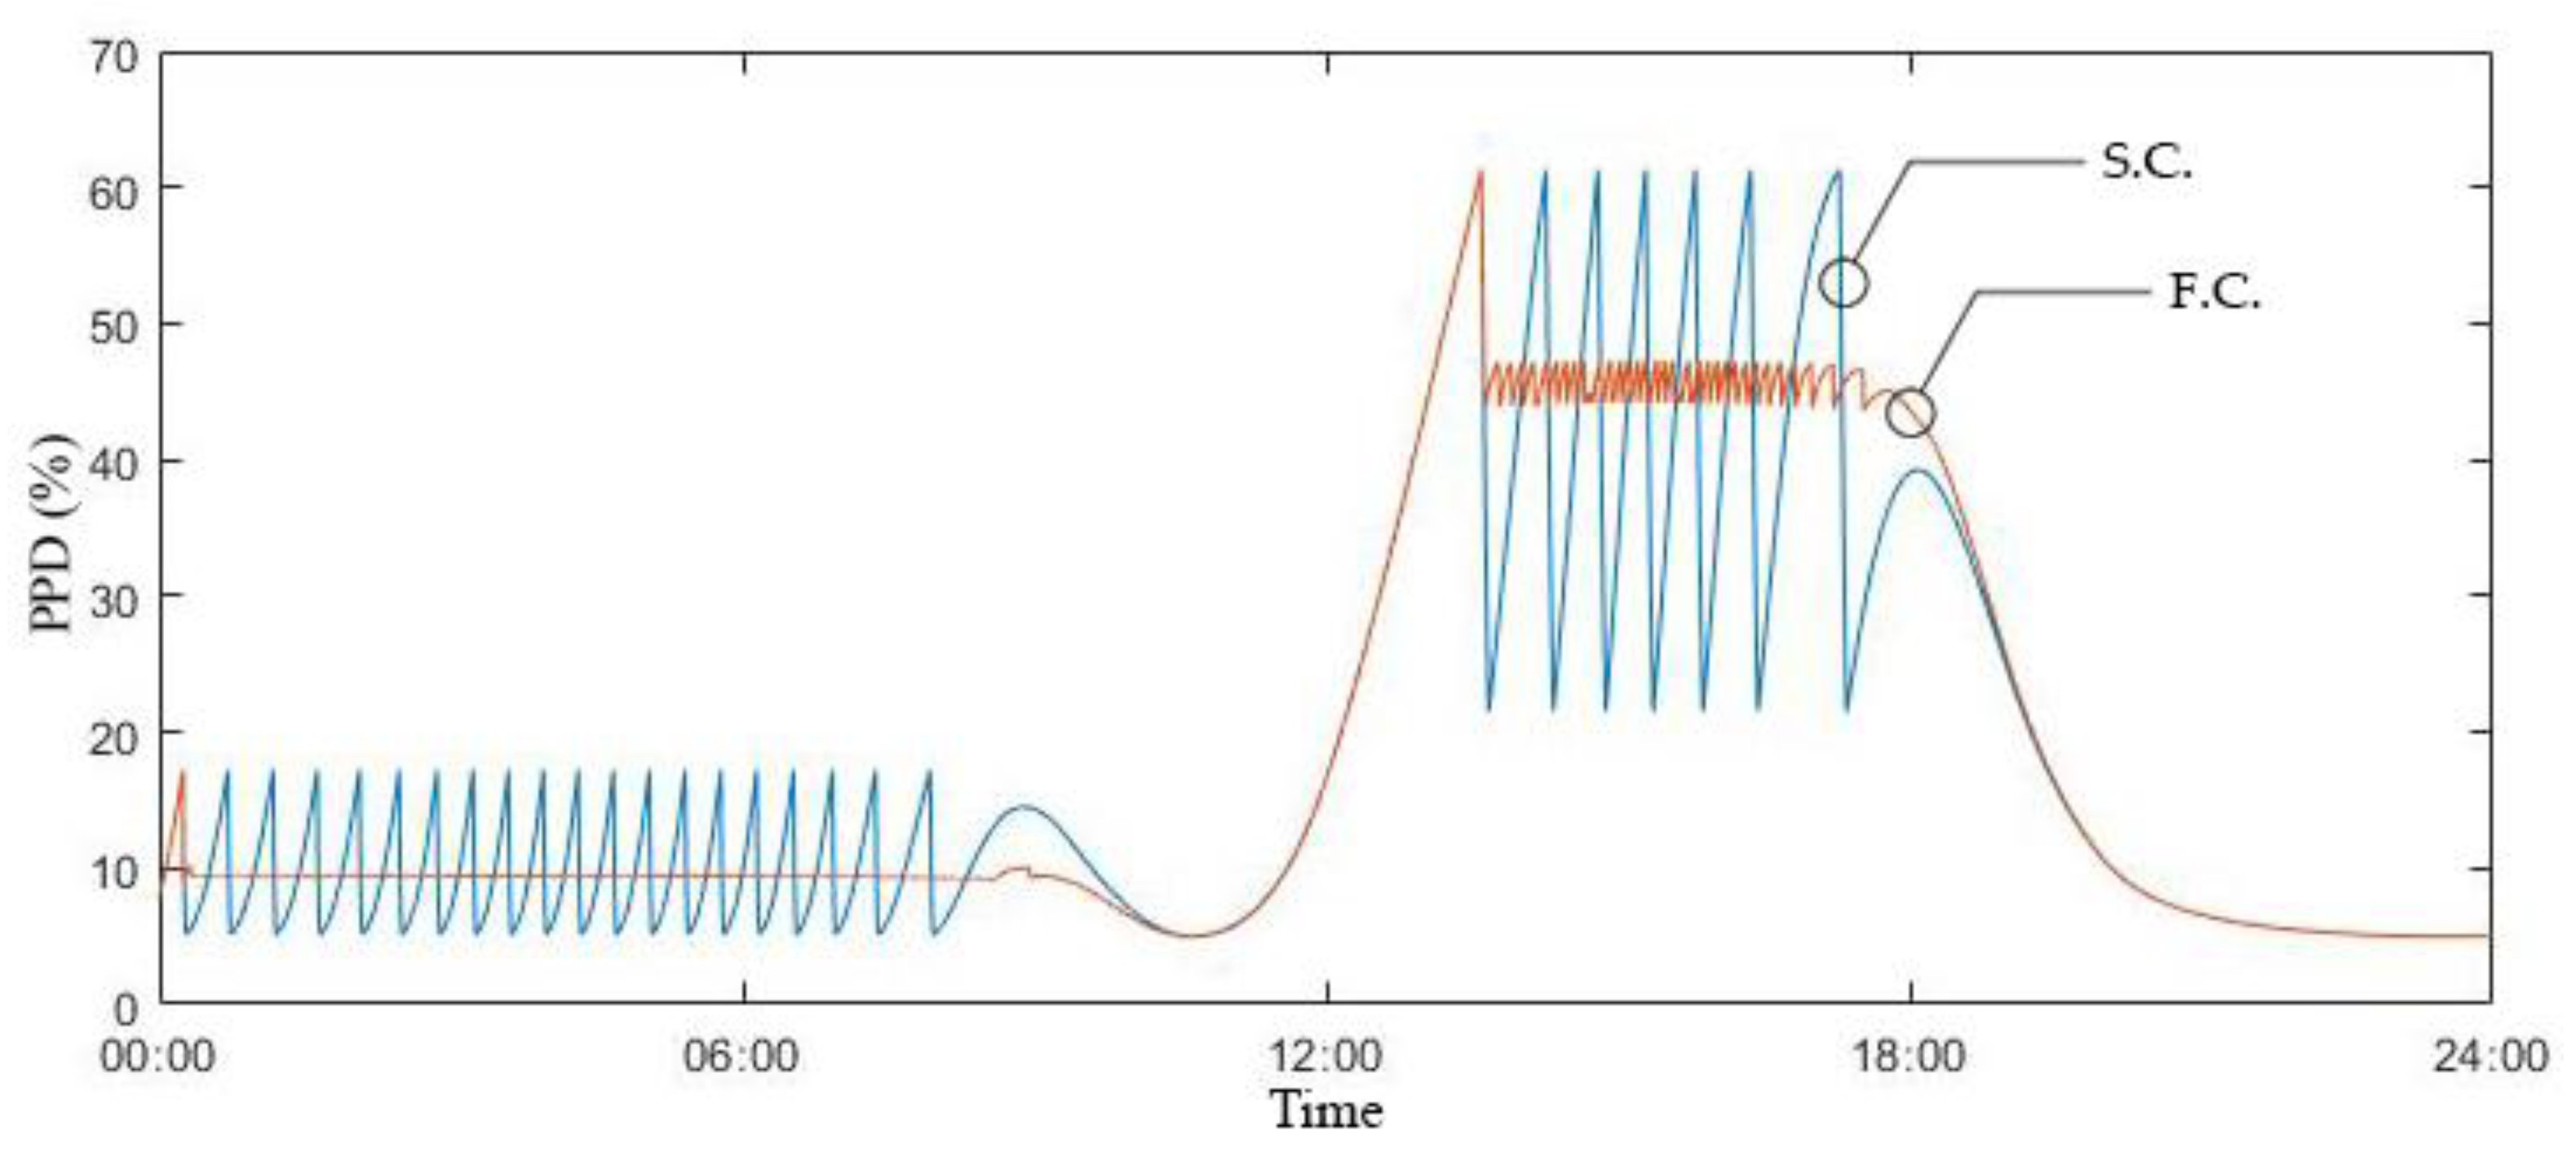
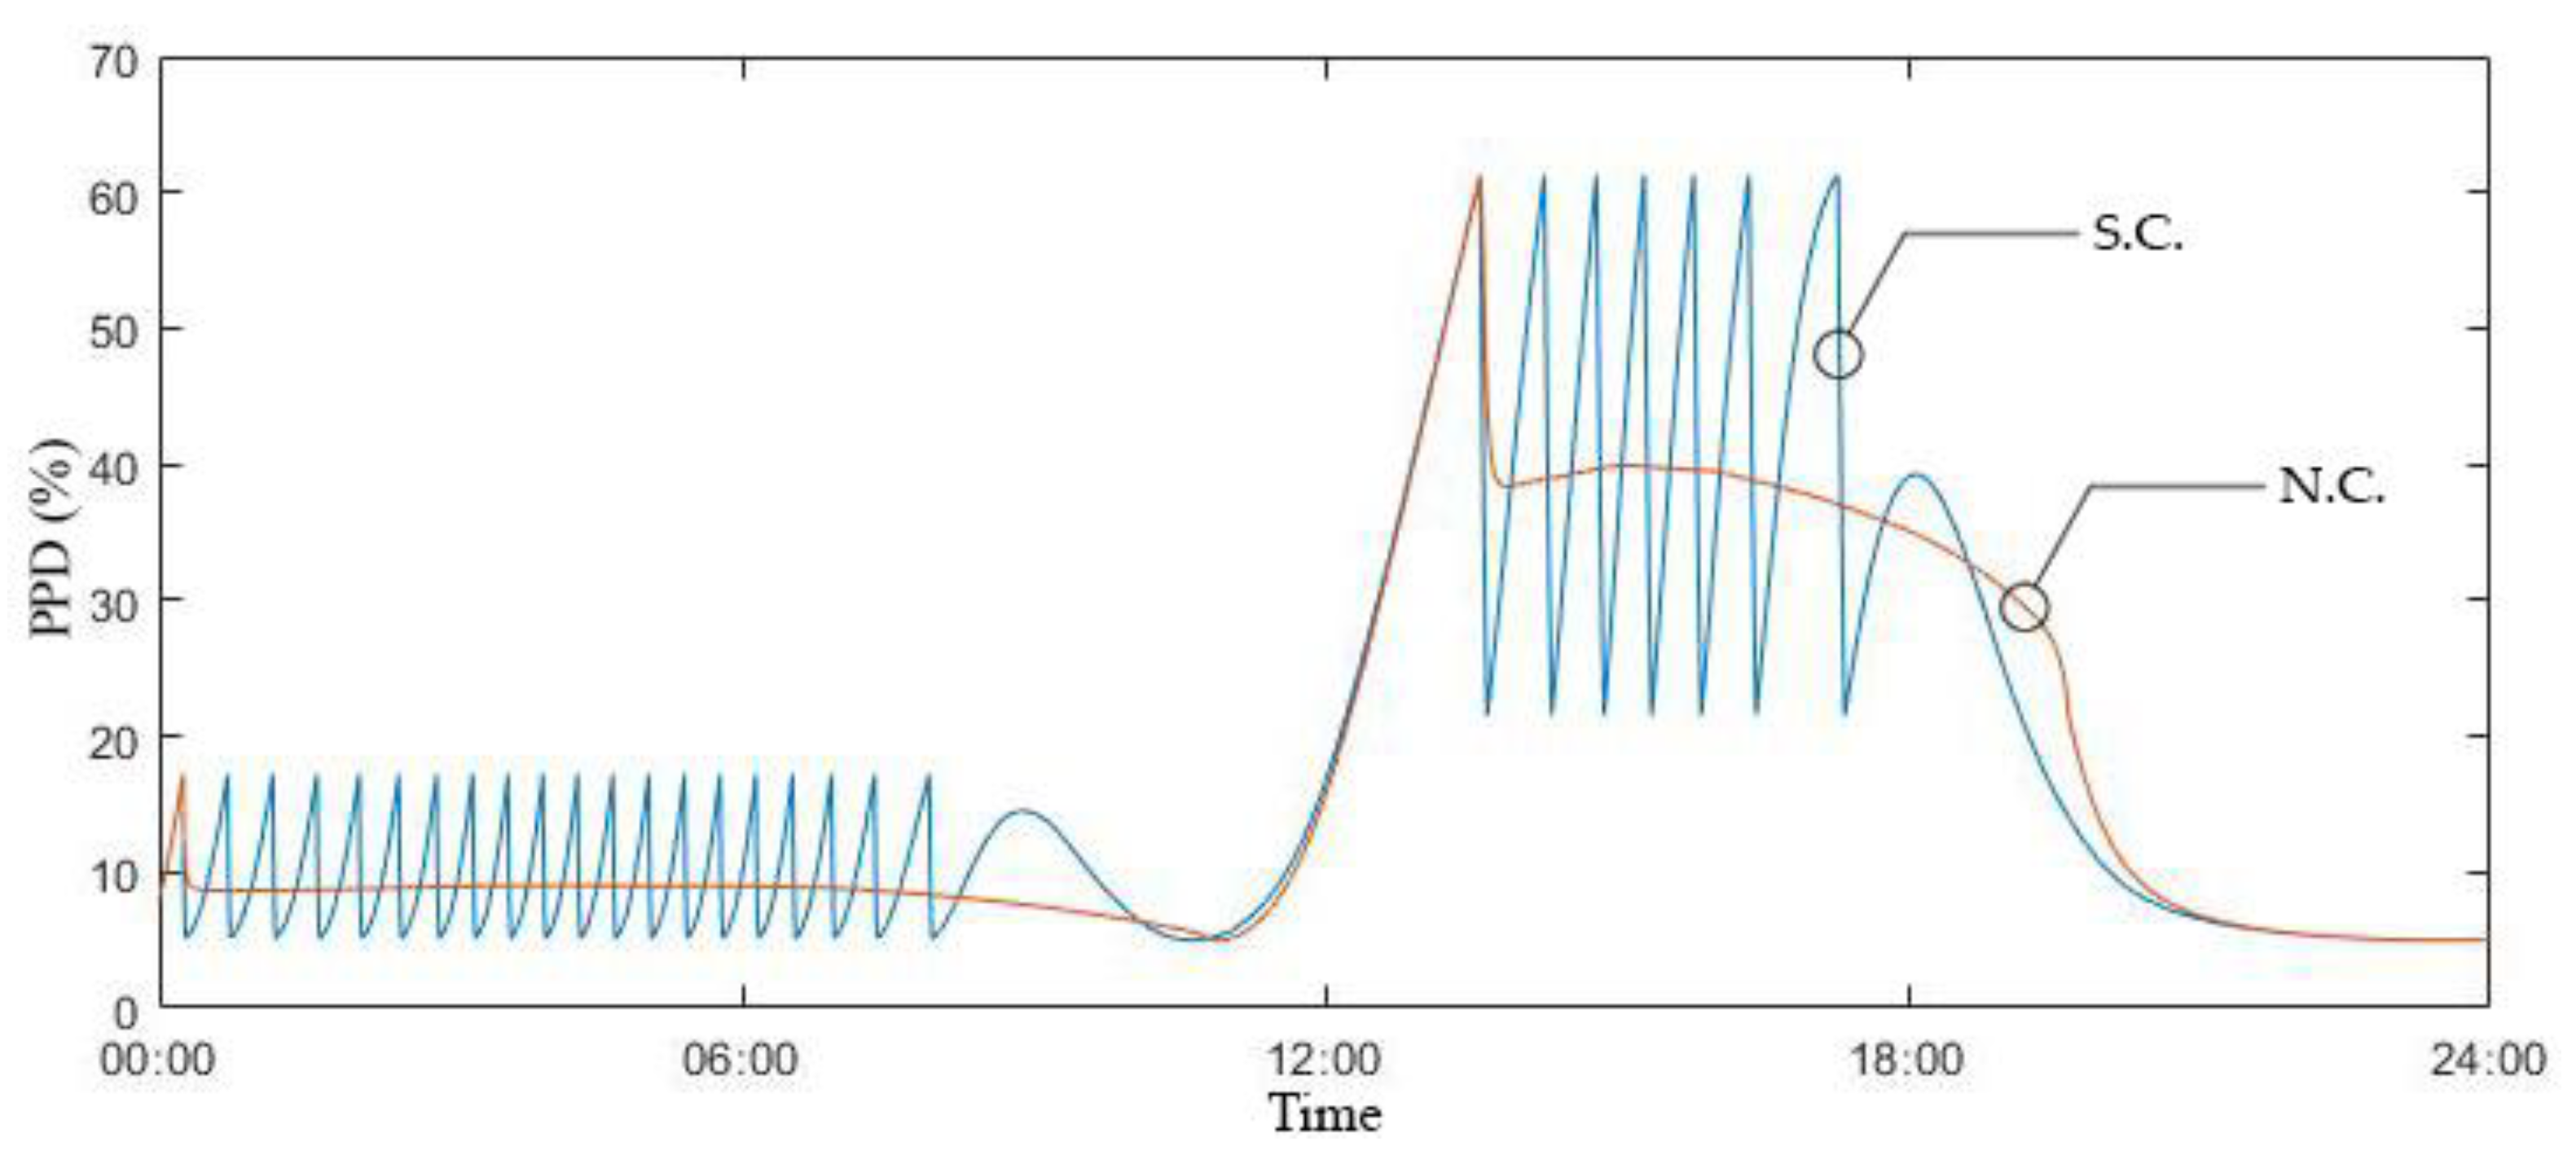
3.1. Temperature and Thermal Comfort

By using the parameters and objective functions, the performance of controlling air supply was examined by use of spatial thermal and human factors which cause undesirable changes in thermal comfort. In Figure 5, Figure 6, Figure 7 and Figure 8, it is confirmed that the PPD values change similarly with changes in Troom. In areas where the heating occurs at nighttime, the PPD values are maintained between −0.5 and 0 to create a relatively pleasant indoor environment. However, considering that the cooling generally stays near 1.0 during the daytime from 13:00 to 18:00, it is necessary to adjust the Tset for the improvement the thermal comfort.
As indicated in Figure 7 and Figure 8, unlike the SC, the NC properly operated to keep the PPD value below 10% from 00:00 to 11:00. Despite the NC not maintaining the PPD level under 10%, it can be found that the average degree of the PPD at daytime was maintained lower than two different controllers. The signals were controlled to reduce the PPD values by under 40% as shown in 13:00 and 19:00 in Figure 8. Therefore, the patterns of the PPD indicate strong evidence that the network-based algorithm can properly work to reduce PPD levels. The key is how to lower the PPD level below 10%, which may require comprehensive assumptions or frameworks considering more complex relationship between comfort factors, such as mean radiant temperature, indoor air speed, occupant metabolic rate, and occupant clothing insulation.

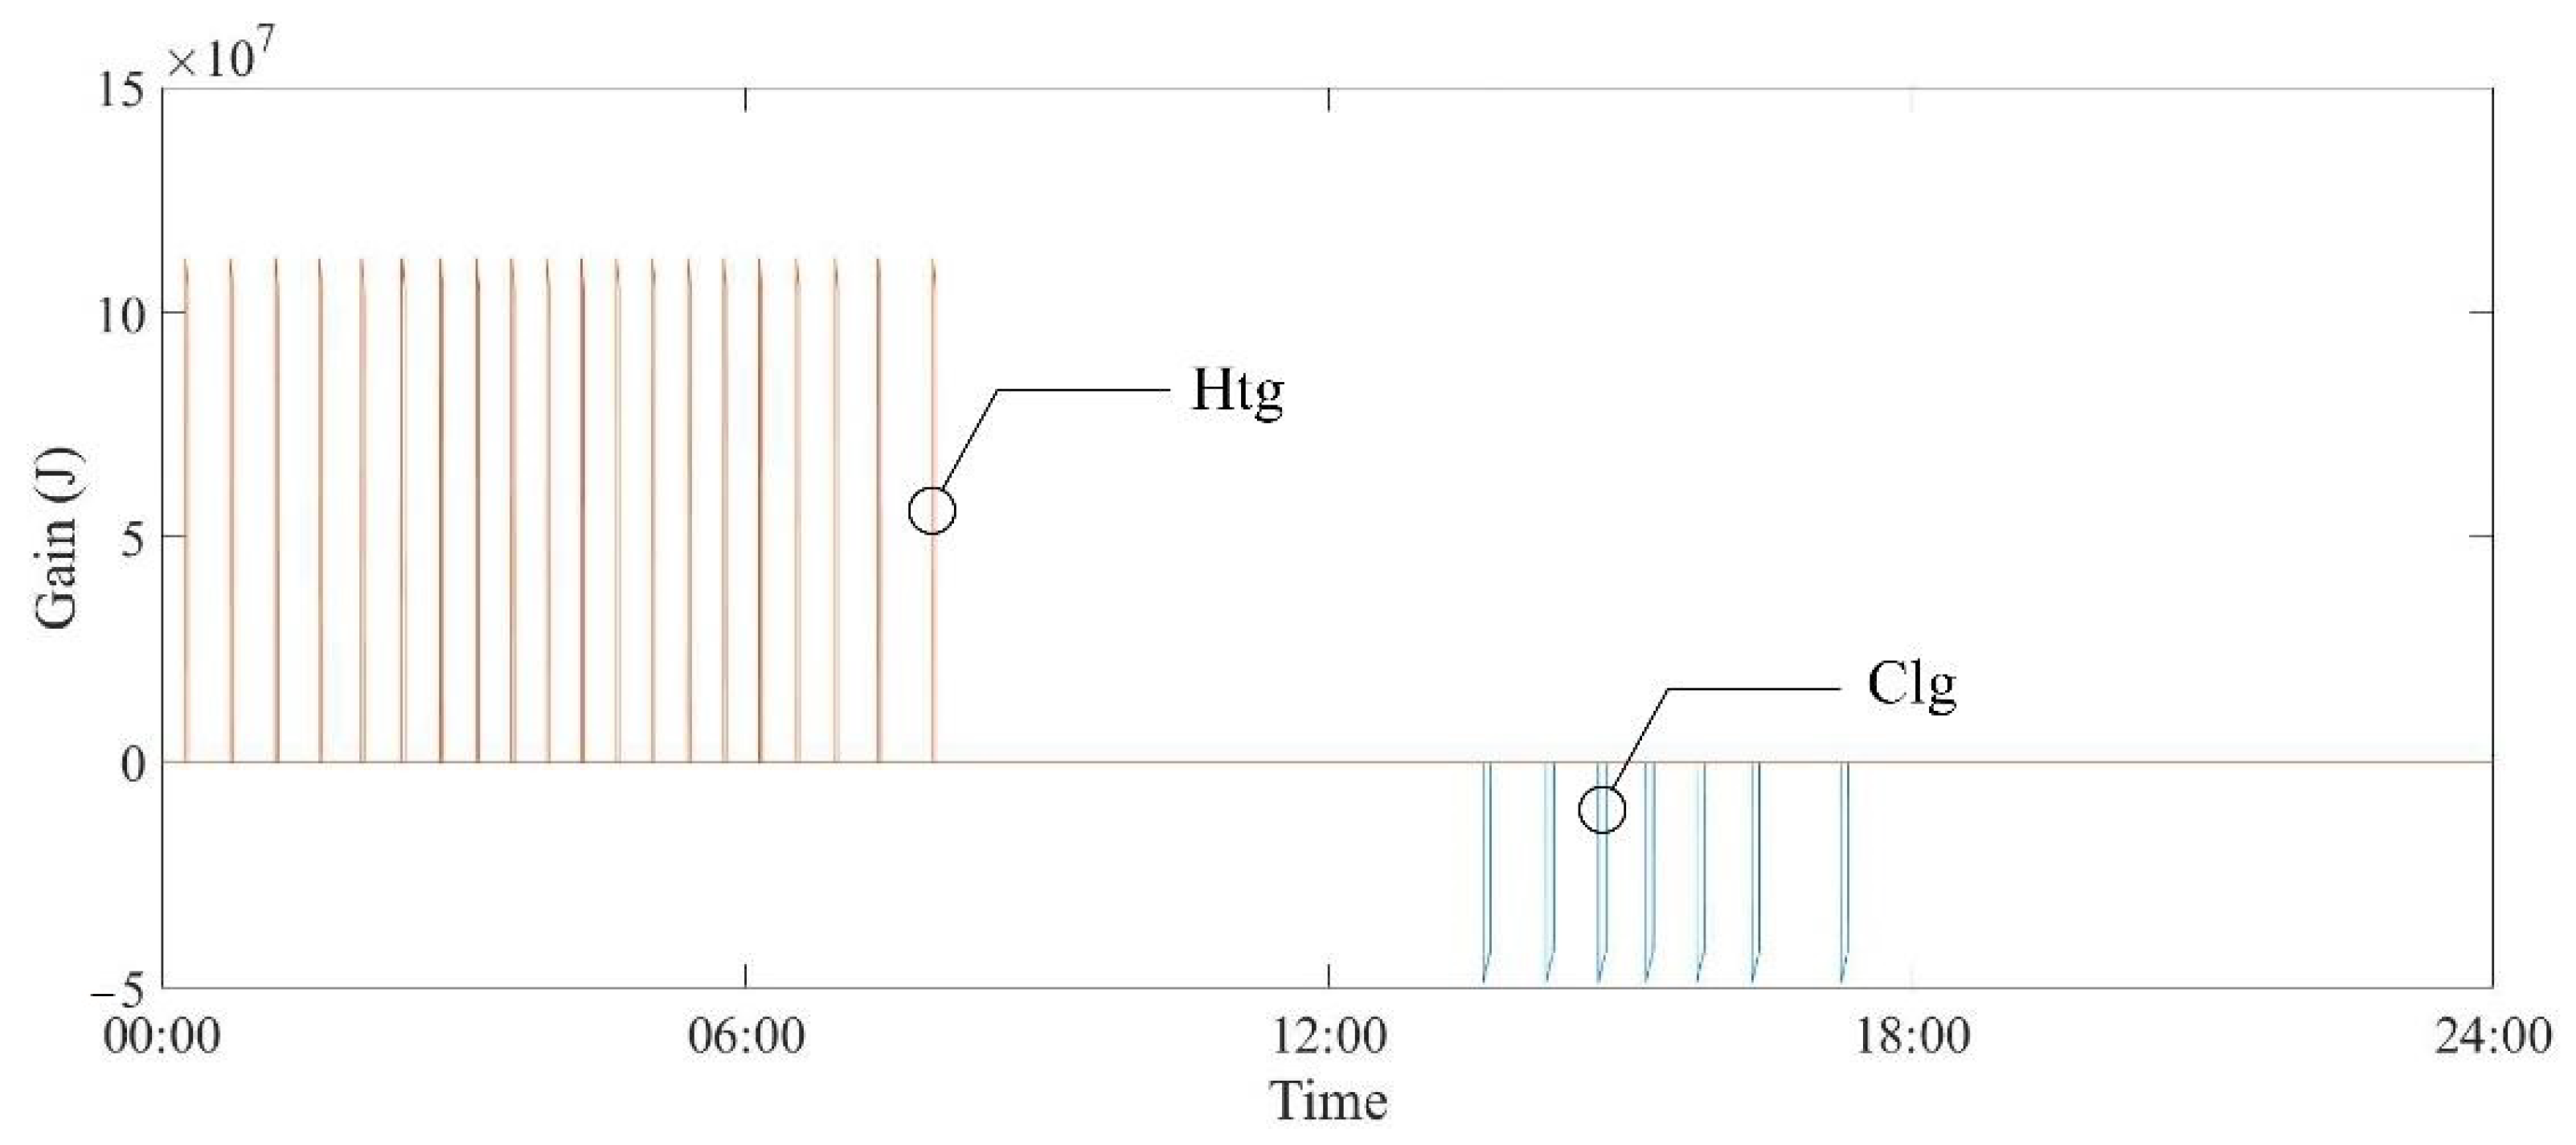
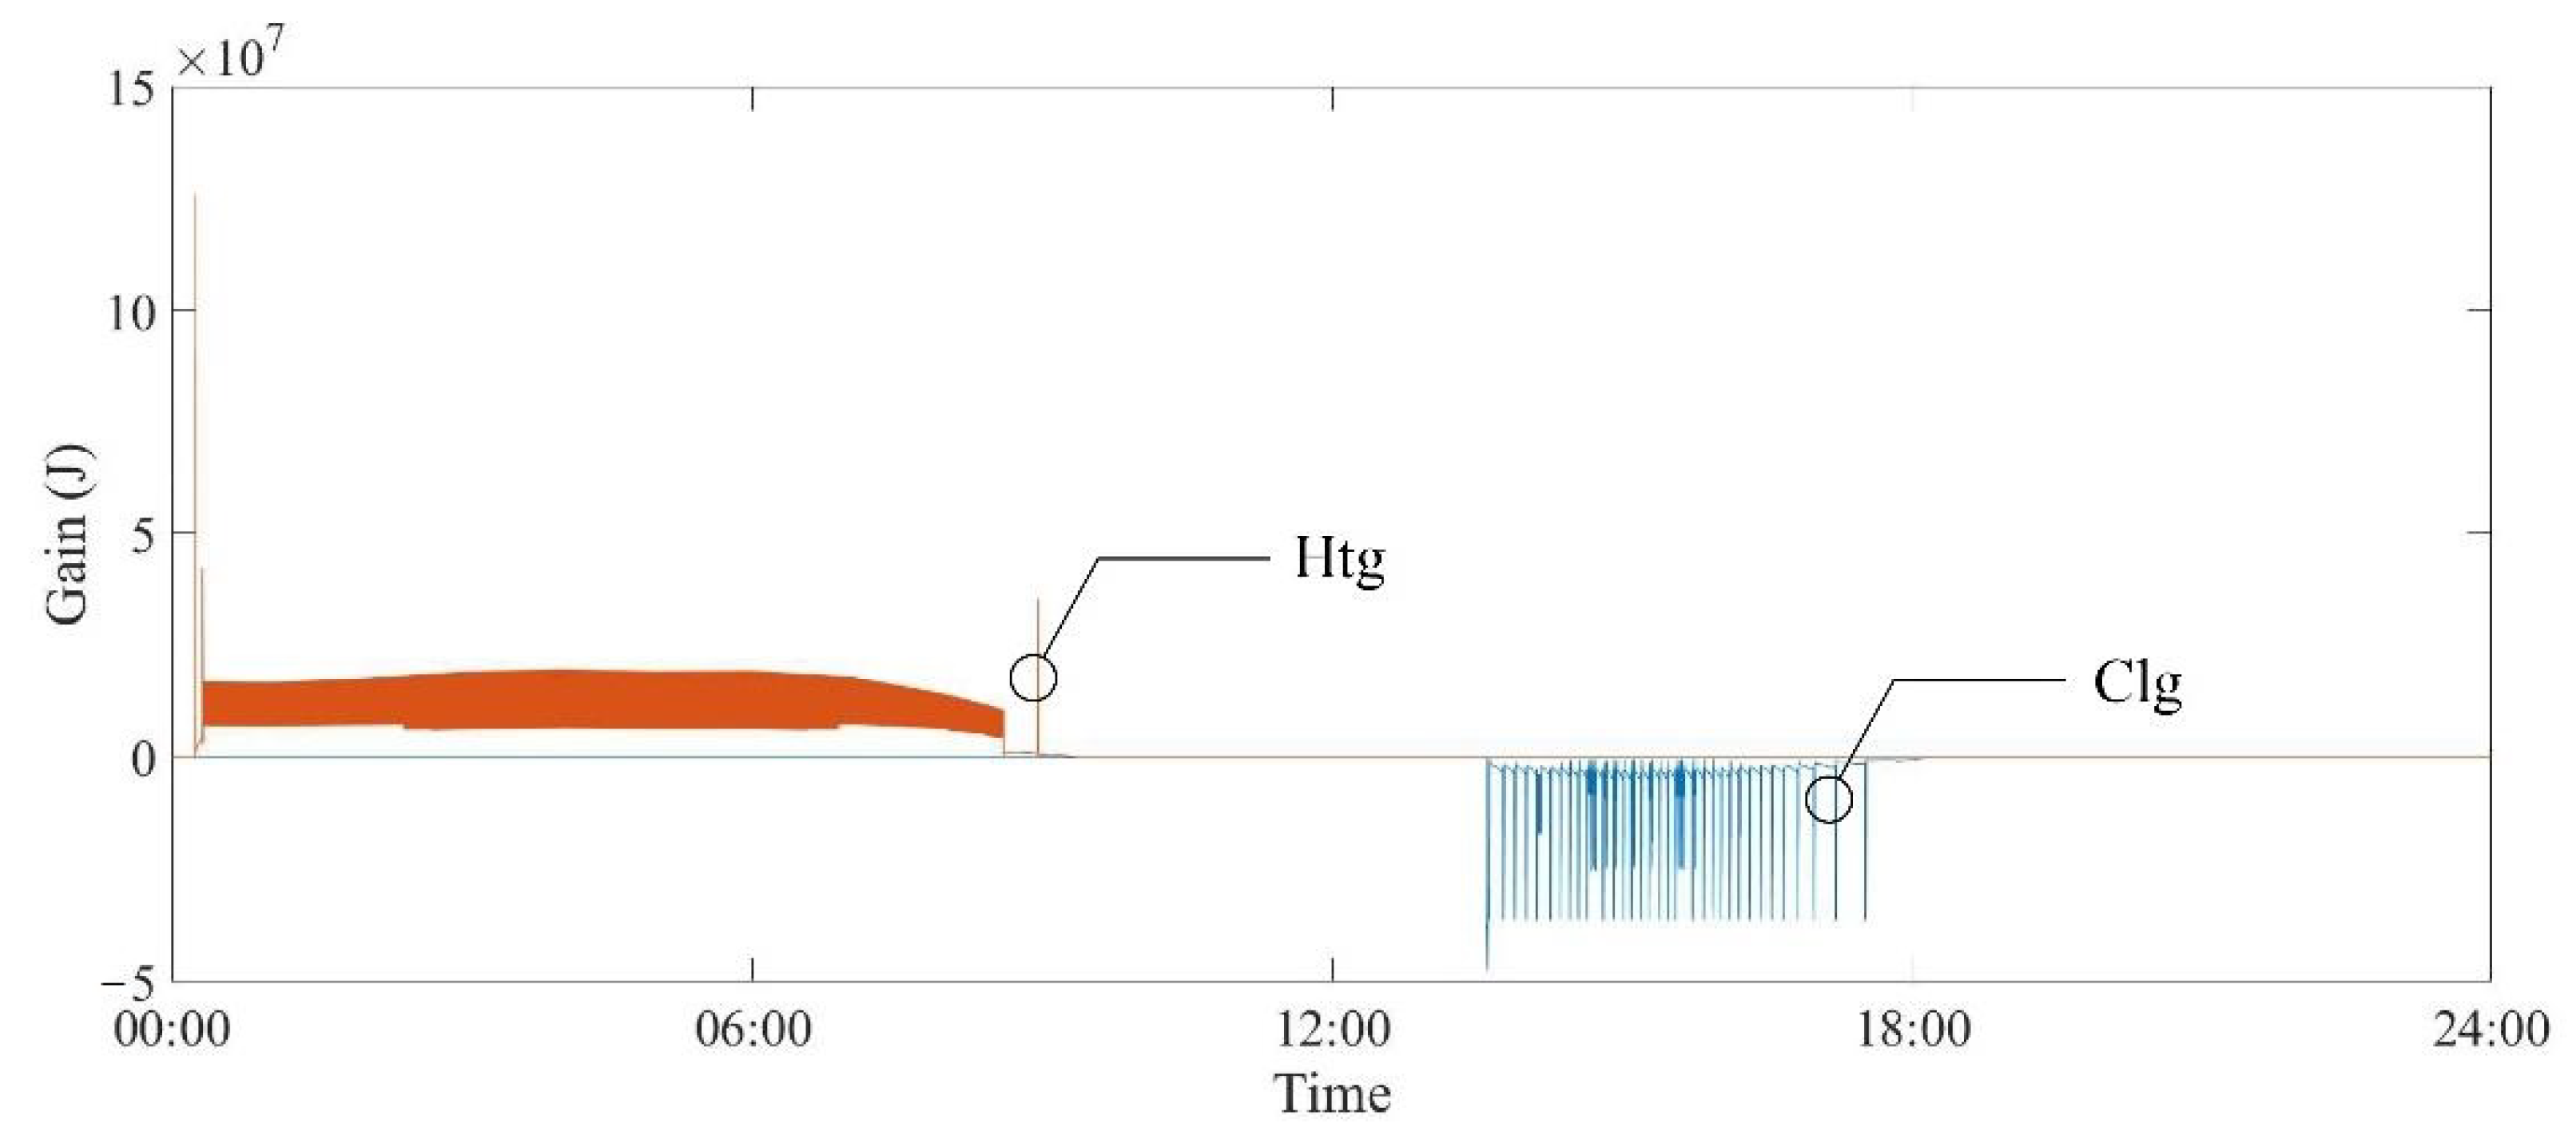
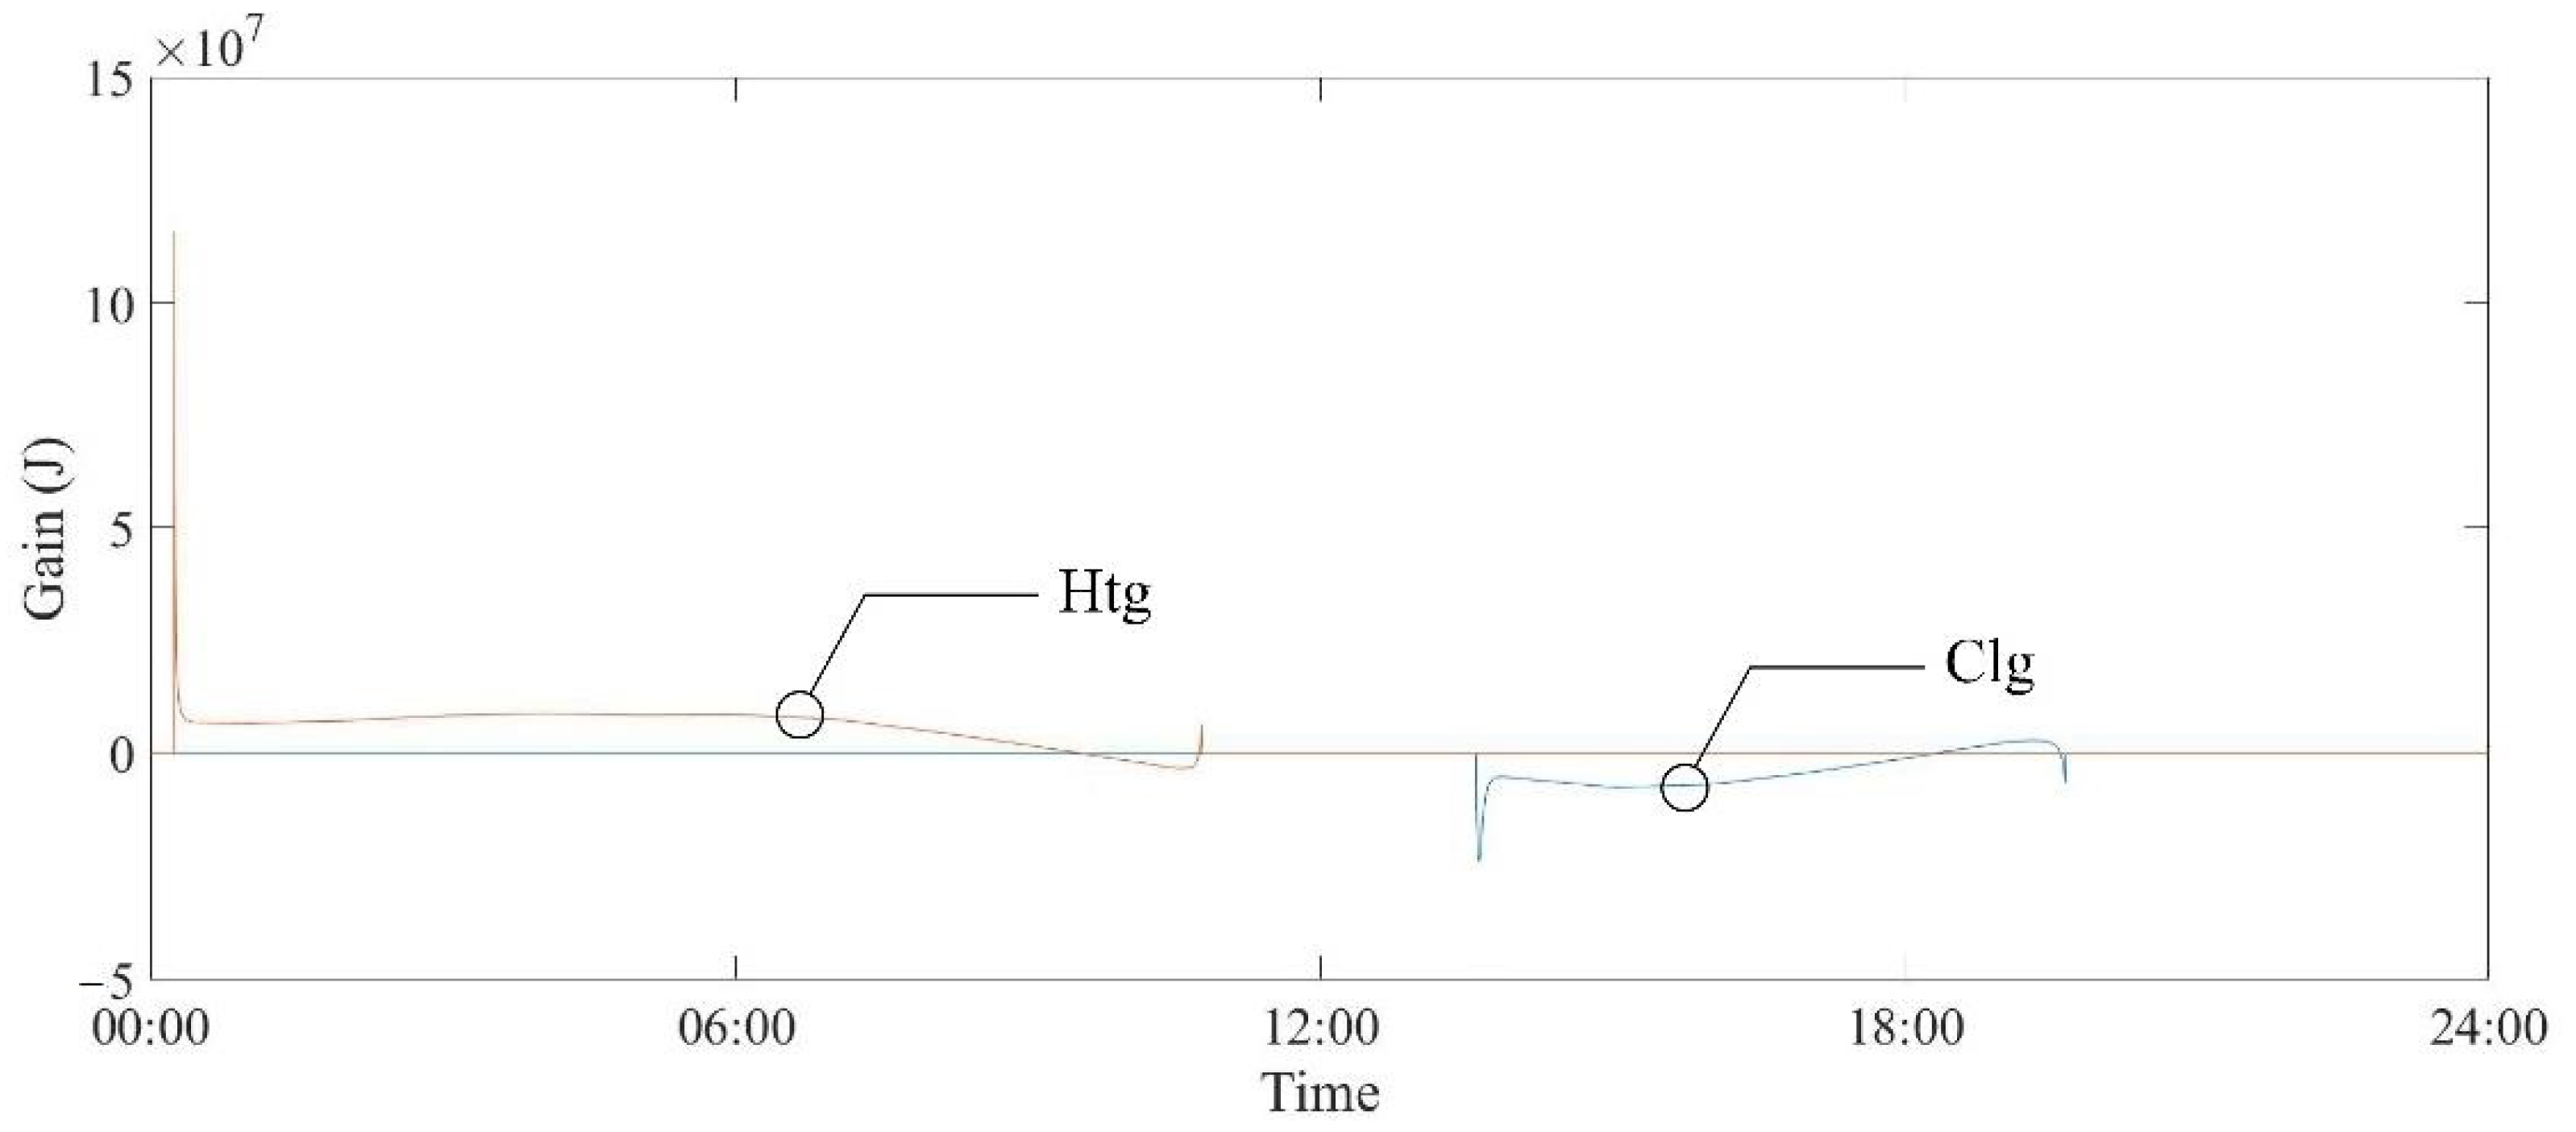
3.2. Energy Transfer

In Figure 9 and Figure 10, the control results of the SC and FC were confirmed. For the FC, although there is a significant advantage in the consistency of maintaining Troom due to the high density of the control signals, it can be considered similar to SC in that it performs direct controls in each indoor thermal situation. Unlike the two controllers, the NC in Figure 11 effectively controls the air supply excepting for the start and end of the system operation. By the learning process and the sensitive control, the NC effectively responds to Tout to send an effective signal, thus the ANN as a predictive model is properly operated to maintain the constancy of the thermal comfort. At this point, it implies the fact that the inevitable increase in energy consumption may not be avoided, however, due to the consistency of controls, it can be seen that the peak energy demand to be supplied at each point is very small. Thus, a numerical analysis of how energy consumption actually occurred is imperative.

3.3. Numerical Comparison

As indicated in the first two rows in Table 2, although the difference is not quite large, the FC works efficiently at the integral of absolute error (IAE). The NC indicates relatively small errors even in both heating and cooling by about 6.3% and 3.1%, respectively, as compared to the SC. The predictive process of the NC efficiently works to respond to Tout and maintains indoor thermal comfort to effectively reach Tset. In terms of the PPD levels, the difference between each control is even more noticeable. By use of the root mean square error (RMSE) of the PPD, the results of two immediate deterministic models are worse than that of the network-based learning model. The NC model works properly to reduce the values by about 6.1% and 9.4% in comparison with the SC and the FC, respectively.
As shown in Table 3, the FC is found to consume considerably more energy than the SC. Compared to SC, which no longer consumes energy due to switching off once the Troom reaches Tset, the FC can be attributed to continuous energy consumption by detecting the differences between indoor and outdoor conditions and their changes. However, as well as effectively reducing the PPD levels, the NC shows good results in the row of energy use intensity as a unit of energy consumption. The NC model worked properly to reduce the energy consumption by about 1.8% and 39.5% in comparison with the SC and FC models, respectively. As a result, for the NC, which combines learning of control results with learning of different weather conditions, its efficiency improves from about 6.1% to 9.4% for the thermal dissatisfaction levels and from about 1.8% to 39.5% for the energy consumption as compared to SC and FC models, respectively. However, as indicated in the tables, the difference of 3.9% in the consistency of thermal comfort and 1.8% in the energy consumption may be offset by the effect on actual workability and productivity that the difference produces. When retrofitting or replacing existing thermal software and hardware, the analysis of economic feasibility may have to be preceded, especially in the case of low-income housing or labor-intensive facilities.

4. Conclusions

This research proposed an analytic comparison to examine the performance of the processes of a single-switch model, a fuzzy-based deterministic model, and a network-based learning model. The conventional single-switch deterministic model may have some advantages in initial installation and maintenance costs based on its simplicity, however its immediate controls of indoor thermal comfort are neglected in response to rapid changes in thermal conditions and occupant activities. In order to compensate this weakness, the research analyzed the validity of the models using the fuzzy logic that sends out signals through an immediate analysis based on the two elements, and using a neural network that sends out signals through the most similar situations derived from the learning past data. From the results, it was concluded that the network-based process improves the thermal comfort level by about 6.1% to 9.4% and the energy efficiency by about 1.8% to 39.5% as compared to the two deterministic processes. It implies the fact that, in a specific weather condition, the performance of the network-based learning process was quite efficient. If its algorithm correction to mitigate overshoots is made for the initial time when the system turns on, the result can be used to reduce system’s capacity by inhibiting overshoots of heating and cooling air supply, and utilizing the relatively low constant pattern of the network-based process.
The overall framework of this research has a weakness of neglecting various unpredictable physical conditions that may occur in real buildings. In areas where energy consumption and thermal comfort are considered at the same time, as indicated in the result tables, the conventional thermostats still may have some advantages in terms of economic feasibility. In addition, the objective was to clearly identify differences in demands of heating and cooling air supply for each process, so some important variables were simply assumed to be fixed values in calculating the comfort level associated with the control errors. For these reasons, a follow-up study will be performed for the validation process of the actual effectiveness of network-based processes in a more comprehensive way reflecting practical parameters in built environments and an adaptive process for thermal comfort. In addition, a lab-scaled model or a plug-in application can be utilized to practically examine the performance of this theoretical process.

Funding

This work was supported by the National Research Foundation of Korea (NRF) grant funded by the Korea government (MSIT) (No.2019R1G1A1006984).

Institutional Review Board Statement

Not applicable.

Informed Consent Statement

Not applicable.

Data Availability Statement

Not applicable.

Conflicts of Interest

The authors declare no conflict of interest.

Nomenclature

Aarea of material(s) (m2)outmass flow-rate outside room (kg/h)
Clgcoolingmroom∙airmass flow-rate in room air (kg)
Cvspecific heat capacity at constant volume (J/kg·K)Qlossheat loss by convection and transmission (J)
Cpspecific heat capacity at constant pressure (J/kg·K)Qgainheat gain by convection and transmission (J)
Dthickness of material(s) (m)Rthermal resistance (K/W)
fclratio of clothed surface area to DuBois surface areaTclaverage surface temperature of clothed body (°C)
HtgheatingThtair temperature from heater (°C)
hin, houtconvection heat transfer coefficient inside, outside (W/m2·K)Toutoutdoor temperature (°C)
IAEintegral of absolute errorsTrmean radiant temperature (°C)
kthermal conductivity (W/m·K)Troomroom temperature (°C)
Lthermal loadTsetset-point temperature (°C)
Mmetabolic rateUinternal energy (J)
htmass flow-rate from system (kg/h)Wwork (J)
inmass flow-rate inside room (kg/h)Wa, Wshhumidity ratio of air, at the skin temperature

References

  1. Rossiter, J.; Kouvaritakis, B.; Dunnett, R. Application of generalised predictive control to a boiler-turbine unit for electricity gener-ation. In Proceedings of the IEE (Control Theory and Applications), Leeds, UK, 1–4 September 2008; Volume 138, pp. 59–67. [Google Scholar] [CrossRef]
  2. Maffezzoni, C. Boiler-turbine dynamics in power-plant control. Control. Eng. Pract. 1997, 5, 301–312. [Google Scholar] [CrossRef]
  3. Tan, W.; Liu, J.; Fang, F.; Chen, Y. Tuning of PID controllers for boiler-turbine units. ISA Trans. 2004, 43, 571–583. [Google Scholar] [CrossRef]
  4. Braun, J.E.; Montgomery, K.W.; Chaturvedi, N. Evaluating the Performance of Building Thermal Mass Control Strategies. HVAC&R Res. 2001, 7, 403–428. [Google Scholar] [CrossRef]
  5. Al-Saeed, Y.W.; Ahmed, A. Evaluating Design Strategies for Nearly Zero Energy Buildings in the Middle East and North Africa Regions. Designs 2018, 2, 35. [Google Scholar] [CrossRef] [Green Version]
  6. Busamante, S.; Castro, P.; Laso, A.; Manana, M.; Arroyo, A. Smart Thermostat: An. Experimental Facility to Test. Their Capabilities and Savings Potential. Sustainability 2017, 9, 1462. [Google Scholar] [CrossRef] [Green Version]
  7. Nippon GT Corporation. What is the thermostat? Available online: https://www.ngt.co.jp (accessed on 31 January 2021).
  8. Ahn, J.; Cho, S. Dead-band vs. machine-learning control systems: Analysis of control benefits and energy efficiency. J. Build. Eng. 2017, 12, 17–25. [Google Scholar] [CrossRef]
  9. Ahn, J.; Cho, S.; Chung, D.H. Analysis of energy and control efficiencies of fuzzy logic and artificial neural network technologies in the heating energy supply system responding to the changes of user demands. Appl. Energy 2017, 190, 222–231. [Google Scholar] [CrossRef]
  10. Ji, Y.; Xu, P.; Duan, P.; Lu, X. Estimating hourly cooling load in commercial buildings using a thermal network model and electricity submetering data. Appl. Energy 2016, 169, 309–323. [Google Scholar] [CrossRef]
  11. Jang, J.; Lee, J.; Son, E.; Park, K.; Kim, G.; Lee, J.H.; Leigh, S.-B. Development of an Improved Model to Predict Building Thermal Energy Consumption by Utilizing Feature Selection. Energies 2019, 12, 4187. [Google Scholar] [CrossRef] [Green Version]
  12. Ahn, J. Performance Analyses of Temperature Controls by a Network-Based Learning Controller for an Indoor Space in a Cold Area. Sustainability 2020, 12, 8515. [Google Scholar] [CrossRef]
  13. Bourdeau, M.; Zhai, X.Q.; Nefzaoui, E.; Guo, X.; Chatellier, P. Modeling and forecasting building energy consumption: A review of data-driven techniques. Sustain. Cities Soc. 2019, 48, 11533. [Google Scholar] [CrossRef]
  14. Yoon, S.H.; Ahn, J. Comparative Analysis of Energy Use and Human Comfort by an Intelligent Control Model at the Change of Season. Energies 2020, 13, 6023. [Google Scholar] [CrossRef]
  15. Soyguder, S.; Alli, H. Predicting of fan speed for energy saving in HVAC system based on adaptive network based fuzzy inference system. Expert Syst. Appl. 2009, 36, 8631–8638. [Google Scholar] [CrossRef]
  16. Ahn, J. Improvement of the Performance Balance between Thermal Comfort and Energy Use for a Building Space in the Mid-Spring Season. Sustainability 2020, 12, 9667. [Google Scholar] [CrossRef]
  17. Huizenga, C.; Abbaszadeh, S.; Zagreus, L.; Arens, E.A. Air Quality and Thermal Comfort in Office Buildings: Results of a Large Indoor Environmental Quality Survey. In Proceedings of the Healthy Buildings, Lisbon, Portugal, 4–8 June 2006; Volume III, pp. 393–397. [Google Scholar]
  18. Nematchoua, M.K.; Tchinda, R.; Orosa, J.A. Thermal comfort and energy consumption in modern versus traditional buildings in Cameroon: A questionnaire-based statistical study. Appl. Energy 2014, 114, 687–699. [Google Scholar] [CrossRef]
  19. Youssef, A.; Caballero, N.; Aerts, J. Model-Based Monitoring of Occupant’s Thermal State for Adaptive HVAC Predictive Controlling. Processes 2019, 7, 720. [Google Scholar] [CrossRef] [Green Version]
  20. Sung, Y.; Ahn, J. Comparative Analyses of Energy Efficiency between on-Demand and Predictive Controls for Buildings’ Indoor Thermal Environment. Energies 2020, 13, 1089. [Google Scholar] [CrossRef] [Green Version]
  21. Dounis, A.; Santamouris, M.; Lefas, C.; Argiriou, A. Design of a fuzzy set environment comfort system. Energy Build. 1995, 22, 81–87. [Google Scholar] [CrossRef]
  22. Ahn, J. Abatement of the Increases in Cooling Energy Use during a Period of Intense Heat by a Network-Based Adaptive Controller. Sustainability 2021, 13, 1353. [Google Scholar] [CrossRef]
  23. Palladio, D.; Nardi, I.; Burati, C. Artificial Neural Network for the Thermal Comfort Index Prediction: Development of a New Simplified Algorithm. Energies 2020, 13, 4500. [Google Scholar] [CrossRef]
  24. Park, S.-Y.; Cho, S.; Ahn, J. Improving the quality of building spaces that are planned mainly on loads rather than residents: Human comfort and energy savings for warehouses. Energy Build. 2018, 178, 38–48. [Google Scholar] [CrossRef]
  25. Chen, X.; Wang, Q.; Srebric, J. Occupant feedback based model predictive control for thermal comfort and energy optimization: A chamber experimental evaluation. Appl. Energy 2016, 164, 341–351. [Google Scholar] [CrossRef]
  26. Ahn, J.; Cho, S. Anti-logic or common sense that can hinder machine’s energy performance: Energy and comfort control models based on artificial intelligence responding to abnormal indoor environments. Appl. Energy 2017, 204, 117–130. [Google Scholar] [CrossRef]
  27. Moon, J.W.; Ahn, J. Improving sustainability of ever-changing building spaces affected by users’ fickle taste: A focus on human comfort and energy use. Energy Build. 2020, 208, 109662. [Google Scholar] [CrossRef]
  28. Ahn, J.; Chung, D.H.; Cho, S. Network-based energy supply optimal system in the condition where both heating and cooling are required simultaneously in a swing season. Intell. Build. Int. 2017, 10, 42–57. [Google Scholar] [CrossRef]
  29. The Engineering ToolBox Resources Home Page. Available online: http://www.engineeringtoolbox.com (accessed on 20 February 2020).
  30. U.S. Department of Energy. Weather Data. EnergyPlus. Available online: https://energyplus.net/weather (accessed on 23 October 2019).
  31. National Institute of Building Science. Space Types. Whole Building Design Guide. Available online: https://www.wbdg.org/space-types/ (accessed on 8 May 2020).
  32. Kim, S.-C.; Shin, H.-I.; Ahn, J. Energy performance analysis of airport terminal buildings by use of architectural, operational information and benchmark metrics. J. Air Transp. Manag. 2020, 83, 101762. [Google Scholar] [CrossRef]
  33. Gilani, S.I.U.H.; Khan, M.H.; Pao, W. Thermal Comfort Analysis of PMV Model Prediction in Air Conditioned and Naturally Ventilated Buildings. Energy Procedia 2015, 75, 1373–1379. [Google Scholar] [CrossRef] [Green Version]
  34. Cheung, T.; Schiavon, S.; Parkinson, T.; Li, P.; Brager, G. Analysis of the accuracy on PMV‑PPD model using the ASHRAE Global Thermal Comfort Database II. Build. Environ. 2019, 153, 205–217. [Google Scholar] [CrossRef] [Green Version]
  35. Petković, D.; Ćojbašić, Ž.; Nikolić, V.; Shamshirband, S.; Kiah, M.L.M.; Anuar, N.B.; Wahab, A.W.A. Adaptive neuro-fuzzy maximal power extraction of wind turbine with continuously variable transmission. Energy 2014, 64, 868–874. [Google Scholar] [CrossRef]
  36. Beinarts, I. Fuzzy logic control method of HVAC equipment for optimization of passengers’ thermal comfort in public electric transport vehicles. In Proceedings of the Eurocon 2013, Zagreb, Croatia, 1–4 July 2013; pp. 1180–1186. [Google Scholar]
  37. Ahn, J.; Chung, D.H.; Cho, S. Performance analysis of space heating smart control models for energy and control effectiveness in five different climate zones. Build. Environ. 2017, 115, 316–331. [Google Scholar] [CrossRef]
  38. Vamsi, R. What’s a neural network? Available online: https://medium.com (accessed on 23 October 2020).
Figure 1. Thermal control design strategy.
Processes 09 00385 g001
Figure 2. Outdoor temperature.
Processes 09 00385 g002
Figure 3. Diagram for artificial neural networks.
Processes 09 00385 g003
Figure 4. Simulation block diagram.
Processes 09 00385 g004
Figure 5. Comparison of Troom between single-switch controller (SC) and fuzzy controller (FC).
Processes 09 00385 g005
Figure 6. Comparison of Troom between S.C. and network-based controller (NC).
Processes 09 00385 g006
Figure 7. Comparison of the predicted percentage of dissatisfied (PPD) between SC and FC.
Processes 09 00385 g007
Figure 8. Comparison of the PPD between SC and NC.
Processes 09 00385 g008
Figure 9. Energy consumption controlled by SC.
Processes 09 00385 g009
Figure 10. Energy consumption controlled by FC.
Processes 09 00385 g010
Figure 11. Energy consumption controlled by NC.
Processes 09 00385 g011
Table 1. Modeling and simulation conditions.
No.Design ParameterTemplate or Value
1Building typeSmall office building
2Building geometry19.5 m × 19.5 m × 4 m
3Wall depth0.15 m
4Thermal resistance of wall5.76 × 10−3 K/W
5Number of windows6
6Window geometry1 m × 1 m
7Window depth0.02 m
8Thermal resistance of window2.14 × 10−3 K/W
9Tset for Clg (cooling)25.5 °C
10Tset for Htg (heating)20.0 °C
11Mass flow rate into room3600 kg × hour−1
12Weather condition28th April, Shanghai in China (IWEC data)
Table 2. Comparison of control accuracy by three controllers.
No.IndexSCFCNC
1IAE for heating59.9758.5656.21
2IAE for cooling81.8981.6579.32
3RMSE of PPD23.7324.6122.29
Table 3. Comparison of energy use by three controllers.
No.IndexSCFCNC
1Heating gain (MJ)231,389.4435,638.1229,680.8
2Cooling gain (MJ)86,029.379,248.582,068.5
3Energy use intensity (kWh/m2·yr)108.5176.0106.5
Publisher’s Note: MDPI stays neutral with regard to jurisdictional claims in published maps and institutional affiliations.

