Abstract
A three-phase separator is the first vessel encountered by well fluids. The application of separators has been of great value to the oil and gas industry. In order to generate the gas phase envelope that is applicable to the study of reservoir fluid and the selection of optimum operating conditions of separators, this research utilizes a specified reservoir fluid stream to simulate a three-phase separator executed in Aspen HYSYS. Subsequently, a comparative study of the effects of specified inlet operating conditions on the output of gas and oil streams was carried out. The results show that changing the inlet pressure of the separator from 1000 to 8000 kPa reduces the gas outlet flow from 1213 to 908.6 kg mol/h, while it increases the liquid flow rate from 374 to 838.0 kg mole/h. By changing the temperature of the separator feed stream from 13 to 83 °C, the gas outlet stream was raised from 707.4 to 1111 kg mol/h, while the liquid flow rate dropped from 1037.0 to 646.1 kg mol/h. It was observed that the concentration of the outlet methane product is not affected by changing the flow rate of the feed stream at a specific pressure and temperature. Therefore, the thermodynamic property method is appropriate to simulate the separation of reservoir fluids which was achieved by selecting the Peng–Robinson (PR) model. The operating conditions of the separator were at 8000 kPa and 43 °C, which lies right on the dew point line. This is comparable to similar work on CHEMCAD which was in turn validated by plant data. Thus, the gas flow rate and the oil flow rate were dependent on pressure and temperature conditions of the plant.
1. Introduction
A well stream may be made up of gas, oil, and water, each of which can be contaminated and contain condensates. A separator splits the well fluid into desired fractions. Generally, the initial separation of produced water from oil and gas takes place in the production separator and more often than not separators work based on the gravity exerted by fluids [1].
The flow conditions in wells may vary due to pressure, but the behavior of each well can be determined when the well fluids are separated. After the well fluids have been separated, they are taken to the laboratory so that the composition of the gas, oil, and condensate can be determined [2]. Separation of reservoir fluids is targeted at producing a gas stream that is as free as possible of propane-plus hydrocarbons and crude oil which is stable at storage conditions. This is to ensure that produced crude oil does not vaporize when conveyed to the storage tank because some light components may vaporize if slight variations in storage pressure and/or temperature occur [3]. A three-stage separation process is normally utilized to achieve the goal of separation of well fluids, namely high-pressure, medium-pressure, and low-pressure separators. The three-phase-high pressure separator is relevant for reduction of well fluid having water content from a fraction of 0.4 to about 0.05 [4].
Simulators are particularly essential for modeling systems that are not yet in existence or would be expensive to “experiment” with, such as large-scale chemical processes [5]. The high cost of conducting and building a simulation model with difficulty in the interpretation of outcomes is common to commercial software such as Ariane, CADSIM, ASSETT, D-SPICE, and so forth [6]. These limitations suppress their application to separators. ProSim, UniSim, CHEMCAD, and HYSYS are used for oil and gas processes. ProSim has good application in the simulation software for sour systems which contain H2S and CO2. It is well known for rigorous calculation of chemisorption and column hydraulics but it does not have a dynamic simulation. CHEMCAD has had many applications because of its suitability in the industry; additionally, CHEMCAD is equipped with an intuitive interface and integrated modules. It completes daily tasks faster, increases productivity, and streamlines processes used in smaller projects to improve work flow. Aspen HYSYS is the appropriate engineering tool in separation of the Nigerian reservoir fluid. It has a wide spectrum of different applications. There is no inherent directionality of computation. The multiple recycles do not slow down convergence. HYSYS repeats solutions much faster, making it possible to deploy large, complex models in demanding situations such as online real-time optimization. The heat and material balance (HMB) generated by HYSYS is driving most industries to prefer HYSYS as the software used for oil processes. HYSYS is older than UniSim and is ahead in improving in the areas where UniSim lacks. Further versions are being introduced such as a glycol package, enhanced HYSYS amine, new hydraulic tool calculation, and so forth. Therefore, HYSYS still has the upper hand in the calculation of phase properties. No study has been done to compare all of these software(s) regarding the separation of reservoir fluids, but HYSYS gives quite close value to the actual plant condition [4,7]. Therefore, this research employs the use of HYSYS and compares the work of [4] which has previously compared CHEMCAD and UniSim in the separation of reservoir fluids. Some factors that affect separation and must be determined before the design of a separator are: the flow rates of gas and liquid; the operating and design temperatures and pressures [8]; the tendencies of the feed streams to surge or slug; fluid physical properties like density and compressibility factor; the designed degree of separation; presence of impurities, foaming, and corrosive tendencies of the fluids [9]. An increase in mixture velocity will cause phase separation to slow down and as a result, it will require a very high weir. Also, there will be better phase separation when the difference between phases is high [10]. Generally, a large gas volume fraction would be advantageous to the efficiency of separation but the increased water content will reduce the viscosity of the mixture significantly, hence favoring the separation and ensuring that the separation of the natural gas will be easier since the oil fraction is decreased [11]. The purity of the oil product increases as residence time of the oil phase increases; this is because higher residence time gives more time for the droplets and dispersions from the gas phase and the water phase to coalesce and further settle out from gravitational buoyancy [12]. The increase in separator temperature will increase gas production and reduce the methane concentration in the gas stream, whereas the increase in pressure will reduce the gas flow rate and increase the methane concentration in the gas stream. While the gas production outflow increases with increase in inflow, the inlet mass flow rate shows no effect on the methane concentration in the gas stream. Therefore, pressure and temperature have a significant effect on gas production [13] and sufficient pressure difference should be maintained to ensure high separation [14].
The selection process of thermodynamic models is guided by considering the following: process components and composition, ranges at which pressure and temperature are operated, phases involved in the system, nature of the fluids, and data available [15]. By implementing constant and temperature-dependent binary interaction parameters in the van der Waals mixing rule, the Peng–Robinson cubic equation of state can be used to calculate phase equilibrium properties, which are peculiar to the hydrocarbon mixtures. These phase properties are applied in the operation of all kinds of hydrocarbon equipment, such as high-pressure separators. Thus an appropriate phase separation for any mixture of nonpolar or mildly polar hydrocarbon mixtures with components up to the number found in the Nigerian reservoir fluid can result in viable separations. Compared to other equations of states, where complex calculations require parameters that can be calculated only experimentally, the prediction of phase separation requires solving models using complex equations. The Peng–Robinson is one where cubic equations of state-based models [16,17,18] use the same set of equations which are solved for both liquid and vapor phase. Also, accurate simulation simply requires a few parameters, such as critical temperature, critical pressure, and acentric factor, to calculate various phase equilibrium properties. Although Soave uses cubic equations too, generally, the Peng–Robinson cubic equation of state is preferred over the Soave–Redlich–Kwong cubic equation of state, as it more accurately predicts liquid phase properties of the reservoir fluid examined in this work. It also calculates off-beat compositions of hydrocarbon mixtures. The suitability of Peng–Robinson in the simulation of some other reservoir fluids is discussed over the Soave–Redlich–Kwong cubic equation of state [7,19].
Ref. [20] reported that the geothermal gradient in the Nigerian reservoir ranges from 1.3 to 5.5 °C/100 m in the Niger Delta and the value extended to 7.6 °C/100 m in the recently found Sokoto Basin. Due to this wide range, the reservoir types are yet to be generalized in Nigeria. A few of them are of different types such as Akpet GT9 and GT12 reservoirs, which are gas condensate and black oil, respectively [21]. A black oil reservoir was reported by [22], but [23] reviewed that the Niger Delta is characterized by very low non-hydrocarbon content with less than 0.5% S content, while the N and CO2 are less than 1%. Generalizing the feed stream specification before simulation is equally a stiff challenge. Hence the mathematical procedure that provides clues on how to affect the separation of phases is yet to be understood for the Nigerian reservoir because of the limited information of mathematical equations which express the code running. However, an attempt has been made in this work to explain that separations are affected based on equations which start from van der Waals up till where convergence tolerance for different phases is inputted as restrictions for fugacity and fugacity coefficient of vapor phase and liquid phases of all components which clearly distinguish the phases. This work, however, has been limited to the use of Aspen HYSYS v.8.8. Before running the simulation to the point of convergence, every step before it was probed so that the ability and performance of the separation algorithm could be repeatable. Flow rate data were extracted and compared with the work of [4] to identify appropriate values for each required parameter, and a tuning stage was obtained for the reservoir fluid. Space restrictions were considered and calculation of fugacity was given preference to present all data regarding the separation of reservoir fluid, since it is the main focus of this manuscript.
2. Methodology
The Aspen HYSYS flow sheet developed for the separation of Nigerian reservoir fluid is presented in Figure 1. In order to introduce the adequate equation of state that runs the simulation of reservoir fluid, the process flow diagram was developed in a similar way to the work of Al-Mhana (2018). In specific terms, only the three-phase separator was targeted.
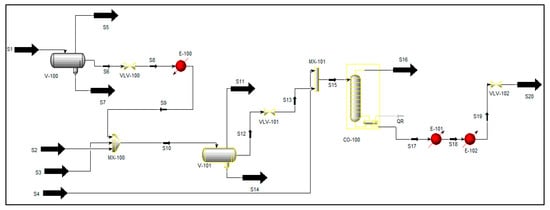
Figure 1.
A process flow diagram for the separation process of reservoir fluid developed using HYSYS.
2.1. Peng–Robinson Equation of State Applied to Calculate Feed Parameter
In describing nonideal vapor and liquid phases, Soave–Redlich–Kwong and Peng–Robinson equations of state (EOS) are the most popularly used thermodynamic models. In this research, the Peng–Robison equation of state was chosen over the Soave–Redlich–Kwong because the equation solves most single-phase, two-phase, and three-phase systems more efficiently and reliably. The enhancements made in the Peng–Robinson model ensure its accuracy for various systems over conditions of wide range. In Aspen HYSYS, the Peng–Robinson package is inclusive and enhanced binary parameters for all library pairs of hydrocarbon–hydrocarbon, and for most hydrocarbon–non-hydrocarbon binaries. HYSYS automatically generates the interaction parameters of hydrocarbon–hydrocarbon bond for hydrocarbon pseudo-components. Here the theoretical approach is used. It is stated as van der Waals equations and the Peng–Robinson equations are solved out until the fugacity parameter was clearly distinguished to be the phases of hydrocarbon fluid mixtures. However, the thermodynamic property method was implemented in HYSYS for the calculation of fugacity coefficient and convergence criteria.
Recalling the modified van der Waals equation of state (1873) is given by Equation (1):
where is the system total pressure, is molar volume, is the gas constant, is the number of moles, is the parameter that provides a pressure correction for the inter-molecular forces of attraction, and is the effective molar volume parameter for the correction of volume occupied by all hydrocarbon molecules in the mixture.
The presence of the hydrocarbon mixture requires including the molar volume of molecules in more than one state of matter as Equation (1) becomes Equation (2), as earlier deduced by Peng and Robinson (1976).
Stating Equation (2) terms of pressure, we obtain Equation (3):
together make up the attraction parameter, where is the temperature dependence parameter. Note that Equation (3) is an equation of state that assumes the conservation of temperature dependence of the attractive term. It also assumes the acentric factor which was introduced in [17] and presents a different fitting parameter which describes dependency on temperature.
The coefficients and were made functions of critical properties. By applying the conditions for criticality, we have two states of matter gas and oil clearly distinguished in Equations (4) and (5).
According to Naji [24], the coefficients 0.457235 and 0.077796 were best determined through regression in a manner that forces the condition of state to predict the phase behavior of the hydrocarbon mixture.
Also, is expressed in Equation (6) as:
where is the reduced temperature and can be calculated mathematically in Equation (7) as:
and are temperature of the system and critical temperature, respectively. Also, Equation (8) defines the term from Equation (6) as:
where is the acentric factor of the component . According to Al-Mhana [4], the acentric factor was used as a standard to characterize any single pure component as well as common properties such as critical pressure, critical temperature, critical volume, and molecular weight. Equation (6) is valid for acentric factor ≤0.49 noting that in HYSYS, for acentric factor >0.49, Equation (9) is used as a corrected form [25]:
By inspecting Equation (9), it is convenient to write Equation (10) as a cubic equation of state in terms of compressibility (z) to distinguish phases which are yet in physical mixtures:
The largest root is equivalent to the vapor phase compressibility, . The next z parameter takes the next dense phase, until the smallest positive root represents the compressibility of the heaviest liquid phase, .
The coefficients , , and from Equation (10) are defined in Equation (11) as:
and are the attraction and repulsion parameters, respectively, and are dimensionless, is the volume of the mixture, is the number of moles of component in the mixture, is the partial fugacity coefficient of component in the mixture for which Equation (12) was expressed thus:
is the partial fugacity of component in the mixture. Therefore, the thermodynamic expression for the partial fugacity of component in the mixture was derived for component in the vapor phase.
A similar expression for component in the liquid phase is shown in Equation (14):
The chemical potential was related to fugacity directly, then it follows that the fugacity of component in the mixture is equal in all phases of the mixture coexisting in equilibrium. That is, the fugacity of component in the vapor phase is equal to its fugacity in the liquid phase. Thus, it was expressed simply in Equation (15) as:
where is the partial fugacity of component in the mixture.
Equation (15) can further be expressed in Equation (16) as:
and are the partial fugacity coefficient of component in the vapor phase and liquid phase, respectively. is the pressure of the mixture. and are the liquid and vapor phase, respectively.
According to Adewunmi [26], fugacity is very useful in multicomponent equilibrium which involves liquid and vapor equilibrium. It is also useful in predicting the reaction state and the final phase of multicomponent mixtures at different pressures and temperatures without carrying out laboratory experiments. It helps to handle deviations from nonideal situations in the simulation/calculations.
Equation (17) gives the expression of the equilibrium constant of component .
2.2. Computation and Procedure
Applicable to the three phases, [24] described flash calculations as the process whereby the liquid and vapor mole fractions are calculated at prevailing temperature and pressure when the overall composition of a hydrocarbon mixture is given. The constraints for the liquid and vapor mole fractions, and , respectively, must be included.
Naji [24] reported that several methods can be used to solve the Rachford–Rice equation, some of which are: bisection, Newton–Raphson bisection, secant, false position, and Brent’s method. He also reported that among all the root-finding methods mentioned before, Brent’s method was the only method that gave roots of that are physically acceptable. This was as a result of using several methods to extensively solve the resulting equation of the flash calculation (134 oil samples). The solution for these samples was at different pressures ranging from 100 to 10,000 psia at intervals of 5 psia. The Newton–Raphson method gives a rapid solution only when the behavior of the function is smooth. As a result, he recommended Brent’s method over the Newton–Raphson method for the solution of the Rachford–Rice equation.
It must be noted that if the Equations (1)–(17) must be used to run a separation, the pauses parameter must be obtained and the starting point is Equation (17) upward; for the purpose of this research, the sequential substitution iteration (SSI) algorithm was used as reported. The SSI flash computation process for solving , and was calculated as follows:
- Equilibrium ratios of the component were assumed from modified Wilson’s equation:where is the reduced pressure of component and is the reduced temperature likewise.
- was solved for by solving the Rachford–Rice Equation using Brent’s method [24].
- The mole fractions of component liquid and vapor were calculated respectively.
- Equation (10) was solved for the liquid and vapor phases compressibility, and .
- The fugacity and fugacity coefficients for both liquid and vapor phases for all components were calculated.
- values were updated using Equation (19):
- Steps ii to vi were repeated until Equation (20) was satisfied:where and are convergence tolerance for fugacity of fluid and vapor, respectively. is the fugacity of the liquid phase for component ; is the fugacity of the vapor phase for component .
First of all, the activity coefficient method was applied but no convergence was achieved because it is inappropriate for handling the reservoir fluid mixture under examination. The phase equilibrium data (estimated 21,880 kPa and 300 °C) were high for the activity coefficient method. Invariably, the activity coefficient approach (applicable to low pressures below 10 bar) did not work. This is because the binary parameters for the NRTL, UNIQUAC, and other models are known for adopting the activity coefficient approach [27]. Therefore the methodology adopted in this work is the thermodynamic property method, which is a collection of property calculation routes. This is simplified in HYSYS because the properties involved are needed by unit operation models. Under this approach, the temperature function (T, Omega) involving the temperature and acentric factor (omega) was used to replace temperature function of RK/Wilson (e.g., Equation (18)). Therefore, the fugacity of each phase turns out to be a suitable thermodynamic property for handling hydrocarbon mixtures with a wide range of components. Therefore, the Peng–Robinson model was used to simulate the separation of the hydrocarbon mixture itemized in Table 1.

Table 1.
Composition of feed stream and its component mole fractions, K-values, fugacity, mole fraction of the gas outlet stream and oil outlet stream.
2.3. Data and Convergence Criteria Used for Separating Reservoir Fluid
By engaging the Aspen HYSYS v8.8 package, the inlet feed composition was defined as presented in Table 1 for a typical Nigerian reservoir fluid. By using the calculations of the and as convergence tolerance for fugacity of fluid and vapor, respectively, the critical values of operating conditions of a three-phase separator adopted for the separation of the reservoir fluids are as follows: 43 °C was set for temperature, 8000 kPa was set for pressure, and feed molar flow rate was set to 1800.5 kg mol/h.
2.4. Separation Sensitivity Study
The sensitivity analysis of the separation process was carried out to determine the effects of varying the vessel’s pressure on the outflow of oil and gas as well as the methane mole fraction. The effects of inlet temperature and mass flow rate on molar flow of oil stream, molar flow rate of gas stream, and methane mole fraction in gas were investigated. The results obtained were used to deduce the efficiency of the separation with the operating conditions.
Phase envelopes were then obtained for gas and oil streams. The phase envelopes were generated using HYSYS. The Peng–Robinson model (or thermodynamics package) was used to obtain the critical point, the dew lines, and the boiling point lines of each stream (gas and oil).
3. Results and Discussion
Table 1 shows the inlet feed composition, the component mole fractions of the inlet feed stream, the separator outlet gas stream, and oil product stream. Also, it shows the calculated K-values and fugacity of feed components.
3.1. Effect of Vessel Pressure on Molar Flow Rate of Gas, Molar Flow Rate of Oil, and Methane Concentration in Gas Stream
Vapor pressure and boiling points of components are proportioned directly with the system’s pressure. Consequently, increasing the pressure will reduce the tendency of some substances to evaporate (e.g., they enter the separator at a temperature below its saturated temperature, i.e., reduce the chance to change its phase from liquid to vapor phase). The effect of feed stream pressure on vessel outlet flow rates is presented in Figure 2a. As the feed inlet pressure increased from 1000 to 8000 kPa, there was a corresponding decrease in the gas flow rate from 1213 to 908.6 kg mol/h. The increment in the pressure increases the boiling point of the reservoir fluid as a result of the increase in vapor pressure of the stream components. This trend is in agreement with the results obtained by Al-Mhanna [4]. Hence, only less vapor can be formed which implies that the vapor flow rate will decrease. For hydrocarbons, heavier molecules condense into the oil phase when there is an increase in pressure. Under this condition, the oil flow rate increased from 374 to 838 kg mol/h. The trend in pressure and flow rate of oil outlet of the separator is shown in Figure 2a.
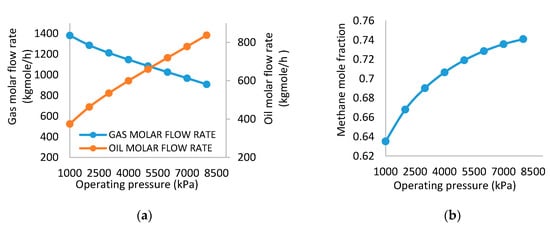
Figure 2.
(a) Effect of separator pressure on gas molar flow rate and oil molar flow rate. (b) Effect of separator pressure on methane mole fraction.
Therefore, an inversion behavior is expected if both (oil and gas molar flow rates) curves are plotted on the same graph. The methane fraction of the gas stream provides the quality of the gas stream since it is the desired component of a natural gas plant. The increase from 0.6902 to 0.7410 in the methane mole fraction occurred as the pressure increased from 1000 kPa to 8000 kPa as shown in Figure 2b. This supports the fact that the condensation of heavier molecules from the gas phase into the oil phase causes an increase in the concentration of methane in the gas stream. According to [11], gas fraction in the gas outlet is an indicator of the efficiency of the separation.
3.2. Effect of Inlet Temperature on Molar Flow Rate of Gas, Molar Flow Rate of Oil, and Methane Concentration in Gas Stream
Increasing the inlet stream temperature decreases the oil mass flow rate because some of the hydrocarbons reach their saturation temperature at the operating pressure (i.e., they evaporate and go into the gas phase). Therefore, a reduction in the oil production is expected while an increase in the produced gas quantity happens (i.e., the temperature variation from 13 to 83 °C causes the flow rate of the gas to change from 707.4 to 1111 kg mol/h). An opposite trend is observed for the oil gas flow rate as shown in Figure 3a. Hydrocarbons gain energy as temperature increases. Consequently, more of the lighter hydrocarbons vaporize into the gas phase which therefore leads to reduction of the molar flow rate of the oil. Besides maintaining pressure long enough [14], according to Hajivand and Vaziri [28], higher temperature supports destabilization effects caused by Brownian motion leading to decrease in interfacial viscosity, hence separation becomes easy due to density and polarity differences. Again, this assertion is applicable to efficient separation between oil–water mixtures.
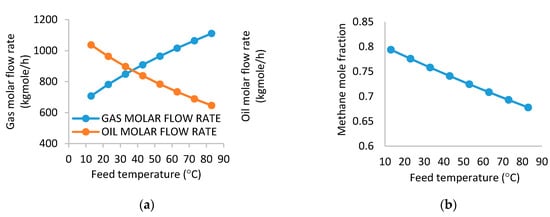
Figure 3.
(a) Effect of temperature on gas molar flow rate and oil molar flow rate. (b) Effect of separator temperature on methane mole fraction.
Thus, Figure 3a shows an inversion in the behavior of gas and oil curves. Figure 3b shows a drop in the methane concentration from 0.7939 to 0.6778 when the temperature raises from 13 to 83 °C. This is due to the vaporization of heavier molecules leading to the reduction of the concentration of methane in the gas stream. Beyond the optimum operating condition, an increased temperature renders the separator to be less efficient because of the escape of heavier fractions from the oil phase into the gas phase causing the gas stream to contain heavier hydrocarbon components, which may affect gas processing and higher cost for energy may be incurred to raise temperatures.
3.3. Effect of Inlet Feed Mass Flow Rate on Molar Flow Rate of Gas, Molar Flow Rate of Oil, and Methane Concentration in Gas Stream
Figure 4a,b presents the results obtained from the variation of the feed mass flow rate on the molar flow rate of the gas, molar flow rate of the oil, and mole fraction of methane in the gas stream, while the temperature, pressure, and feed composition were kept constant.
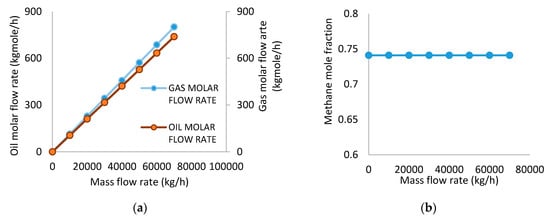
Figure 4.
(a) Effect of inlet mass flow rate on gas molar flow rate and oil molar flow rate. (b) Effect of inlet mass flow rate on methane mole fraction.
Thus, the simulation proceeded at fixed temperature (61 °C) and pressure (4115 kPa). At this specified condition, the methane mole fraction was constant while the inlet flow rate was varied from 10,000 kg/h to 70,000 kg/h. Consequently, a significant increase in the molar flow rate of both gas and oil flow rates was observed. This is an indication that the separator has the capacity to accommodate an increase in the inlet mass flow. According to Famisa, [12], separator efficiency decreases with increasing flow rate because impurities in and across outlet streams increase. Nevertheless, Liang et al. [11] explained that high flow rate will lead to high centrifugal force and hence, a better separation will occur. It should be noted, however, that the latter worked on a vertical three-phase separator and [12] simulated a horizontal three-phase separator, thus orientation of the separator may have an influence on the effect of the flow rate. Figure 4b presents the constant mole fraction of methane which occurred at separation. This implies that the outlet methane mole fraction is not a function of the inlet mass flow at the operating condition of 61 °C and 4115 kPa. This is not the optimum operating condition but at some points a similar trend was discussed in the work of Zeng et al. [14].
3.4. Phase Envelopes for Feed Stream, Gas Outlet, and Oil Outlet
The phase envelope assists in determining the optimum operating conditions since it shows the pressure and corresponding temperature at which a single phase or two phases may exist, hence, providing data that allow for efficient design. Figure 5 presents the phase envelope generated for the feed stream. The phase envelope diagram indicates that the cricondentherm is 283.6 °C at a pressure of 6235 kPa, while the cricondenbar is 2.189 × 10⁴ kPa at a temperature of 131.9 °C. Moreover, the critical point is approximately at 182.8 °C and 2.072 × 10⁴ kPa. The phase envelope also shows that the separator was operated within the two-phase region of the feed stream. Separators operating beyond the dew point line at constant pressure and increased temperature will result in the components of the oil phase being completely taken up into the gas phase. On the other hand, if the operating condition is at pressures beyond the bubble point line at constant temperature, then there will only exist the oil phase. Therefore, the optimum operating conditions of the separator will be located within the two-phase region for optimum recovery of gas and oil.
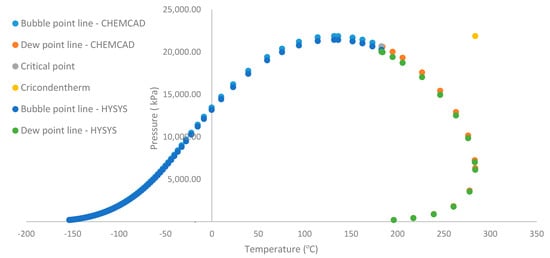
Figure 5.
Feed stream phase envelope drawn by HYSYS and CHEMCAD.
Figure 5 shows the phase envelope of the feed stream by using both HYSYS and CHEMCAD. The cricondentherm is located at 283.8 °C while the cricondenbar is located at 21,880.8 kPa. Moreover, the two-phase critical temperature is located at 182.7 °C while the two-phase critical pressure is 20,674.5 kPa. Figure 6 shows the gas stream phase envelope, where the operating condition of 8000 kPa and 43 °C lies on the dew point line. Any change in temperature either to the left or to the right will cause a phase change that leads to a corresponding change in the rate of gas flow. The cricondentherm for gas stream generated by HYSYS is 63.34 °C at a pressure of 2455 kPa. At this point, pressure change has no effect on the gas production since it is the maximum temperature on the phase envelope. From the phase envelope generated for the oil phase of the Nigerian reservoir, it can be observed that the operating condition of 43 °C and 8000 kPa falls on the bubble point line. Therefore, there is an indication that phase change will occur if there is a change in either the pressure or the temperature, which will consequently affect the rate of oil production. At cricondenbar (25 × 103 kPa at 193.3 °C), there is no effect of temperature on the oil production rate. It also gives an idea for further processing of the oil phase. For instance, in a medium-pressure separator, pressure must be selected alongside temperature in such a way that ensures the oil phase has the right fraction for stability in either the low-pressure separator or storage tank which is generally operated at atmospheric conditions. The separation of the hydrocarbon mixture was achieved with an added advantage of having maximum recovery of condensate from the hydrocarbon mixture. Therefore, both qualitative and quantitative output which are usually measured in terms of gas oil ratio (GOR), oil formation volume factor (Bo) and Americal petroleum Institute (API) can be attained. Thus the optimum condition provided in this work will be used by the industry to calculate maximum yield (that is minimal GOR and Bo) and the quality of oil can be maximized (maximum stock tank API).
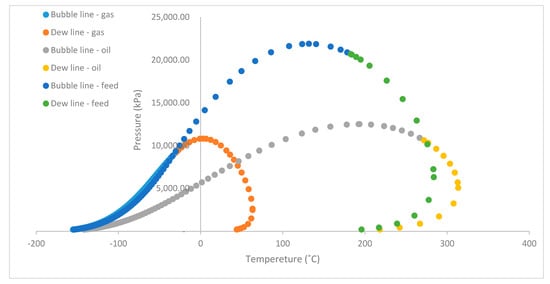
Figure 6.
Phase envelopes of feed stream, gas stream, and oil stream obtained from HYSYS.
3.5. Validation of the Molar Flow Rates of Oil and Gas
The separation into phases was achieved by appropriating the equation of state to obtain an operating point that optimizes the molar flow rates of oil and gas. Figure 2 presents the pressure change from 1000 to 8000 kPa, which causes an increase in the molar flow rate of oil from 374.9 to 838 kg mol/h. Furthermore, the temperature range of 13–83 °C increases the gas molar flow rate from 707.4 to 1111 kg mol/h as shown in Figure 3, which is in agreement with the work of [4]. The process flow of [4] was the simulation method adopted to validate the outlet flow rate of the gas and oil component for the Nigerian crude oil. Figure 7 suggests that the CHEMCAD and the HYSYS can run models that allow for separation of multiphase mixtures of hydrocarbon. This means it is possible to meet the challenges associated with modeling systems directly relevant to oil processing facilities. This model may have application in the separation of biofuels [29].
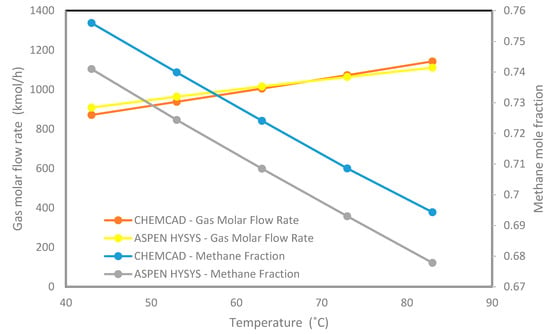
Figure 7.
The produced methane mole fraction and the gas molar flow rate in CHEMCAD and Aspen HYSYS.
Figure 7 shows that increasing the operating temperature from 43 °C to 83 °C moves the gas flow rate from 871.15 to 1142.98 kmol/h and from 908.6 to 1111 kmol/h by using CHEMCAD and Aspen HYSYS, respectively. These increments in gas flow rates are due to the vaporization of hydrocarbons as the temperature tends to 83 °C, the saturation temperature of the fluid reached in the separator. This is an indication that the outlet vapor flow rate is dependent on inlet temperature, having a low range of methane fraction which is from 0.75 to 0.69 (CHEMCAD) and from 0.7410 to 0.6778 (Aspen HYSYS). It is also an indication that the mole fractions obtained from both simulations are in agreement.
The 0.74 mole fraction of the methane is produced and maintained by using an inlet mass flow rate of 10,000 to 70,000 kg/h as seen in Figure 4. The trends of gas molar flow rate and oil flow rate are in agreement with [4]. Similarly, the preheater heating duty exhibits a direct relationship with the inlet feed rate. Hence, the heating duty increased from 11.47 to 18.48 GJ/h in both software packages. In [4], when the feed flow was changed from 95.97 × 10³ to 154.56 × 10³ kg/h, a remarkable improvement in the heating duty of the liquid hydrocarbons was observed in the HP separator. Thus the separator requires more energy to keep the process temperature constant. Therefore, with a moderate feed rate maintained, the predetermined oil and gas molar flow can be maintained using the substantiated data included in this research.
Figure 8 shows the mole fractions of the outlet stream components (gas and oil streams) that are obtained by using the simulators and are compared with the plant data, which are provided from the separator. In this separator, the pressure of the fluids is controlled by the back-pressure regulator, while the temperature is regulated by the expansion of the fluid through a choke passing heat. The validated results suggest that the separators can be improved to handle fluids according to the fluid composition. The compositions of the lighter hydrocarbons (methane–pentane) obtained from software are slightly higher than those of the plant data, while the compositions of the heavier hydrocarbons (n-C4–n-C19) match exactly the plant data. Overall, they are both in agreement because the volatile mole fractions are unstable in Nigerian separators because of the extreme atmospheric temperatures in the daytime. Therefore, light components such as methane and ethane can be flashed off to stabilize the process, leaving only heavier hydrocarbon with lower vapor pressure. Although the product quality obtained by simulation is generally similar to the actual data with very small variation, there are no influences on the product purity. This agreement between the simulated mole fractions and plant data was expected because Peng–Robinson EOS was employed in both simulations.
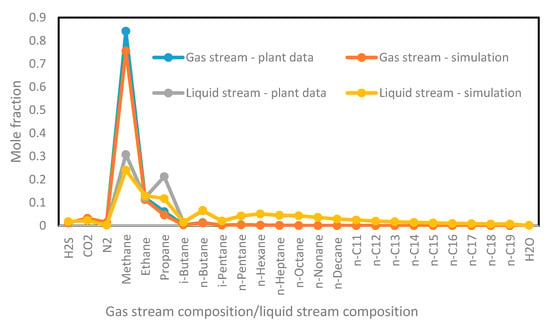
Figure 8.
The composition of outlet gas and liquid streams for simulations and plant data.
4. Conclusions
It can be concluded that gas molar flow rate depends on pressure and temperature of the separator. For the gas liquid phase equilibrium in the separator, the thermodynamic relationship of the fugacity of each component in the mixture was expressed in the models and used for phase distinction. Consequently, the expressions carrying the number of molecules with higher tendencies to leave liquid phase were applied in Aspen HYSYS appropriately. The thermodynamic property method fits well for handling the separation of the reservoir fluid with a wide range of components. Therefore, the fluid properties from P-V-T relations were substantiated for industrial application. By using the same composition of inlet fluid stream, the product stream mole fractions were within the range that was reported by using CHEMCAD. The consistency in the critical region of the phase diagram distinguishes both the vapor and liquid phases (i.e., the obtained mole fraction values). The operating parameters presented are values that fix the dew point and bubble point for the gas and oil outlet streams, respectively, and any value below or above critical points is unstable. Both CHEMCAD and Aspen HYSYS software can be used to address the challenges associated with modeling systems involving the separation of oil and gas in the industry.
Author Contributions
A.G.O.—Writing—original draft; N.M.A.-M.—Data curation; M.D.Y. and E.A.A.—Resources; M.K.O.—Validation. All authors have read and agreed to the published version of the manuscript.
Funding
This work was supported by the Petroleum Technology Development Fund (PTDF, Nigeria).
Data Availability Statement
The data presented in this study are available on request from the corresponding author.
Conflicts of Interest
The authors declare no conflict of interest.
Nomenclature
| attraction parameter | |
| repulsion parameter | |
| parameter that provides a pressure correction for the intermolecular forces of attraction, J.m3.mol−2 | |
| temperature dependence parameter | |
| effective molar volume parameter for the correction of volume, m3.mol−1 | |
| convergence tolerance for fugacity of fluid | |
| convergence tolerance for fugacity of vapor | |
| fugacity, kPa | |
| partial fugacity of component | |
| equilibrium constant of component | |
| liquid phase | |
| number of moles | |
| system total pressure, kPa | |
| reduced pressure | |
| critical pressure | |
| gas constant, kPa m3.mol−1 °C−1 | |
| temperature of the system, °C | |
| critical temperature | |
| reduced temperature | |
| molar volume, m3 kgmol−1 | |
| vapor phase | |
| acentric factor of the component | |
| liquid mole fraction of component, | |
| vapor mole fraction of component, | |
| fugacity coefficient | |
| Compressibility | |
| compressibility of the heaviest liquid phase | |
| vapor phase compressibility | |
| overall hydrocarbon composition of component | |
| GOR | gas–oil ratio |
| Bo | oil formation volume factor |
| API | American Petroleum Institute |
| Legend for Figure 1 | |
| S1 | Combined Plant Feed |
| S2 | Condensate from H2S Recycle Unit |
| S3 | Condensate from MP Separator Scrubber |
| S4 | From MP Compressor Suction Scrubber |
| S5 | HP Separator Gas |
| S6 | HP Separator Oil |
| S7 | HP Separator Sour Water |
| S8 | Oil to Preheat |
| S9 | Preheated Oil |
| S10 | MP Separator Feed |
| S11 | Gas to MP Compressor Suction Scrubber |
| S12 | MP Separator Oil |
| S13 | MP Separator Oil-1 |
| S14 | Sour Water to Sour Water Stripper |
| S15 | Stabilizer Feed |
| S16 | Gas to LP Compressor |
| S17 | Crude from Stabilizer |
| S18 | Stabilized Crude (from E-101) |
| S19 | Stabilized Crude (from E-102) |
| S20 | Stabilized Crude to Product Oil Tank |
| V-100 | HP Separator |
| VLV-100 | Valve 1 |
| E-100 | MP Separator Preheater |
| MX-100 | Mixer 1 |
| V-100 | MP Separator |
| VLV-101 | Valve 2 |
| MX-101 | Mixer 2 |
| CO-100 | Crude Stabilizer Column |
| E-101 | Air Cooler |
| E-102 | Stabilized Run Down Cooler |
| VLV-102 | Valve 1 |
References
- Engineering, P. Crude Oil Processing on Offshore Facilities. 2018. Available online: http://www.piping-engineering.com/crude-oil-processing-offshore-facilities.html (accessed on 30 May 2020).
- Jadoon, S.; Malik, A. Separation of Sediment Contents and Water from Crude Oil of Khurmala and Guwayer Oil Fields in Kurdistan Region by using Centrifuge Method. Int. J. Adv. Eng. Res. Sci. 2017, 4, 192–194. [Google Scholar] [CrossRef]
- Mahmoud, M.; Tariq, Z.; Kamal, M.S.; Al-Naser, M. Intelligent prediction of optimum separation parameters in the multistage crude oil production facilities. J. Pet. Explor. Prod. Technol. 2019, 9, 2979–2995. [Google Scholar] [CrossRef]
- Al-Mhanna, N.M. Simulation of High Pressure Separator Used in Crude Oil Processing. Processes 2018, 6, 219. [Google Scholar] [CrossRef]
- Casavant, T.E.; Côté, R.P. Using chemical process simulation to design industrial ecosystems. J. Clean. Prod. 2004, 12, 901–908. [Google Scholar] [CrossRef]
- Kylling, Ø.W. Optimizing Separator Pressure in a Multistage Crude Oil Production Plant (Issue Jul7); Norwegian University of Science and Technology: Trondheim, Norway, 2009. [Google Scholar]
- Wang, Y.; Shang, D.; Yuan, X.; Xue, Y.; Sun, J. Modeling and Simulation of Reaction and Fractionation Systems for the Industrial Residue Hydrotreating Process. Processes 2019, 8, 32. [Google Scholar] [CrossRef]
- Le, T.T.; Lim, Y.-I.; Park, C.-K.; Lee, B.-D.; Kim, B.-G.; Lim, D.-H. Effect of ship motion on separation efficiency in crude oil separator with coalescer. In Computer Aided Chemical Engineering; Elsevier: Eindhoven, The Netherlands, 2018; Volume 44. [Google Scholar] [CrossRef]
- Stewart, M.; Arnold, K. Gas-Liquid and Liquid-Liquid Sparators; Gulf Professional Publishing: Houston, TX, USA, 2008. [Google Scholar]
- Abdulkadir, M.; Hossain, M.; Modelling of Oil-Water Separator Using Computational Fluid Dynamics (CFD). July 2010. Available online: http://hdl.handle.net/2263/44920 (accessed on 30 June 2020).
- Liang, Y.; Zhao, S.-Q.; Jiang, X.-X.; Jia, X.-Q.; Li, W. Numerical Simulation on Flow Field of Oilfield Three-Phase Separator. J. Appl. Math. 2013, 2013, 1–6. [Google Scholar] [CrossRef]
- Famisa, R.B. HYSYS Modelling of a Horizontal Three-Phase Subsea Separator (Issue July) [Norwegian University of Science and Technology]. 2016. Available online: http://hdl.handle.net/11250/2424067 (accessed on 30 June 2020).
- Edwards, J.E. Process Modelling Selection of Thermodynamic Methods; P & I Design Ltd: Thornaby, UK, 2008; Available online: www.pidesign.co.uk (accessed on 15 May 2020).
- Zeng, X.; Zhao, L.; Zhao, W.; Hou, M.; Zhu, F.; Fan, G.; Yan, C. Experimental study on a compact axial separator with conical tube for liquid-liquid separation. Sep. Purif. Technol. 2021, 257, 117904. [Google Scholar] [CrossRef]
- Tillman, D.A.; Duong, D.N.B.; Harding, S.N. Solid Fuel Blending: Principles, Practices, and Problems, 1st ed.; Butterworth-Heinemann: London, UK, 2012. [Google Scholar]
- Piña-Martinez, A.; Privat, R.; LaSala, S.; Soave, G.; Jaubert, J.-N. Search for the optimal expression of the volumetric dependence of the attractive contribution in cubic equations of state. Fluid Phase Equilibria 2020, 522, 112750. [Google Scholar] [CrossRef]
- Soave, G. Equilibrium Constants from a Modified Redkh-Kwong EOS. Chem. Eng. Sci. 1972, 27, 1197–1203. Available online: http://dns2.asia.edu.tw/~ysho/YSHO-English/2000 Engineering/PDF/Che Eng Sci27, 1197.pdf (accessed on 12 June 2020). [CrossRef]
- Peng, D.-Y.; Robinson, D.B. A New Two-Constant Equation of State. Ind. Eng. Chem. Fundam. 1976, 15, 59–64. [Google Scholar] [CrossRef]
- Smith, J.M.; Van Ness, H.C.; Abbott, M.M. Introduction to Chemical Engineering Thermodynamics, 7th ed.; McGraw-Hill: New York City, NY, USA, 2005. [Google Scholar]
- Olufemi, O.; Bello, O.; Olaywiola, O.; Teodoriu, C.; Salehi, S.; Osundare, O. Geothermal Heat Recovery from Matured Oil and Gas Fields in Nigeria–Well Integrity Considerations and Profitable Outlook. 2020. Available online: https://pangea.stanford.edu/ERE/db/GeoConf/papers/SGW/2020/Bello.pdf (accessed on 15 May 2020).
- Sylvester, O.; Samuel, O.; Bibobra, I. PVT Analysis Reports of Akpet GT9 and GT12 Reservoirs. Am. J. Manag. Sci. Eng. 2017, 2, 132. [Google Scholar] [CrossRef][Green Version]
- Obomanu, D.A.; Okpobiri, G.A. Correlating the PVT Properties of Nigerian Crudes. J. Energy Resour. Technol. 1987, 109, 214–217. [Google Scholar] [CrossRef]
- Ikiensikimama, S.S.; Ogboja, O. Review Of PVT Correlations For Crude Oils. Glob. J. Pure Appl. Sci. 2008, 14, 331–337. [Google Scholar] [CrossRef]
- Naji, H.S. Conventional and rapid flash calculations for the soave-redlich-kwong and peng-robinson equations of state. Emir. J. Eng. Res. 2008, 13, 81–91. [Google Scholar]
- ASPENTECH INCORPORATIONS, Aspen Hysys V 8.8. Available online: https://www.scribd.com/document/362669425/Hysys-8-8-Manual (accessed on 10 June 2020).
- Adewumi, M. Acentric Factor and Corresponding States. PNG 520 Phase Reelations in Reservoir Engineering. 2018. Available online: www.e-education.psu.edu/png520/m8_p3.html (accessed on 20 January 2020).
- Poling, B.E.; Prausnitz, J.M.; O’connell, J.P. The Properties of Gases and Liquids; Mcgraw-Hill: New York, NY, USA, 2001; Volume 5, pp. 8–17. [Google Scholar]
- Hajivand, P.; Vaziri, A. Optimization of demulsifier formulation for separation of water from crude oil emulsions. Braz. J. Chem. Eng. 2015, 32, 107–118. [Google Scholar] [CrossRef]
- Abdulsalam, Y.O.; Abdulkareem, A.S.; Uthman, H.; Afolabi, A.E.; Olugbenga, A.G. Thermo-economic analy-sis of PEM fuel cell fuelled with biomethane obtained from human waste by computer simulation. Sci. Afr. 2020, 9, e00485. [Google Scholar]
Publisher’s Note: MDPI stays neutral with regard to jurisdictional claims in published maps and institutional affiliations. |
© 2021 by the authors. Licensee MDPI, Basel, Switzerland. This article is an open access article distributed under the terms and conditions of the Creative Commons Attribution (CC BY) license (http://creativecommons.org/licenses/by/4.0/).