Article

Screening of Ion Exchange Resins for Hazardous Ni(II) Removal from Aqueous Solutions: Kinetic and Equilibrium Batch Adsorption Method

by
Anna Wołowicz
* and
Monika Wawrzkiewicz
Department of Inorganic Chemistry, Institute of Chemical Sciences, Faculty of Chemistry, Maria Curie-Sklodowska University in Lublin, M. Curie-Sklodowska Sq. 2, 20-031 Lublin, Poland
*
Author to whom correspondence should be addressed.
Processes 2021, 9(2), 285; https://doi.org/10.3390/pr9020285
Submission received: 11 January 2021 / Revised: 29 January 2021 / Accepted: 29 January 2021 / Published: 2 February 2021
(This article belongs to the Special Issue Various Adsorbents for Water Purification Processes)

Abstract

:
The development of new, cheaper, and more effective technologies to decrease the amount of wastewater containing heavy metals and to improve the quality is indispensable. Adsorption has become one of the alternative treatment methods. A small number of studies focusing on the batch technique for nickel ion removal by the new generation ion exchangers are described in the literature. In this paper, the Ni(II) removal from aqueous solutions using the ion exchange resins of different types was investigated. The experiments were conducted at different HCl and HCl/HNO3 concentrations, and the initial concentration was 100 mg Ni(II)/L. The investigation of the Ni(II) desorption from the chosen resins were carried out. The Ni(II) removal efficiency and the rate of removal are shown on the kinetic curves and the rate constants as well as kinetic parameters were collected and compared. The isotherm parameters were calculated and Fourier-transform infrared spectroscopy with the attenuated total reflection spectra was performed to determine the nature of adsorption. The experimental results showed that the Ni(II) percentage removal is high and Lewatit MonoPlus TP220 could be an alternative for the treatment of nickel(II) containing wastewaters.

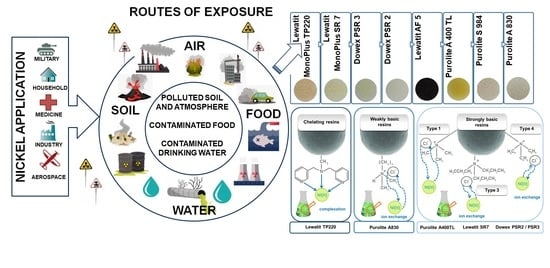
Graphical Abstract

1. Introduction

Nickel is widely distributed in the environment, and can be found in water, air, soil, or food because of its natural occurrence in nature and anthropogenic origin (Figure 1). It is the 24th most abundant metal in the earth’s crust and accounts for about 3% of the earth’s composition [1,2]. The natural sources of atmospheric nickel include dusts from volcanic emissions, meteoric dust, weathering of soils and rocks, forest fires, and sea salt spray [3,4]. From 30% to 50% of natural Ni sources are generated by soil particles moved by wind, blown from eroded areas [5], whereas almost 90% of the global anthropogenic Ni emissions are generated by oil combustion [6]. About 6–20 ng/m3 of nickel is present in ambient air, whereas air contaminated by anthropogenic sources could include 150 ng/m3 of nickel [4]. Solubilization of nickel compounds from soils as well as biological cycles are the main sources of nickel in water [3]. The content and mobility of nickel in soils depends on its compound solubility, pH, and soil types [3]. At pH < 6.5, nickel compounds are soluble in water, whereas at above pH > 6.7, insoluble hydroxides are usually present. Nickel salts such as chloride, nitrate, and sulfate (salts of strong acids, organic acids) are soluble in water, whereas metallic nickel, nickel sulfides, and nickel oxides, as well as nickel salts of weak inorganic acids, are poorly water-soluble [4]. Moreover, the use of pesticides and fertilizer increases the nickel content in soils and could be a source of heavy metals in food.
The nickel content in farm soils is in the range from 3 to 1000 mg Ni/kg, soil but in the soils collected near to metal refineries it could be much higher; in the range from 24,000 to 53,000 mg/kg [3]. The nickel contents in different areas of the environment are presented in Table 1.
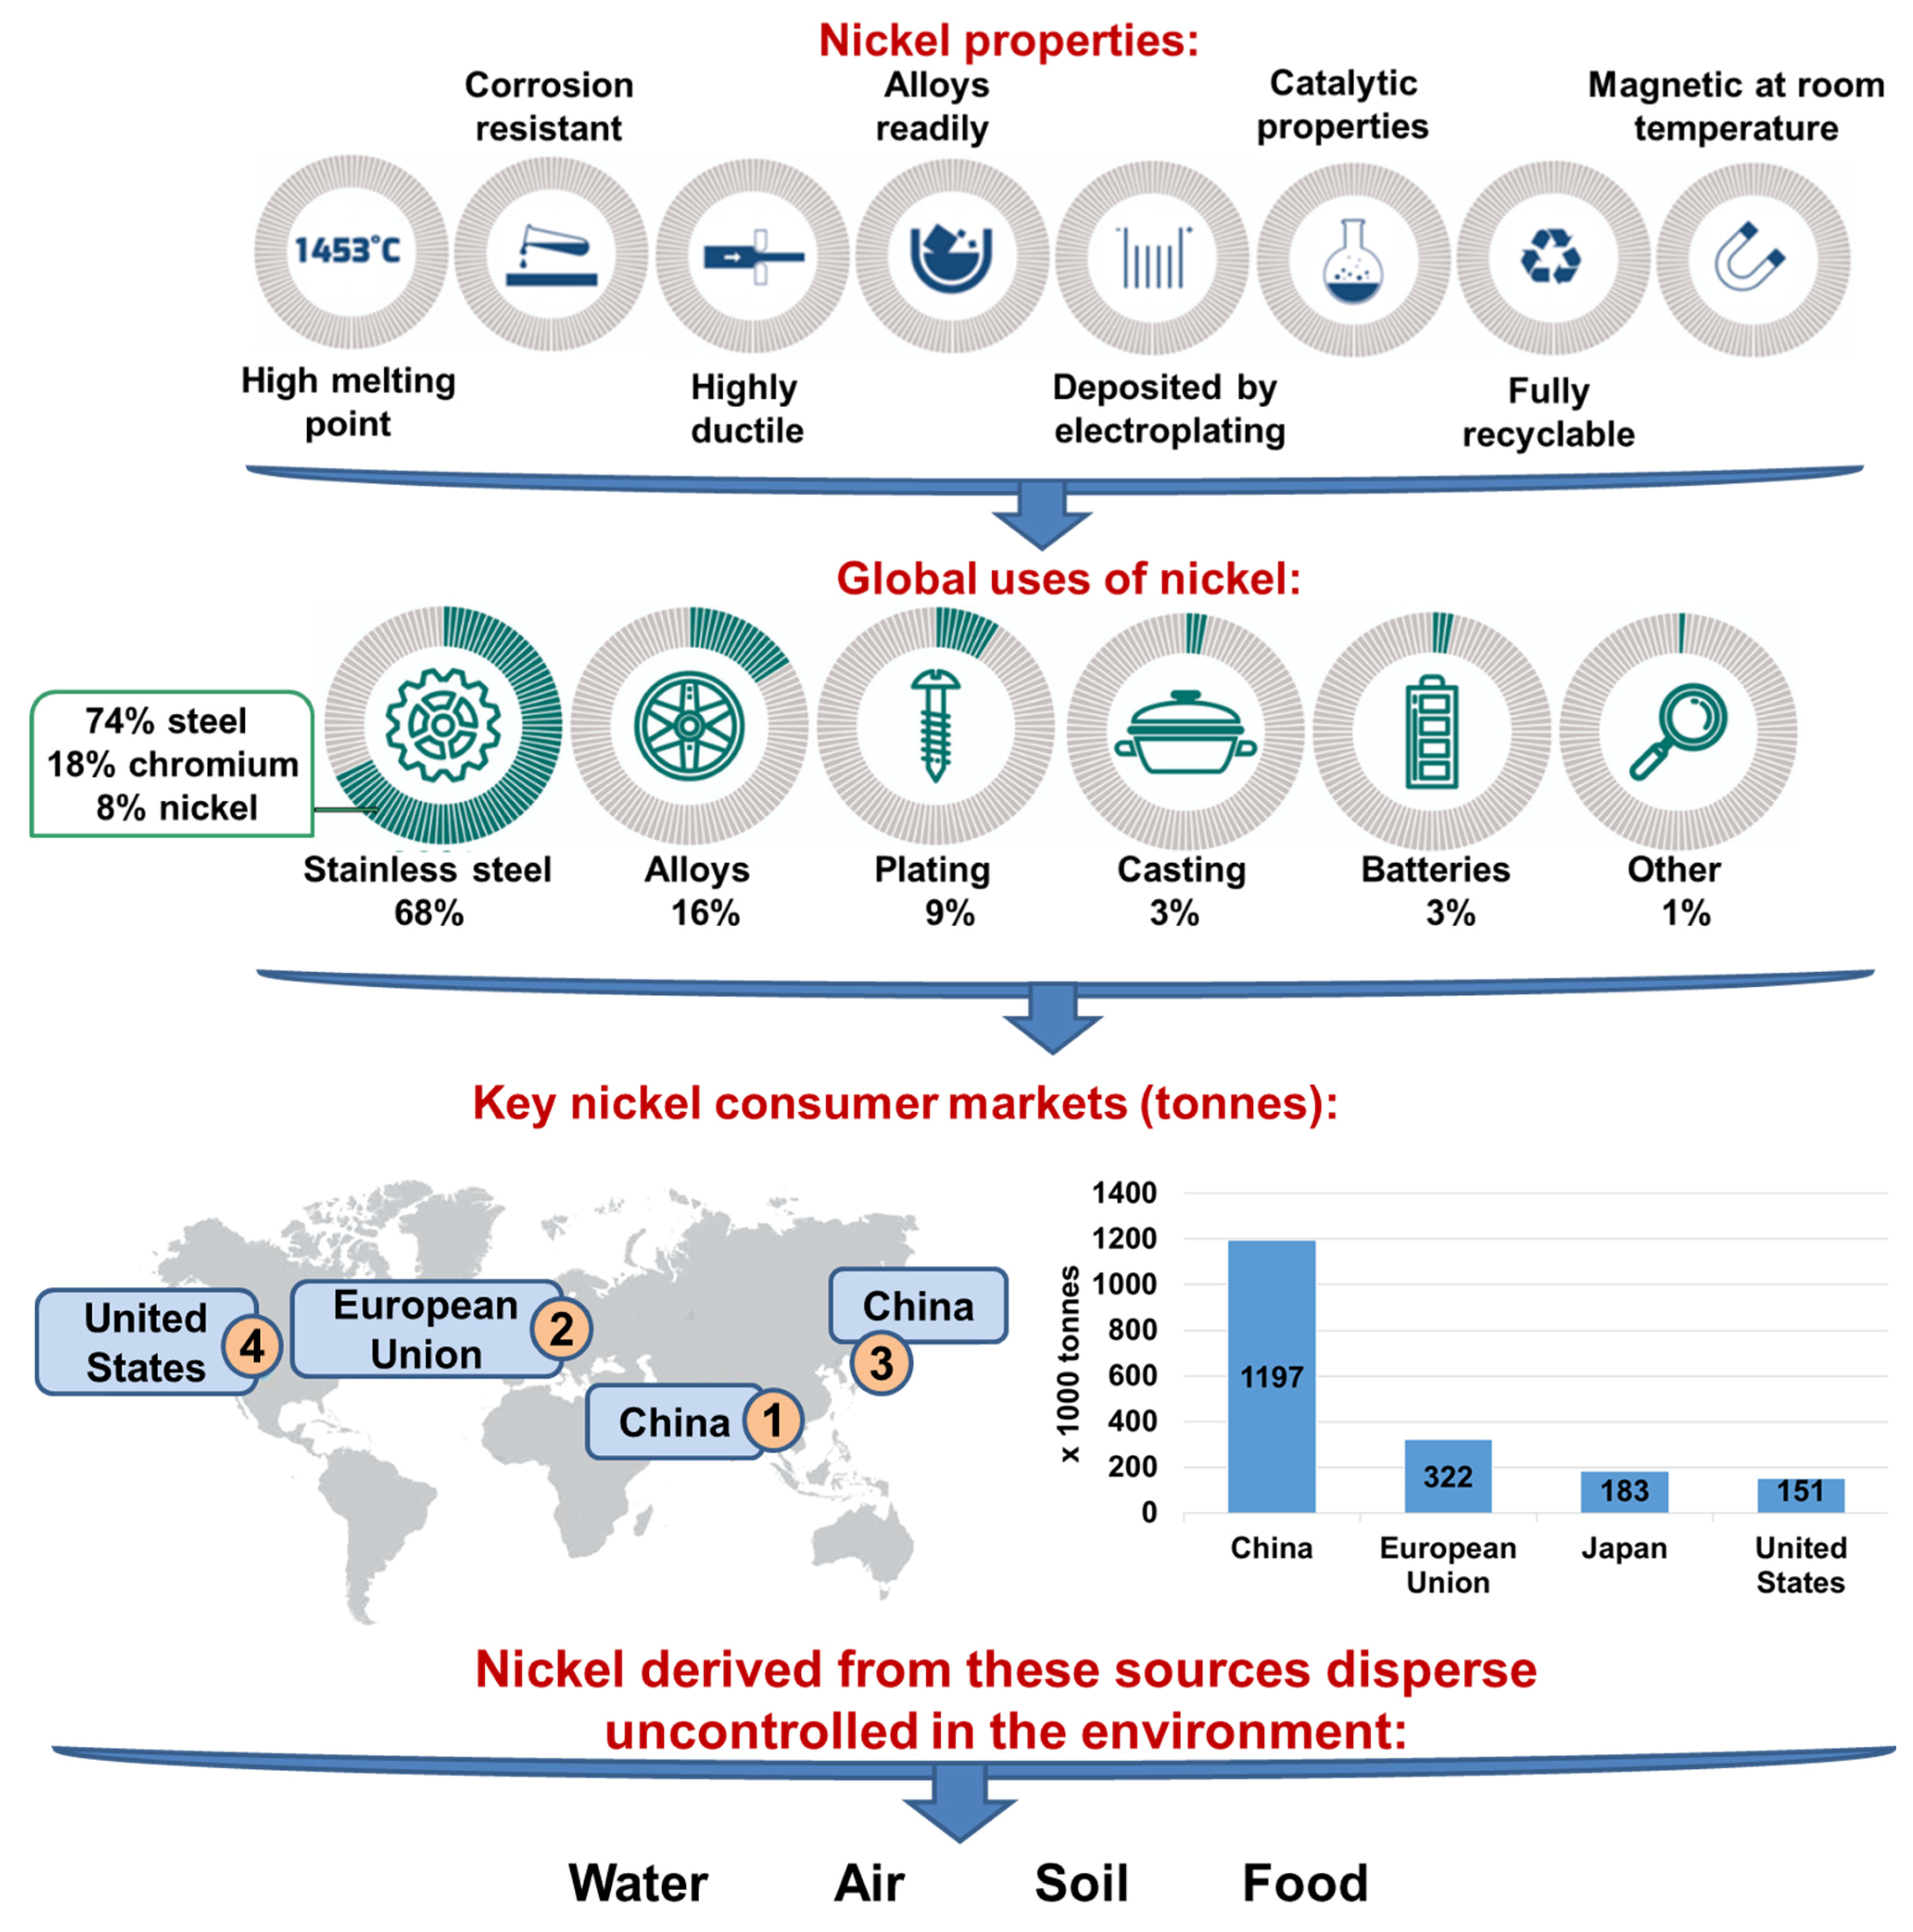
Due to its properties, Nickel (Ni) can be utilized in various branches of industry and applied in many processes, such as electroplating, mineral processing, production of stainless steel, batteries, metallic alloys, coins, ceramic coloring, and paint [2,9]. The details of nickel properties, global uses, as well as nickel consumer markets are presented in Figure 2. As a consequence, huge amounts of nickel-containing wastes, e.g., spent batteries, catalysts, waste electrical and electronic equipment as well as wastewaters and electrolytes are generated and leach into the environment [9,10].
Drinking of contaminated water, inhalation of particulates from the atmosphere, eating of contaminated food, due to the toxic and carcinogenic properties of nickel results in harmful effects to humans as well as to other living organisms [2]. This metal is capable of bioaccumulation in the aquatic environment and biomagnifications along the food chain [9,11,12]. Nickel causes kidney and lung diseases, chronic asthma, cough, pulmonary fibrosis, gastrointestinal distress (nausea, vomiting, diarrhea), skin dermatitis, nickel-induced apoptosis, allergy, headaches, cardiovascular diseases, lung and nasal cancer, as well as epigenetic effects [10,11,12,13,14] (Figure 3). A tolerable daily intake of nickel is equal to 2.8 µg/kg body weight (b.w.) [15]. As is indicate in Figure 3, the maximum contaminant level (MCL) of heavy metals such as lead (Pb), cadmium (Cd), mercury (Hg), arsenic (As), chromium (Cr), zinc (Zn) and nickel (Ni) that is allowed in drinking water is in the range from 0.00003 to 0.8 mg/L (establish by the United States Environmental Protection Agency, USEPA) [16]. As was suggested by the World Health Organization, the permissible nickel concentration in drinking water and wastewaters should not exceed 0.02 mg/L and 900 mg/L, respectively [2].
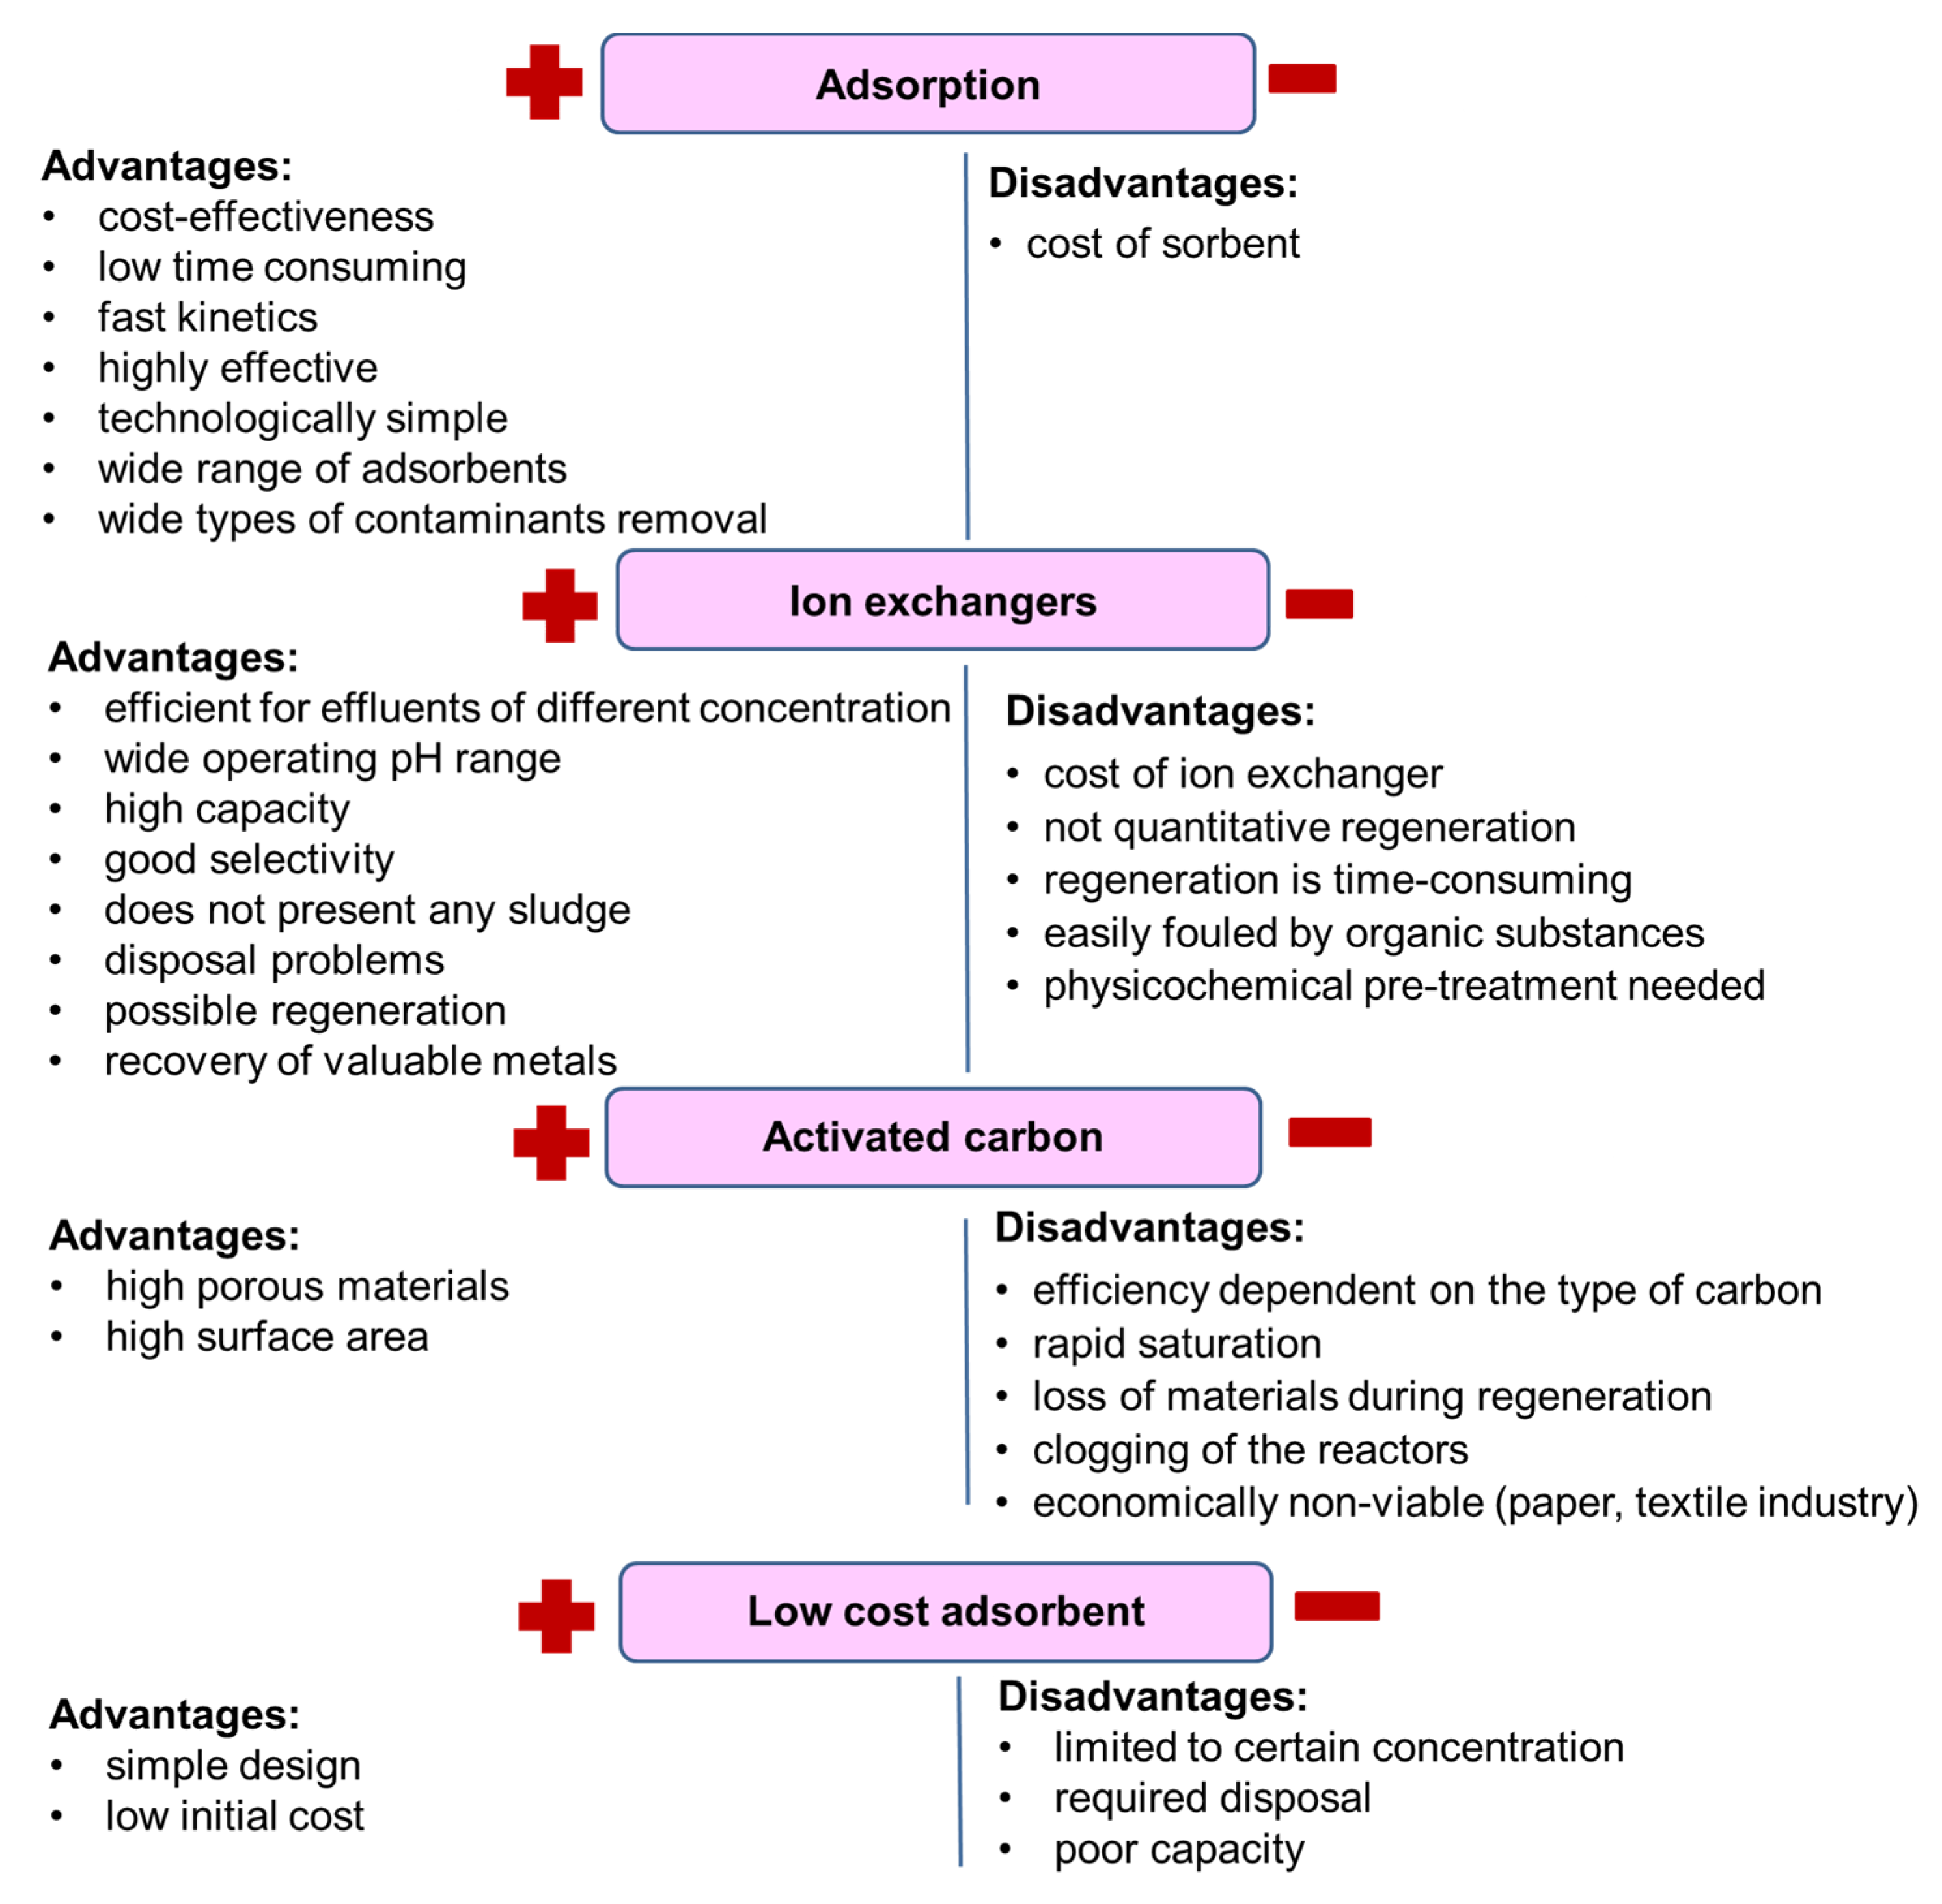
Taking into account nickel deficit due to its large demand by different industrial sectors, its widespread dispersion and persistence in the environment, and toxic effects on living organisms, its recycling and reuse is essential from the economic (new sources of valuable metal) as well as ecological (environment protection, wastes reduction) points of view. Despite of some technologies proposed for reclamation of solid matrices containing nickel, e.g., phytoremediation, solvent extraction, immobilization [17,18], etc., the most effective way to avoid nickel diffusion in the environment is its removal from industrial effluents using efficient treatment methods [2,19,20]. Nickel is removed by using various physicochemical methods such as coagulation, flocculation [21], electrocoagulation [22], co-precipitation [23], reverse osmosis, electrodialysis [24], ultrafiltration, complexation [25], membrane separation [26], adsorption [27], and ion exchange [28]. These techniques have notable limitations, such as incomplete removal, low efficiency, high operating and capital costs, sensitivity to operating conditions, generation of by-products, and excess sludge, which require further treatment; therefore, only few of them are suitable for application on a large-scale [2,19,20,29,30,31,32,33,34]. A comparison of treatment methods applied for nickel removal both with their advantages and disadvantages are presented in Figure 4. Adsorption, due to its advantageous such as cost-effectiveness, efficiency, easiness of application, effectiveness, high adsorption capacities of polymeric adsorbents, applicability for low pollutant concentrations, and non-toxic by products, is already applied in nickel removal from wastewaters [2,29,30,33,34,35]. A large amount of adsorbents, both inorganic and organic, were studied for Ni(II) ion removal from aqueous solutions, such as carbonaceous materials (coal, lignite, commercial activated carbon, activated carbon from waste materials), industrial and agricultural wastes (fly ash, sugarcane bagasse, red mud, sludge, peels, brans, barks, coir pith, tea), polymeric adsorbents (biopolymers, synthetic polymers), mineral adsorbents (clay, zeolite, siliceous materials) and bio-adsorbents (algae, fungi, bacteria) [2,33,35,36,37,38,39,40,41].
The aim of this study was the applicability of various adsorbents, with particular consideration of new generation ion exchangers: Purolite S984 (S984), Lewatit MonoPlus TP220 (TP220), Purolite A830 (A830), Lewatit MonoPlus SR7 (SR7), Purolite A400TL (A400TL), Dowex PSR2 (PSR2), Dowex PSR3 (PSR3) and Lewatit AF5 (AF5) for nickel removal from acidic solutions (0.1 M–6.0 M HCl and 0.9–0.1 M HCl/0.1–0.9 M HNO3 systems).
The adsorption efficiency of Ni(II) onto selected adsorbents was studied in this paper, as well as previously published ones [42,43,44,45], to choose the most efficient adsorbent for Ni(II) removal. The equilibrium studies, calculations with kinetic and isotherm models, desorption studies, FTIR-ATR spectra analysis of TP220 after Ni(II) adsorption, and proposed mechanism of Ni(II) adsorption are presented in this paper.
Nickel is frequently recovered from nickel-based solid waste (spent batteries, used catalysts, alloy scraps) as well as from high-Ni content solutions generated during technological processes. Nickel could be effectively removed from aqueous solutions using physicochemical techniques, but in the case of solids wastes, such materials must be hydrometallurgy treated (leached into a solution and subsequently recovered from it) or pyrometallurgy treated (thermal treatment). During the leaching procedure, HCl, aqua regia, HNO3, H2SO4, H2SO4—H2O2 of different concentrations [11] were used; therefore, the compositions of the solutions under discussion were selected in such a way to reflect the real wastewaters.

2. Materials and Methods

2.1. Materials

The stock (10,000 mg Ni(II)/L) and working solutions used for kinetic studies (100 mg Ni(II)/L), isotherm studies (100–10,000 mg Ni(II)/L) and desorption (1 and 2 M HNO3, HCl, H2SO4, NH4OH, NaOH and NaCl) were prepared using the chemical compounds of analytical grade purchased from the POCh S.A. company (Gliwice, Poland). The working solutions used for sorption were prepared by dilution of the stock solutions obtained by weighing a proper amount of solid NiCl2 × 6H2O and dissolving it in 0.1 M HCl and distilled water. The required volumes of 36–38% HCl as well as 36–38% HCl and 65% HNO3 were also added to obtain the desired acids concentrations (the chloride solutions: 0.1; 1.0; 3.0 and 6.0 M HCl and the chloride–nitrate(V) solutions: 0.1–0.9 M HCl/0.9–0.1 M HNO3). The presence of nickel complexes in the hydrochloric acid solutions, i.e., the chemical speciation of nickel (HCl–Ni), was modelled using the HYDRA–MEDUSA chemical equilibrium software for Windows (version: August 2019). In HYDRA (Hydrochemical Equilibrium Constant Database), the components for presented systems such as nickel species and their formation constants were obtained, then with MEDUSA (Make Equilibrium Diagrams Using Sophisticated Algorithms), the diagram for nickel in HCl solutions was obtained. During preparation of the solutions for isotherm studies similar procedure as in the kinetic once was applied whereas the desorption solutions were prepared by adding the proper volume of mineral acid, ammonium hydroxide, sodium hydroxide or sodium chloride into the volumetric flask and diluted or dissolved by distilled water. The concentration of eluting agent solutions was 1.0 or 2.0 M. The adsorbents for nickel removal from the acidic solutions, i.e., S984, TP220, A830, SR7, A400TL, PSR2, PSR3 and AF5, were cleaned by decantation before use to prevent from mechanical contamination, and then rinsed several times with distilled water or treated with 1 M hydrochloric acid to convert from the free base form to the chloride form, and then washed with distilled water. The commercial adsorbents characteristics are given in Table 2.
Prices of ion exchangers are affected by their types, quality, and spherical bead size. Usually, the price of cation exchange resins (strong and weak acid) ranges from USD 1.4 to USD 7.1 per 1 L, whereas anion exchange resins (strong and weak base) range from USD 4.6 to USD 7.1 per 1 L. Type 2 resins are generally more expensive than type 1 resins. The chelating ion exchange resins price range from USD 17.7 to USD 70.7 and above per 1L [48,49].

2.2. Batch Adsorption Studies

In the batch adsorption experiments, the effects of the phase contact times, acid (HCl, HNO3), and Ni(II) concentrations were investigated as factors determining Ni(II) adsorption. The volume of the liquid phase was 50 mL, and the mass of adsorbent was equal to 0.5 ± 0.0005 g. All adsorption experiments were performed at 25 °C using the laboratory shaker Elpin 358+ (Poland) at 180 rpm (rotations per minute), amplitude 8. After the separation of Ni(II) solutions from the adsorbent phase by filtration (qualitative medium filter paper) using Atomic Absorption Spectroscopy (ASA) absorption, a Varian AA240FS spectrometer with SIPS autosampler (Varian, Australia) was used for determination of the Ni(II) concentration after sorption (measurement parameters: wavelength 232.0 nm; lamp current 4 mA; slit width 0.2 nm; and the air/acetylene flow 13.5/2 L/min).

2.2.1. Kinetic Studies

Using the chosen adsorbents, the Ni(II) uptake was examined as a function of time (1–240 min.) and acid concentrations (0.1 M, 1.0 M, 3.0 M and 6.0 M HCl, as well as 0.1 M HCl/0.9 M HNO3, 0.2 M HCl/0.8 M HNO3, 0.5 M HCl/0.5 M HNO3, 0.8 M HCl/0.2 M HNO3, 0.9 M HCl/0.1 M HNO3) in order to explore the rate-controlling mechanism. The amount of Ni(II) sorbed by the adsorbents at time t was calculated from the equation:
q t =   ( C 0   C t ) m   · V
where C0 and Ct (mg/L)—the Ni(II) concentration in the solution before and after the sorption time t, respectively; V (L)—the volume of the Ni(II) solution; and m (g)—the mass of the adsorbent.
The pseudo-first-order (PFO), pseudo-second-order (PSO), and intraparticle diffusion (IPD) kinetic models [50,51] were applied for description of the experimental data as follows:
d q t d t = k 1 ( q e q t )
d q t d t =   k 2 ( q e q t ) 2
q t =   k i t 1 / 2
wher qe and qt (mg/g)—the Ni(II) amounts sorbed at the equilibrium and at any time t; k1 (1/min) and k2 (g/mg min)—the rate constants of sorption determined from PFO and PSO equations, respectively; ki (mg/g min0.5)—the intraparticle diffusion rate constant.

2.2.2. Equilibrium Studies

Series of Ni(II) solutions of the increasing metal ions concentrations from 100 to 10,000 mg Ni(II)/L in 0.1 M HCl were prepared. The equilibration time was established as 24 h. The amounts of Ni(II) sorbed at equilibrium, denoted as the sorption capacities (qe) of selected adsorbents, were calculated from the equation:
q e =   ( C 0   C e ) m   · V
where C0 and Ce (mg/L)—the Ni(II) concentrations in the solution before and after the sorption at equilibrium, respectively; V (L)—the volume of Ni(II) solution; and m (g)—the mass of the adsorbent.
In order to explain the relationship between the Ni(II) concentration in the solution and sorbent phase at equilibrium, four isotherm models were chosen to describe the experimental data, i.e., the Langmuir, Freundlich, Temkin and Dubinin–Raduskievich models [52]. The non-linear forms of the above-mentioned models are as follows:
q e = k F C e 1 / n
q e = k L Q 0 C e 1 + C e k L
q e = R T b T l n A C e
q e = q m e k D R ε 2
where k F (mg1−1/n L1/n/g) and n—the Freundlich constants related to the adsorption capability and adsorption intensity, respectively; kL (L/mg)—the constant parameters of adsorption equilibrium; Q0 (mg/g)—the monolayer adsorption capacity; bT (J g/mol mg)—Temkin constant related to the heat of adsorption; A (L/mg)—the Temkin isotherm equilibrium binding constant; qm (mg/g)—the maximum adsorption capacity; kDR (mol2 J2)—constant related to the adsorption energy; ε (J/mol)—the adsorption potential calculated as ε = R T l n [ 1 + 1 C e ] ; R—the gas constant (8.314 J/mol K); and T (K)—the temperature.

2.2.3. Error Analysis

All adsorption experiments were performed in triplicates. The mean values of the results were used for data evaluation. The standard deviation did not exceed 3–5% in all cases. Non-linear methods for the calculation of kinetic and equilibrium adsorption parameters were applied using the software Microsoft Excel 2013 with Solver add-in. Based on the values of Marquardt’s percent standard deviation (MPSD), the determination coefficient (R2) and the adjusted R-squared ( R a d j 2 ) of the best fitted model was proposed. The above-mentioned parameter can be determined using the following equations [53,54]:
M P S D =   i = 1 n ( q e   e x p q e   c a l q e   e x p ) i 2
R 2 = 1 ( q e   e x p q e   c a l ) 2 ( q e   e x p q e   m e a n ) 2
R a d j 2 = 1 [ ( 1 R 2 ) ( n 1 ) n k 1 ]
where qe exp (mg/g)—the amount of Ni(II) sorbed at equilibrium; qe cal (mg/g)—the amount of Ni(II) sorbed calculated from the non-linear models; qe mean (mg/g)—the measured by the means of qe exp values; n—the points number in data sample; and k—the number of independent regressors.

2.2.4. FTIR-ATR Analysis

The Fourier-transform infrared spectroscopy with attenuated total reflection (FTIR-ATR) technique was used for the recorded spectra of adsorbents under discussion using the Agilent Cary 630 FTIR spectrometer. The above-mentioned spectra were recorded in the frequency range from 400 to 4000 cm−1 for the adsorbents before and after the Ni(II) adsorption. The FTIR-ATR technique was used to confirm and identify the presence of functional groups in the adsorbents used, as well as to provide information about possible Ni(II) interactions with the functional groups.

2.2.5. Batch Desorption Experiments

Regeneration of the adsorbent with the highest sorption capacity for Ni(II) ions was performed in three sorption–desorption cycles. The sorption–desorption cycles were performed using the batch technique (laboratory shaker Elpin 358+, Poland) and applying the following parameters: m = 0.5 ± 0.0005 g, V = 50 mL, T = 25 °C, amplitude and rotary of shaking: 8 and 180 rpm, respectively. The solutions of the compositions 100 mg Ni(II)/L in 0.1–6.0 M HCl and 0.1–0.9 M HCl/0.9–0.1 M HNO3 were used in each sorption step, and then Ni(II) concentration in the sorbent phase was calculated. Regeneration was carried out using the samples of adsorbent uploaded with Ni(II) ions, which were shaken for 2 h with 50 mL of the eluting solutions such as HNO3, HCl, H2SO4, NH4OH, NaOH, NaCl of the 1.0 M and 2.0 M concentrations. The amounts of Ni(II) desorbed form the adsorbent phase were determined in the liquid phase using the AAS measurements. Desorption of Ni(II) ions as a percentage (D) was calculated using the equation:
D =   m d e s m a d s   × 100 %
where mdes (mg)—the mass of Ni(II) desorbed; mads (mg)—the mass of Ni(II) adsorbed.

3. Results and Discussion

3.1. Effect of Phase Contact Time and Acids Concentration on Ni(II) Adsorption

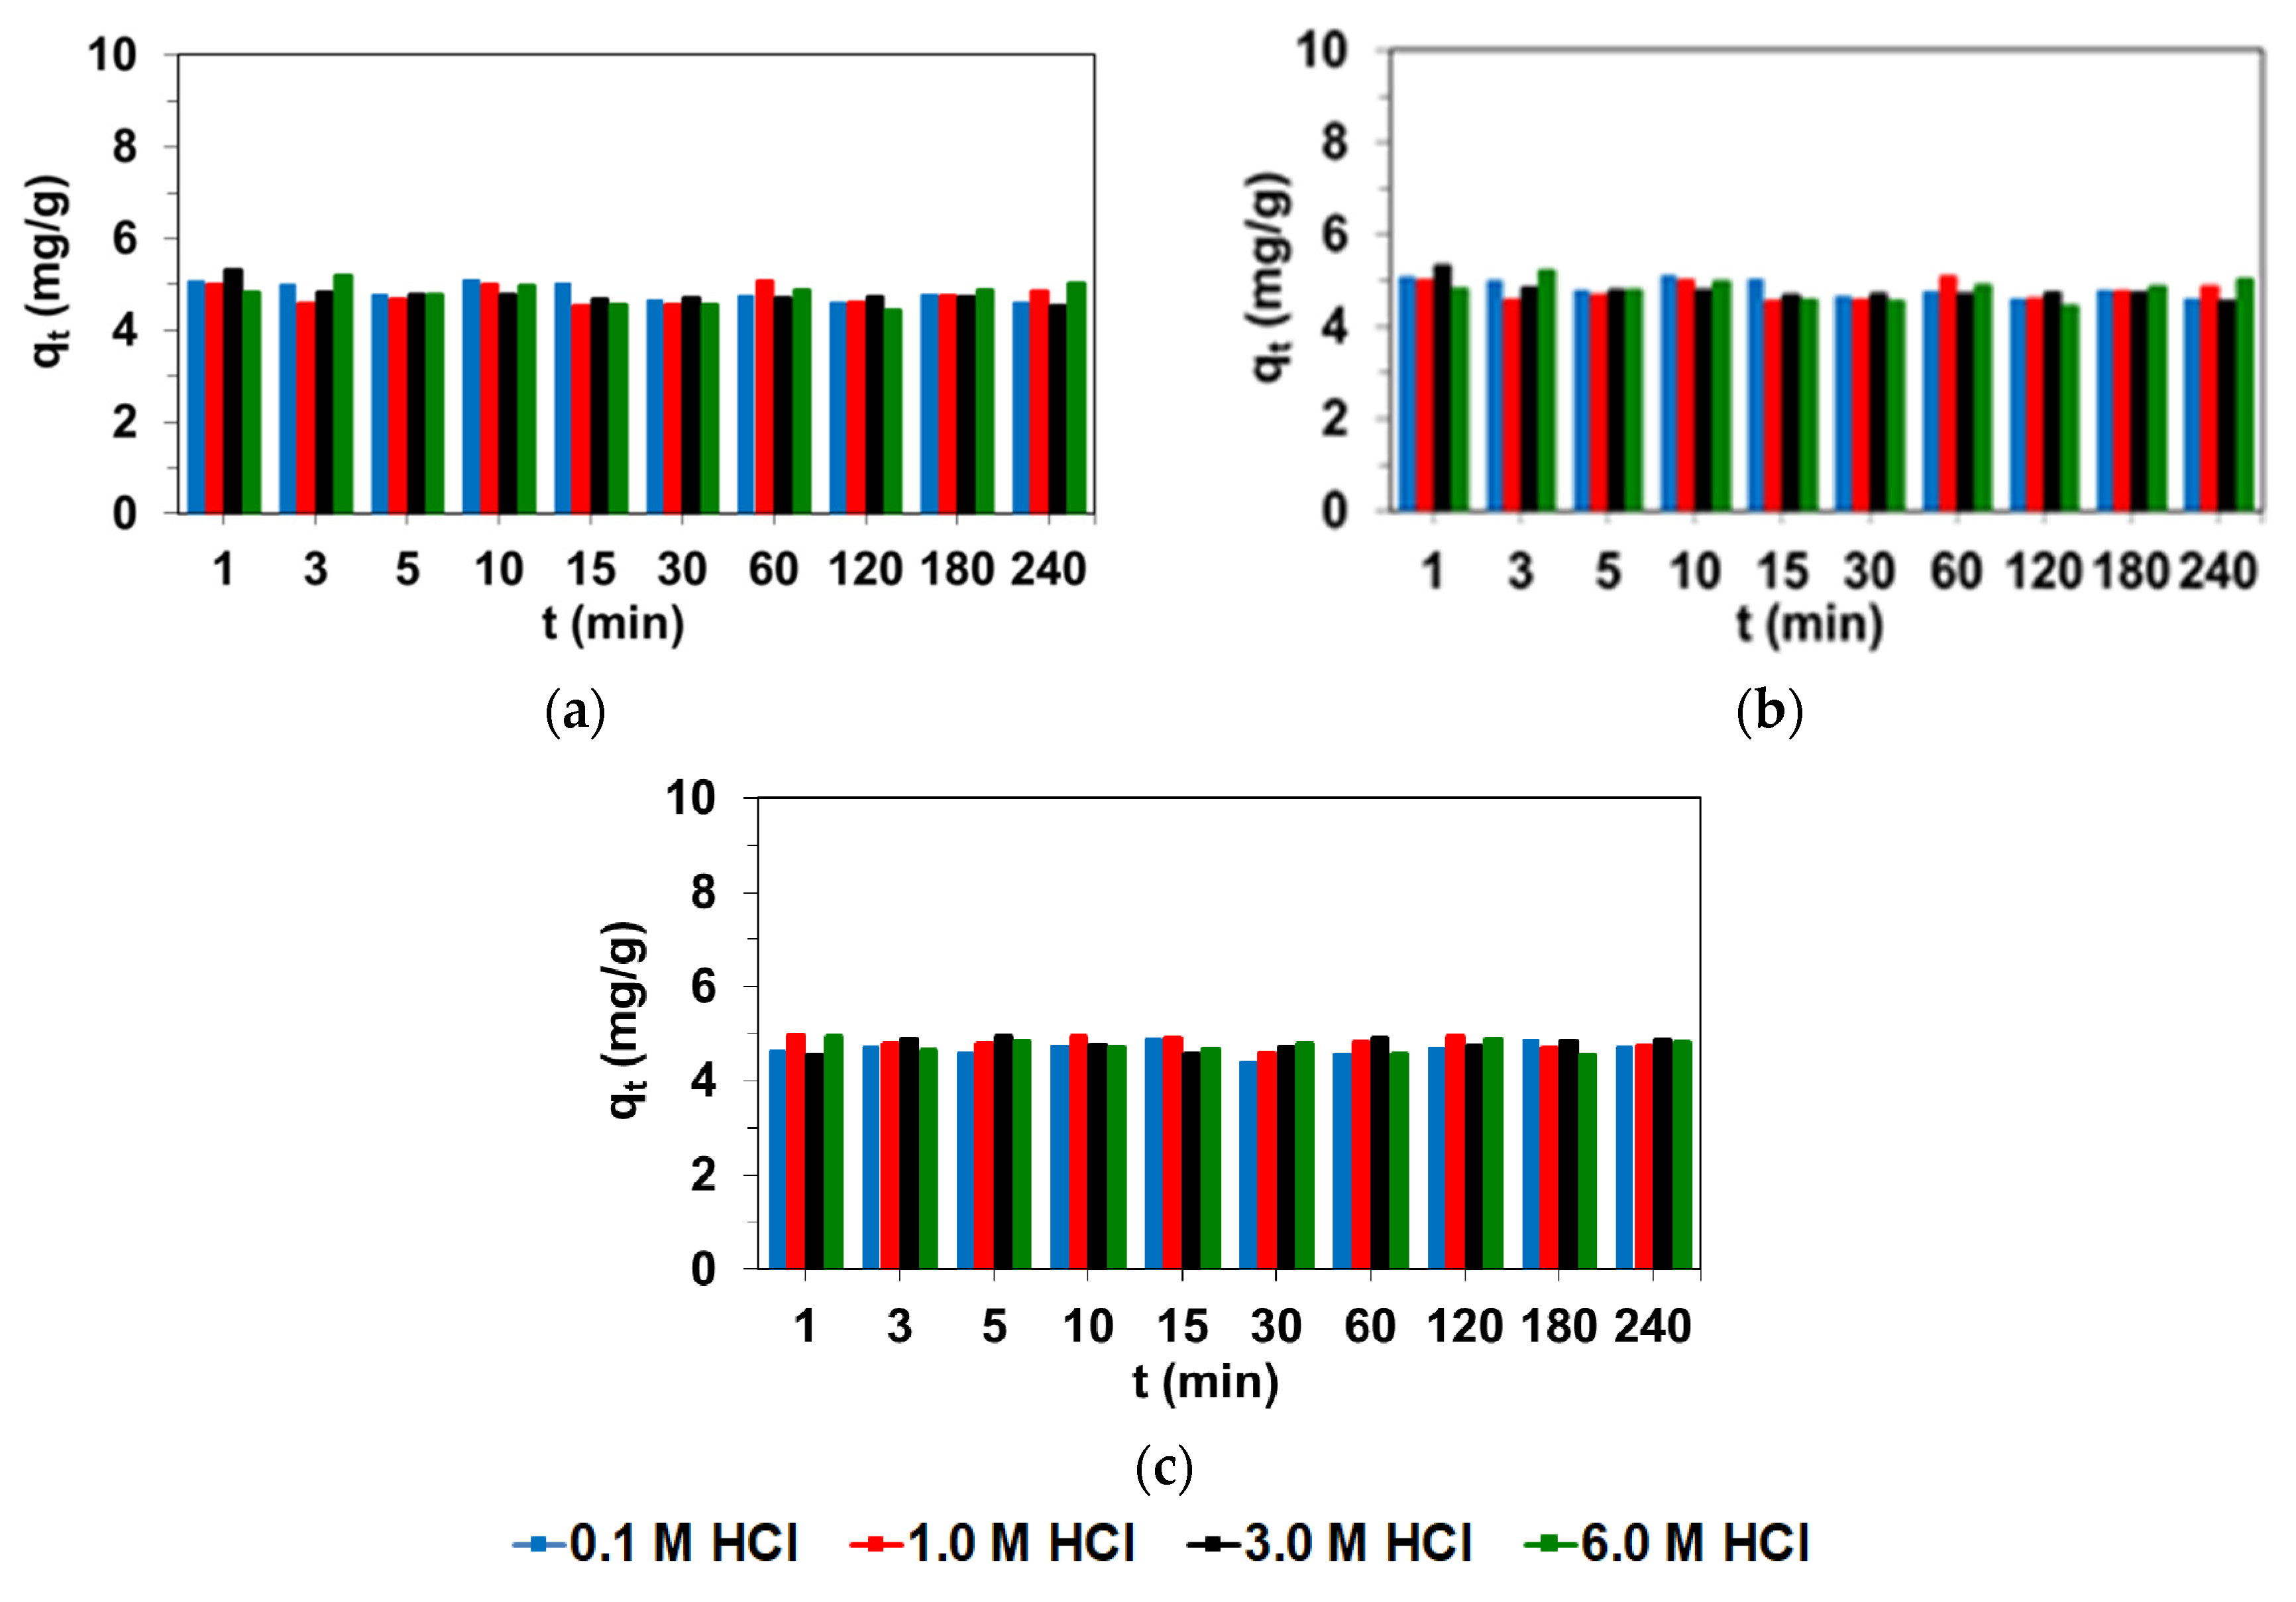
A series of shaking time studies for Ni(II) ions was carried out with 100 mg/L initial metal concentration at 25 °C and different HCl and HNO3 acids concentrations (HCl (M): 0.1; 1.0; 3.0; 6.0; HCl (M)/HNO3 (M): 0.1/0.9; 0.2/0.8; 0.5/0.5; 0.8/0.2; 0.9/0.1). The effect of phase contact times ranging from 1 min to 240 min on the Ni(II) adsorption was also examined. The adsorption of 100 mg/L concentration of Ni(II) onto selected adsorbents for 4 h was studied in this paper and compared to the results obtained previously [42,43,44,45] to choose the most efficient adsorbent for Ni(II) removal. The results are compared in Table 3, and presented in Figure 5 (chosen examples).
It was observed that, for seven adsorbents (S984, A830, SR7, A400TL, PSR2, PSR3 and AF5), Ni(II) ion adsorption did not increase gradually at the beginning of the adsorption, but the amount of Ni(II) adsorbed at time t, as well as the adsorption capacities, reached similar values in the phase contact time ranging from 1 min to 240 min. On the other hand, in the case of TP220 ion exchanger (adsorption from the diluted HCl solutions), the amount of Ni(II) adsorbed at time t increased with the increasing phase contact time, and at 60 min of phase contact time, a sharp increase in qt values was observed. The adsorption capacity towards Ni(II) was the highest for TP 220 and 0.1 M HCl. Moreover, comparing the adsorption capacities collected in Table 2 can conclude that TP220 showed the highest Ni(II) adsorption ability in most cases. At 240 min of phase contact time, the Ni(II) percentage removal (%R):
% R = ( C 0 C t ) C t 100 %
where C0 (mg/L) and Ct (mg/L) are the Ni(II) concentrations in the solution before and after the sorption at time t, respectively,. This value was the highest for TP220 and equal to %R = 62.4%, whereas for the other adsorbents these values were in the range from 32.9 to 55.2% for the HCl system. Additionally, the highest adsorption ability towards Ni(II), similar to TP220, was exhibited by the S984 adsorbent from the HCl/HNO3 systems (the percentage removal was approximately 50–65%).
The time required to reach system equilibrium was above 240 min for TP220 [43], whereas in the case of other adsorbents the qt values remained at a similar level at 1 min as well as at 240 min of phase contact time. As pointed out by Uzun and Guzel [55], the time required to reach equilibrium (teq) during the Ni(II), Mn(II), Fe(II), Cu(II) adsorption on Merck 2514 activated carbon was equal to 134 h for Ni(II) (m = 1 g, V = 50 mL, C0 = 200 mg/L, 140 rpm) whereas during the Ni(II) adsorption on raw and modified Filtrasorb-400 by potassium bromate teq = 120 min (V = 400 mL, 1000 rpm) [56]. Adsorption of Ni(II) or separation was also carried out on ion exchange, resins e.g., Amberlite IRA-900 and a novel silica-based anion exchanger, AR-01 (Co(II), Ni(II) and Cu(II) from the nitrite solution) [57], anion exchange Amberjet™ 4200 Cl and cation exchange Amberjet™ 1200 H [58], anion exchanger D301R [59], and chelating Purolite S950 resin [60], but the time required to reach the system equilibrium was not determined. Adsorption of Ni(II) in the presence of complexing agents on the polyacrylate anion exchangers Amberlite IRA 458, Amberlite IRA 958 and Amberlite IRA 67 showed that the curve kinetics reached the plateau at the time greater than 30 min [61]. Effect of acid concentration were not observed in the HCl or HCl/HNO3 systems. The qt values were similar to those of the adsorption capacities in all examined aqueous solutions. Adsorption of Co(II), Ni(II), and Cu(II) from the nitrite solutions by anion exchangers was insignificant at the nitrite concentrations below 0.1 M, and then very slight increase in Ni(II) adsorption with the increasing concentration of nitrate ions was observed [57]. The experimental results obtained during the Ni(II) adsorption on S984, A830, SR7, A400TL, PSR2, PSR3 and AF5 adsorbents were modelled using the pseudo-first-order (PFO), pseudo-second-order (PSO), and intraparticle diffusion (IPD) kinetic models (Equations (2)–(4)). Taking into account the shape of kinetic curves and the arrangement of the experimental points, it was possible to calculate kinetic parameters at 0.1 M HCl using TP220 which exhibited the highest %R and adsorption capacity. The kinetic parameters were calculated and based on error analysis such as Marquardt’s percent standard deviation, determination coefficient, and adjusted R-squared values; then, the best fitted model was proposed. The obtained kinetic parameters as well as the errors values are collected in Table 4, whereas the fitting plots are presented in Figure 6. The mechanism of Ni(II) adsorption depends on the structure and functional groups of the adsorbent as well as on the physicochemical characteristics of the solute and adsorbent. The pseudo-first-order and pseudo-second-order kinetic models were based on the different assumption: PFO on the physisorption process, and PSO on the chemisorption process [50,51].
The PFO kinetic model did not adjust during the whole range of phase contact times, whereas the PSO could be applied in the whole range of adsorption. From a physicochemical point of view, the PFO model was expected when adsorption was limited by the molecules transport from the solution to the adsorbent (film diffusion) or when this transport was not the rate-limiting step [62]. The PSO kinetic equation can be used as an estimation of the adsorption capacity based on the extrapolation of the kinetic data qt (qt > 80% qe) [63]. Taking into account the kinetic parameters obtained for PFO and PSO, it was found that the determination coefficient as well as the adjusted R-squared values were slightly higher for the PSO model (R2 = 0.9280, R2adj = 0.9074) than for PFO (R2 = 0.9131, R2adj = 0.8883), whereas the MPSD was lower for the PSO model. Comparing the qexp values (qexp = 6.24 mg/g) with the calculated qe results (PFO qexp = 5.20 mg/g, PSO qexp = 5.31 mg/g), a slightly higher compatibility between qexp and qe was observed in the case of the PSO model. Taking into account the above-mentioned parameters, the error analysis, as well as the fitting plot (Figure 5), it can be concluded that neither PFO nor PSO kinetic models can be applied for describing Ni(II) adsorption on TP220; however, the better-fitting was found in the case of the PSO model. Taking into account the IPD model, which is frequently used to predict the rate controlling step, it was found that the intraparticle diffusion rate constant was equal to 0.05 mg/g min0.5. Comparing the R2 value obtained for IPD, which was equal to 0.6869, to the other values obtained for PFO and PSO, it was much smaller; therefore, the intraparticle diffusion may not be the only rate-limiting step—the film diffusion may also be limiting as well. The kinetics of Ni(II) adsorption on Amberlite IRA 458, Amberlite IRA 958, and Amberlite IRA 67 with the non-biodegradable complexing agents followed the pseudo second-order rate expression (R2 = 0.999 for PSO, R2 = 0.663 (IRA 458), R2 = 0.952 (IRA 958), R2 = 0.742 (IRA 67) for PFO, R2 = 0.526 (IRA 458), R2 = 0.490 (IRA 958), R2 = 0.793 (IRA 67) for IPD) [61], similar to the Ni(II) adsorption on the above-mentioned ion exchangers with a biodegradable complexing agent, e.g., IDS (sodium salt of N-(1,2-dicarboxyethyl)-d,l-aspartic acid) (R2 in the range from 0.999 to 1.000 for PSO, from 0.592 to 0.822 for PFO as well as from 0.637 to 0.682 for IPD) [40].

3.2. Equilibrium Studies

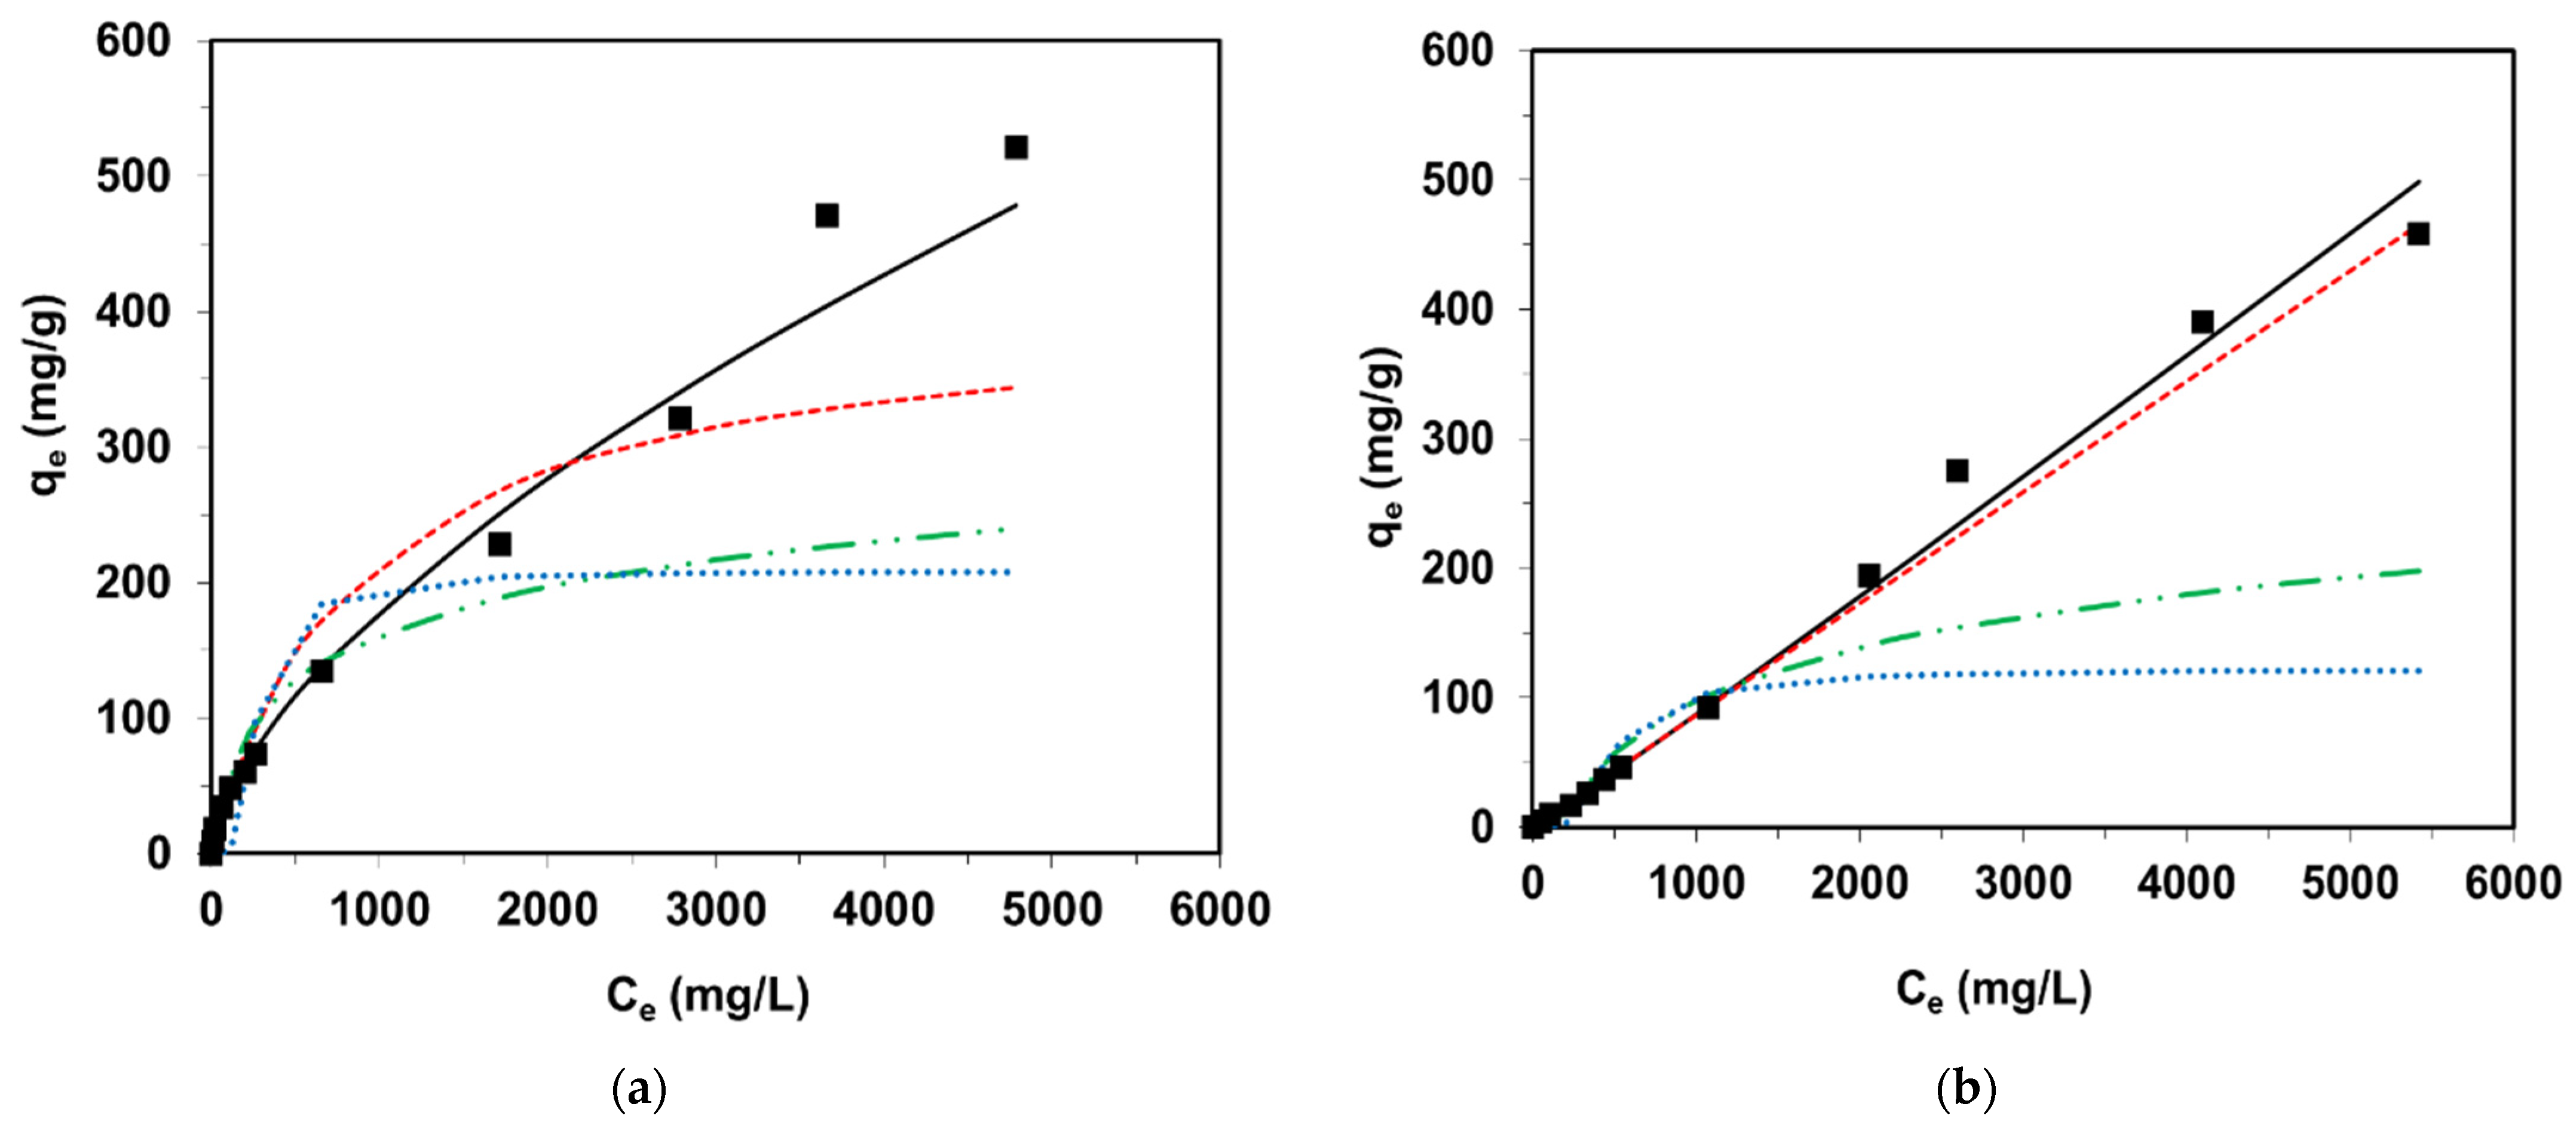
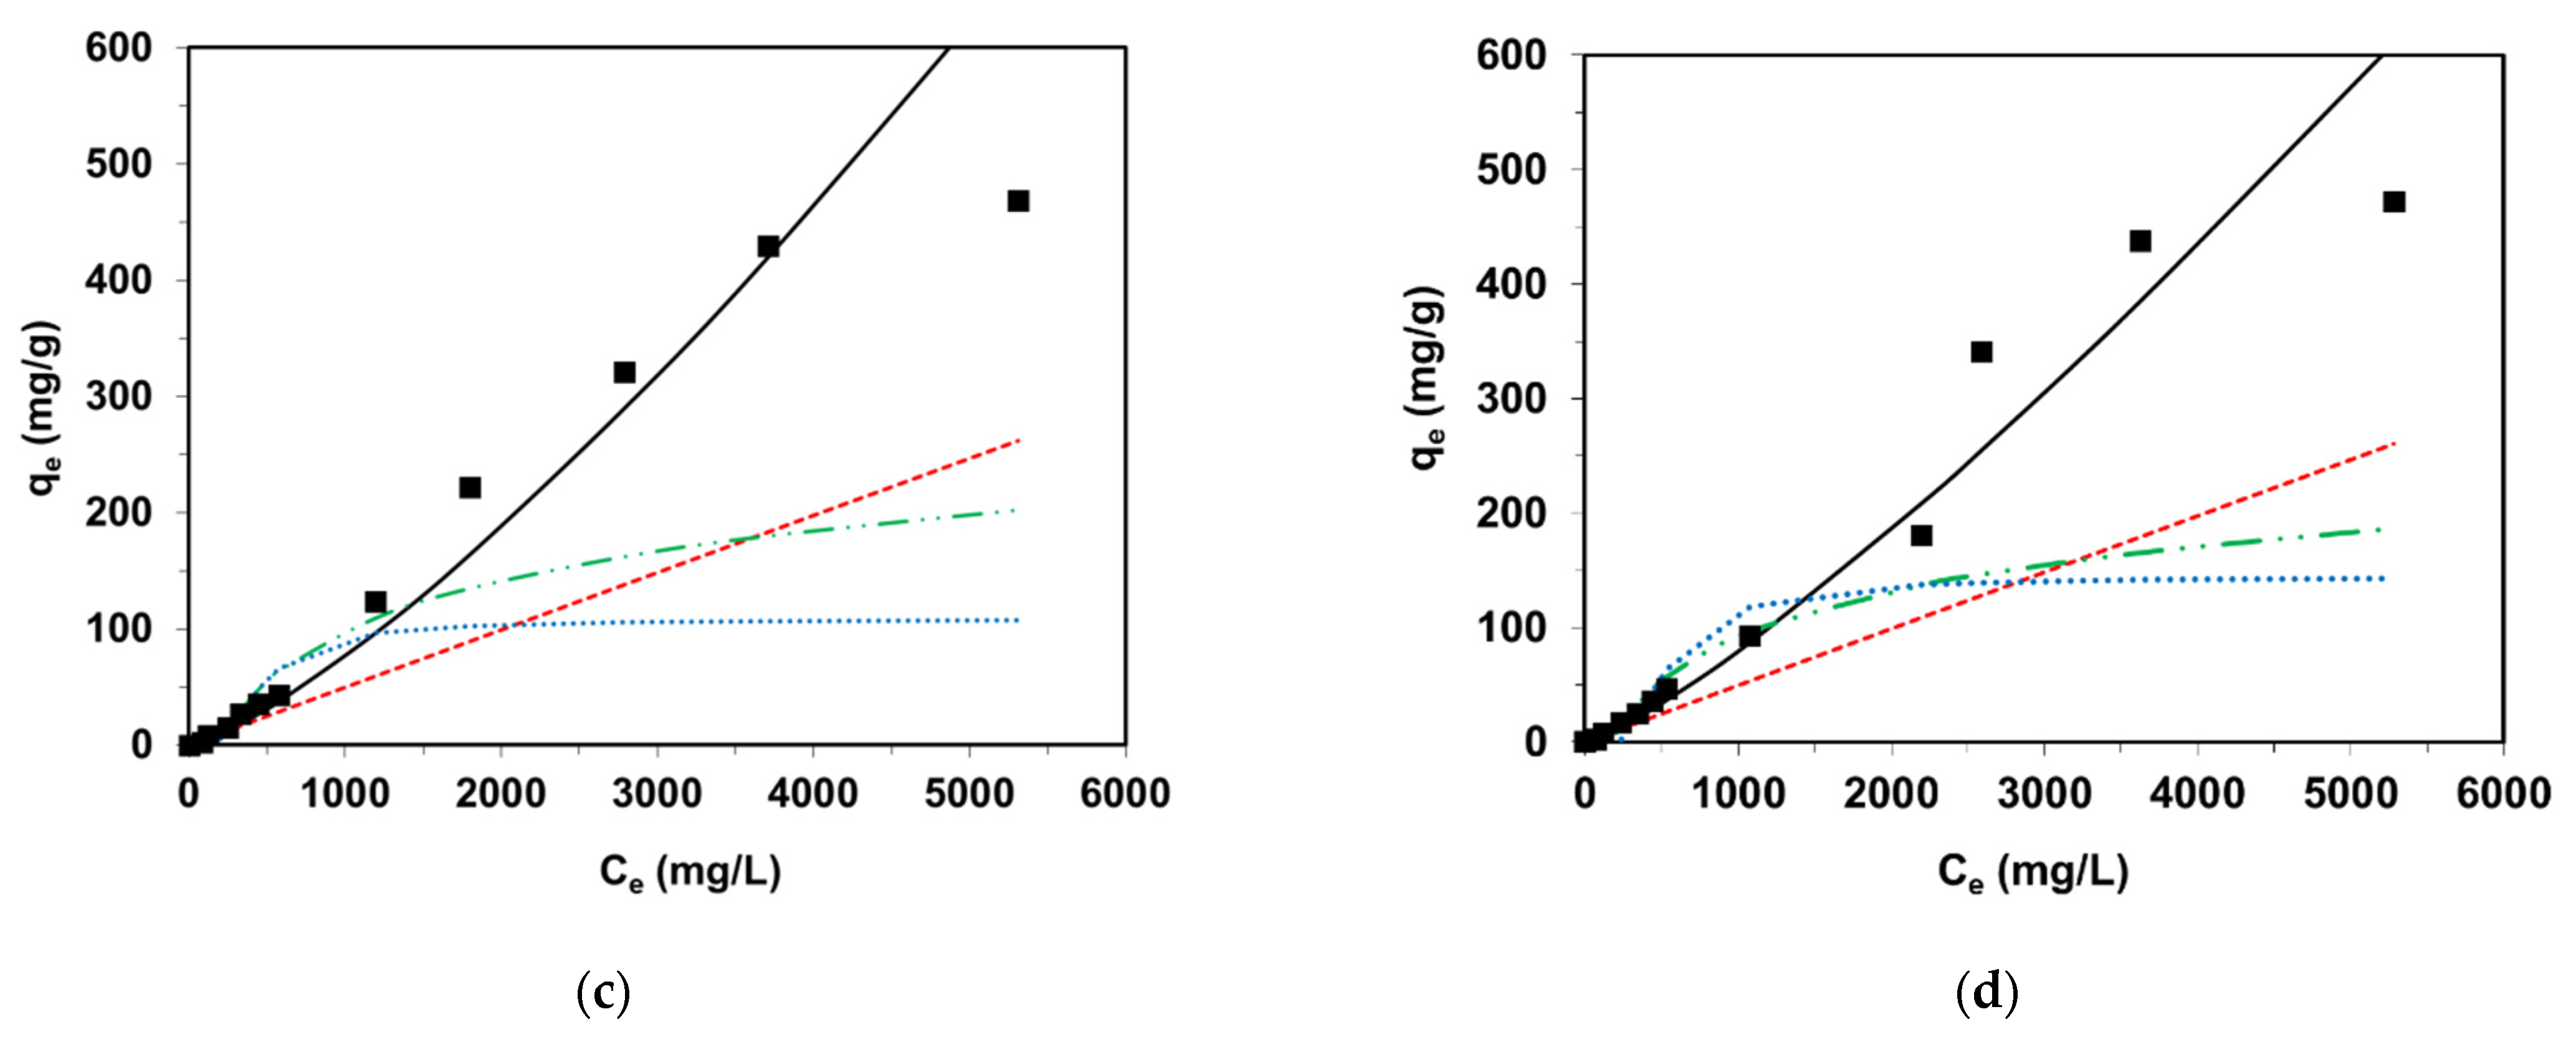
Determination of adsorption capacities (qe) towards a given pollutant such as Ni(II) ions, is a key step of the adsorption process. Determination of these values makes it possible to assess the suitability of a given material as a potential adsorbent, which may imply its use in industrial installations. The magnitude of these values is influenced not only by the properties of the adsorbent, such as chemical composition, specific surface area, type of functional groups, and porosity, but also the properties of the adsorbate and the nature of the interactions between the adsorbent and the adsorbate at equilibrium. The dependence of qe vs. Ce in the selected investigated systems is presented in Figure 7. The shape of the presented isotherms corresponds to type II of the IUPAC adsorption isotherms classification that reflects adsorption on the macroporous materials, and weak and strong interactions in the adsorbate–adsorbent are considered.
The four most frequently used isotherm models (Freundlich, Langmuir, Temkin, and Dubinin–Radushkevich) were chosen for description of the Ni(II) sorption on the chelating (TP220, S984), weakly (A830), and strongly (SR7, PSR2, PSR3, A400TL) basic resins, as well as activated carbon (AF5). Characteristic parameters of the Freundlich, Langmuir, Temkin, and Dubinin–Radushkevich isotherm models were calculated using the non-linear regression and are listed in Table 5.
Analyzing the data presented in Table 5 and Figure 7, the smallest MPSD values and the highest R2 and R a d j 2 values—among the applied isotherm models—were calculated using the Freundlich equation. The model takes into consideration the multilayer adsorption in the system and proceeds on a heterogeneous surface of unequal energetic active sites with a different binding energy. The Freundlich model is based on physisorption. The highest kF value was calculated for the TP220 chelating resin, and was found to be 2.317 mg1−1/n L1/n/g. The parameter 1/n describing the intensity of adsorption was 0.629 for the Ni(II)—TP220 system and ranged from 0 to 1, which points to favorable adsorption, whereas in the case of other systems, this value was greater than 1 (unfavorable adsorption). The %R values were calculated to be 62.4% in 100 mg Ni(II)/L—0.1 M HCl—TP220 and confirmed the favorable uptake of Ni(II) ions by TP220.
For the Langmuir adsorption model assuming the monolayer adsorption, the MPSD values were greater than for the Freundlich model.
Analyzing of the distribution of experimental points in Figure 6, as well the results of error analysis, it can be stated that the Langmuir model describing the monolayer adsorption cannot be applied for description of the equilibrium sorption data of Ni(II) on the different types of resins.
The Temkin isotherm model was firstly applied for hydrogen adsorption onto platinum electrodes in an acidic medium and assumes that the adsorption heat of molecules in the surface layer declines linearly rather than logarithmically. The bT and A values were in the range of 39.72–49.74 J g/mol mg and 0.0048–0.0256 L/mg, respectively. However, the R2 (from 0.850 to 0.926) and   R a d j 2 (from 0.813 to 0.907) values obtained for the Temkin isotherm model were smaller than for the Freundlich model.
The Dubinin–Radushkevich isotherm model was proposed for the adsorption process related to micropore volume filling as opposed to the layer-by-layer adsorption on the pore [64]. Moreover, the kDR parameter enables estimation of the mean free energy E of adsorption. This value, on the other hand, allows the assessing of the type of the adsorption. When the magnitude of E is smaller than 8 kJ/mol, the adsorption process has physical character, and when E is between 8 kJ/mol and 16 kJ/mol, the process is a chemical reaction. In the investigated systems, the qm parameters indicating the maximum sorption capacities for the resins and activated carbon were equal to 90.41–208.12 mg/g and 144.56 mg/g, respectively, and did not match well the experimental data. The mean free energies were in the range of 3.237–7.605 J/mol, which revealed the physical character of Ni(II) ion binding by the adsorbents. However, these data cannot properly reflect the Ni(II) ion retention by the resins, and AF5 as the highest values of MPSD and the lowest values of R2 and R a d j 2 were obtained for the Dubinin–Radushkevich model compared with the others.
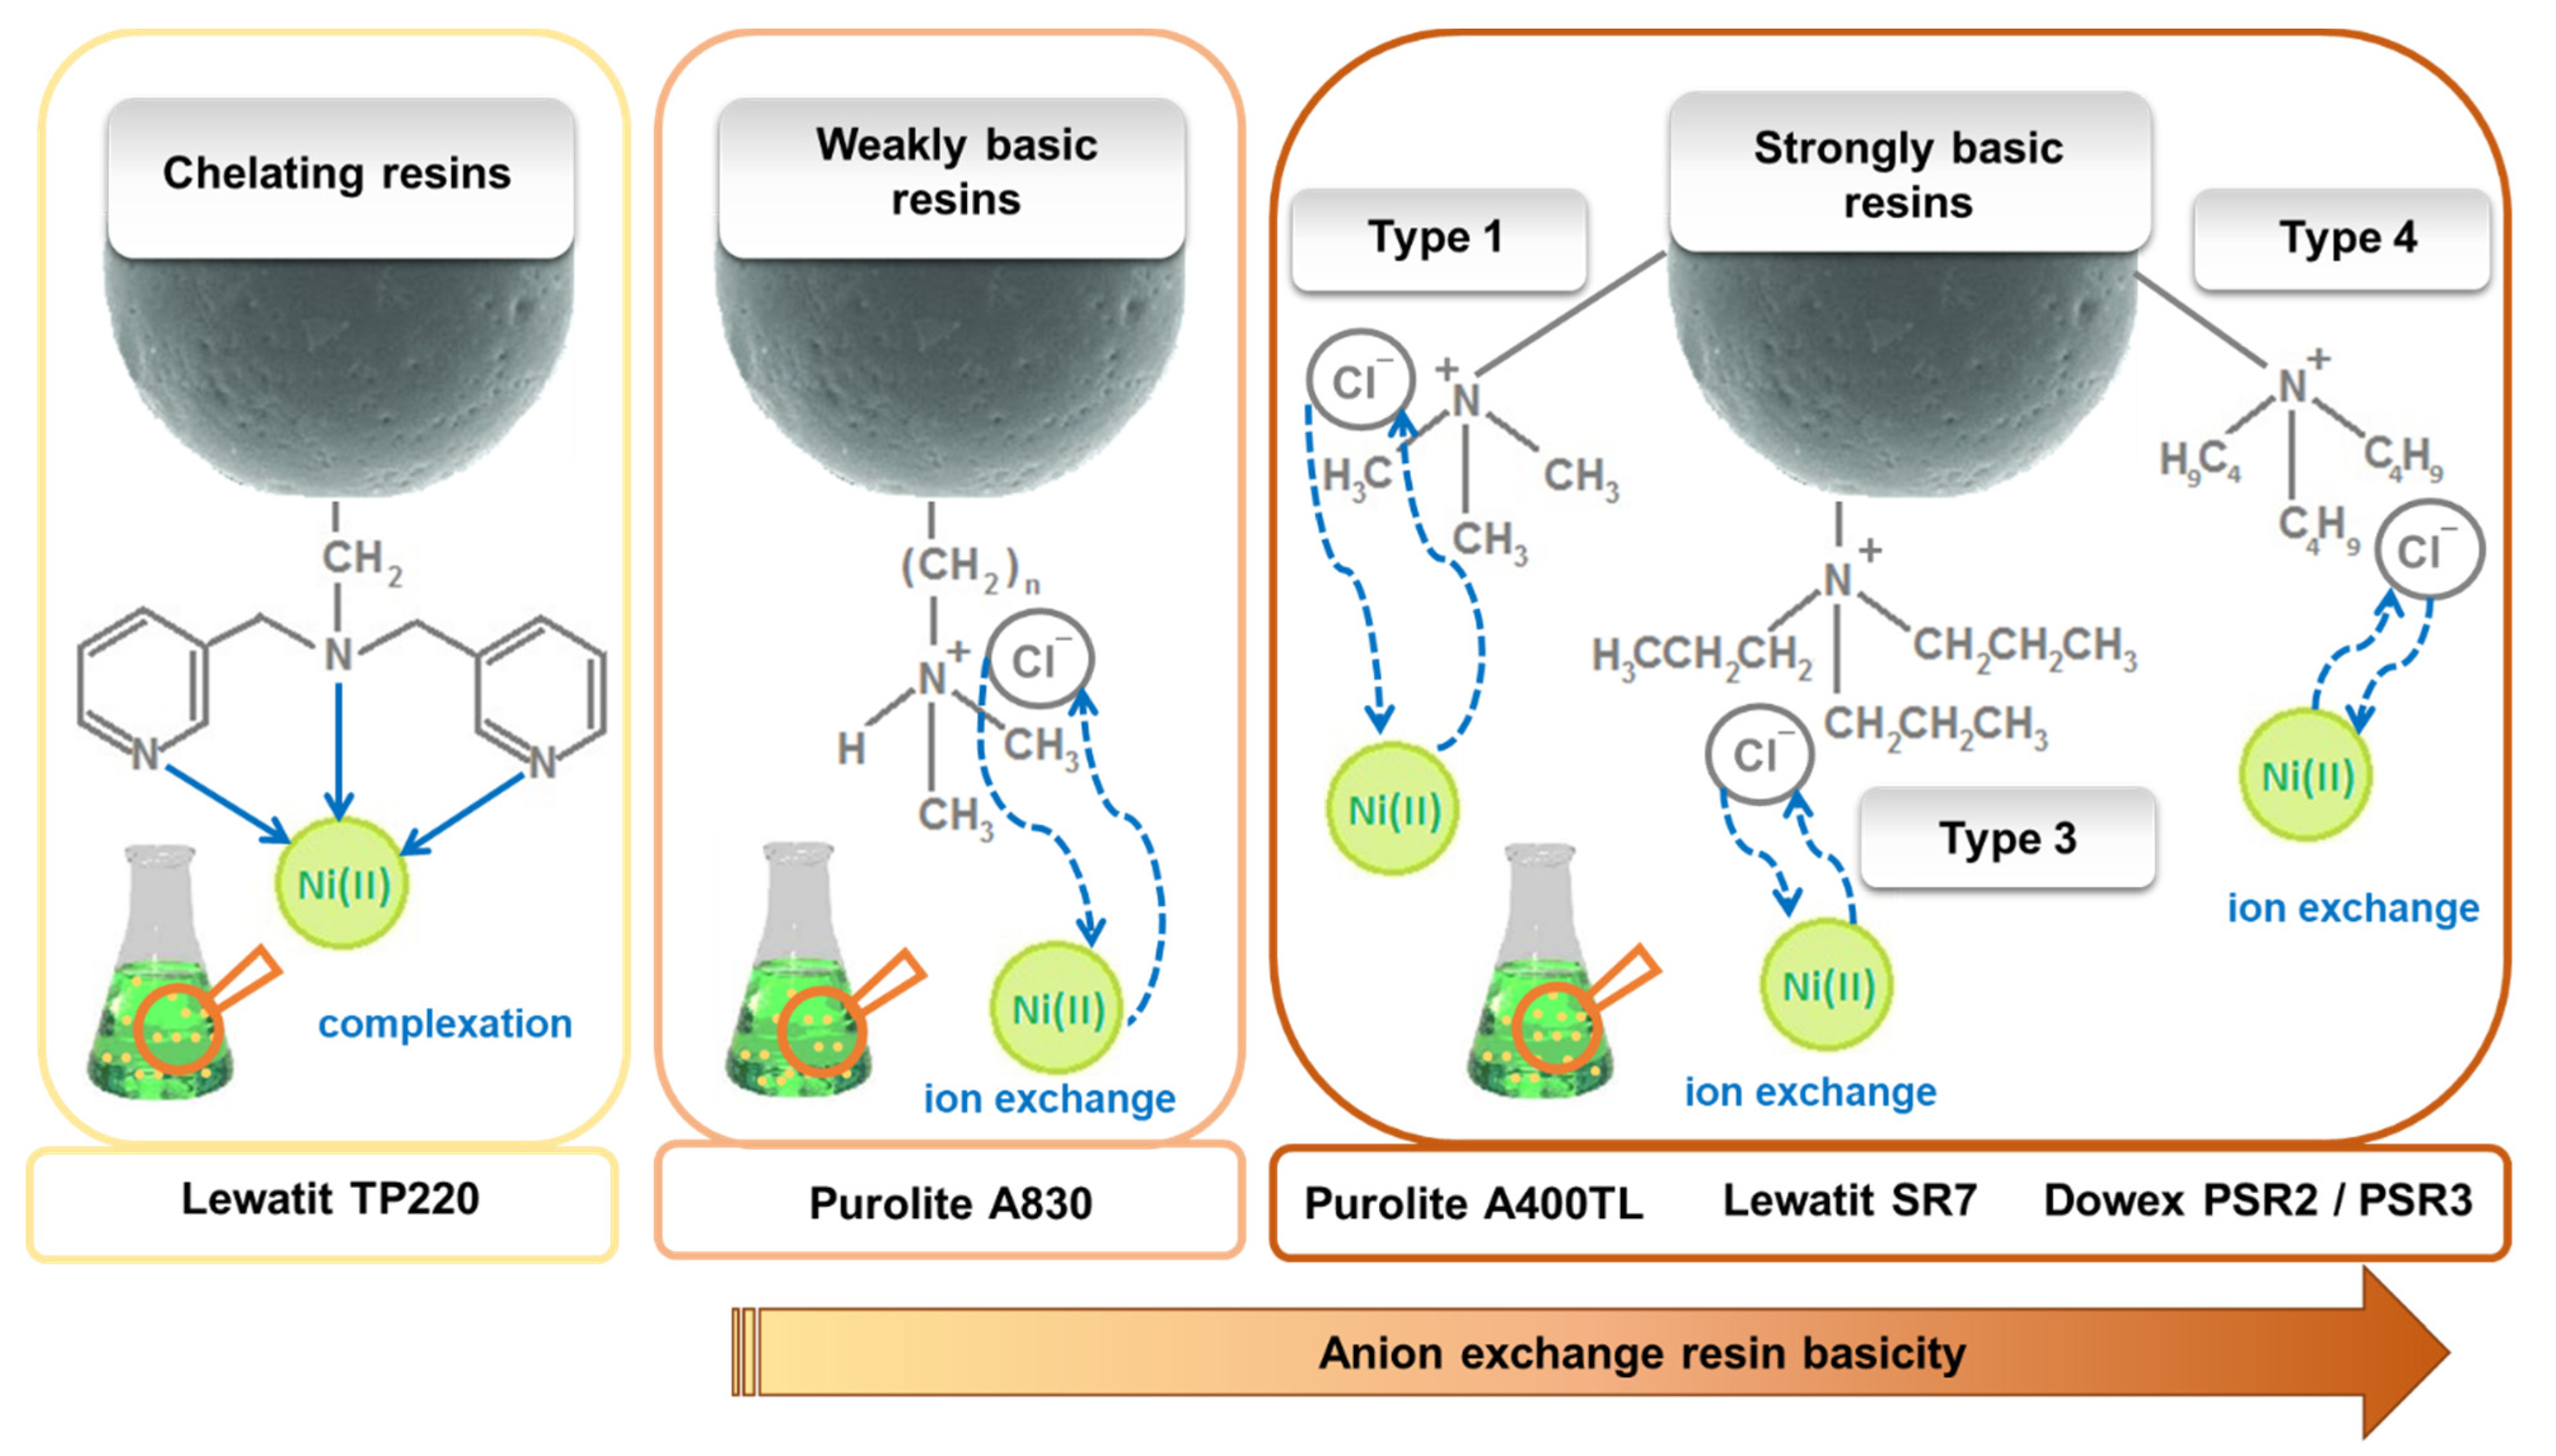
Based on the obtained equilibrium data, Figure 8 presents a possible mechanism of Ni(II) retention by the resins of various basicity values of the functional groups in the acidic medium.
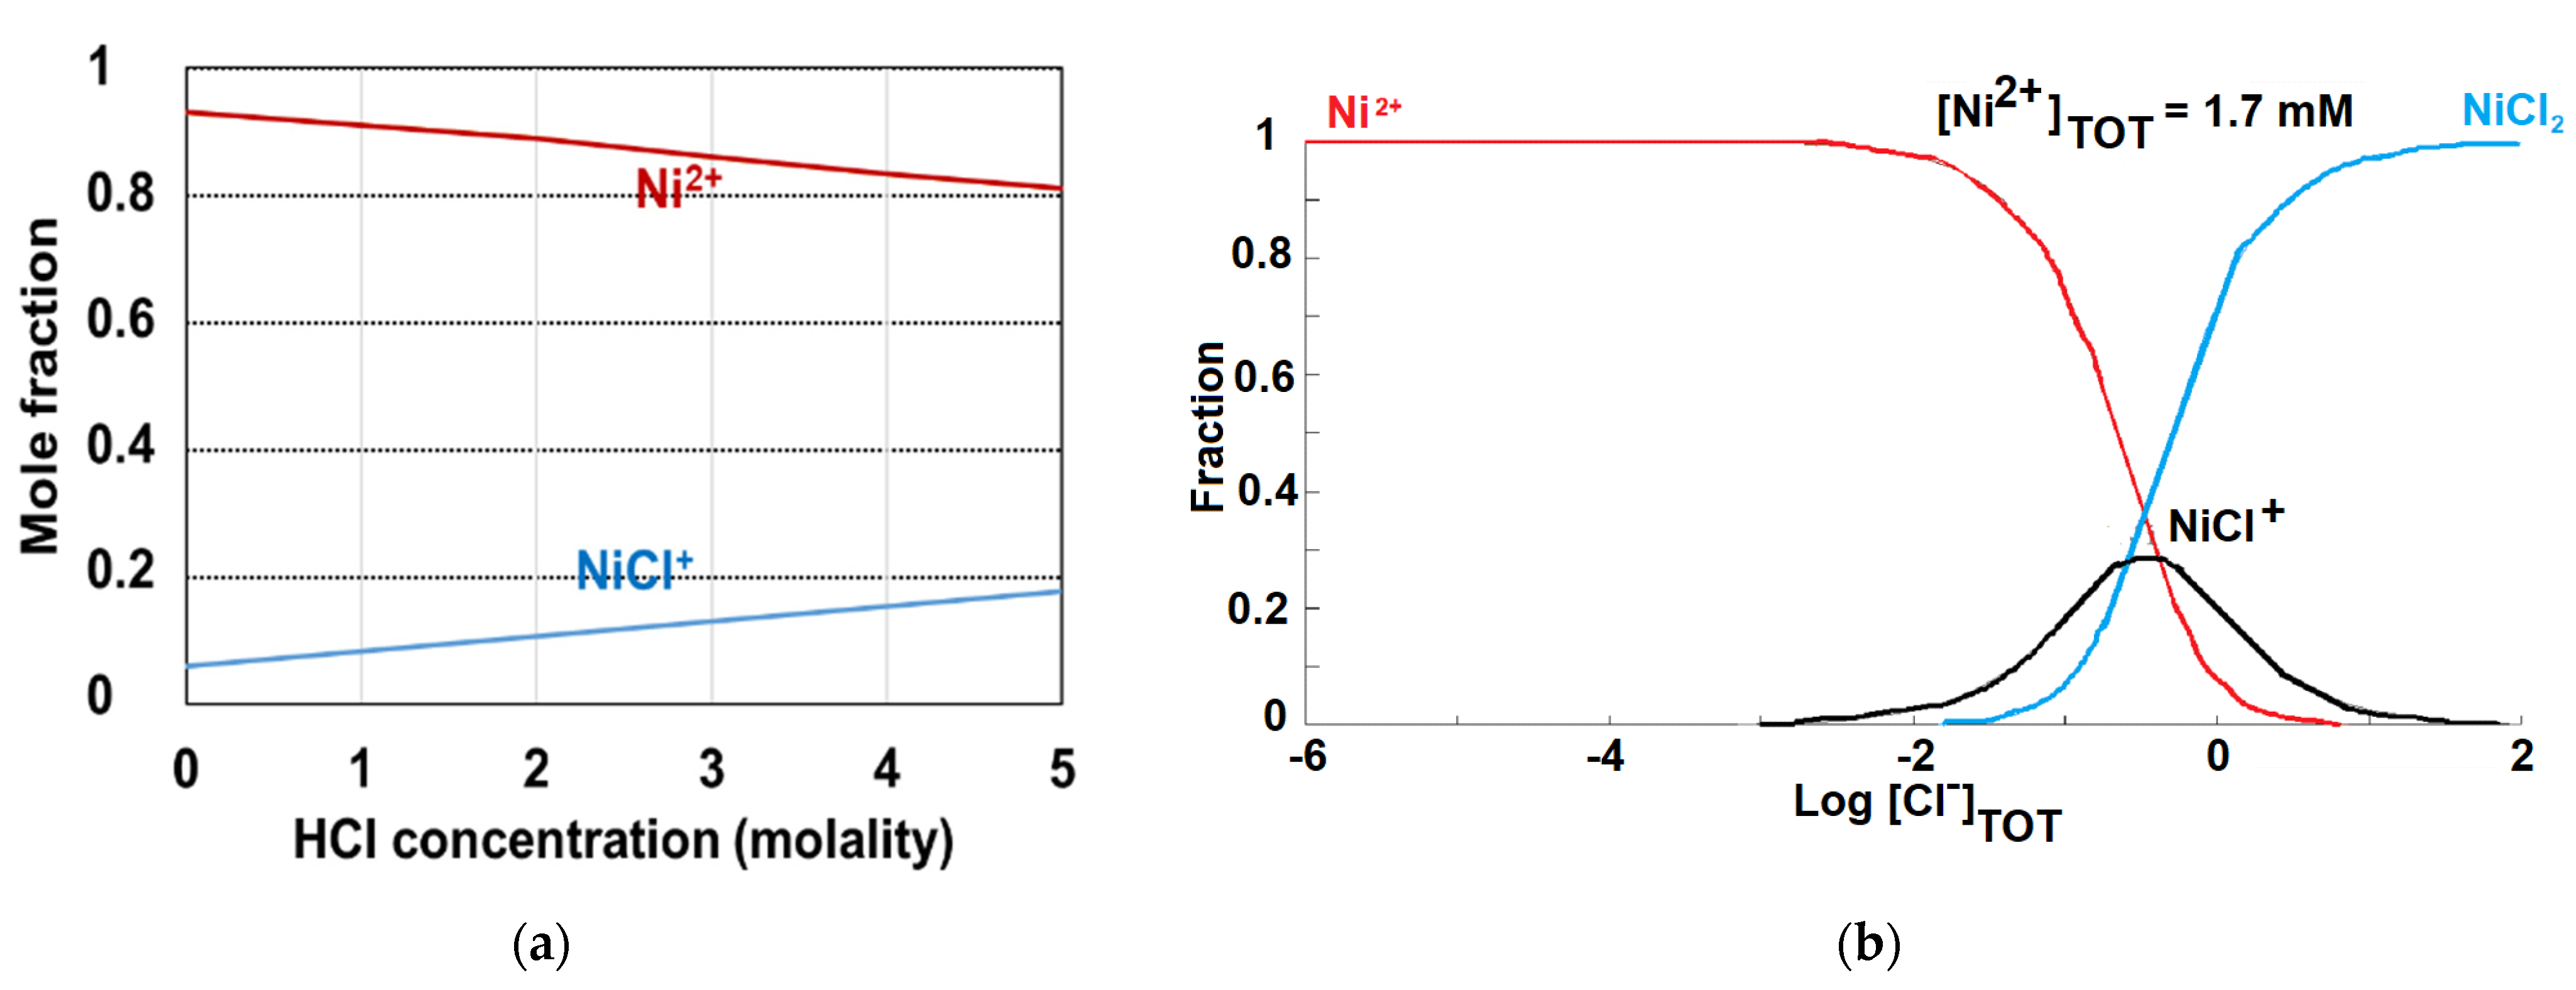
In order to assess and explain the adsorption capacity of the adsorbents, it is necessary to consider the complexes that can be formed in the hydrochloric acid solutions, as well as the nature and physical properties of the adsorbents under discussion. Based on the literature, spectrophotometric and anion-exchange measurements [43,61,65,66] in the hydrochloric acid system nickel ions form complexes with the chloride and hydroxide ions. Most of nickel exist as Ni2+ up to 5 M HCl [66,67], but in aqueous solutions at chloride concentrations up to 0.66 M, the formation of nickel complexes such as NiCl+ and NiCl2 starts (Ni2+ + Cl = NiCl+, equilibrium constant reported by the Russian Academy of Science, K = 2.1265; Ni2+ + 2Cl = NiCl2,aq K = 5.9237) [55]. The NiCl+ concentration gradually increased with the increasing concentration of HCl, whereas the concentration of Ni2+ decreased (Figure 9) [66]. With the hydrochloric acid concentration increase, the absorption spectrum general shift to longer wavelengths and octahedral complexes such as [NiCl × 5H2O]+ and [NiCl2 × 4H2O] can be formed (substitution of water molecules by the chloride ions in the first coordination sphere of the [Ni × 6H2O]2+ ion). The formation of anionic nickel(II) chloro-complexes [NiCl4]2− in the concentrated HCl solutions is not clearly stated [55]. The nickel ion reacts also with the hydroxide ion to form the complexes of the following composition: NiOH+, Ni(OH)2aq, Ni(OH)3, Ni2OH3+, and Ni4(OH)44+, but at the high concentration of HCl the hydroxide ion concentration is so low that the formation of nickel hydroxide complexes can be neglected. The mass and charge balance equations obtained for the strong HCl solution by Lee and Nam [67] were the following: [Cl]total = 2[NiCl2]total + [HCl]total = [Cl] + [NiCl+] + 2[NiCl2aq]; [Ni]total = [NiCl2]total = [Ni2+] + [NiCl+] + [NiCl2aq] and [H+] = [HCl]total.
Moreover, Table 6 makes a comparison of the sorptive properties of investigated materials with the data published in the literature possible.

3.3. FTIR-ATR Analysis of Pure and Loaded TP220 by Ni(II)

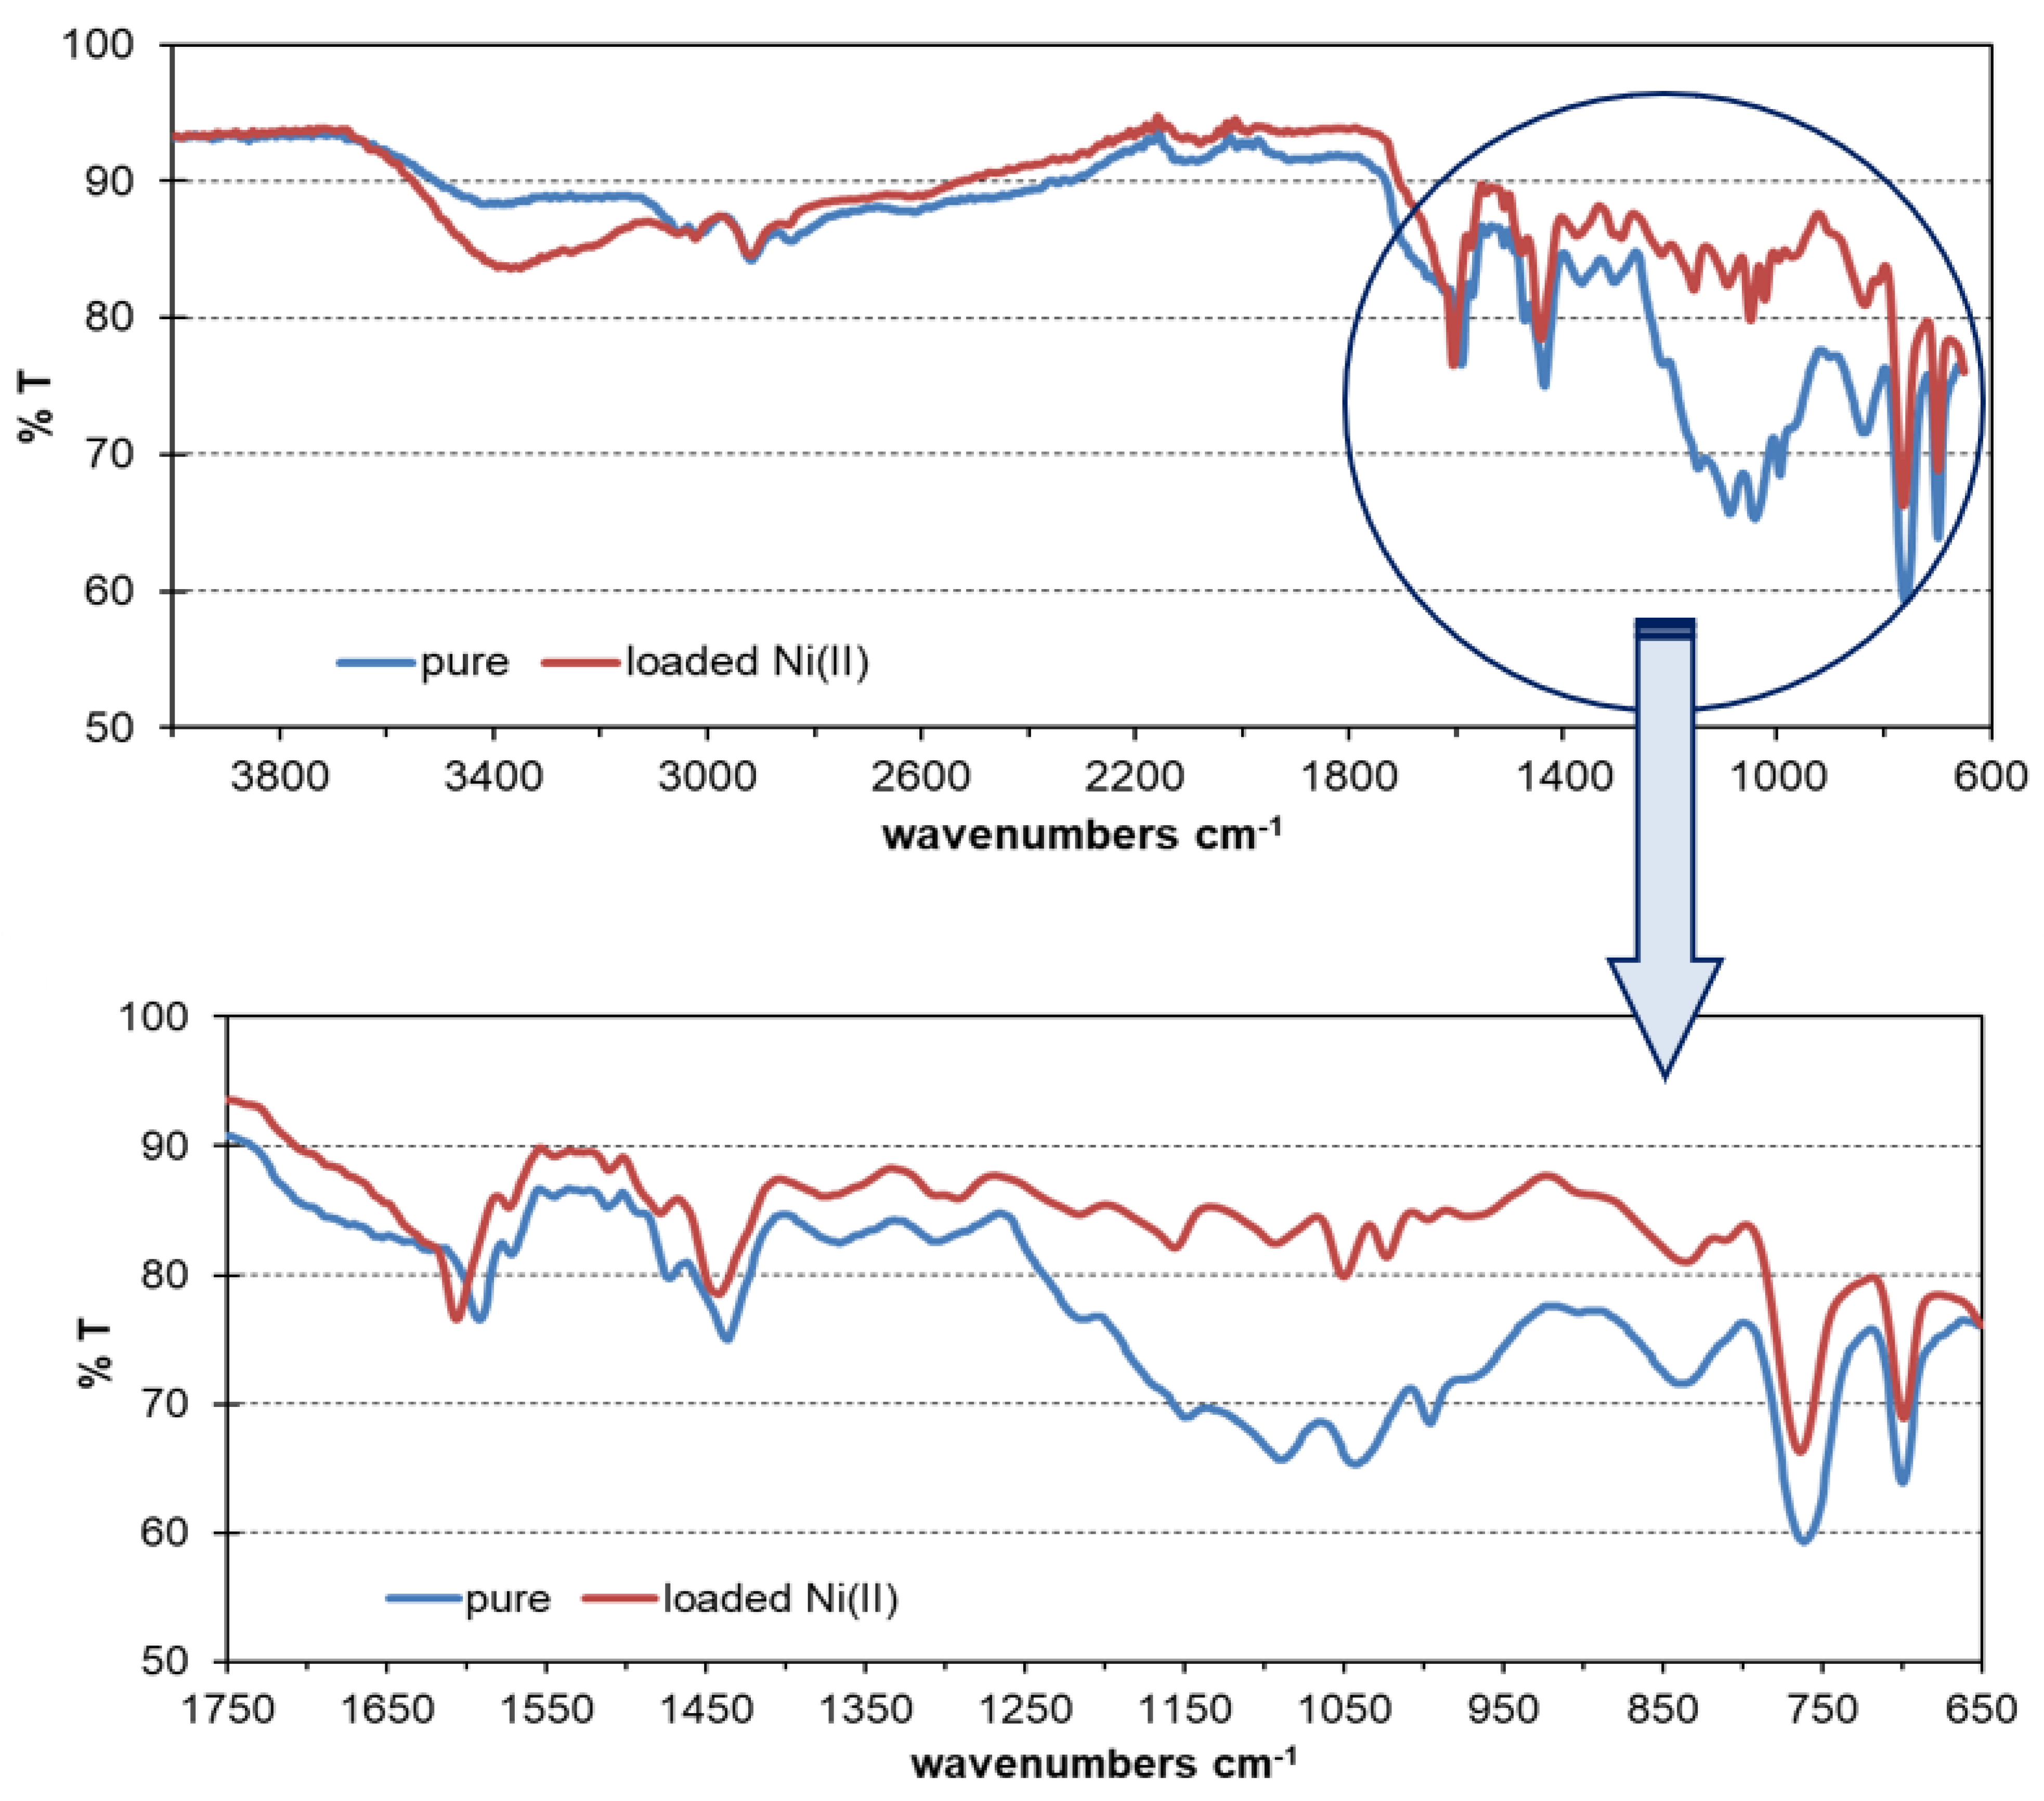
The Fourier-transform infrared spectra with the ATR mode (FTIR-ATR) for TP220 before and after the Ni(II) adsorption are shown in Figure 10. The obtained FTIR-ATR spectra of TP220 before the adsorption (pure, without metal ions) show the characteristic bands for the bis(picolylamine) functional groups as well as for the polystyrene matrix which was previously described in the paper by Wołowicz and Hubicki [43], Kołodyńska et al. [68], Zagorodni et al. [69], Lazar et al. [70], Ghosh et al. [71], and Traboulsi et al. [72]. The spectra confirm the ion exchange resin structure as well as the composition. In the higher frequency region, big, broad bands between 3700 cm−1 and 3100 cm−1 with the maximum located at about 3421 cm−1 were observed, reflecting the stretching vibrations of the –OH group (residual hydration water), but this peak is not the structural part of the resin. The peak assigned to the asymmetric stretching vibrations of –C–H of the benzene ring at 3048 cm−1 and the bands assigned to the asymmetric and symmetric stretching vibrations of the –CH2 group at 2800–3000 cm−1 confirmed the polystyrene structure of TP220. The peaks characteristic of the styrene–divinylbenzene backbone were described in detail in ref 72. There were found to be the stretching vibrations of –C–H of benzene rings (3083, 3059, 3025, 3001 cm−1), asymmetric stretching vibrations of –CH2 and –CH3 in –CH3–N (2915 cm−1), symmetric stretching vibrations of –CH2 and –CH3 in –CH3–N (2849 cm−1), stretching vibrations of –C=C– of benzene rings, deformation vibrations of –CH2–N+(CH3)3…OH (1602, 1582 cm−1), stretching vibrations of –C=C– of benzene rings, –C–H asymmetric deformation vibrations of CH3 (1493 cm−1), C–H deformation vibrations of –CH2 and –CH3, –C=C– stretching vibrations, scissoring vibrations of –CH2 (1452 cm−1), C–H deformation vibrations of the aliphatic group >CH– (1372 cm−1), –C–H plane deformation vibrations of benzene rings (1151, 1155, 1068, 1028 cm−1), as well as C–H out-of-plane deformation vibrations of monosubstituted benzene rings (905, 840, 755 cm−1) [72].
Peaks characteristic of bis-picolylamine (bis(2-pyridyl-methyl)amine) functional groups are also present, such as skeletal vibrations of pyridine, in-plane and out-of-plane C–C–H deformations in pyridine rings, stretching vibrations of C=N and C–N bonds, as well as stretching vibrations of aliphatic amino groups, (1590, 1471, 1437, 995–699 cm−1) [43,49,69]. After the adsorption of Ni(II) on TP220, it was found that some of the bands reduced its intensity and the maxima of some peaks were moved to the major wave length. Such changes are observed in the region in which the functional groups were confirmed (C=N and C–N bond, pyridine, and aliphatic amine) indicating that the functional groups play a part in the mechanism of sorption and a coordinate bond with metals is formed [49].

3.4. Desorption of Ni(II)

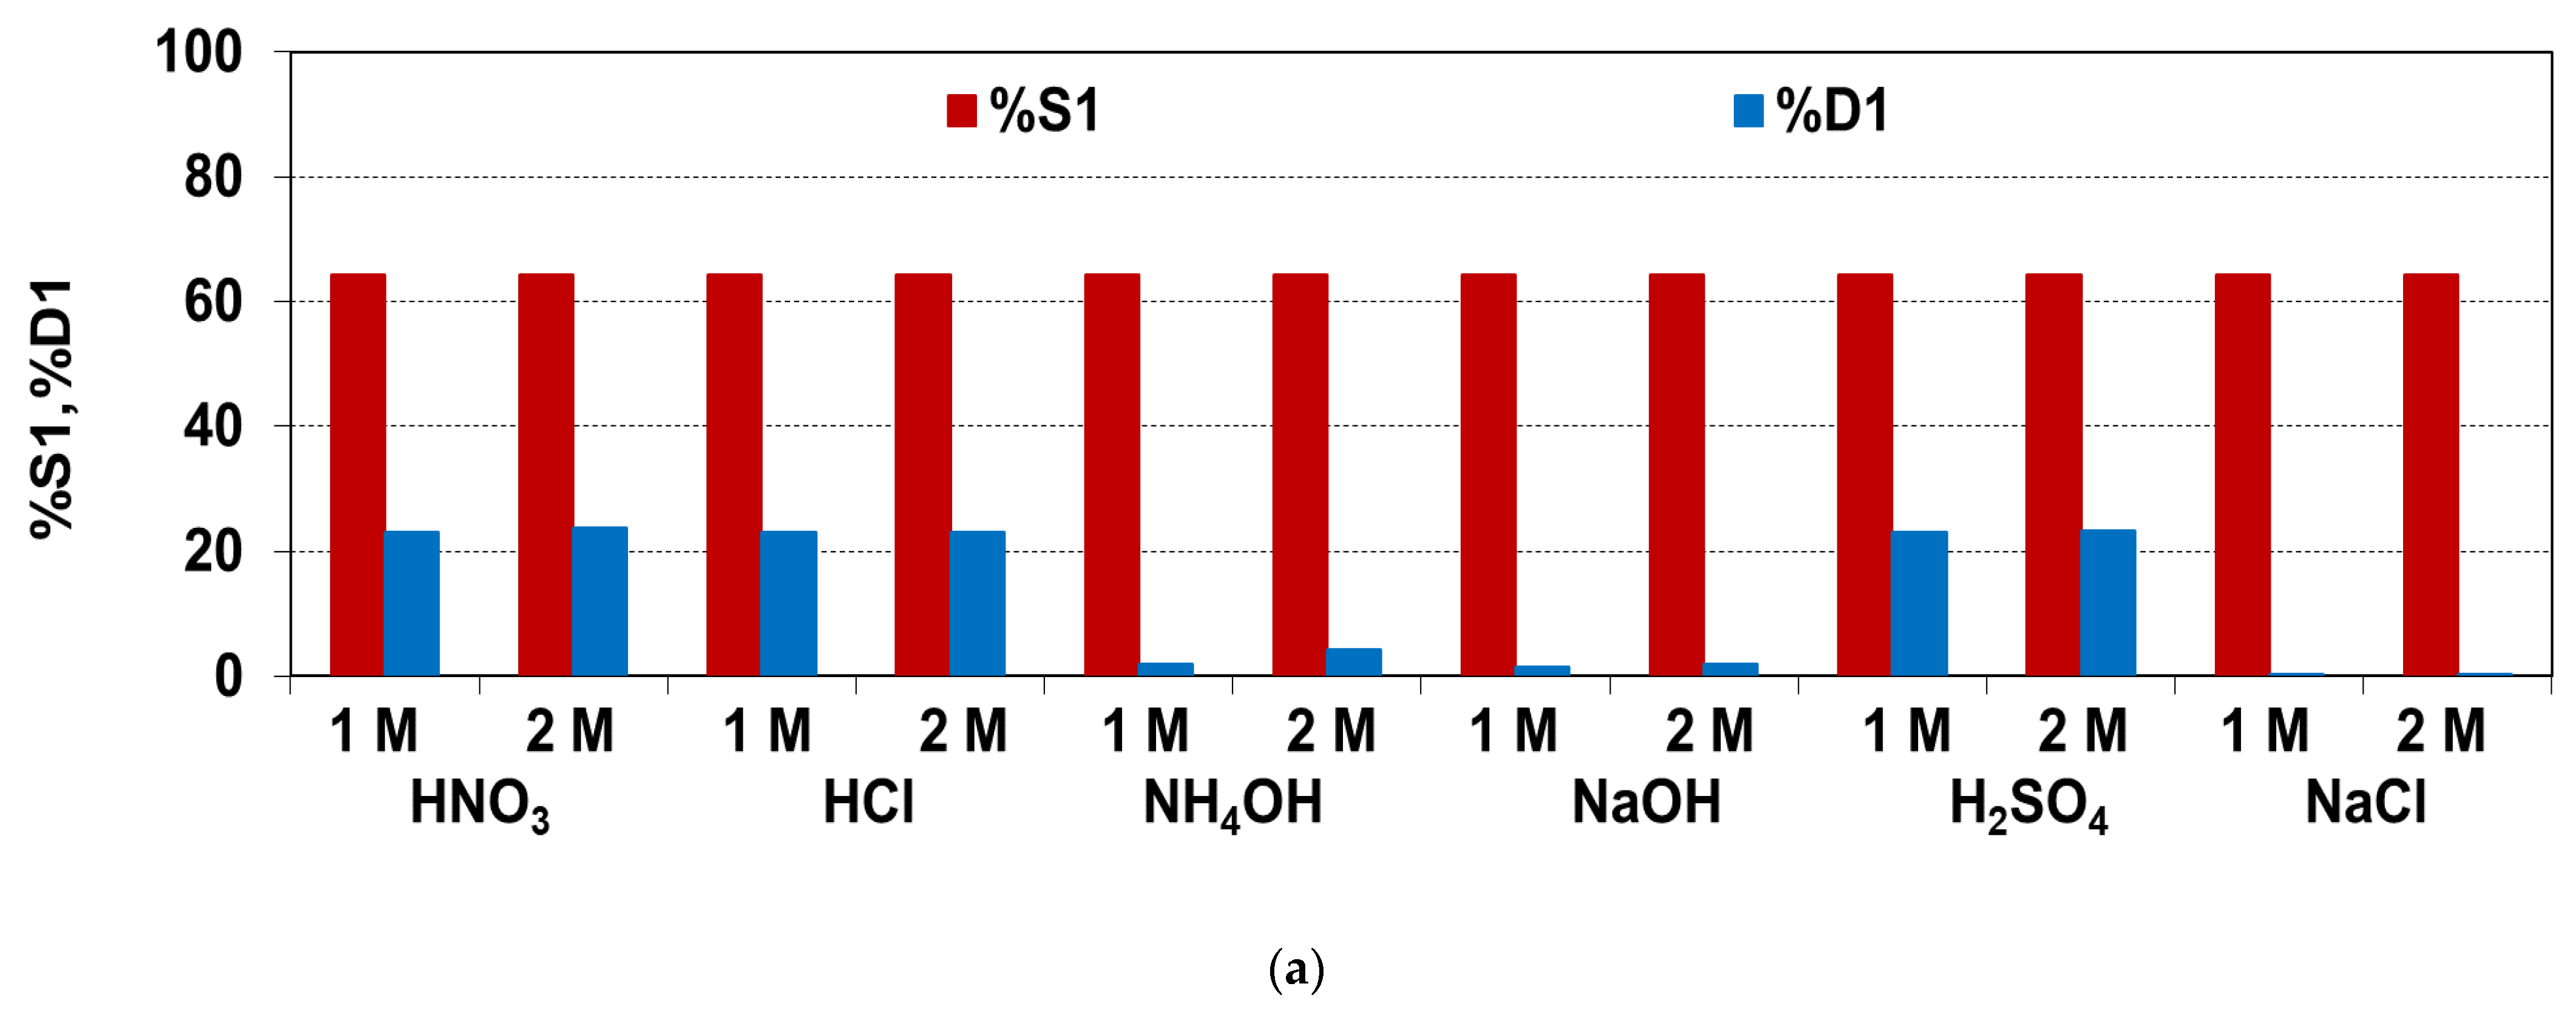
From the economic point of view, the high adsorption in a short time towards pollutions as well as the sorbent desorption possibility and its reuse are important factors influencing the total cost of adsorption removal. As was pointed out by Zong et al. [49], the price of Dowex M4195 as well as TP220 is 134.6 USD/kg, therefore their regeneration and reuse could reduce the cost. Therefore, the desorption possibility and TP220 reuse were analyzed. As described in the experimental section, 50 mL of the eluting agents (HNO3, HCl, H2SO4, NH4OH, NaOH, NaCl) of the 1.0 M and 2.0 M concentrations were applied in the desorption test. The loaded anion exchange resin (sorption from 0.1 M HCl—100 mg Ni(II)/L, t = 4 h) was contacted with the above-mentioned solutions for 2 h and then the percentage desorption of Ni(II) was calculated based on Equation (13). Three cycles of sorption–desorption were made, and the percentage of sorption after the first (%S1), second (%S2), and third (%S3), as well as the percentage of desorption after the first (%D1), second (%D2), and third (%D3) cycles were calculated. In %D2 and %D3, the amounts of not-desorbed Ni(II) were taken into account during calculations. The results of Ni(II) sorption and desorption after the first cycles are depicted in Figure 11a. It was found that the eluting agents are characterized by diverse behavior towards loaded Ni(II). The %D1 was the smallest in the case of the ammonium hydroxide, sodium hydroxide, and sodium chloride solutions. In this case, the %D1 was close to 2–4%. With the NH4OH and NaOH concentration increase, the %D1 was the highest but still very low, i.e., %D1 = 2.06% for 1 M NH4OH and %D1 = 4.23% for 2 M NH4OH.
Much higher desorption yield was obtained using the acids such hydrochloric, nitric(V), and sulfuric(VI) onces acids. In all cases, the desorption yield after the first cycle was close to 22–23%; therefore, acids were selected for desorption in the second and third cycles (Figure 11b). It was found that the ability of TP220 in the second and third cycles was slightly reduced, which resulted from the incomplete regeneration of anion exchange resins, but the adsorption was still high. Moreover, in the second and third desorption cycles, the desorption yield decreased, i.e., %D1 = 23.8%, %D2 = 6.7%, %D3 = 4.5% for 2 M HNO3. The small desorption yield and its decrease with the increasing number of cycles indicated strong interactions between the Ni(II) and functional groups of TP220, and proved the coordinate mechanism of adsorption.

4. Conclusions

The adsorbents of different matrices, structures and functional groups, such as S984, TP220, A830, SR7, A400TL, PSR2, PSR3 and AF5, were selected for Ni(II) removal from the acidic solutions of different composition such as HCl, HCl/HNO3 systems. It was found that Lewatit MonoPlus TP220 shows the highest adsorption ability towards Ni(II) (%R = 62.4%) compared to the other adsorbent; %R was in the range from 32.9% to 55.2% for the 0.1 M HCl system. In the HCl/HNO3 systems, TP220 as well as S984 exhibited the highest percentage removal (48.8% for TP220, 54.3% for S984, 0.1 M HCl/0.9 M HNO3). The adsorption mechanism of Ni(II) on the adsorbents was examined, studying the kinetic and isotherm models. The pseudo-first-order, pseudo-second-order, and intraparticle diffusion kinetic models as well as the Langmuir, Freundlich, Temkin, Dubinin–Radushkevich isotherm models were applied to provide the best fit to the data. Taking into account the correlation coefficient and error analysis, the PSO model showed the best parameters but the fitting was not satisfactory. Intraparticle diffusion, as well as film diffusion, could be the rate limiting steps. Moreover, the Freundlich model confirmed favorable uptake of Ni(II) ions by TP220. The desorption studies (%D1 = 22–23%) similar to the FTIR-ATR analysis of TP220 before and after the Ni(II) adsorption demonstrated that TP220 interacts with Ni(II), the interactions are strong, the coordinate mechanism takes place, and the functional groups are involved in the Ni(II) removal. TP220 as a new generation anion exchanger is characterized by high adsorption ability of Ni(II) from acidic solutions and may be considered as a good candidate for wastewater treatment from nickel-containing wastes. The preliminary research presented in this paper may become the basis for the development of an effective method of nickel ion removal on an industrial scale. However, additional tests in a column system regarding the kinetics of the process, desorption (100 cycles of sorption–desorption), and the mechanical strength of the ion exchanger, as well as a thorough economic analysis of the process, are required. It is also necessary to investigate the selectivity of the TP220 exchanger towards heavy metals contained in real wastewaters.

Author Contributions

Conceptualization, A.W.; methodology, A.W.; software, A.W. and M.W.; validation, A.W. and M.W.; formal analysis, A.W.; investigation, A.W.; resources, A.W. and M.W.; data curation, A.W.; writing—original draft preparation, A.W. and M.W.; writing—review and editing, A.W. and M.W.; visualization, A.W. and M.W.; supervision, A.W. All authors have read and agreed to the published version of the manuscript.

Funding

This research received no external funding.

Institutional Review Board Statement

Not applicable.

Informed Consent Statement

Not applicable.

Data Availability Statement

Not applicable.

Conflicts of Interest

The authors declare no conflict of interest.

Abbreviations

MCL (mg/L)maximum contaminant level
HYDRAHydrochemical Equilibrium Constant Database
MEDUSAMake Equilibrium Diagrams Using Sophisticated Algorithms
qt (mg/g)the amount of Ni(II) sorbed by the adsorbents at time t
qe (mg/g)the amount of Ni(II) sorbed at the equilibrium
C0 (mg/L)the Ni(II) concentration in the solution before sorption
Ct (mg/L)the Ni(II) concentration in the solution after sorption
Ce (mg/L)the Ni(II) concentrations in the solution after sorption at equilibrium
t (min)the phase contact time
V (L)the volume of the Ni(II) solution
m (g)the mass of the adsorbent
PFOthe pseudo-first-order kinetic model
k1 (1/min)the rate constant of sorption determined from PFO equation
PSOthe pseudo-second-order kinetic model
k2 (g/mg min)the rate constant of sorption determined from PSO equation
IPDthe intraparticle diffusion kinetic model
ki (mg/g min0.5)the intraparticle diffusion rate constant
kF (mg1−1/n L1/n/g)the Freundlich constant related to the adsorption capability
nthe Freundlich constant related to adsorption intensity
kL (L/mg)the constant parameter of adsorption equilibrium
Q0 (mg/g)the monolayer adsorption capacity
bT (J g/mol mg)Temkin constant related to the heat of adsorption
A (L/mg)the Temkin isotherm equilibrium binding constant
qm (mg/g)the maximum adsorption capacity
kDR (mol2 J2)the constant related to the adsorption energy
ε (J/mol)the adsorption potential
R (J/mol K)the gas constant
T (K)the temperature
MPSDMarquardt’s percent standard deviation
R2the determination coefficient
R a d j 2 the adjusted R-squared
qe exp (mg/g)the experimental amount of Ni(II) sorbed at equilibrium
qe cal (mg/g)the amount of Ni(II) sorbed calculated from the non-linear models
qe mean (mg/g)the measured by the means of qe exp values
nthe number of points in the data sample
kthe number of independent regressors
FTIR-ATRthe Fourier-transform infrared spectroscopy with the attenuated total reflection
D (%)the percentage values of Ni(II) desorbed from adsorbent
mdes (mg)the mass of Ni(II) desorbed
mads (mg)the mass of Ni(II) adsorbed.

References

  1. Iyaka, Y.A. Nickel in soils: A review of its distribution and impacts. Sci. Res. Essays 2011, 6, 6774–6777. [Google Scholar] [CrossRef]
  2. Vakili, M.; Rafatullah, M.; Yuan, J.; Zwain, H.M.; Mojiri, A.; Gholami, Z.; Gholami, F.; Wang, W.; Giwa, A.S.; Yu, Y.; et al. Nickel ion removal from aqueous solutions through the adsorption process: A review. Rev. Chem. Eng. 2020. [Google Scholar] [CrossRef]
  3. Harasim, P.; Filipek, T. Nickel in the environment. J. Elem. 2015, 20, 525–534. [Google Scholar] [CrossRef] [Green Version]
  4. Duda-Chodak, A.; Błaszczyk, U. The impact of nickel on human health. J. Elementol. 2008, 13, 685–696. [Google Scholar]
  5. Nieminen, T.M.; Ukonmaanaho, L.; Rausch, N.; Shotyk, W. Biogeochemistry of Nickel and Its Release into the Environment. Nickel Surpris. Impact Nat. 2007, 2, 1–29. [Google Scholar] [CrossRef] [Green Version]
  6. Pacyna, J.M.; Pacyna, E.G. An assessment of global and regional emissions of trace metals to the atmosphere from anthropogenic sources worldwide. Environ. Rev. 2001, 9, 269–298. [Google Scholar] [CrossRef]
  7. Gambuś, F.; Wieczorek, J. Pollution of fertilizers with heavy metals. Ecol. Chem. Eng. A 2012, 19, 353–360. [Google Scholar] [CrossRef]
  8. Łukowski, A.; Wiater, J. The influence of mineral fertilization on heavy metal fraction contents in soil. Part II. Copper and nickel. Pol. J. Environ. Stud. 2009, 18, 645–650. [Google Scholar]
  9. Coman, V.; Robotin, B.; Ilea, P. Nickel recovery/removal from industrial wastes: A review. Resour. Conserv. Recycl. 2013, 73, 229–238. [Google Scholar] [CrossRef]
  10. Barakat, M. New trends in removing heavy metals from industrial wastewater. Arab. J. Chem. 2011, 4, 361–377. [Google Scholar] [CrossRef] [Green Version]
  11. Renu; Agrawal, M.; Singh, K. Heavy metal removal from wastewater using various adsorbents: A review. J. Water Reuse Desalin. 2016, 7, 387–419. [Google Scholar] [CrossRef]
  12. Tripathi, A.; Ranjan, M.R. Heavy Metal Removal from Wastewater Using Low Cost Adsorbents. J. Bioremediat. Biodegrad. 2015, 6, 315–320. [Google Scholar] [CrossRef]
  13. Borba, C.; Guirardello, R.; Silva, E.; Veit, M.; Tavares, C. Removal of nickel(II) ions from aqueous solution by biosorption in a fixed bed column: Experimental and theoretical breakthrough curves. Biochem. Eng. J. 2006, 30, 184–191. [Google Scholar] [CrossRef]
  14. Genchi, G.; Carocci, A.; Lauria, G.; Sinicropi, M.S.; Catalano, A. Nickel: Human Health and Environmental Toxicology. Int. J. Environ. Res. Public Health 2020, 17, 679. [Google Scholar] [CrossRef] [Green Version]
  15. EFSA Panel on Contaminants in the Food Chain (CONTAM). Scientific Opinion on the risks to public health related to the presence of nickel in food and drinking water. EFSA J. 2015, 13, 4002. [Google Scholar] [CrossRef] [Green Version]
  16. Khulbe, K.C.; Matsuura, T. Removal of heavy metals and pollutants by membrane adsorption techniques. Appl. Water Sci. 2018, 8, 19. [Google Scholar] [CrossRef] [Green Version]
  17. Liu, L.; Li, W.; Song, W.; Guo, M. Remediation techniques for heavy metal-contaminated soils: Principles and applicability. Sci. Total Environ. 2018, 633, 206–219. [Google Scholar] [CrossRef]
  18. Kumar, D.; Khan, E.A. 12—Remediation and detection techniques for heavy metals in the environment. In Heavy Metals in the Environment: Impact, Assessment, and Remediation; Candice Janco: Cambridge, MA, USA, 2020; pp. 205–222. [Google Scholar]
  19. Geng, H.; Xu, Y.; Zheng, L.; Gong, H.; Dai, L.; Dai, X. An overview of removing heavy metals from sewage sludge: Achievements and perspectives. Environ. Pollut. 2020, 266, 115375. [Google Scholar] [CrossRef]
  20. Azimi, A.; Azari, A.; Rezakazemi, M.; Ansarpour, M. Removal of Heavy Metals from Industrial Wastewaters: A Review. ChemBioEng Rev. 2017, 4, 37–59. [Google Scholar] [CrossRef]
  21. Beltrán-Heredia, J.; Martín, J.S. Removing heavy metals from polluted surface water with a tannin-based flocculant agent. J. Hazard. Mater. 2009, 165, 1215–1218. [Google Scholar] [CrossRef]
  22. Al-Shannag, M.; Al-Qodah, Z.; Bani-Melhem, K.; Qtaishat, M.R.; Alkasrawi, M. Heavy metal ions removal from metal plating wastewater using electrocoagulation: Kinetic study and process performance. Chem. Eng. J. 2015, 260, 749–756. [Google Scholar] [CrossRef]
  23. Lakhdhar, I.; Belosinschi, D.; Mangin, P.; Chabot, B. Development of a bio-based sorbent media for the removal of nickel ions from aqueous solutions. J. Environ. Chem. Eng. 2016, 4, 3159–3169. [Google Scholar] [CrossRef]
  24. Mohsen-Nia, M.; Montazeri, P.; Modarress, H. Removal of Cu2+ and Ni2+ from wastewater with a chelating agent and reverse osmosis processes. Desalination 2007, 217, 276–281. [Google Scholar] [CrossRef]
  25. Samper, E.; Rodríguez, M.; De La Rubia, M.; Rico, D.P. Removal of metal ions at low concentration by micellar-enhanced ultrafiltration (MEUF) using sodium dodecyl sulfate (SDS) and linear alkylbenzene sulfonate (LAS). Sep. Purif. Technol. 2009, 65, 337–342. [Google Scholar] [CrossRef]
  26. Moghbeli, M.; Khajeh, A.; Alikhani, M. Nanosilica reinforced ion-exchange polyHIPE type membrane for removal of nickel ions: Preparation, characterization and adsorption studies. Chem. Eng. J. 2017, 309, 552–562. [Google Scholar] [CrossRef]
  27. Anirudhan, T.S.; Radhakrishnan, P.G. Uptake and desorption of nickel(II) using polymerised tamarind fruit shell with acidic functional groups in aqueous environments. Chem. Ecol. 2010, 26, 93–109. [Google Scholar] [CrossRef]
  28. Fil, B.A.; Boncukcuoğlu, R.; Yilmaz, A.E.; Bayar, S. Adsorption of Ni(II) on ion exchange resin: Kinetics, equilibrium and thermodynamic studies. Korean J. Chem. Eng 2020, 29, 1232–1238. [Google Scholar] [CrossRef]
  29. Crini, G.; Lichtfouse, E. Advantages and disadvantages of techniques used for wastewater treatment. Environ. Chem. Lett. 2019, 17, 145–155. [Google Scholar] [CrossRef]
  30. Sharma, S.; Bhattacharya, A. Drinking water contamination and treatment techniques. Appl. Water Sci. 2017, 7, 1043–1067. [Google Scholar] [CrossRef] [Green Version]
  31. Kanamarlapudi, S.L.R.K.; Chintalpudi, V.K.; Muddada, S. Application of biosorption for removal of heavy metals from wastewater. InTech 2018, 4, 69–116. [Google Scholar]
  32. Couto, C.F.; Lange, L.C.; Amaral, M.C.S. A critical review on membrane separation processes applied to remove pharmaceutically active compounds from water and wastewater. J. Water Process. Eng. 2018, 26, 156–175. [Google Scholar] [CrossRef]
  33. Fu, F.; Wang, Q. Removal of heavy metal ions from wastewaters: A review. J. Environ. Manag. 2011, 92, 407–418. [Google Scholar] [CrossRef]
  34. Rubio, J.; Souza, M.L.; Smith, R.W. Overview of flotation as a wastewater treatment technique. Miner. Eng. 2002, 15, 139–155. [Google Scholar] [CrossRef]
  35. Ahmad Panahi, H.; Samadi Zadeh, M.; Tavangari, S.; Moniri, E.; Ghassemi, J. Nickel adsorption from environmen-tal samples by ion imprinted aniline-formaldehyde polymer. Iranian J. Chem. Eng. 2012, 31, 35–44. [Google Scholar]
  36. El-Sadaawy, M.; Abdelwahab, O. Adsorptive removal of nickel from aqueous solutions by activated carbons from doum seed (Hyphaenethebaica) coat. Alex. Eng. J. 2014, 53, 399–408. [Google Scholar] [CrossRef] [Green Version]
  37. Do, Q.C.; Choi, S.; Kim, H.; Kang, S. Adsorption of Lead and Nickel on to Expanded Graphite Decorated with Manganese Oxide Nanoparticles. Appl. Sci. 2019, 9, 5375. [Google Scholar] [CrossRef] [Green Version]
  38. Silva, R.M.P.; Manso, J.P.H.; Rodrigues, J.R.; Lagoa, R. A comparative study of alginate beads and an ion-exchange resin for the removal of heavy metals from a metal plating effluent. J. Environ. Sci. Health Part A 2008, 43, 1311–1317. [Google Scholar] [CrossRef]
  39. Shen, Z.; Zhang, Y.; McMillan, O.; Jin, F.; Al-Tabbaa, A. Characteristics and mechanisms of nickel adsorption on biochars produced from wheat straw pellets and rice husk. Environ. Sci. Pollut. Res. 2017, 24, 12809–12819. [Google Scholar] [CrossRef] [Green Version]
  40. Kołodyńska, D. Polyacrylate anion exchangers in sorption of heavy metal ions with the biodegradable complexing agent. Chem. Eng. J. 2009, 150, 280–288. [Google Scholar] [CrossRef]
  41. Anah, L.; Astrini, N. Isotherm adsorption studies of Ni(II) ion removal from aqueous solutions by modified carboxymethyl cellulose hydrogel. IOP Conf. Ser. Earth Environ. Sci. 2018, 160, 012017. [Google Scholar] [CrossRef]
  42. Wołowicz, A.; Hubicki, Z. Polyactrylate ion exchangers in sorption of noble and base metal ions from single and tertiary component solutions. Solvent Extr. Ion Exch. 2014, 32, 189–205. [Google Scholar] [CrossRef]
  43. Wołowicz, A.; Hubicki, Z. The use of the chelating resin of a new generation Lewatit MonoPlus TP-220 with the bis-picolylamine functional groups in the removal of selected metal ions from acidic solutions. Chem. Eng. J. 2012, 197, 493–508. [Google Scholar] [CrossRef]
  44. Wołowicz, A.; Hubicki, Z. Sorption Behavior of Dowex PSR-2 and Dowex PSR-3 Resins of Different Structures for Metal(II) Removal. Solvent Extr. Ion Exch. 2016, 34, 375–397. [Google Scholar] [CrossRef]
  45. Wołowicz, A.; Hubicki, Z. Carbon-based adsorber resin Lewatit AF 5 applicability in metal ion recovery. Microporous Mesoporous Mater. 2016, 224, 400–414. [Google Scholar] [CrossRef]
  46. Wołowicz, A. Zinc(II) removal from model chloride and chloride–nitrate(V) solutions using various sorbents. Physicochem. Probl. Miner. Process. 2019, 55, 1517–1534. [Google Scholar]
  47. Wołowicz, A.; Hubicki, Z. Enhanced removal of copper(II) from acidic streams using functional resins: Batch and column studies. J. Mater. Sci. 2020, 55, 13687–13715. [Google Scholar] [CrossRef]
  48. How Much Does It Cost to Buy, Maintain, and Dispose of Ion Exchange Resins? Available online: Samcotech.com/how-much-does-it-cost-to-buy-maintain-and-dispose-of-ion-exchange-resins/ (accessed on 22 January 2021).
  49. Zong, L.; Liu, F.; Chen, D.; Zhang, X.; Ling, C.; Li, A. A novel pyridine based polymer for highly efficient separation of nickel from high-acidity and high-concentration cobalt solutions. Chem. Eng. J. 2018, 334, 995–1005. [Google Scholar] [CrossRef]
  50. Ho, Y.S.; McKay, G. Pseudo-second order model for sorption processes. Process. Biochem. 1999, 34, 451–465. [Google Scholar] [CrossRef]
  51. Wang, J.; Guo, X. Adsorption kinetic models: Physical meanings, applications, and solving methods. J. Hazard. Mater. 2020, 390, 122156. [Google Scholar] [CrossRef]
  52. Foo, K.; Hameed, B. Insights into the modeling of adsorption isotherm systems. Chem. Eng. J. 2010, 156, 2–10. [Google Scholar] [CrossRef]
  53. Marković, D.D.; Lekić, B.; Rajaković-Ognjanović, V.N.; Onjia, A.; Rajaković, L.V. A New Approach in Regression Analysis for Modeling Adsorption Isotherms. Sci. World J. 2014, 2014. [Google Scholar] [CrossRef] [PubMed] [Green Version]
  54. Sivarajasekar, N.; Baskar, R. Adsorption of Basic Magenta II onto H2SO4 activated immature Gossypium hirsutum seeds: Kinetics, isotherms, mass transfer, thermodynamics and process design. Arab. J. Chem. 2019, 12, 1322–1337. [Google Scholar] [CrossRef] [Green Version]
  55. Uzun, I.; Guzel, F. Adsorption of some heavy metal ions from aqueous solution by activated carbon and comparison of percent adsorption results of activated carbon with those of some other adsorbents. Turk. J. Chem. 2000, 24, 291–297. [Google Scholar]
  56. Satapathy, D.; Natarajan, G.S. Potassium bromate modification of the granular activated carbon and its effect on nickel adsorption. Adsorption 2006, 12, 147–154. [Google Scholar] [CrossRef]
  57. Wei, Y.-Z.; Feng, Q.; Arai, T.; Kumagai, M. Adsorption and Separation Behaviour of Cobalt, Nickel, and Copper in Nitrite Medium by Anion Exchanger. Solvent Extr. Ion Exch. 2002, 20, 561–573. [Google Scholar] [CrossRef]
  58. Keränen, A.; Leiviskä, T.; Salakka, A.; Tanskanen, J. Removal of nickel and vanadium from ammoniacal industrial wastewater by ion exchange and adsorption on activated carbon. Desalin. Water Treat. 2015, 53, 2645–2654. [Google Scholar] [CrossRef]
  59. Xiuling, S.; HuiPu, D.; Shijun, L.; Hui, Q. Adsorption Properties of Ni(II) by D301R Anion Exchange Resin. J. Chem. 2014, 2014, 1–5. [Google Scholar] [CrossRef] [Green Version]
  60. Deepatana, A.; Valix, M. Recovery of nickel and cobalt from organic acid complexes: Adsorption mechanisms of metal-organic complexes onto aminophosphonate chelating resin. J. Hazard. Mater. 2006, 137, 925–933. [Google Scholar] [CrossRef]
  61. Kołodyńska, D.; Hubicka, H. Polyacrylate anion exchangers in sorption of heavy metal ions with non-biodegradable complexing agents. Chem. Eng. J. 2009, 150, 308–315. [Google Scholar] [CrossRef]
  62. Douven, S.; Paez, C.A.; Gommes, C.J. The range of validity of sorption kinetic models. J. Colloid Interface Sci. 2015, 448, 437–450. [Google Scholar] [CrossRef]
  63. Płaziński, W.; Rudziński, W. Kinetyka adsorpcji na granicy faz roztwór/ciało stałe. Znaczenie równań pseudo-first order oraz pseudo-second order. Wiadomości Chem. 2011, 65, 11–12. [Google Scholar]
  64. Hu, Q.; Zhang, Z. Application of Dubinin–Radushkevich isotherm model at the solid/solution interface: A theoretical analysis. J. Mol. Liq. 2019, 277, 646–648. [Google Scholar] [CrossRef]
  65. Morris, D.; Reed, G.; Short, E.; Slater, D.; Waters, D. Nickel (II) chloride complexes in aqueous solution. J. Inorg. Nucl. Chem. 1965, 27, 377–382. [Google Scholar] [CrossRef]
  66. Mohanty, U.S.; Rintala, L.; Halli, P.; Avarmaa, K.; Reuter, M.A. Hydrometallurgical Approach for Leaching of Metals from Copper Rich Side Stream Originating from Base Metal Production. Metal 2018, 8, 40. [Google Scholar] [CrossRef] [Green Version]
  67. Lee, M.S.; Nam, S.H. Chemical Equilibria of Nickel Chloride in HCl Solution at 25 °C. Bull. Korean Chem. Soc. 2009, 30, 2203–2207. [Google Scholar] [CrossRef] [Green Version]
  68. Kołodyńska, D.; Hałas, P.; Michalski, R. Development of ion exchangers for the removal of health-hazardous perchlorate ions from aqueous systems. Appl. Geochem. 2019, 101, 75–87. [Google Scholar] [CrossRef]
  69. Zagorodni, A.A.; Kotova, D.L.; Selemenev, V.F. Infrared spectroscopy of ion exchange resins: Chemical deterioration of the resins. React. Funct. Polym. 2002, 53, 157–171. [Google Scholar] [CrossRef]
  70. Lazar, L.; Bulgariu, L.; Bandrabur, B.; Tataru-Farmus, R.-E.; Drobotă, M.; Gutt, G. FTIR Analisys of ion Exchange Resins with Application in Permanent Hard Water Softening. Environ. Eng. Manag. J. 2014, 13, 2145–2152. [Google Scholar] [CrossRef]
  71. Ghosh, S.; Dhole, K.; Tripathy, M.K.; Kumar, R.; Sharma, R.S. FTIR spectroscopy in the characterization of the mixture of nuclear grade cation and anion exchange resins. J. Radioanal. Nucl. Chem. 2015, 304, 917–923. [Google Scholar] [CrossRef]
  72. Traboulsi, A.; Dupuy, N.; Rebufa, C.; Sergent, M.; Labed, V. Investigation of gamma radiation effect on the anion exchange resin Amberlite IRA-400 in hydroxide form by Fourier transformed infrared and 13C nuclear magnetic resonance spectroscopies. Anal. Chim. Acta 2012, 717, 110–121. [Google Scholar] [CrossRef]
Figure 1. Nickel sources in the environment with division onto natural and anthropogenic origin.
Processes 09 00285 g001
Figure 2. Nickel properties, global uses, and consumer markets.
Processes 09 00285 g002
Figure 3. The maximum contaminant level (MCL) of heavy metals that is allowed in drinking water established by the United States Environmental Protection Agency (USEPA) and the effect of nickel on the human body.
Processes 09 00285 g003
Figure 4. Comparison of nickel containing wastewaters treatment methods.
Processes 09 00285 g004
Figure 5. Effect of phase contact time on Ni(II) adsorption on (a) A830; (b) SR7; (c) A400TL from the chloride 0.1–6.0 M HCl–100 mg Ni(II)/L and (df) 0.1–0.9 M HCl/0.9–0.1 M HNO3–100 mg Ni(II)/L.
Processes 09 00285 g005aProcesses 09 00285 g005b
Figure 6. Influence of phase contact time on the Ni(II) uptake (C0 = 100 mg/L) by TP220 with non-linear (NL) fitting of (a) PFO, (b) PSO and linear fitting of (c) IPD kinetic models to the experimental data.
Processes 09 00285 g006
Figure 7. Equilibrium sorption isotherms of Ni(II) on (a) TP220, (b) A830, (c) SR7, and (d) AF5 adsorbents, and the fitting of experimental points to the Freundlich, Langmuir, Temkin and Dubinin–Radushkevich isotherm models using the non-linear regression.
Processes 09 00285 g007aProcesses 09 00285 g007b
Figure 8. Mechanism of Ni(II) adsorption on the applied sorbents.
Processes 09 00285 g008
Figure 9. Distribution of nickel species in the HCl solution (a) with NiCl2 of 1.0 molality, (b) with Ni2+ of 1.7 mM concentration depending on the total concentration of Cl ions.
Processes 09 00285 g009
Figure 10. FTIR spectra for TP220 before and after the adsorption of Ni(II).
Processes 09 00285 g010
Figure 11. Comparison of %sorption (%S) and %desorption (%D) for Ni(II) on/from TP220 (a) in the first cycle and (b) in three cycles of sorption–desorption for the best eluting agents.
Processes 09 00285 g011aProcesses 09 00285 g011b
Table 1. Nickel contents in the environment as a result of its natural and anthropogenic emission.
Ni OccurrenceConcentration of Ni References
waterBaltic water0.09–1.08 μg/L[2]
river water 0.7 μg/L
bottled mineral waters0.71–3.20 μg/L
drinking water from Stalowa Wola
(an area affected by industrial emissions)
17 μg/L
uncontaminated water300 ng/L[3]
airambient air6–20 ng/L
air (anthropogenic sources)150 ng/L
soilfarm soils3–1000 mg/L[2]
soil0.2–450 mg/kg
soil near metal refineries
dried sludge
24,000–53,000 mg/kg
average content of nickel in Poland6.5 mg/kg
average content of nickel in the world 13–37 mg/kg
soil affected by industrial emissions from Stalowa Wola 17.20 mg/kg
soil affected by the Bolesław Mining
and Metallurgical Plant
19.62 mg/kg[6]
fertilizerfertilizer based on dolomite7.6–396.0 mg/kg
11 types of fertilizer 10.4–295.1 mg/kg[7,8]
Where: 1 Chloride potassium salt (0.4 mg/kg), Salmag (0.6 mg/kg), Calcium sulfate tetraurea (1.5 mg/kg), Phosphogypsum (4.3 mg/kg), Triple superphosphate (6.5 mg/kg), Granulate (26 mg/kg), Polifoska B (33 mg/kg), Polifoska 8 (35.1 mg/kg), Polifoska 6 (38 mg/kg), Polimag 405 (295.1 mg/kg).
Table 2. Characteristics of the adsorbents applied for screening test for Ni(II) removal [46,47].
NameTypeMatrixStructureFunctional GroupsMean Bead Size (mm)Total Capacity (val/L)Water Retention (%)
S984Chelating ion exchangerCross-linked polyacrylicMacroporousPolyamine2.744–55
TP220Chelating/Weakly basic anion exchangerCross-linked polystyreneMacroporousBis-picolylamine,
bis(2-pyridyl-methyl)amine
0.62
(±0.05)
2.248–60
A830Weakly basic anion exchangerCross-linked polyacrylicMacroporousComplex amine0.3–1.22.7547–53
SR7Strongly basic anion exchangerCross-linked polystyreneMacroporousQuaternary
ammonium,
type 3
0.57–0.670.659–64
A400
TL
Strongly basic anion exchangerCross-linked polyacrylicMicroporousQuaternary ammonium,
type 1
0.425–0.851.348–54
PSR2Strongly basic anion exchangerCross-linked polystyreneMicroporousQuaternary
ammonium, type, tri-n-butyl amine
0.3–1.20.6540–48
PSR3Strongly basic anion exchangerCross-linked polystyreneMacroporousQuaternary
ammonium, type, tri-n-butyl amine
0.3–1.20.650–65
AF5Adsorbent without functional groupCarbonaceousMicroporous0.4–0.848–60
Table 3. Adsorption capacities obtained during the Ni(II) adsorption, qe (mg/g) for 240 min of phase contact time from the chloride solutions (where: * references this paper).
AdsorbentHCl (M)Ref.HCl (M)/HNO3 (M)Ref.
0.1 1.03.0 6.0 0.1/0.90.2/0.80.5/0.50.8/0.20.9/0.1
S9844.954.835.524.74[42]5.434.934.755.276.41[42]
TP2206.244.934.684.89[43]4.884.934.915.004.95[43]
A8304.604.854.535.02*4.594.494.364.404.53*
SR74.564.744.874.82*4.554.444.254.344.32*
A400TL4.724.794.914.76*4.174.404.303.924.02*
PSR23.703.294.364.14[44]4.784.754.764.694.78*
PSR34.734.824.533.92[44]4.694.784.574.604.64*
AF54.894.764.734.72[45]4.834.904.845.004.88[45]
Table 4. Kinetic parameters for the Ni(II) adsorption from the 0.1 M HCl chloride solutions by TP220.
ParametersPseudo-First OrderPseudo-Second OrderIntraparticle
Diffusion Model
qe exp = 6.24 mg/g
qe cal (mg/g)5.205.315.52
k1 (1/min)2.75--
k2 (g/mg min)-1.22
ki (mg/g min0.5)--0.05
MPSD0.07480.0631-
R20.91310.92800.6869
R2adj0.88830.90740.5974
Table 5. Parameters of Frendlich, Langmuir, Temkin, and Dubinin–Radushkevich isotherm models calculated for the adsorption systems.
Model ParametersAdsorbents
S984TP220A830SR7A400TLPSR2PSR3AF5
Freundlich k F 0.04792.3170.0700.00960.02600.03630.03760.0169
1/n1.0810.6291.0311.2991.1651.1181.1081.224
MPSD0.2720.0790.0970.9050.2480.3680.2120.582
R20.9820.9860.9870.9270.9690.8810.9620.929
R a d j 2 0.9770.9830.9840.9090.9610.8520.9520.911
LangmuirkL2.07 × 10−60.00112.27 × 10−61.30 × 10−61.72 × 10−61.30 × 10−61.91 × 10−61.30 × 10⁻⁶
Q038,371.1408.9838,322.838,322.840,472.938,682.438,604.438,322.7
MPSD0.4741.0020.1233.1190.9440.7370.5382.153
R20.9860.9010.9890.9650.9780.8920.9700.947
R a d j 2 0.9830.8770.9860.9560.9720.8650.9620.934
TemkinbT48.0549.7441.7839.7248.2946.1945.5643.75
A0.00610.02560.00520.00480.00550.00540.00530.0052
MPSD1.9212.0891.7971.6721.9421.8941.8371.756
R20.9000.8580.9060.9260.8820.8500.9080.877
R a d j 2 0.8750.8230.8830.9070.8520.8130.8840.846
Dubinin–Radushkevichqm183.86208.12121.59107.890.41141.33165.63144.56
kDR0.00480.00860.02820.02630.02160.03740.04580.038
E3.2377.6054.1784.3594.8113.6553.3043.624
MPSD4.3914.8894.2664.6024.7084.5334.2974.389
R20.7730.7060.6800.6890.6060.6980.7670.711
R a d j 2 0.7170.6320.6000.6120.5080.6230.7090.639
Where: kF (mg1−1/n L1/n/g), kL (L/mg), Q0 (mg/g), bT (J g/mol mg), A (L/mg), qm (mg/g), kDR (mol2 J2), and E (J/mol).
Table 6. Equilibrium parameters of Ni(II) sorption on various adsorbents based on the literature review.
SorbentIsotherm ModelEquilibrium ParametersRef.
Activated carbons from the doum seedFreundlichkF = 0.36–0.98 L/g,
T = room temperature, pH = 7,
a.d. = 5 g/L
[36]
Expanded graphite decorated with manganese oxide nanoparticlesLangmuirqe = 0.0065 mg/g,
T = 25 °C, a.d. = 0.5 g/L,
[37]
Lewatit TP207 (chelating iminodiacetic acid groups in PS-DVB matrix)-qe = 1.23 mg/g,
T = 25 °C, a.d. = 0.27 g/L, pH = 6
[38]
Biochars produced from the wheat straw pellets (WSP550, WSP700) and rice husk (RH550, RH700)
at 550 and 700 °C
FreundlichWSP700: qe = 25.1 mg/g
WSP550: qe = 12.6 mg/g
RH700: qe = 10.15 mg/g
RH550: qe = 6.87 mg/g
T = 20 °C, a.d. = 0.1 g/20 mL, pH = 5
[39]
Amberlite IRA 458 (quaternary ammonium groups in the PA-DVB matrix)
Amberlite IRA 958 (quaternary ammonium groups in the PA-DVB matrix)
Amberlite IRA 67 (tertiary amine groups in the PA-DVB matrix)
Langmuirqe = 16.72 mg/g
qe = 13.22 mg/g
qe = 10.03 mg/g
T = room temperature,
a.d. = 0.5 g/50 mL, pH = 4–8
[40]
Modified carboxymethyl cellulose hydrogelFreundlichkF = 4.614 L/g,
T = 30 °C, a.d. = 100 mg/L, pH = 5
[41]
Where: T—temperature; a.d.—the adsorbent dose; PS-DVD—polystyrene-divinylbenzene; PA-DVB—poly-acrylate-divinylbenzene.
Publisher’s Note: MDPI stays neutral with regard to jurisdictional claims in published maps and institutional affiliations.