Article

Characterization of Novel Solid Dispersions of Moringa oleifera Leaf Powder Using Thermo-Analytical Techniques

by
Nontsikelelo Noxolo Tafu
and
Victoria A. Jideani
*
Department of Food Science and Technology, Bellville Campus, Cape Peninsula University of Technology, P.O. Box 1906, Bellville 7535, South Africa
*
Author to whom correspondence should be addressed.
Processes 2021, 9(12), 2230; https://doi.org/10.3390/pr9122230
Submission received: 1 November 2021 / Revised: 26 November 2021 / Accepted: 2 December 2021 / Published: 10 December 2021
(This article belongs to the Special Issue Properties and Processing Process of Flour Products)

Abstract

:
Moringa oleifera leaf powder (MOLP) has been identified as the most important functional ingredient owing to its rich nutritional profile and healthy effects. The solubility and functional properties of this ingredient can be enhanced through solid dispersion technology. This study aimed to investigate the effects of polyethylene glycols (PEGs) 4000 and 6000 as hydrophilic carriers and solid dispersion techniques (freeze-drying, melting, solvent evaporation, and microwave irradiation) on the crystallinity and thermal stability of solid-dispersed Moringa oleifera leaf powders (SDMOLPs). SDMOLPs were dully characterized using powder X-ray diffraction (PXRD), differential scanning calorimetry (DSC), thermo-gravimetric analysis (TGA), and Fourier transform infrared spectroscopy (FTIR). The PXRD results revealed that the solid dispersions were partially amorphous with strong diffraction peaks at 2θ values of 19° and 23°. The calorimetric and thermogravimetric curves showed that PEGs conferred greater stability on the dispersions. The FTIR studyrevealed the existence of strong intermolecular hydrogen bond interactions between MOLP and PEG functional groups. MOLP solid dispersions may be useful in functional foods and beverages and nutraceutical formulations.

1. Introduction

Solid dispersion is a solubility enhancement technology in which poorly water-soluble ingredients are mixed in an inert matrix with a hydrophilic carrier resulting in solid dispersions with improved solubility, dissolution, bioavailability, and stability [1]. Moreover, off-flavors from food ingredients like pea protein isolate have been reported to be mitigated with this technique [2]. The mechanism for increasing the solubility and dissolution rate of the ingredient is the included reduction of particle size to molecular size ratio. Furthermore, the ingredient is converted from crystalline to amorphous form, a high energy state that is extremely soluble. However, the physical state of the solid dispersion depends on the physicochemical properties of the carrier and ingredient, the ingredient-carrier interactions, and the preparation methods. Hydrophilic polymers, including polyvinylpyrrolidone (PVP), hydroxypropylmethylcellulose (HPMC), and hydroxypropyl cellulose (HPC), polyethylene glycols, as well as sugar alcohols like mannitol and xylitol, are commonly used as solid dispersion carriers [3,4]. Polyethylene glycols (PEGs) with molecular weights of 1500−20,000 are widely used to manufacture solid dispersions. The specific benefit of PEGs in the preparation of solid dispersions is that PEGs are miscible/soluble in numerous used organic solvents. The melting points of PEGs are under 65 °C (e.g., the melting ranges of PEG4000 and PEG6000 are 50−60 °C, and 55−63 °C, respectively) [3]. Lower melting points of PEGs are helpful in the manufacturing of solid dispersions by different methods. Furthermore, they are also able to improve the wettability of poorly soluble compounds. PEG4000 and PEG6000 are partially crystalline. Zhu et al. [1] reported that, for dispersions prepared with a semi-crystalline polymeric carrier, the ingredient could be amorphous, crystalline, or semi-crystalline, and the phase behavior can be very complex. Thus, the identification of the physical state of the ingredient in solid dispersion is essential. It is equally important to understand the crystallization behavior of both the carrier and the ingredient since it will affect the microstructure of the solid dispersion, and subsequently influence the dissolution behaviour and solubility. Several researchers have investigated the effects of solid dispersion on properties of food ingredient powders, such as beta-carotene [5], pea protein isolate [2], Rebaudioside D (a natural sweetener from plant Stevia), Kaempferia parviflora extract [6]. However, there is no documented study of solid dispersion technology on MOLP. Huang et al. [7] studied the influence of superfine grinding on the structural and thermal properties of MOLP. The findings indicated that superfine grinding and particle size influenced the physicochemical, thermal, and structural properties of MOLP. Some previous studies have investigated the effect of PEG molecular weights on the dissolution rate and physicochemical characteristics of the solid-dispersed ingredients [8]. Key factors that affect the properties of solid dispersions include glass transition temperature (Tg), molecular mobility, miscibility, and crystallinity [9,10]. These factors must be evaluated to ensure a stable solid dispersion. Only a few characterization methods have been reported on the evaluation of solid dispersions. These include; powder X-ray diffraction (PXRD), differential scanning calorimetry (DSC), thermo-gravimetric analysis (TGA), and Fourier transform infrared spectroscopy (FTIR) and scanning electron microscopy (SEM), among others [11,12,13,14,15,16]. FTIR is used to detect the vibration in the energy distribution of interaction between ingredients and carriers, and it is also applied to follow changes in bonding between functional groups [17,18,19]. Thermo-analytical techniques (DSC and TGA) are employed for the characterization of thermal stability and thermal properties [20]. Furthermore, DSC and X-ray diffraction are other advanced analytical techniques that are used to determine the amorphization or crystallization of ingredients in polymers based on changes in thermal behaviour and crystallinity of ingredients [21]. Although a recent study was reported on the thermal and crystallinity characterization of MOLP [7], this is the first study reporting the solid dispersion of MOLP and the effect of polyethylene glycols (PEG4000 and PEG6000) on crystallinity, thermal, and interaction properties of the MOLP-PEG dispersions.

2. Materials and Methods

2.1. Source of Materials

Moringa oleifera leaf powder (MOLP) was procured from Supa Nutri PTY Ltd. in Cape Town, South Africa. Polyethylene glycols (PEGs) were purchased from Spellbound laboratory solutions cc in Cape Town, South Africa. Chemical reagents were of analytical grade.

2.2. Preparation of Solid Dispersions

Five different methods were employed to form solid dispersions of MOLP using PEG carriers (PEG4000 and PEG6000). These methods include solvent evaporation, freeze-drying, melting, and microwave irradiation.

2.2.1. Preparation of Solid Dispersion by the Solvent Evaporation Method

The solvent evaporation method of solid dispersion adapted from [19,22] with slight modifications, was used. Equal amounts (50 g) 1:1 ratio of MOLP and PEGs were accurately weighed. The MOLP and carrier were dissolved in an adequate (60 mL) amount of absolute methanol with constant magnetic stirring at 200 rpm for 20 min. The solvent was then rapidly evaporated with the aid of mild heat up to about 50 °C in the air oven for 24 h until complete evaporation and then kept at room temperature for 48–72 h in a desiccator until a dry cake was obtained. Obtained solid dispersion was ground and sieved through a 125 µm sieve. Samples were stored in a desiccator until further use.

2.2.2. Preparation of Solid Dispersion by Freeze-Drying Method

The freeze-drying method adapted from Fitriani et al. [22] with some modifications, was used. Equal amounts (50 g) of MOLP were accurately weighed. MOLP was dissolved in 5 mL of 96% ethanol, whereas PEG was dissolved in 70 mL of distilled water. The solution was mixed on a magnetic stirrer and then homogenised by gradually introducing the beaker containing MOLP to the beaker containing the PEG under stirring at 500 rpm on a magnetic stirrer for 30 min. Once homogeneous, the mixture was frozen at a temperature of −70 °C in the ultra freezer The frozen form was then dried using a freeze-dryer (Bench Top Pro 3L ES-55, South Africa) for two days at −50 °C. Obtained solid dispersions were triturated and passed through a 150–125 µm sieve, stored in centrifuge tubes, and placed in a desiccator until further evaluation.

2.2.3. Preparation of Solid Dispersion by Melting Method

The melting method described by Mogal et al. [23] with slight modifications, was used. Amounts 50 g (1:1) of MOLP and PEG were accurately weighed separately into 400 mL glass beakers. The carrier was initially melted using a magnetic stirrer at 58 °C for 10 min and the MOLP was added to the molten base to obtain a molecular dispersion. The molten mixture was thoroughly mixed and stirred for 30 min. The melted mass was rapidly cooled and solidified in an ice bath under constant stirring. On solidification, the solid mass was pulverized and sifted through a 150–125 µm sieve. The obtained product was stored in centrifuge tubes and kept in a desiccator until use.

2.2.4. Preparation of Solid Dispersion by Microwave Method

The microwave irradiation method adapted from [3,14] with some modifications was used. Equal amounts (50 g) 1:1 of MOLP and PEG were mixed in a 400 mL glass beaker and subjected to microwave for 2 min at 360 W in a domestic microwave (LG model). The obtained solid dispersions were cooled and ground using a mortar and pestle, and then passed through a 150–125 µm sieve. All samples were stored in centrifuge tubes at room temperature (20 °C) until further use.

2.3. Characterization of the MOLP and Solid-Dispersed MOLPs

2.3.1. Powder X-ray Diffraction (PXRD) Analysis

Solid-state properties such as the amorphous and crystalline nature of the MOLP, PEG, and SDMOLP formulations were assessed by PXRD diffraction utilizing an X-ray diffractometer, equipped with a CuKa radiation source (1.5406 Å) with the generator current and voltage of 10 mA and 30 kV, respectively. The samples mounted on plate holders were measured for diffraction patterns ambient conditions by scanning in the (2θ) range of 5–50° using a 0.02° (2θ) step size and a time constant of 2 s per step [22,24].

2.3.2. Deferential Scanning Calorimetry

The changes in the physical properties of MOLP and solid dispersion complexes as a function of temperature and time were determined using Differential Scanning Calorimetry (DSC) (Perkin Elmer, DSC 6000, London, United Kingdom) under nitrogen flow with a rate of 20 mL/min. The adsorption of heat by the complexes at a temperature range of 25–425 °C at a rate of 10 °C/min was assessed. The samples (3–4 mg) were accurately weighed into DSC aluminium pans and sealed. The sample was positioned directly above a constantan disc, and the sample was measured by a chromel-alumel thermocouple. An empty pan was used as a reference. The temperature difference across the sample and the reference chromel wafers gave a measurement of heat flow. Pure Indium standard was used for calibration, and the experiments were conducted in duplicate. The thermal behavior of pure MOLP and SDMOLP complexes was observed as peaks. The glass transition temperature (Tg), onset, peak, and end of each peak temperature, as well as the enthalpy (ΔHm) of samples, were obtained accordingly using Pyris software.

2.3.3. Thermo-Gravimetric Analysis

Thermogravimetric analysis (TGA) was performed using the Thermogravimetric Analyser (Perkin Elmer, TGA 4000, London, UK) apparatus outfitted with an autosampler to analyse the decomposition stages and thermal stability of MOLP and solid dispersion samples. The samples were accurately weighed (3.0 mg) into the aluminium pans of the TGA analyser and empty pans were used as references. The experiments were conducted in the heating range of 25–600 °C with an accelerated heating rate of 10 °C/min under a nitrogen atmosphere at a flow rate of 20 mL/min. The TGA results were graphically represented and evaluated according to the weight loss as the function of temperature.

2.3.4. Fourier Transform Infrared (FTIR) Spectroscopy Analysis

Fourier transform infrared spectroscopy analysis, or compatibility study was carried out using the FTIR Spectrometer (Perkin Elmer ATR-FTIR, Spectrum Two Spectrophotometer). The MOLP and solid-dispersed MOLPs samples were sampled using an attenuated total reflectance (ATR) sampling technique then analyzed in the beam of the FTIR spectrophotometer. The spectra were analyzed in the resolution interval of 400–4000 cm−1.

2.4. Data Analysis

Multivariate analysis of variance (MANOVA) was employed to determine the significant differences (p < 0.05) in attributes among samples. Duncan’s multiple range test was used to separate means where a significant difference existed (IBM SPSS version 26, 2020).

3. Results and Discussion

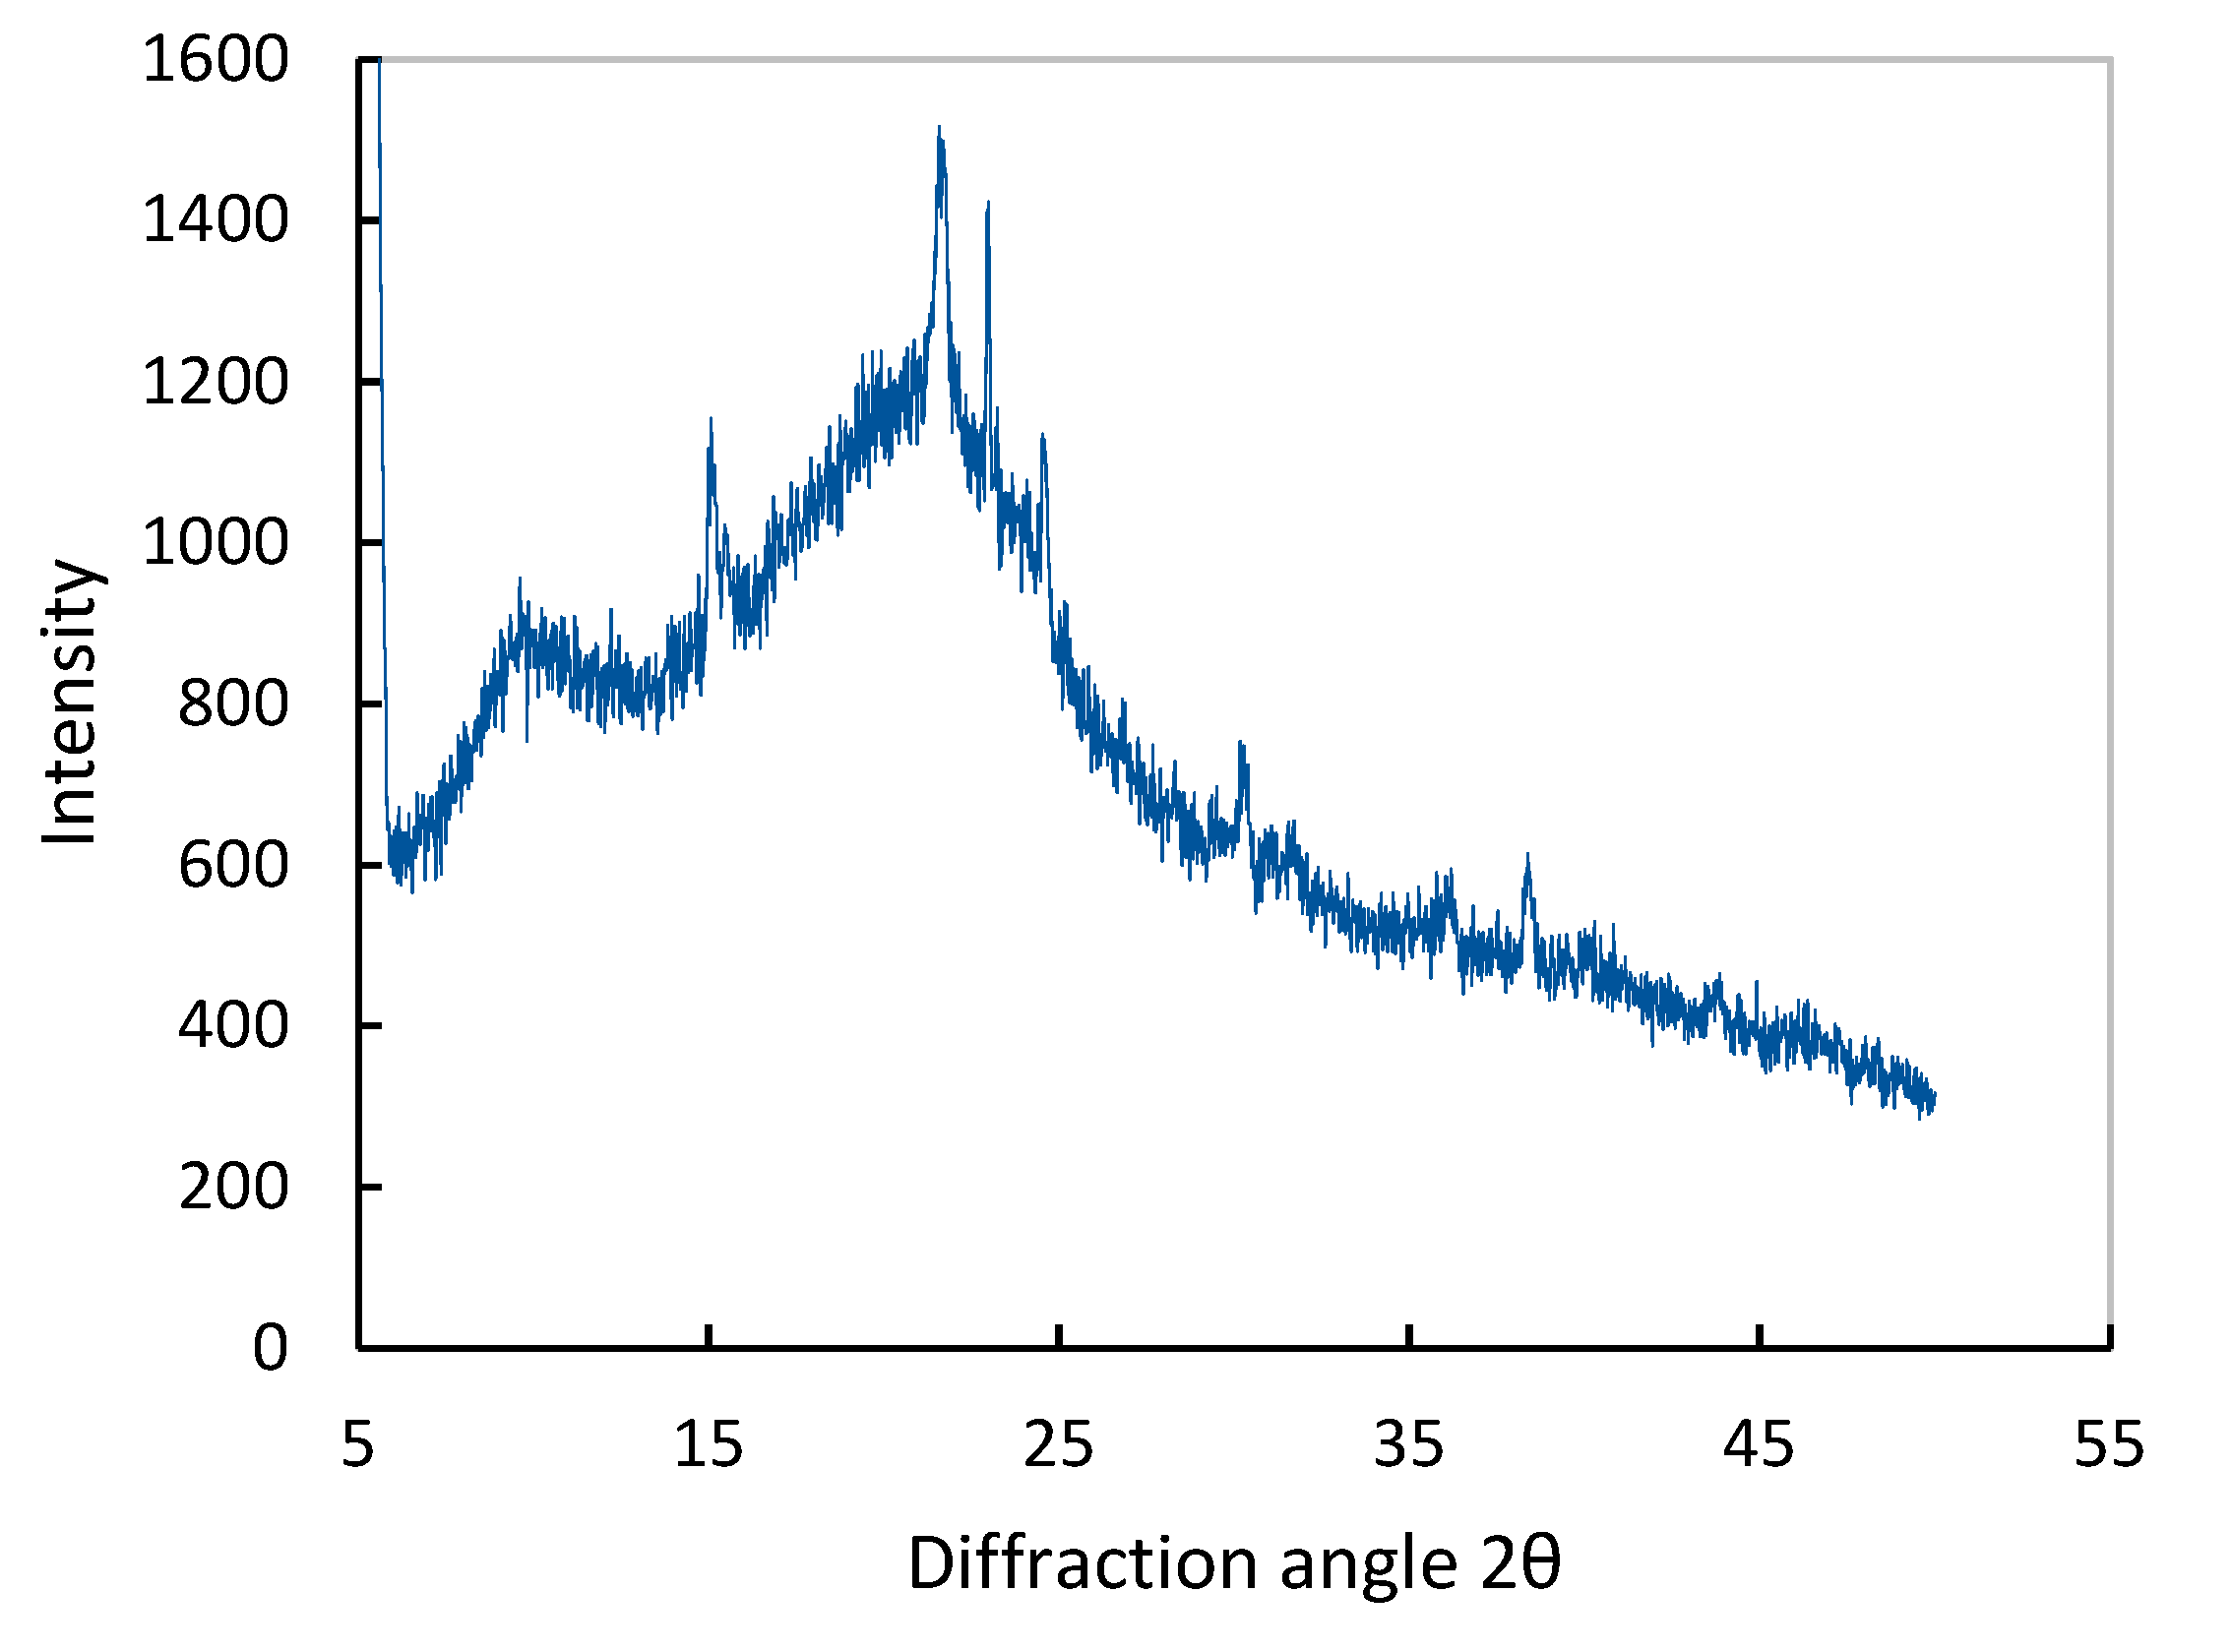
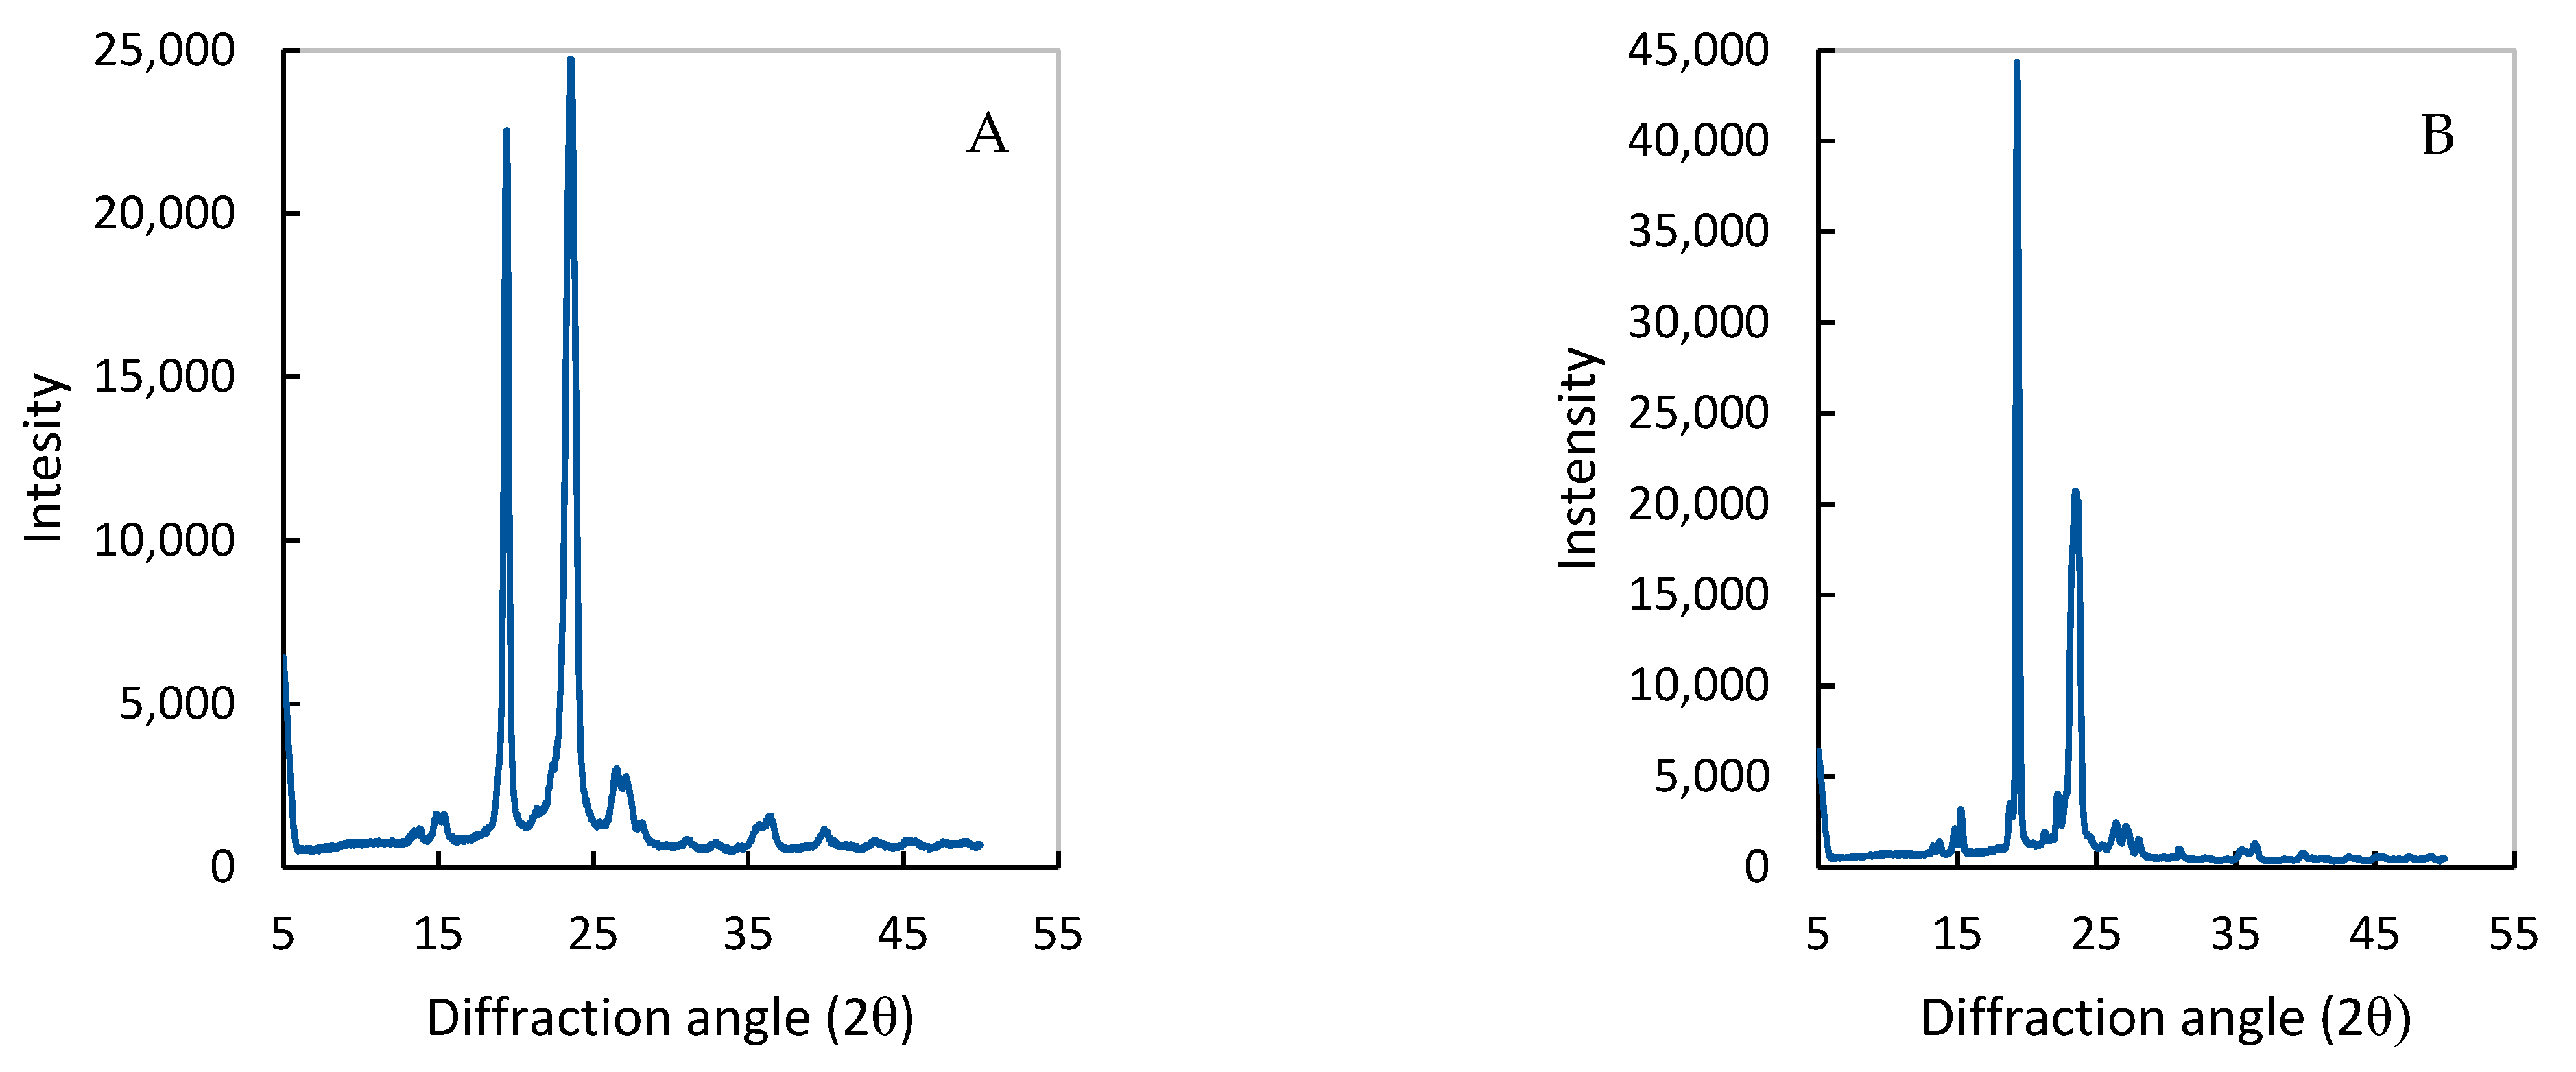
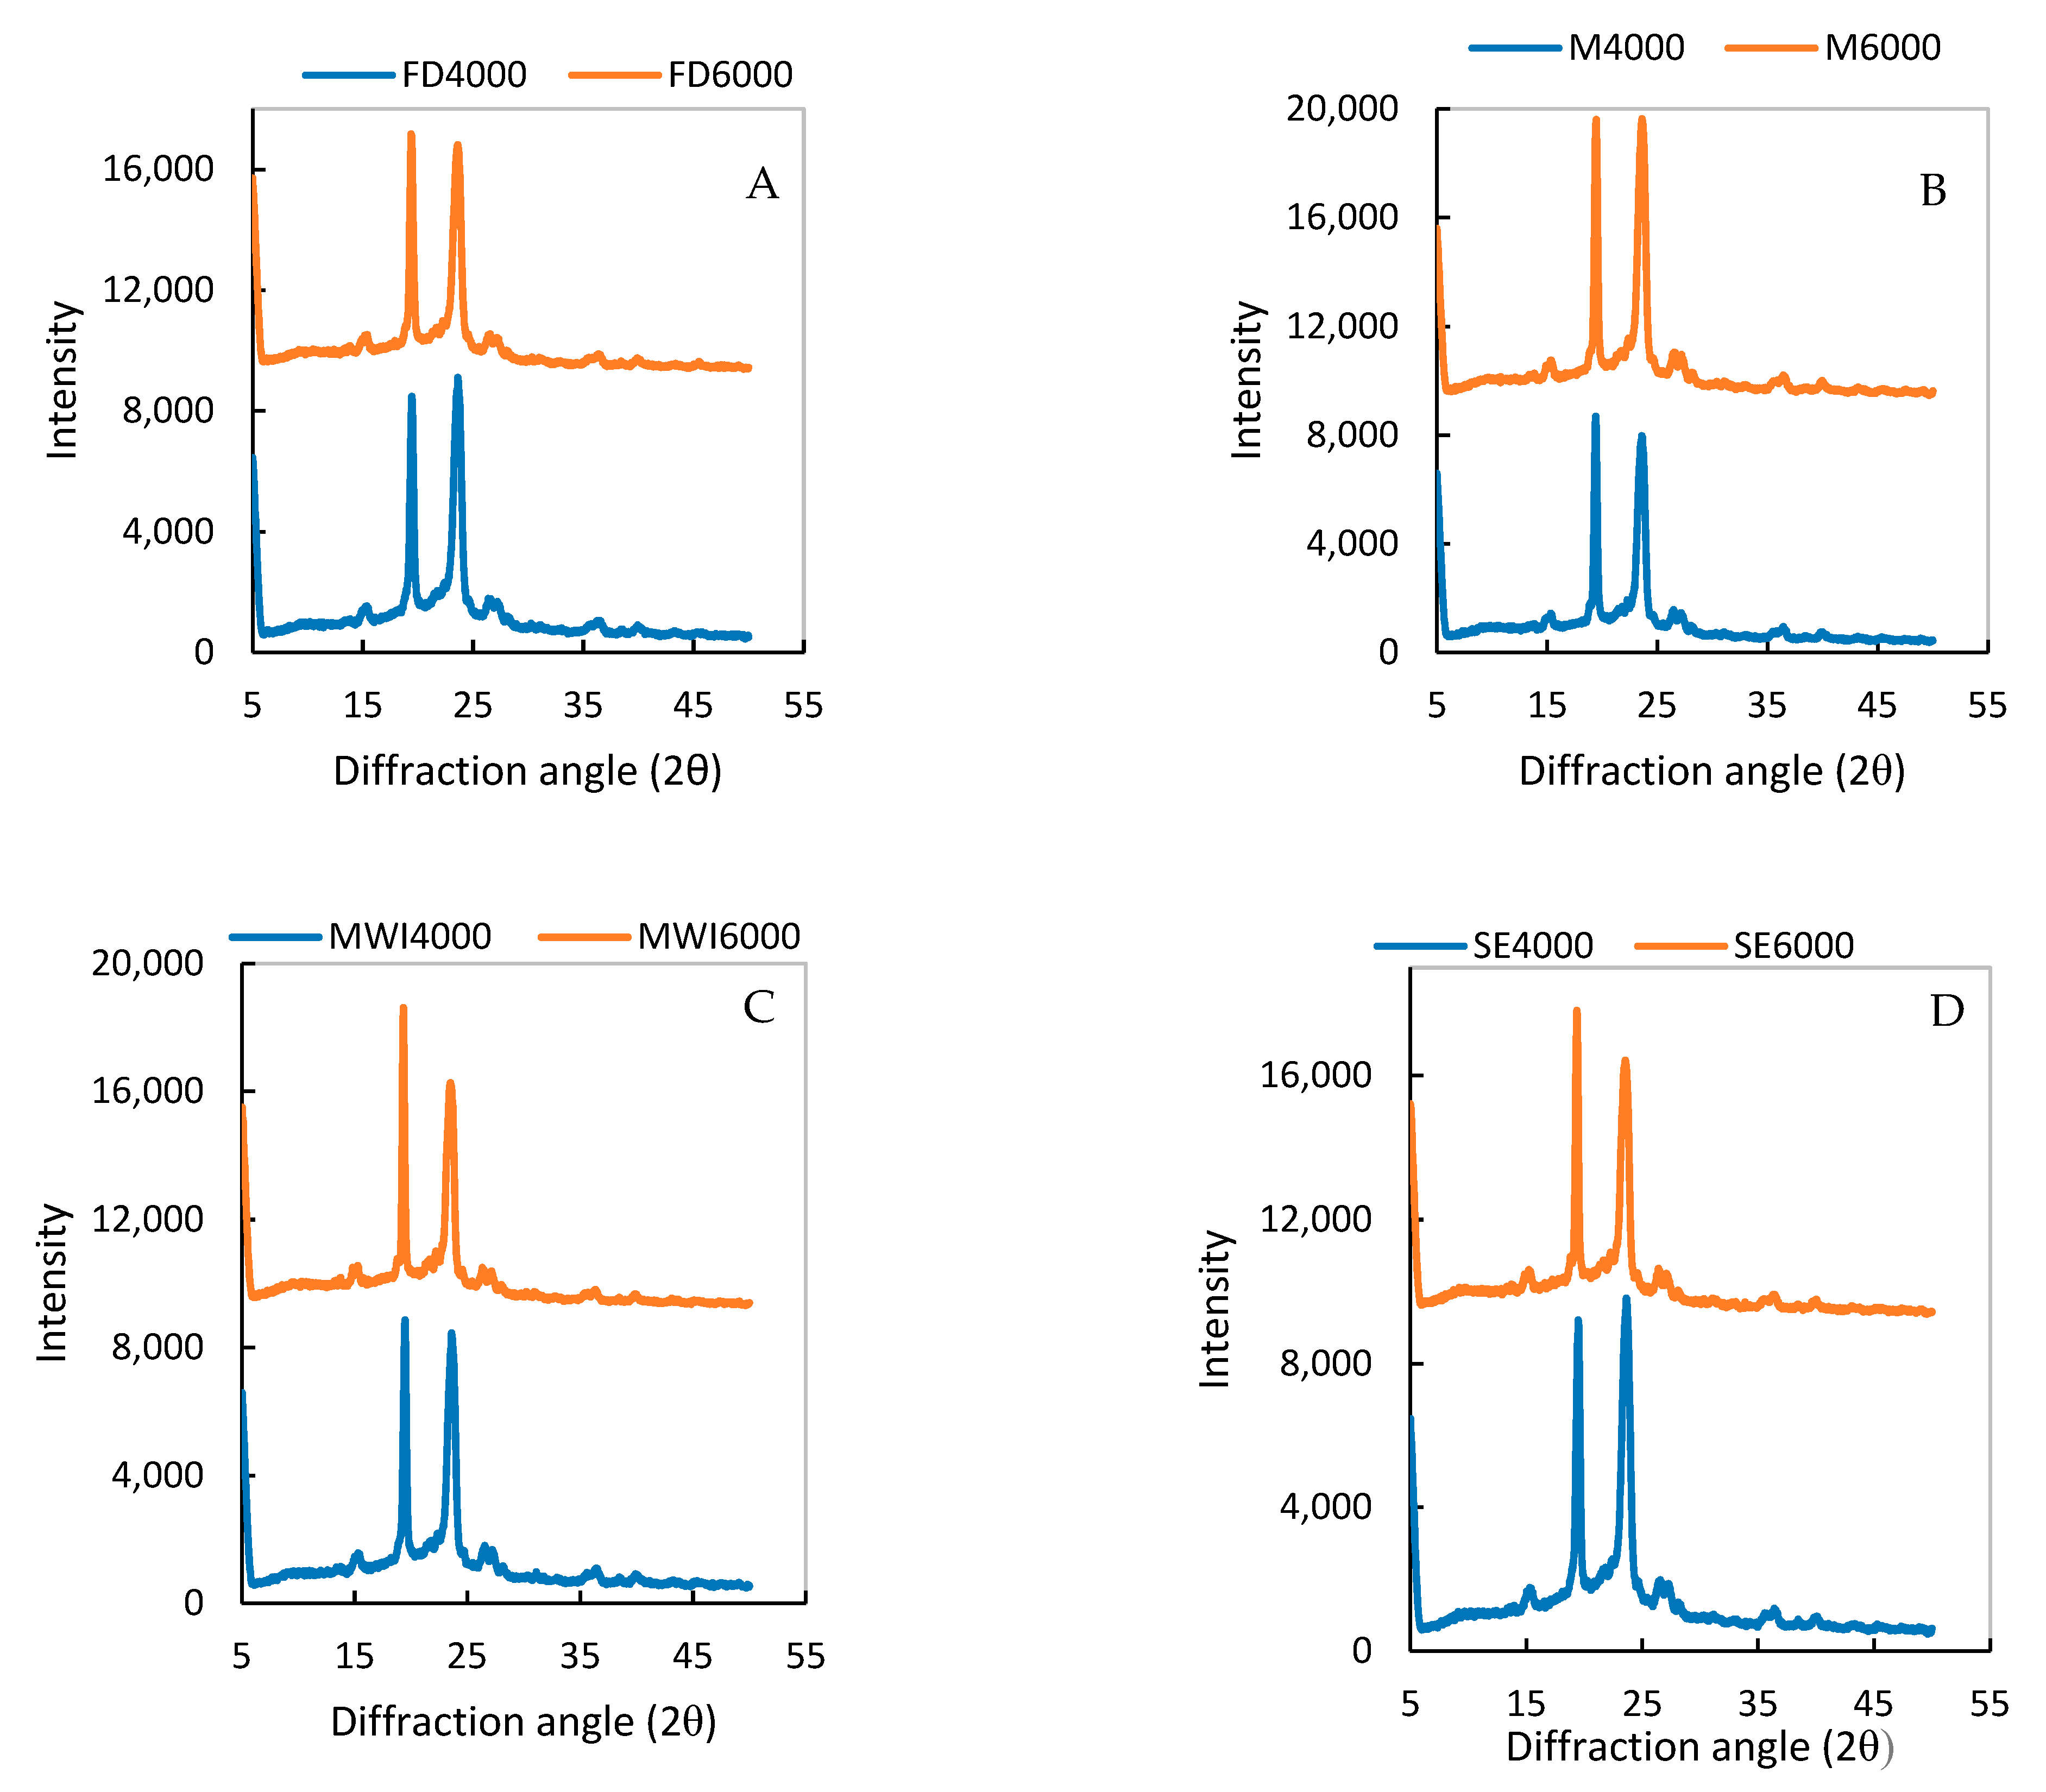
3.1. Crystallinity of MOLP and MOLPs Determined by Powder X-ray Diffraction

X-ray diffraction was used to identify the degree of crystallinity achieved in pure MOLP and SDMOLPs. The X-ray diffraction patterns of pure MOLP, PEGs (PEG4000 and PEG6000), and SDMOLP samples are presented in Figure 1, Figure 2 and Figure 3, respectively. The X-ray diffraction spectrum of MOLP exhibited four low intensity, distinguishable diffraction peaks at 2 Theta (2θ) values of 15.22°, 21.81°, 22.92° and 22.94°, reflecting both its amorphous and crystalline domains. Similar results were observed by Huang et al. [7]. In general, crystalline materials show a series of sharp peaks, while amorphous products produce a broad background pattern [24]. The diffraction patterns of MOLP were exceedingly small, implying that the crystallite size (part of crystalline cellulose and hemicellulose) is small. Furthermore, due to high protein present in the composition of the MOLP (28–35%) [25,26], the X-ray diffraction patterns could be attributed to the predominance of the amorphous nature of native proteins, thus, corresponding to the α-helix and β-sheet structures in proteins [27] surrounding the other components that have a more amorphous nature. Furthermore, the high background base and wider pattern found in the MOLP diffractogram may be related to its amorphous character, which might be attributable to its lipids because it contains polyunsaturated fatty acids (PUFAS). MOLP is a heterogeneous and complex matrix with several bioorganic substances, including proteins, carbohydrates, ash, and minerals. Therefore, a few unassigned diffraction peaks observed could be due to these bioorganic compounds in the leaf. This finding concurs with the reports made by Huang et al. [7] (small diffraction peak intensity at 2θ of 19.6° and 22.4°) for MOLP. Fernandes & Sellappan [28] also obtained a similar pattern for Strobilanthes species leaves. Fernandes et al. [29] found a similar conformation with S. Brasillensis dried extract. Furthermore, Araújo et al. [30] reported comparable results for Moringa oleifera seed powder.
The PXRD spectra of PEG4000 and PEG6000 are shown in Figure 2. Although the XRD of PEGs showed similarities in diffraction patterns, a slight difference in the value of 2θ diffraction angles was observed. PEG4000 exhibited two distinct and robust diffraction peaks at 2θ values of 19.35°, 23.57°, and some small peaks at 2θ = 15.47, 26.97, 27.72, 36.99 and 40.84°. The strong peaks suggest that the carrier is semi-crystalline or partially amorphous in structure. These results are in agreement with previous studies for PEG4000 (19.35° and 23.5°) reported by Vasa et al. [31] and Obaidat et al. [32]. PEG6000 diffractogram exhibited two major, highly intense and defined diffraction peaks at 2θ values of 19.29°, 23.65° and a few minor peaks at 2θ = 15.37°, 22.32°, 26.16°, 27.38°, 28.85° and 36.59°, which are consistent with the data in previous reports (19.12° and 23.23°) [33], suggesting that PEG6000 is also semi-crystalline or partially amorphous. The two characteristic diffraction peaks observed in the diffractograms of PEGs could be ascribed to the PEG lattice plane of (1 2 0) and (1 3 2), respectively [34]. Moreover, both PEG4000 and PEG6000 PXRD patterns were in good agreement with the reported literature of the international center of Diffraction Data Card (JCPDS-19-0629). This study confirmed that PEG4000 and PEG6000 are semi-crystalline and may be beneficial as solid dispersion carriers due to their ability to create amorphous dispersions with increased solubility.

PXRD Patterns of Solid Dispersions

Powder X-ray diffractograms of SDMOLP samples (Figure 3) exhibited strong and highly intense characteristic diffraction peaks at 2θ values of 19.35–19.49° and 23.55–23.72°, and a few tiny, halo characteristic peaks at 2θ value of 15.29, 26.69, 36.69, 40.23 and 45.77° were observed. The presence of distinct peaks indicated that SDMOLP samples were present as semi-crystalline to amorphous material. Solid dispersions showed diffraction patterns that corresponded to the carriers (PEG4000 and PEG6000) while peaks of pure MOLP were absent. The disappearance of the characteristic peaks of MOLP (from crystalline cellulose) suggested that MOLP was completely dispersed in PEG carriers. This proves the conversion of the crystalline form of MOLP into an amorphous form in solid dispersion. Moreover, a decrease in peak intensity and the presence of the slightly high base of the solid dispersion diffractograms noticed compared to pure PEGs corresponds to amorphization, thus, suggesting the presence of intermolecular interactions between MOLP-PEG via hydrogen bonding and van der Waal interactions. Weak physical bonds formed by non-covalent interactions such as hydrogen bonds, ionic bonds, van der Waals, dipole-dipole interactions, and acid-base interactions are common interactions that occur between components in solid dispersions Krstić et al. [35]; Tran & Tran [36]. The formation of these bonds between an ingredient and a carrier component may prevent self-association between ingredient molecules, thus, leading to changes in the crystallization kinetics. Therefore, these results indicate that a phase transition of MOLP from the crystalline form (crystalline diffractions) to the amorphous or semi-crystalline form occurred during the preparation of the solid dispersion. This proves the success of the solid dispersions. Similar findings were reported by Zawar & Bari [3] for their solid dispersion. Patel et al. [37] reported similar results, where the solid dispersions diffraction patterns (semi-crystalline) showed more resemblance to PEG. Alshehri et al. [4] also obtained similar results for Luteolin and PEG4000 solid dispersions prepared by microwave irradiation, melting, and solvent evaporation methods. Moreover, the XRD results are similar to the curcumin-PEG solid dispersion reported by Muthu et al. [38].

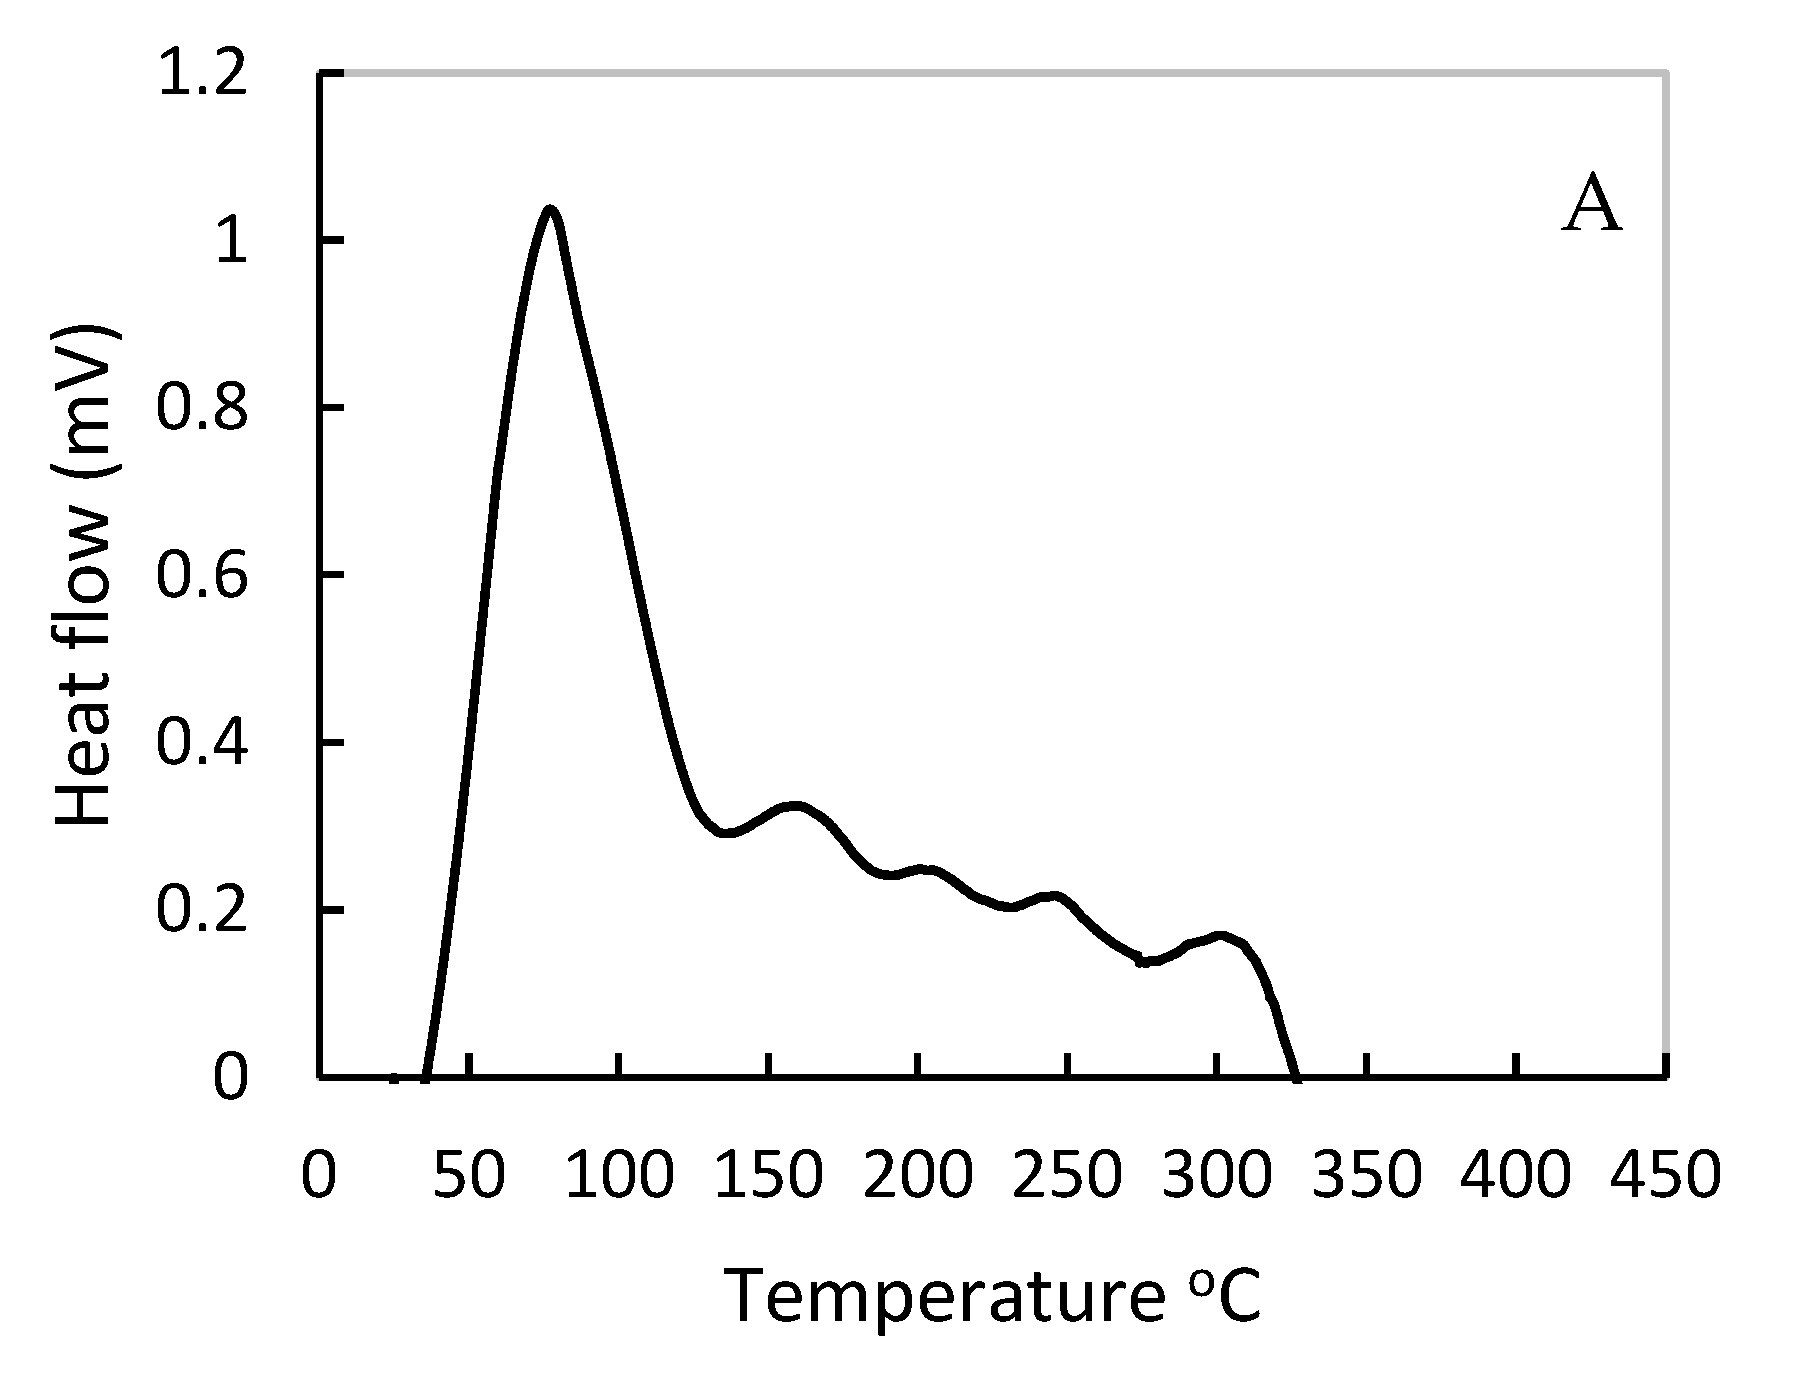
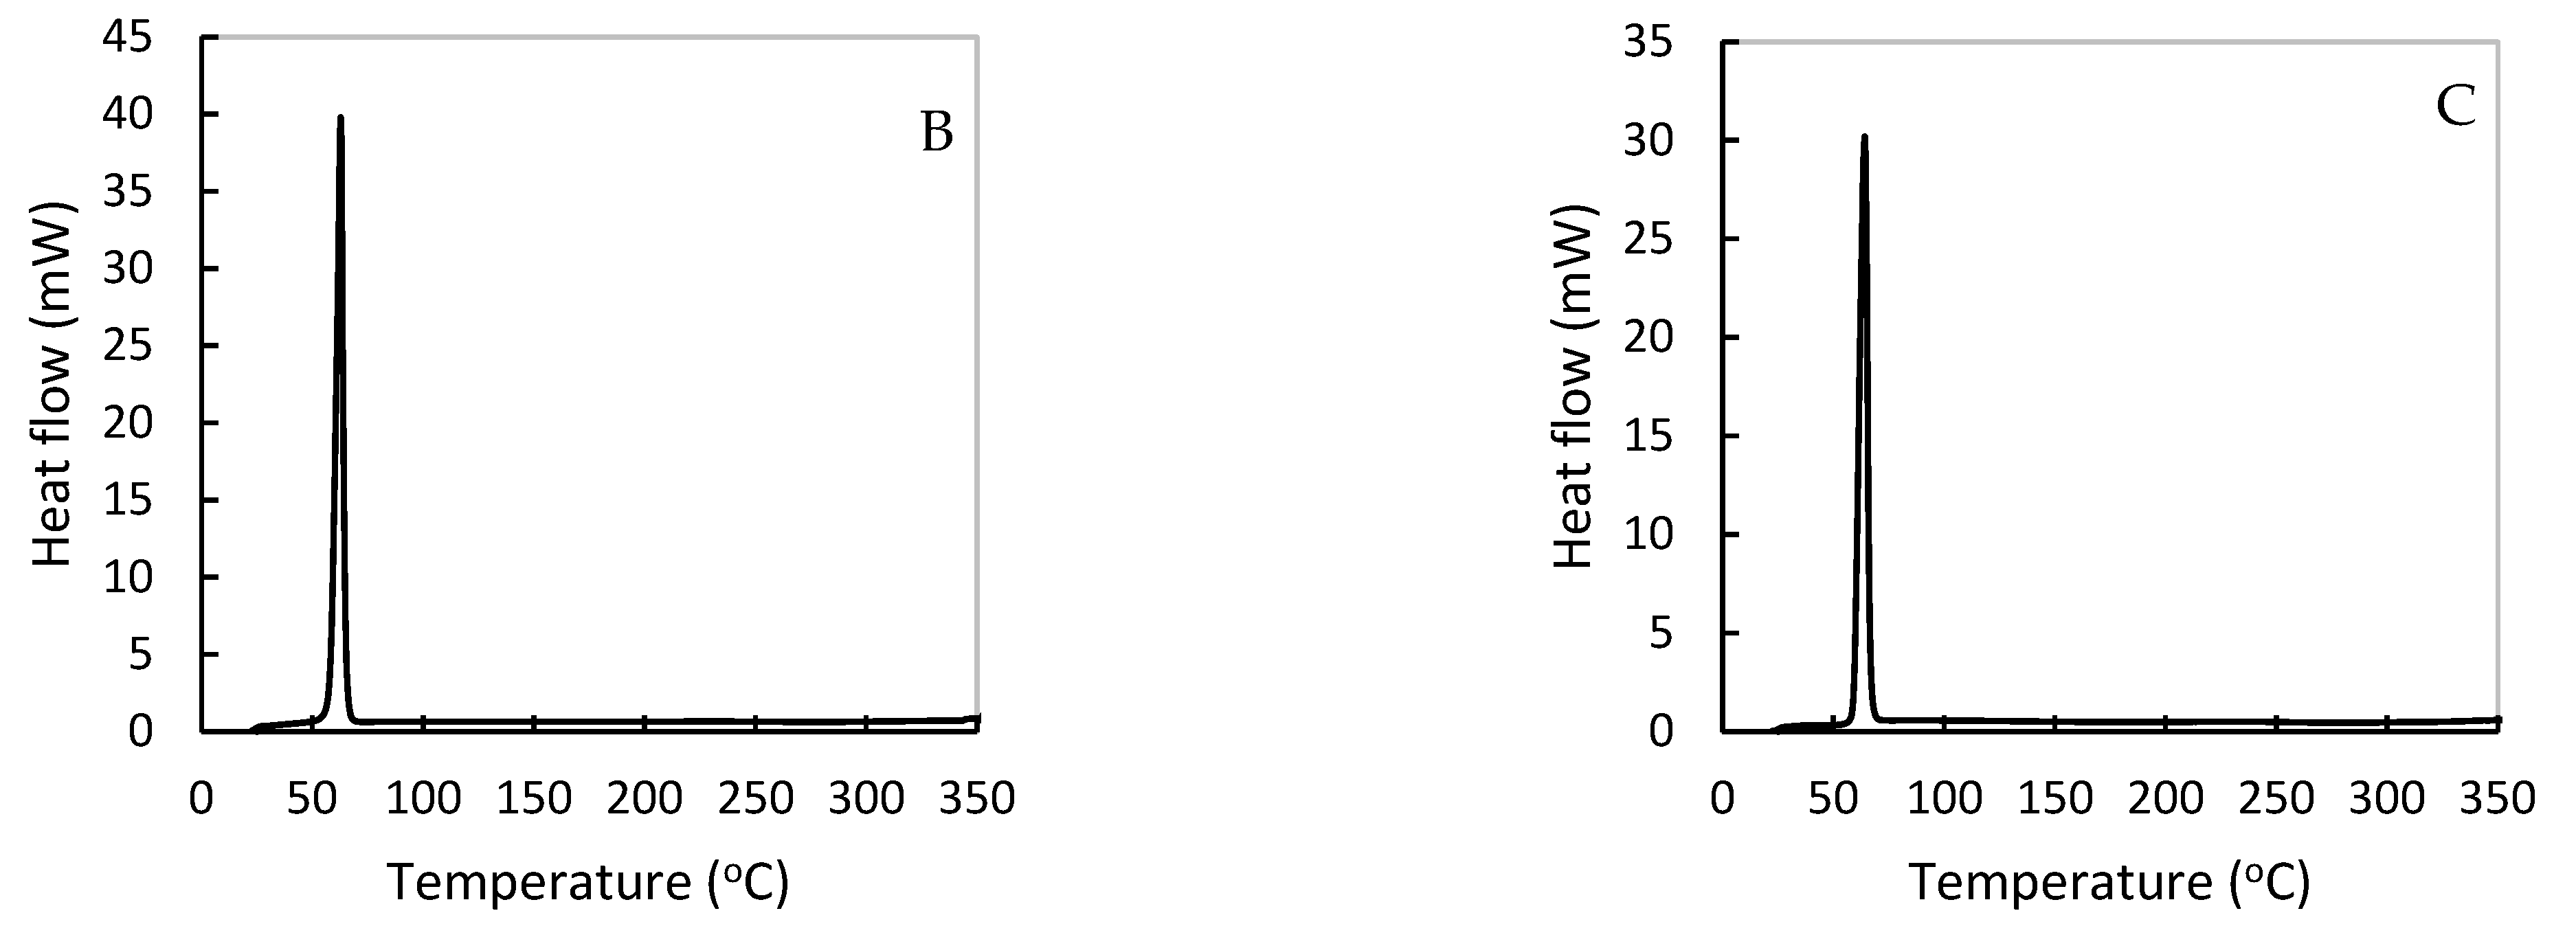
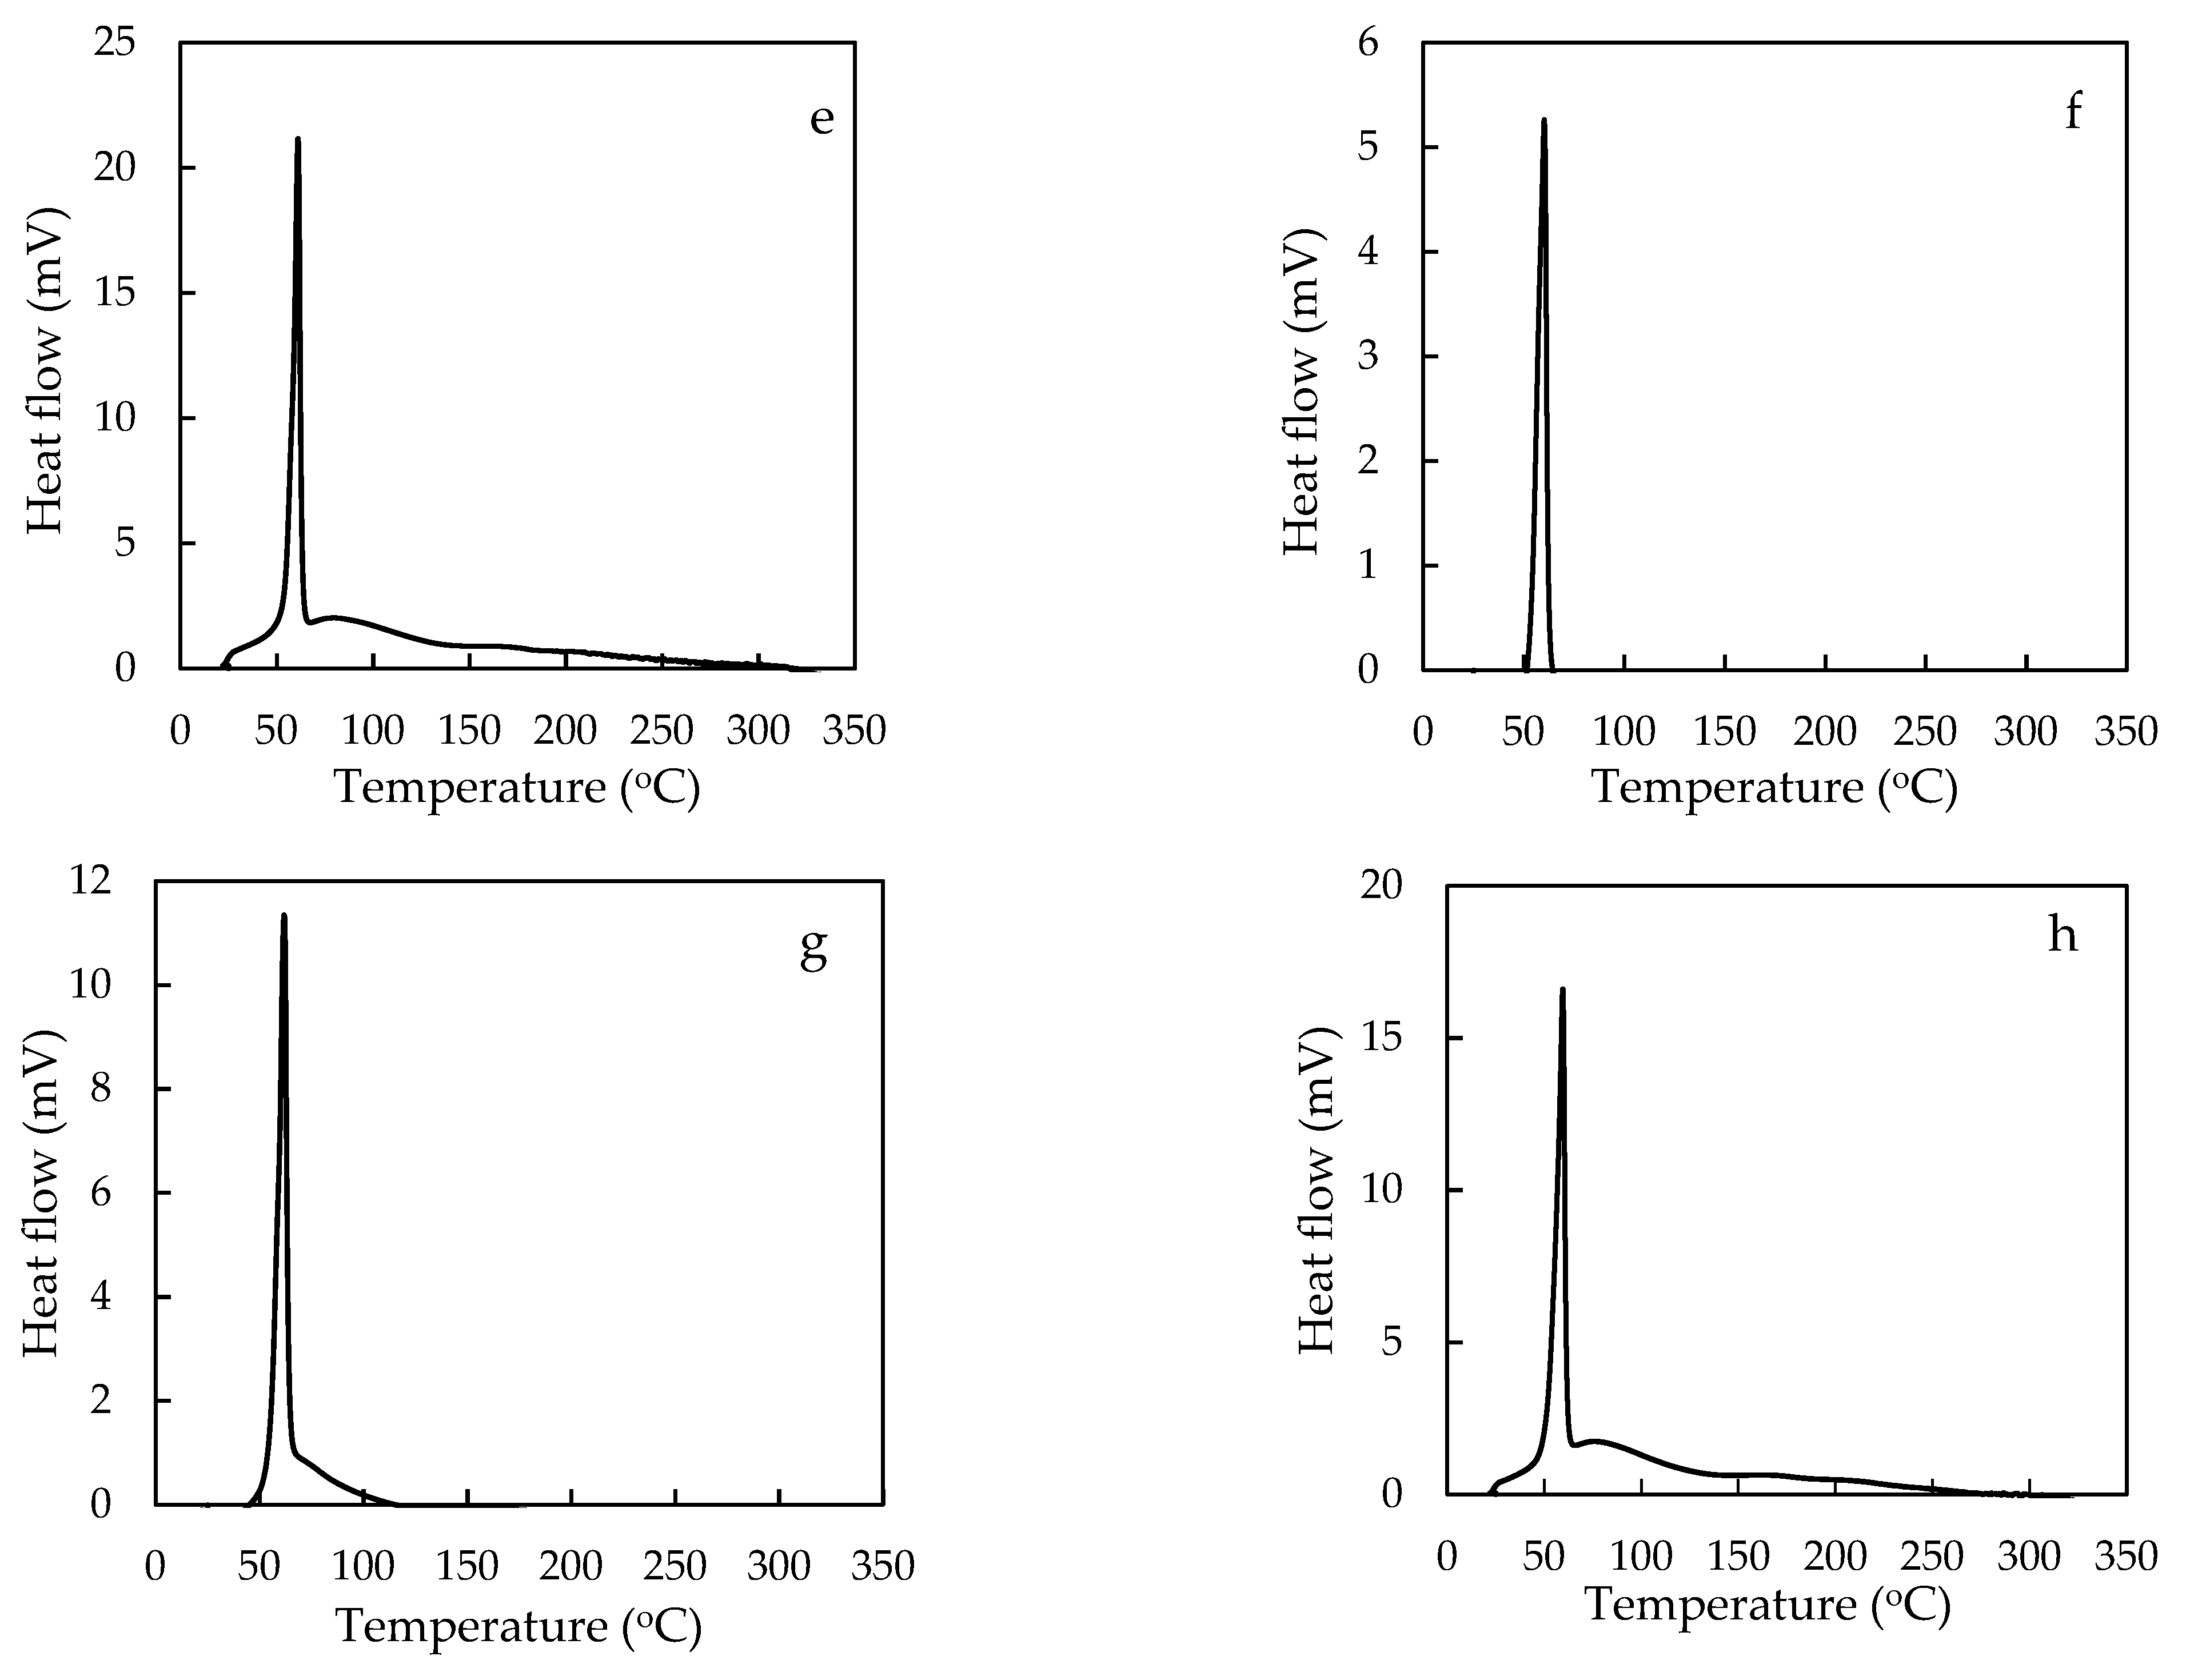
3.2. Thermal Properties of MOLP and SDMOLPs

Diffraction scanning calorimetric (DSC) is a commonly used thermal analysis method due to its capacity to provide detailed information about physical properties. The DSC thermograms of MOLP, carriers, and solid dispersions are displayed in Figure 4 and Figure 5. Moreover, the thermal properties are presented in Table 1. The thermogram of MOLP (Figure 4a) presented five broad and not well-defined endothermic peaks at a heating rate of 10 °C min−1. MOLP had one big broad peak and four extremely small peaks. The peaks were at 80 °C, 162 °C, 210 °C, 253 °C and 312.56 °C temperatures, respectively. The broad characteristic peaks confirmed that MOLP possessed both crystalline and amorphous characteristics, as indicated in the PXRD study. The first endothermic peak and its melting peak were observed at approximately 80 °C with an onset of 44 °C and end set of 89 °C, and amount of endothermic heat (∆H) fusion of 129.30 J/g, attributed to the evaporated water from the matrix, lattice, surface, and pores of MOLP sample. The high enthalpy indicates that more energy was expended in the disruption of noncovalent bonds. Jeyakumar et al. [39] reported similar results with an enthalpy of 177.4 J/g at 71.34 °C for MOLP antioxidants. The second peak was observed at approximately 159.35 °C, showing an onset at 128.23 °C and end set at 179.97 °C with Tg of 141.97 °C and fusion enthalpy 5.0 J/g. The second peak is was related to the melting of Saponins (158 °C) and fats. Huang et al. [7] reported similar fusion enthalpy (2.52–3.93 J/g) for MOLP. Low ∆H means less energy expended for disruption of noncovalent bonds which could be due to high temperatures. The third and fourth peaks were observed at 210 °C (onset: 185 °C and endset: 230 °C) and 253 °C (onset:230 °C and endset: 274 °C) temperatures with heat enthalpies (∆H) of 1.54 J/g and 3.68 J/g, respectively, depicting the melting of tannic acid (218 °C) and gallic acid (258–265 °C). While the fifth wide endothermic peak appeared at approximately 312.56 °C, having an onset at 347.48 °C and an end set at 345.79 °C and fusion enthalpy ∆H of 23.84 J/g and glass temperature of 277.72 °C, denoting the melting of antixodants in Moringa oleifera leaves. These endothermic peaks are attributable to the evaporation of bonded water from the MOLP, which is incorporated in different structures. Furthermore, the endotherms are related to the breaking down or decomposition of organic matter and protein molecules. In addition, the decomposition (above 100 °C) may be associated with a wide variety of secondary metabolites, principally phenolics, present in the dried MOLP [40]. The third, fourth and fifth endothermic peaks might also be associated with the melting of polysaccharides, de-methoxylation, dihydroxylation, and decarboxylation. All the obtained results confirmed the heterogeneity of Moringa oleifera leaves. The leaves are high in minerals, protein, vitamins, phenolics, and phytochemicals. Similar DSC thermograms were reported for Moringa oleifera gum with several peaks of fusion, green tea extract [41], and green tea and curcumin [42]. Ref. [39] also obtained similar results with four endothermic peaks for the Moringa oleifera leaf powder antioxidant.
In the case of PEG4000 and PEG6000 (Figure 4b,c), the DSC thermogram of PEG4000 exhibited a sharp endothermic peak at 60 °C [with enthalpy (∆H) fusion of 179.70 J/g]. corresponding to its melting point. Similar results were reported by [3]. PEG6000 also showed a single, sharp, and narrow endothermic peak at 63.10 °C with a corresponding enthalpy (∆H) fusion of 193.4 J/g. The observed endothermic peak was associated with the melting point of the carrier, indicating the semi-crystallinity of the carrier. The fusion temperature of PEG6000 has been reported as 62–65 °C [43]. Biswal et al. [44], reported a similar melting temperature (61.9 °C) but slightly lower ∆H of 188.6 J/g than the one obtained in this study. Therefore, these results were in agreement with previous similar studies. PEG4000 and PEG6000 are indeed semi-crystalline carriers, also confirmed by thethe PXRD result in the previous section.
Solid dispersion thermograms in Figure 5 exhibited characteristic and single endothermic peaks with melting temperatures ranging from 57.76–61.76 °C and heat enthalpy (∆H) ranging from 75.22–108.44 J/g. Sharp with slightly broadened base endothermic peaks were obtained for all the solid dispersions, thus, proving their semi-crystallinity to amorphic. The characteristic endothermic peak corresponding to the carriers melting point (60–63 °C) was broadened and shifted toward lower temperature, with reduced intensity, in all the solid dispersion. This could be attributed to the uniform distribution of MOLP in the polymer, resulting in the complete miscibility of the molten MOLP in PEG carriers. The complete disappearance of the MOLP melting peaks in solid dispersions suggests the molecular dispersion of MOLP in PEG carriers or the absence of crystalline nature of MOLP, as discussed in the PXRD study. This indicates the conversion of MOLP from crystalline to partially amorphous form in solid dispersion. The reduction of heat fusion enthalpy (∆H) in DSC thermograms of solid dispersions indicated lower crystallinity. Different methods of solid dispersion preparation did not have a significant effect on the melting temperature of SDMOLPs. However, significant differences in ∆H existed, which suggested that solid dispersions prepared by microwave irradiation and melting methods had a slightly higher degree of crystallinity than solid dispersions prepared by freeze-drying and solvent evaporation methods. Biswal et al. [44] also reported similar DSC findings for their gliclazide and PEG6000 solid dispersions prepared by a solvent evaporation method, where the endothermic peaks resembled that of PEG and showed complete absence of the pure ingredient endotherm peaks. da Silva et al. [20] reported similar thermal profiles in their solid dispersions. This data reinforces the results of PXRD that have been described previously.

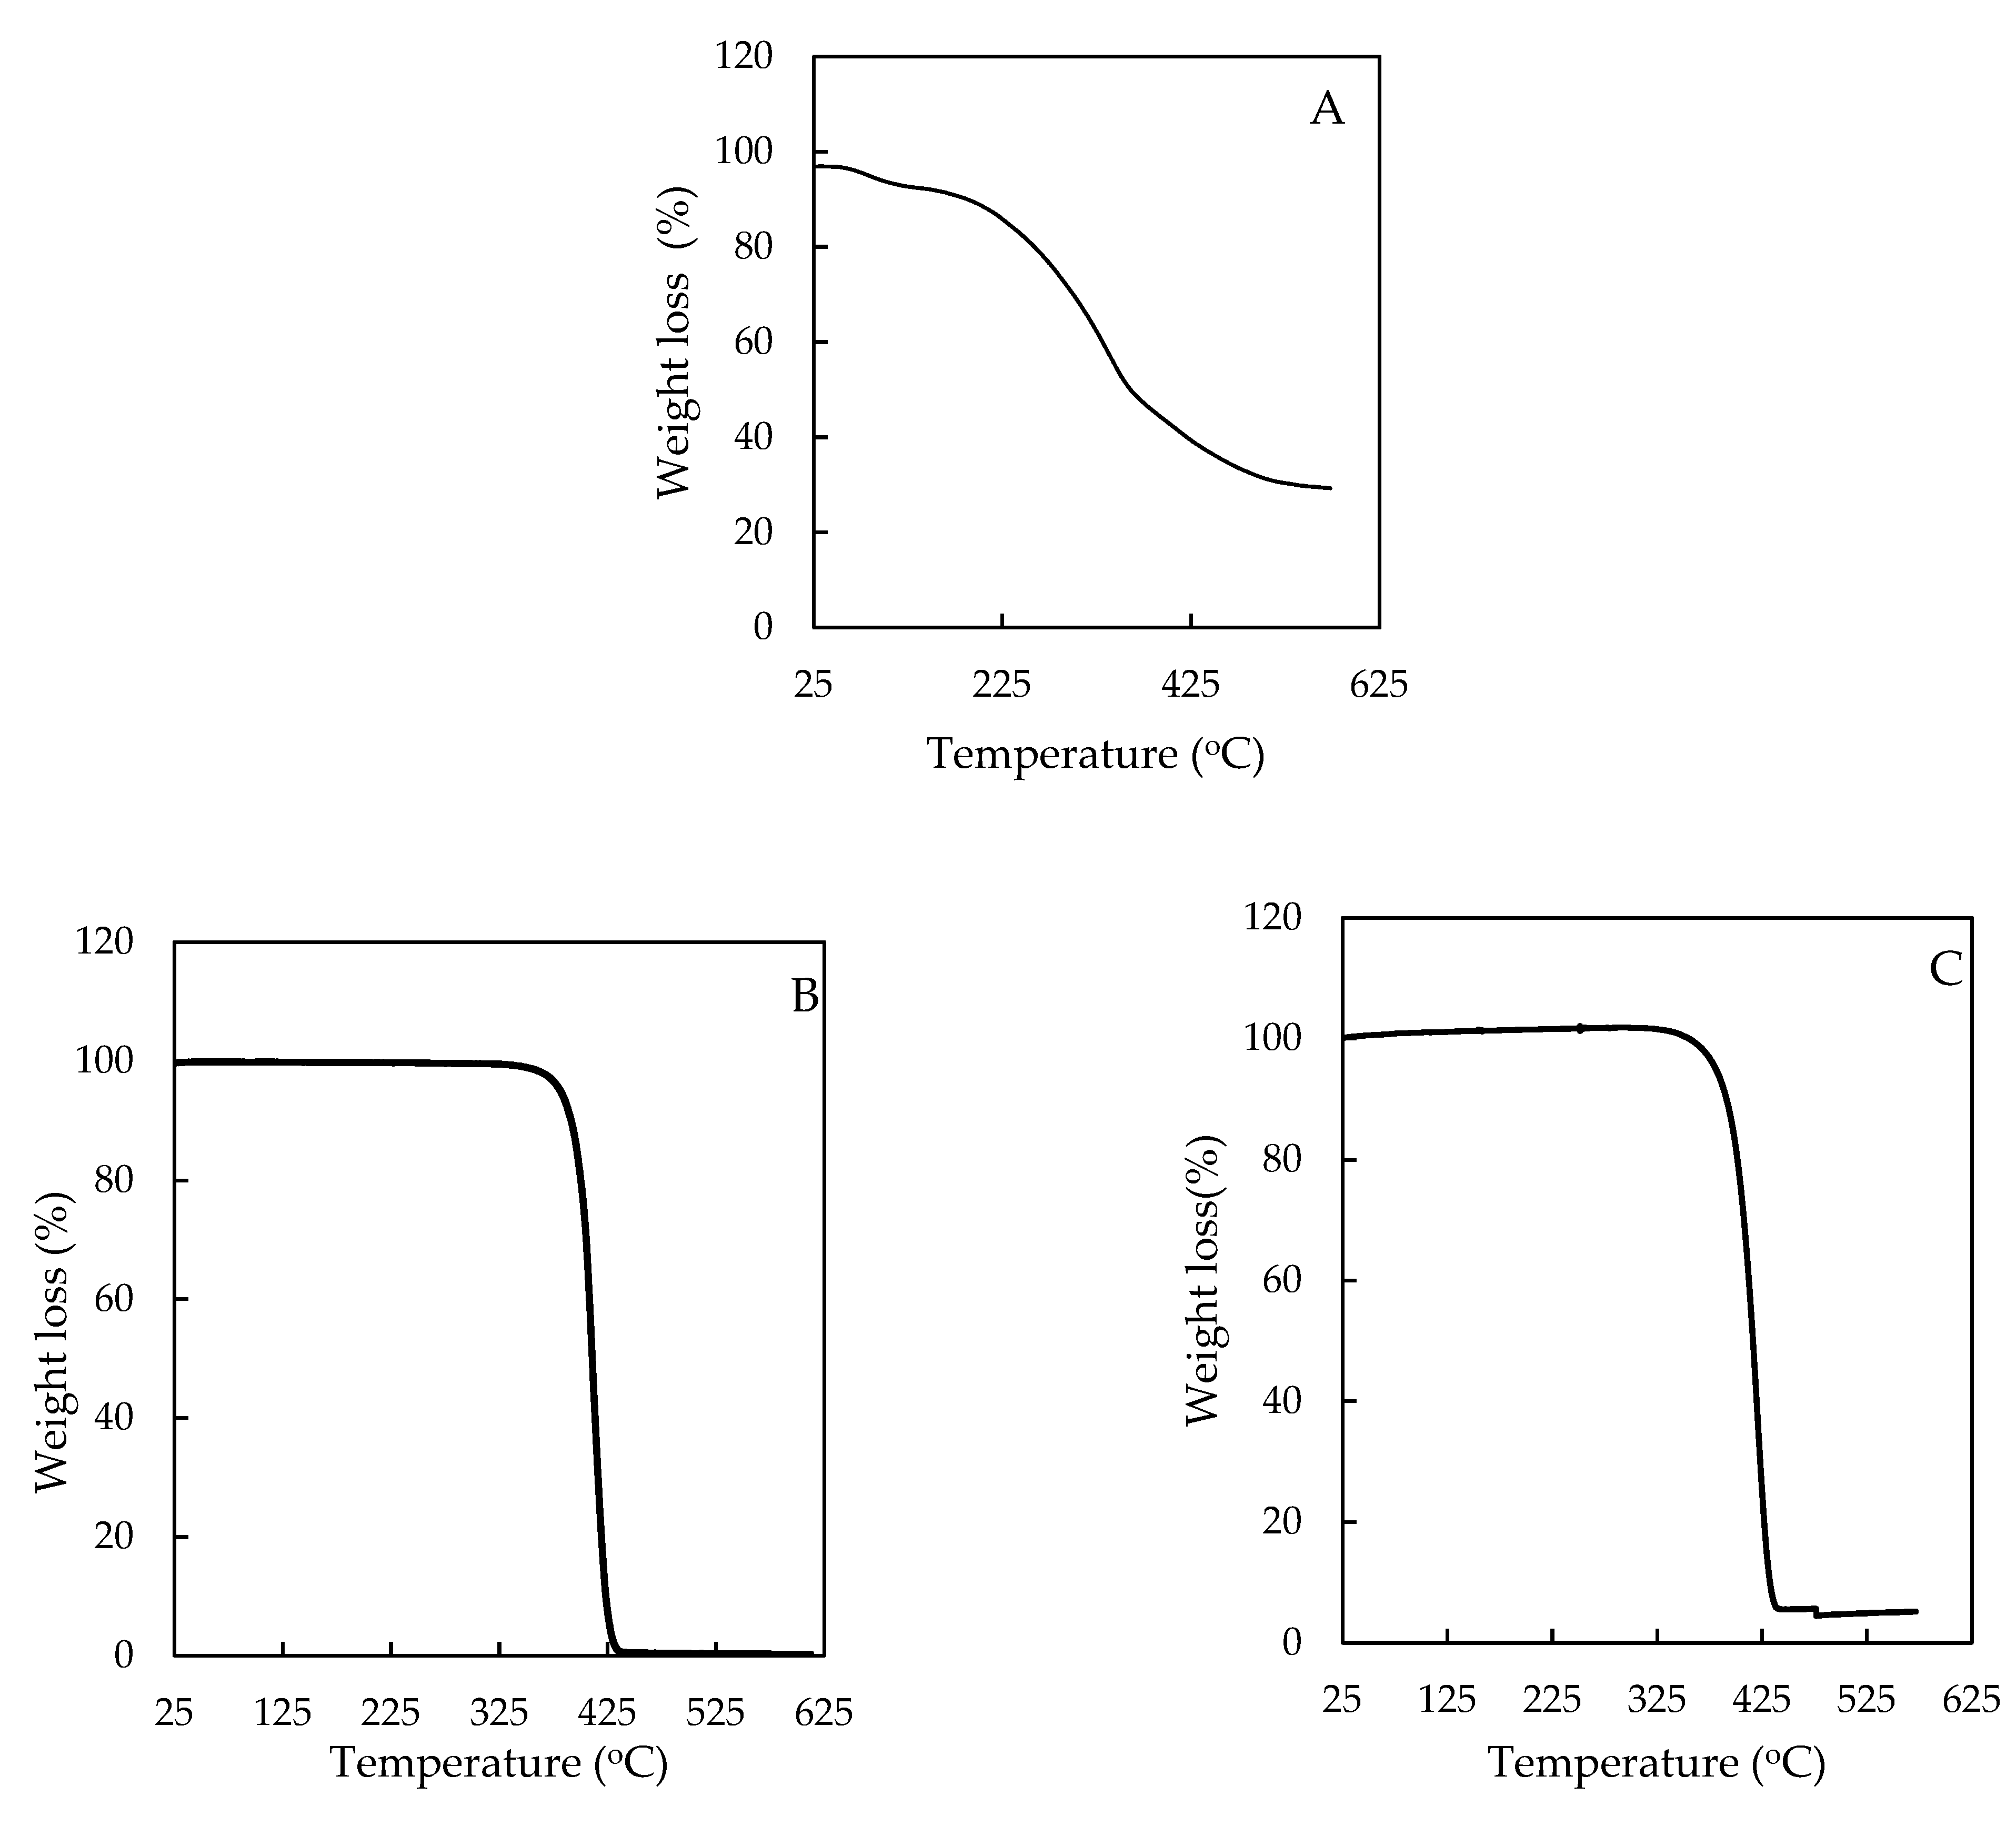
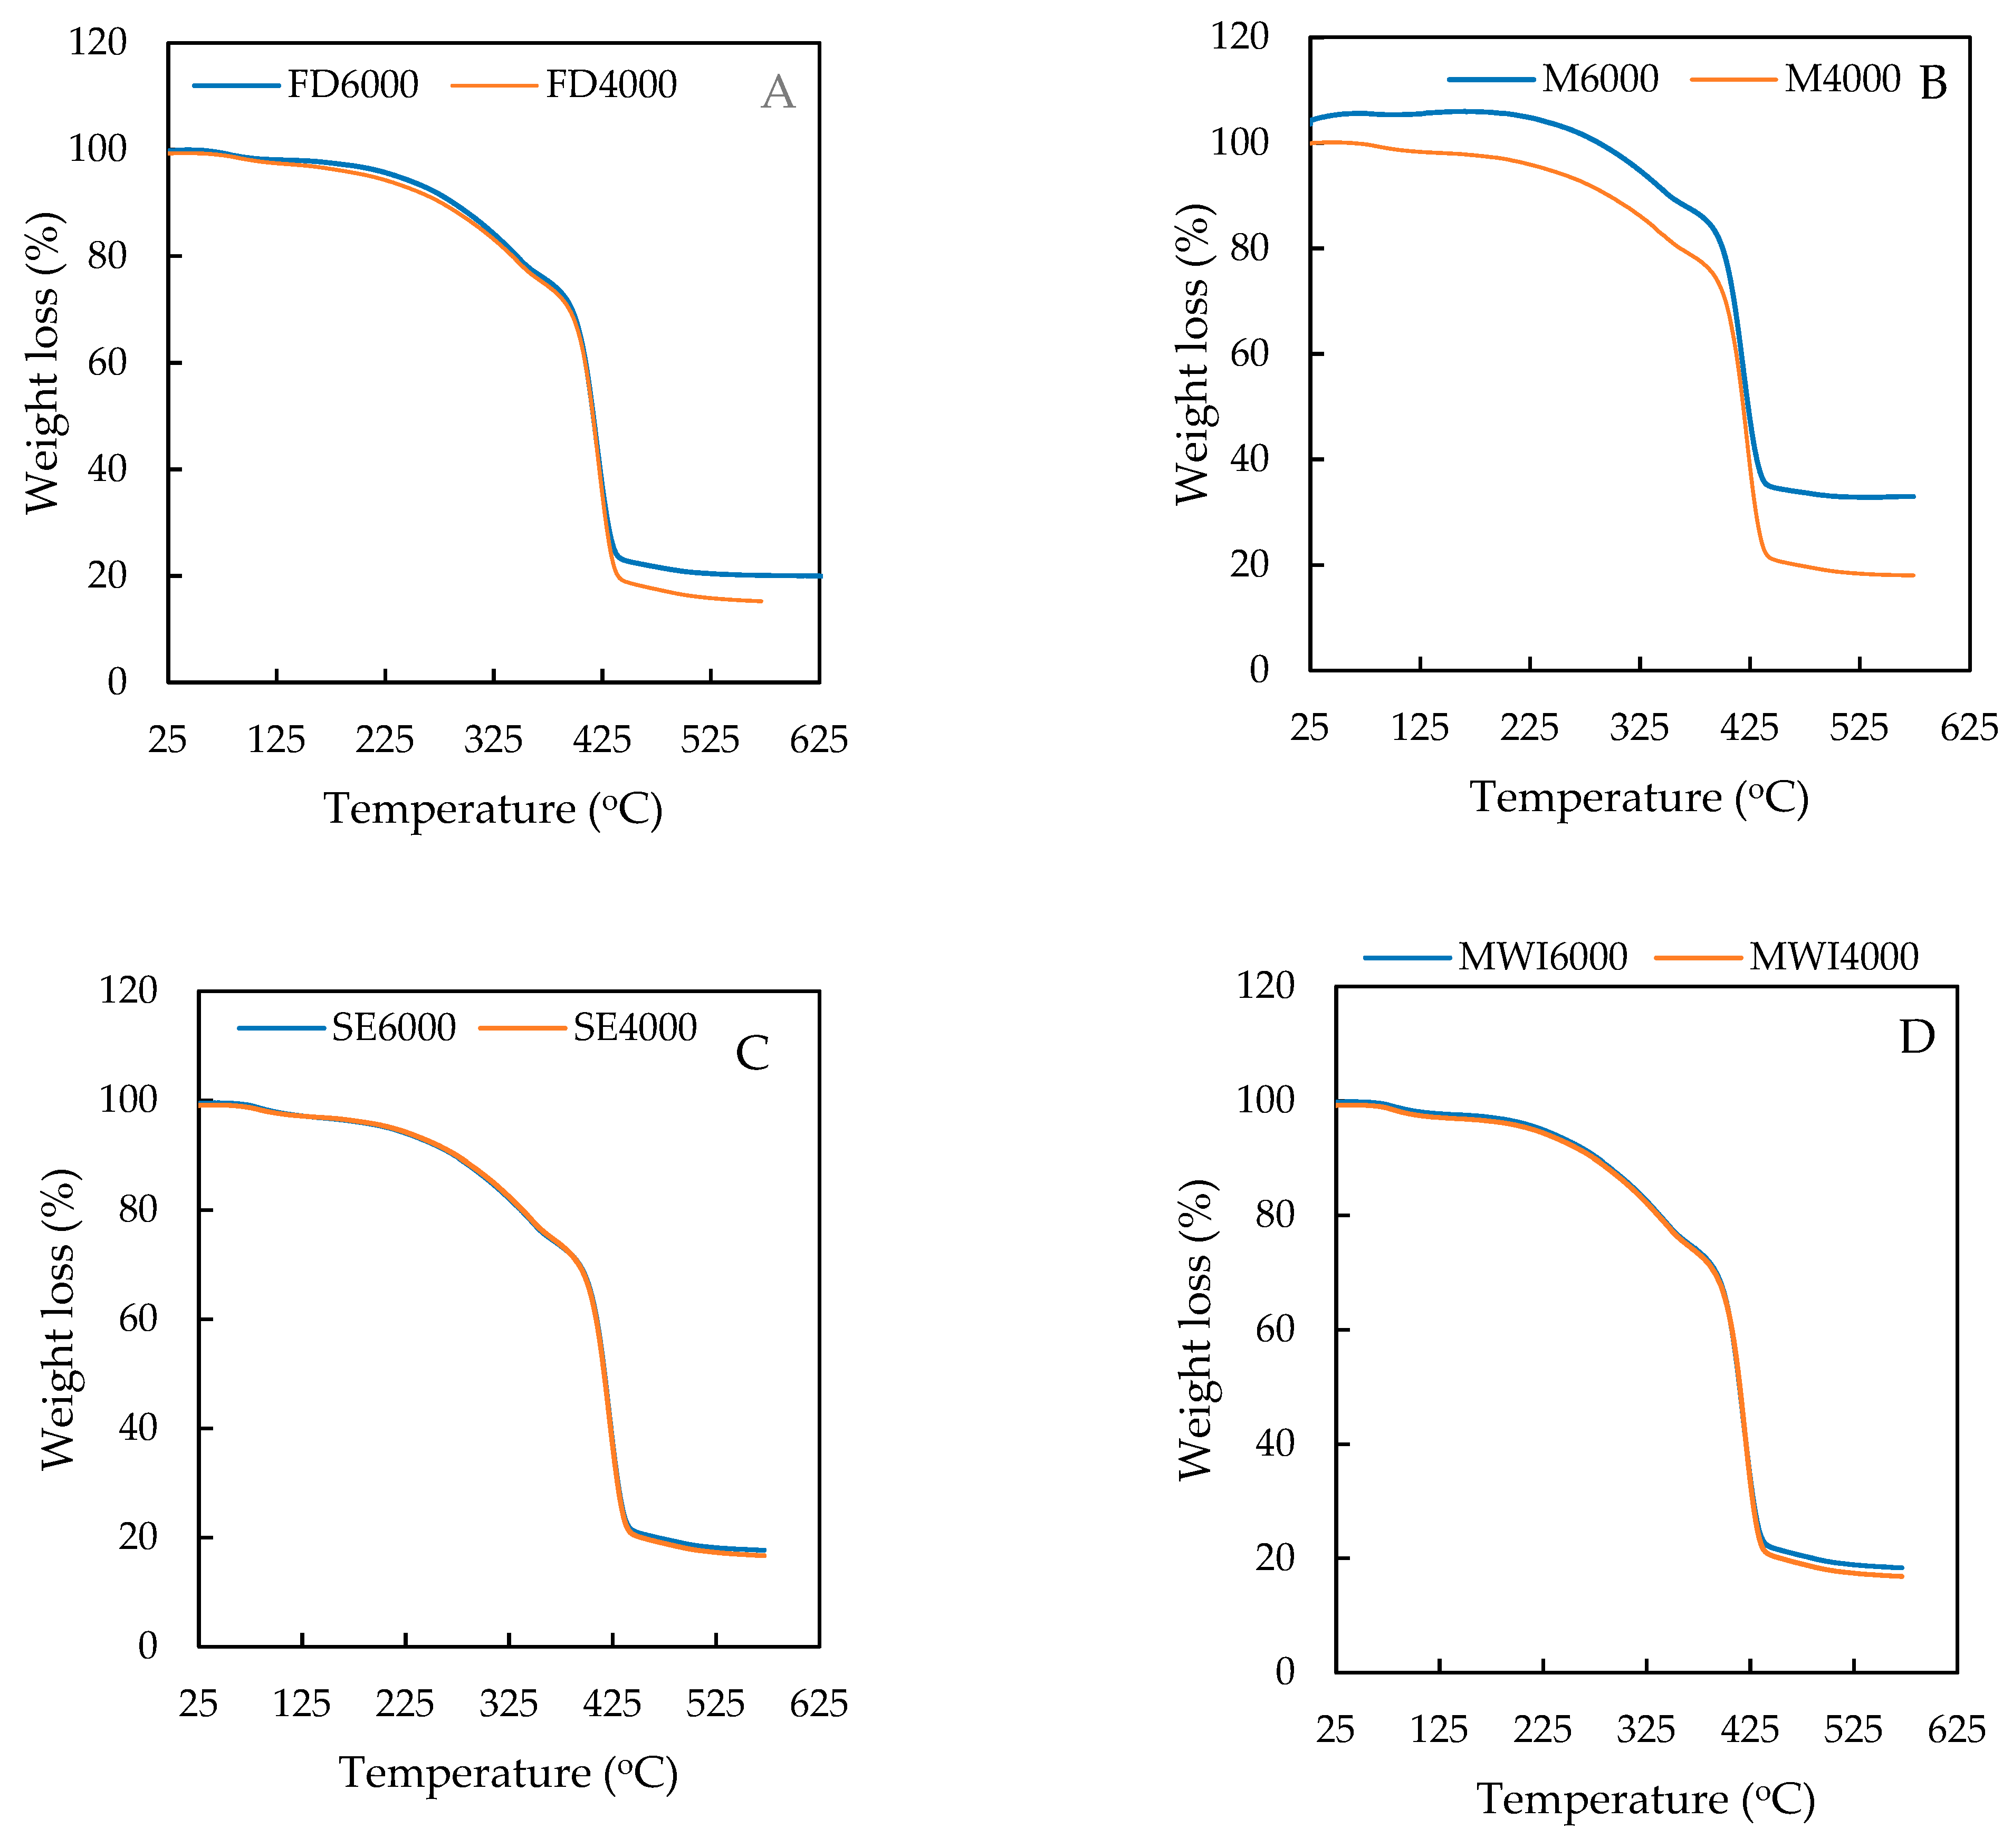
3.3. Thermogravimetric Properties of MOLP and SDMOLPs

Thermogravimetric analysis (TGA) was used to characterize the decomposition and thermal stability of the samples. As the temperature increased, the weight of the sample decreased indicating the continuous decomposition of the sample. TGA thermograms of pure MOLP, carriers (PEG6000 and PEG4000), and solid dispersion samples are displayed in Figure 6 and Figure 7. Moreover, Table 2 presents the values of mass loss (%) as a function of temperature. MOLP thermogram (Figure 6A) exhibited several stages of the decomposition process. The mass loss of MOLP can be divided into three stages. In the first stage (32.21–151.07 °C), MOLP slightly lost 4.96% weight just after the heating commenced up to 151.07 °C, associated with moisture loss or water desorption (dehydration of adsorbed and surface water from the MOLP). The amount of water lost from MOLP is similar to the 8.44% moisture content found in the literature [45,46,47]. In the second stage, a significant major weight loss of 44.16% was observed over a temperature range of 151.07–371.86 °C. This stage was related to the decomposition of organic matter, including the protein components (amino acids which have a melting point of 200–300 °C), fat, and carbohydrate (265 °C) present in Moringa leaves which have155–250 °C melting temperatures. Moreover, this stage might also occur due to the decomposition of fatty acids, for example, oleic acid, which has a boiling point of 360 °C [30]. Since MOLP is a good source of phenolic compounds and phytochemicals, the second stage may further denote the decomposition of remaining phytochemical compounds such as kaempferol (276–278 °C), quercetin (316 °C), gallic acid (26 °C), and tannic acid (above 200 °C), thus indicating the presence of antioxidant components in Moringa oleifera leaves [39]. In addition, 200–450 °C is associated with the degradation of cellulose and hemicellulose [48]. Similar results were reported for Moringa oleifera leaf antioxidants by Jeyakumar et al. [39]. The final stage of degradation with 17.91% weight loss appeared after 390 °C with the decomposition of particles in the range of 371.86 °C to 571.76 °C, which probably include fatty acids, ash, or mineral content, and inorganic oxides. MOLP is high in minerals (11.82%) [49]; thus, the last stage can be attributed to the mineral decomposition and residues mass, usually carried out at high temperatures (500 °C). Moreover, lignin degradation happens at the temperature of 450–500 °C [48]. Oxygen-containing functional groups such as lactones or esters (-COO-) and carboxyls (COOH carboxylic acid) decompose in this temperature range. It has been reported that functional groups including hydroxyl, carboxyl groups, and esters were decomposed at 326.85 °C and 499.85–723.85 °C [50]. MOLP exhibited poor thermal stability, corroborating the calorimetric (DSC) curve data discussed in Section 3.2. More so, Araújo et al. [30] and Bello et al. [51] observed similar behavior during the thermal assessment of Moringa oleifera seed powder. Another similar behavior was described by Ram et al. [52] for Carica papaya leaves with 6.23% mass loss in the first stage and 28.00% and 17.46% in the second and third stages.
PEG4000 (Figure 6B) exhibited a single thermal decomposition of 98.22% in the temperature range of 356.4–483.84 °C. This thermal behavior for PEG4000 is similar to those (99.16%) reported by Kou et al. [34]. Meanwhile, the PEG6000 thermograph (Figure 6C) also exhibited a uniform thermal degradation behavior and greater stability. A single mass loss stage was observed between 330.78 °C and 451.32 °C and peaked at 391.01 °C with 96.0% weight loss. This corresponds to the decomposition of the materials or PEG chains, carbonaceous material originating from the decomposition of the high molecular weight polymer (PEG6000). These results concur with the previously reported weight loss (98.79%) of PEG6000 [53]. Jayaramudu et al. [33] also reported a similar weight loss of 95.97% for PEG6000 in the same temperature range. Both PEG4000 and PEG6000 undergo a substantial weight loss at ~400 °C, corresponding to the pyrolysis of PEG functional groups. Based on these findings, it can be concluded that all the PEG samples were thermally stable.
Figure 7 shows the thermogravimetric curves of solid-dispersed MOLP obtained by freeze-drying, melting, solvent evaporation, and microwave irradiation methods of solid dispersion. Moreover, Table 2 presents the values of mass loss as the function of temperature. Solid dispersions prepared by the freeze-drying method (PEG4000 and PEG6000) in Figure 7A revealed three stages of thermal degradation occurring at 130.87 °C, 369.82 °C, and 569.78 °C with the mass losses 1.93%, 22.8% and 55.02–59.88%, respectively. The two solid dispersions (PEG4000 and PEG6000) showed similar results for stages 1 and 2 but significantly differed in stage 3 weight loss. The solid dispersions (PEG6000 and PEG4000) prepared by the melting method in Figure 7B also revealed three mass loss stages. MOLP-PEG4000 had 1.83%, 19.49%, and 60.69% mass losses observed in the temperature ranges of 32.12–131.35 °C, 131.35–371.74 °C, and 371.74–572.01 °C, respectively. The first weight loss of 1.27% occurred in the MOLP-PEG6000 solid dispersion from 24.97 to 111.48 °C, the second stage occurred in the temperature range of 111.48–371.74 C with 18.30% mass loss, and the final major mass loss of 54.78% occurred in the temperature range of 371.74–572.01 °C. The solid dispersions (PEG4000 and PEG6000) in Figure 7C showed a 2.10% mass loss between 32.13 and 130.27 °C, a 22.66% mass loss between 130.27–369.72 °C, and a 57.57% mass loss between 369.72–569.86 °C. Furthermore, solid dispersions prepared by the microwave method (PEG4000 and PEG6000) (Figure 7D) also indicated three stages of weight loss, where the first mass loss of 2.26% is occurring from 31.97–130.34 °C. The second mass loss, 22.93%, occurs in the temperature of 130–369.77 °C. While the stage of mass loss (57.18%) was observed at 369–572 °C. In all the solid dispersions, the first mass loss stage was attributed to water desorption and loss of loosely bound water [19,48]. (ii) The second stage occured due to the decomposition of organic matter, protein components, fatty acids in the temperature range 130.34–369.77 °C. (iii) The third stage was attributed to organic phase desorption, such as minerals (500 °C) and phenolic compounds. Solid dispersions presented the same degradation profile as that of pure MOLP. However, the strong intermolecular interactions between MOLP and PEG significantly increased the temperatures of the solid dispersions. This may also be attributed to the higher compatibility of PEGs with MOLP as evidenced by the peak shift to the right side, thereby increasing the thermal stability of solid dispersions. Solid dispersions exhibited good thermal stability than the MOLP. These findings corroborate with calorimetric thermograms discussed in this study. Similar results were reported by [20]. Zeng et al. [54] also reported a similar finding that PEG increased the thermal stability of Palmitate in solid dispersion.

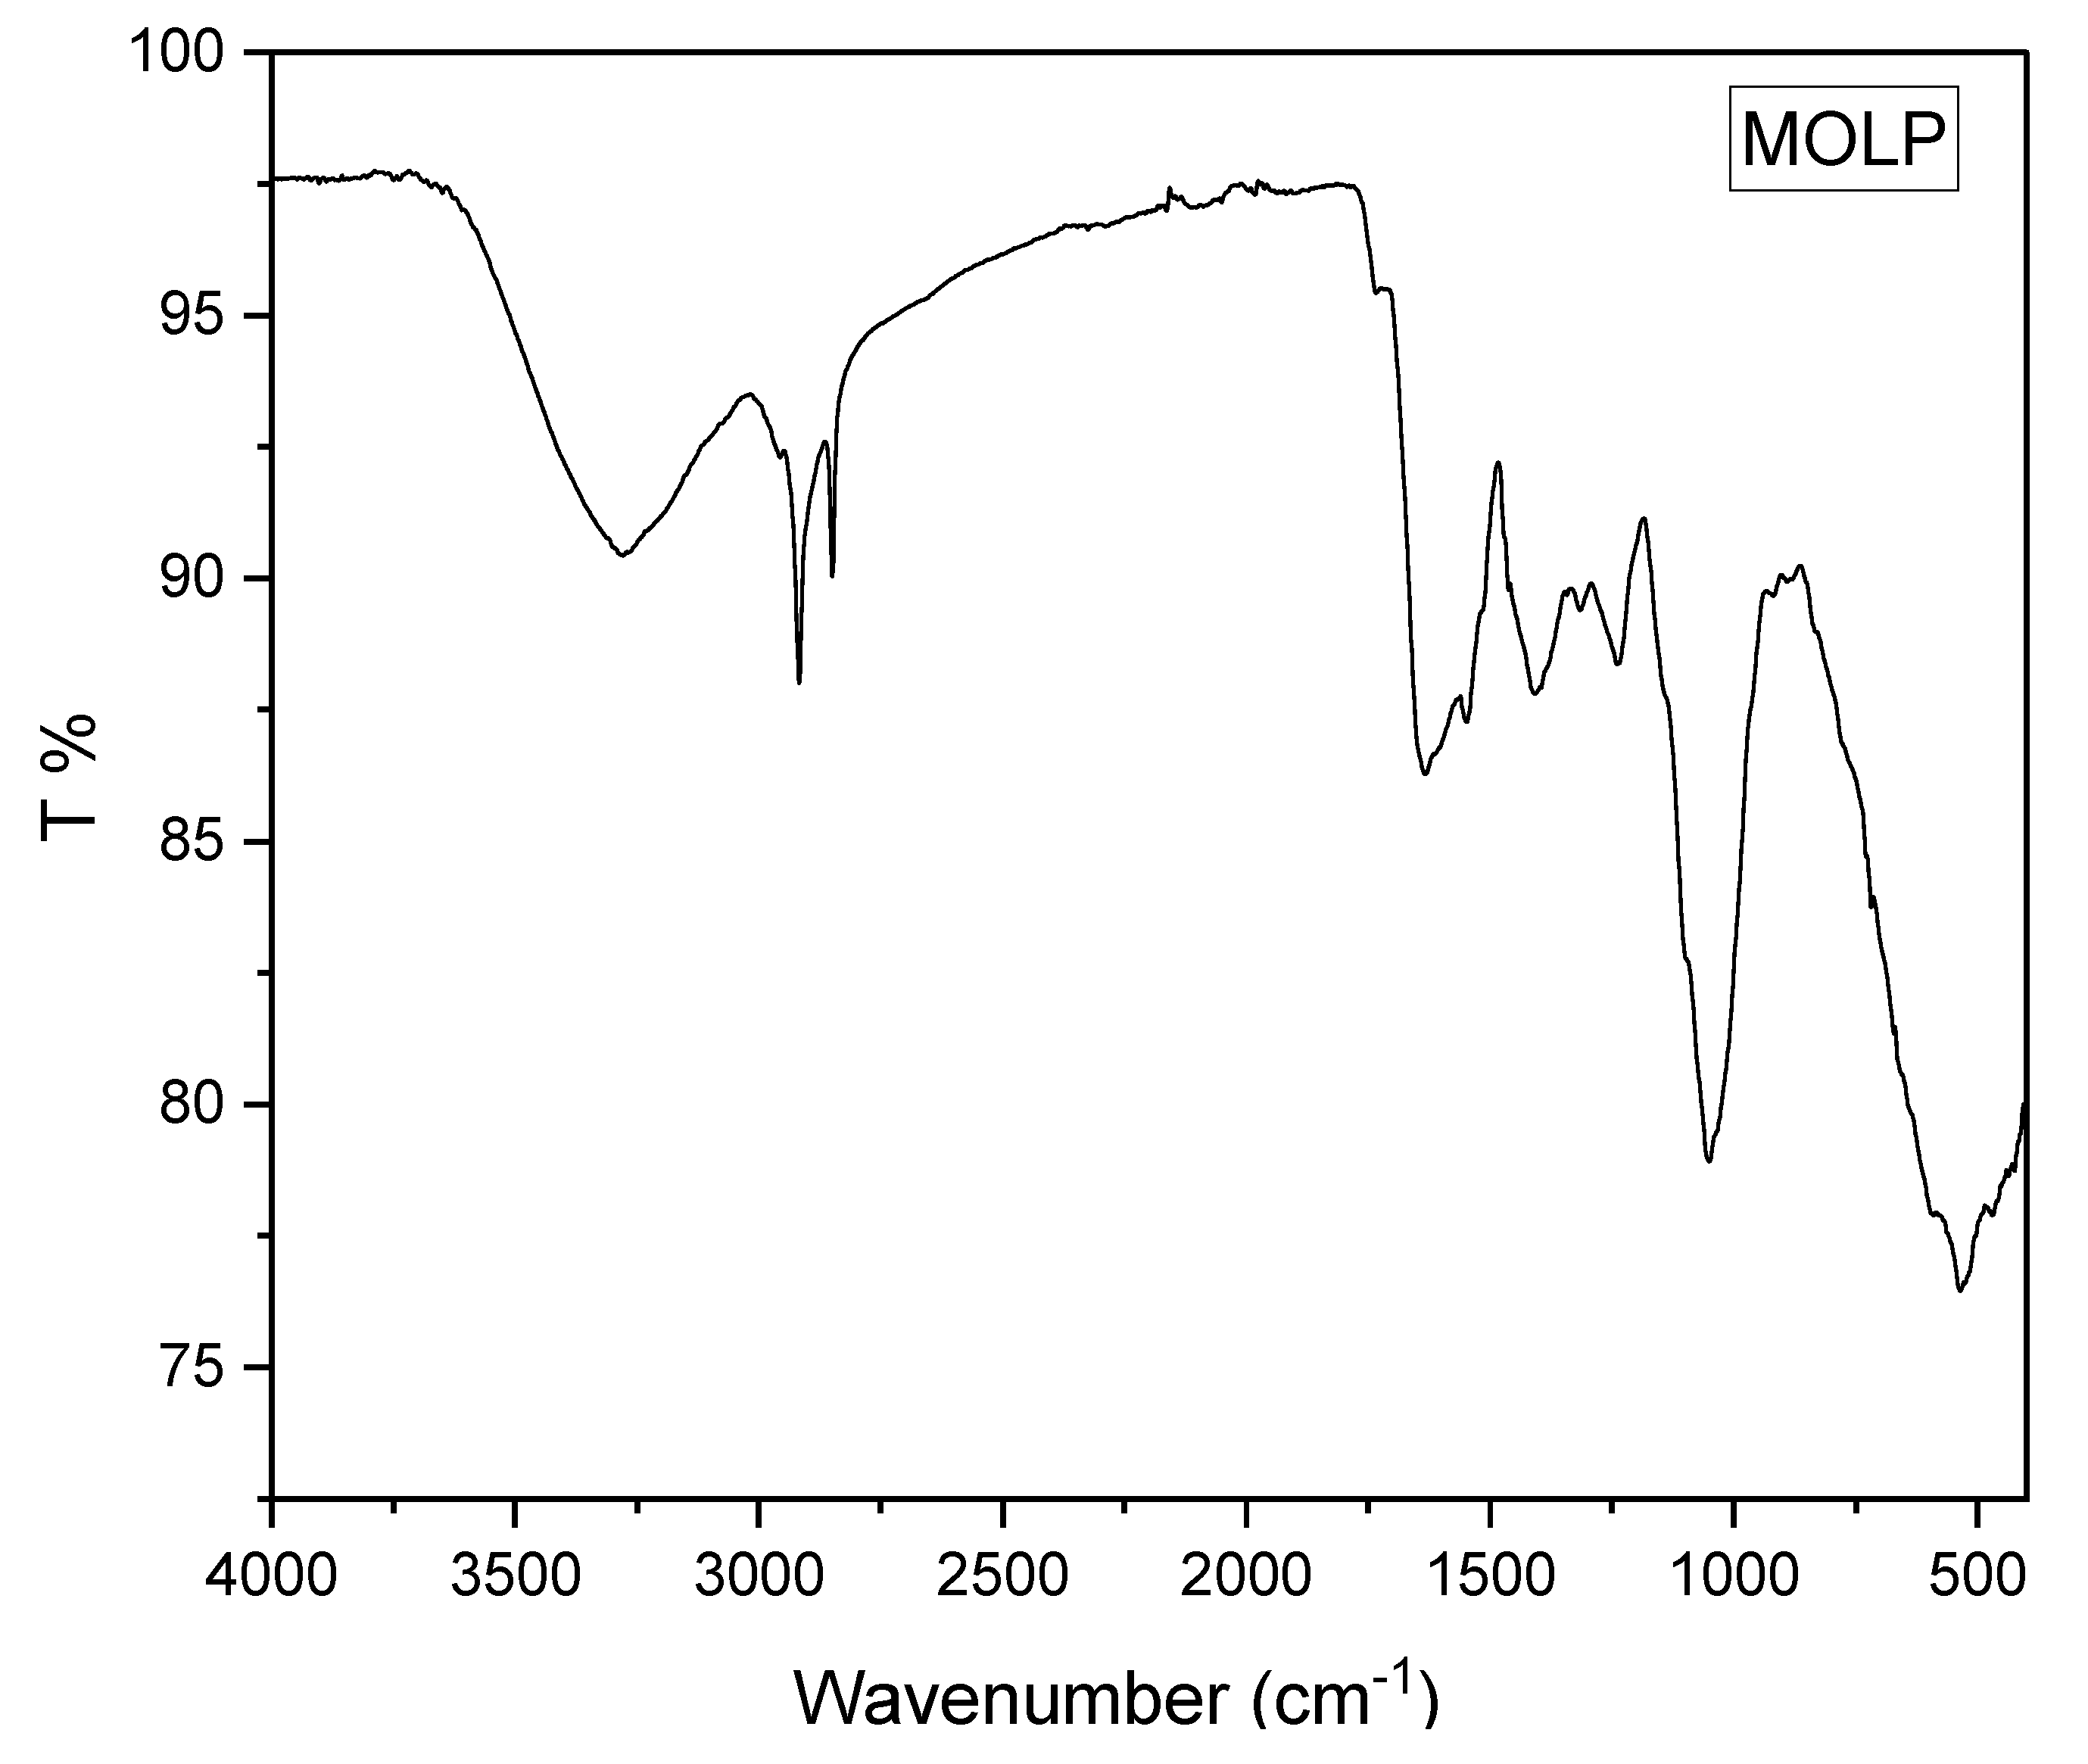
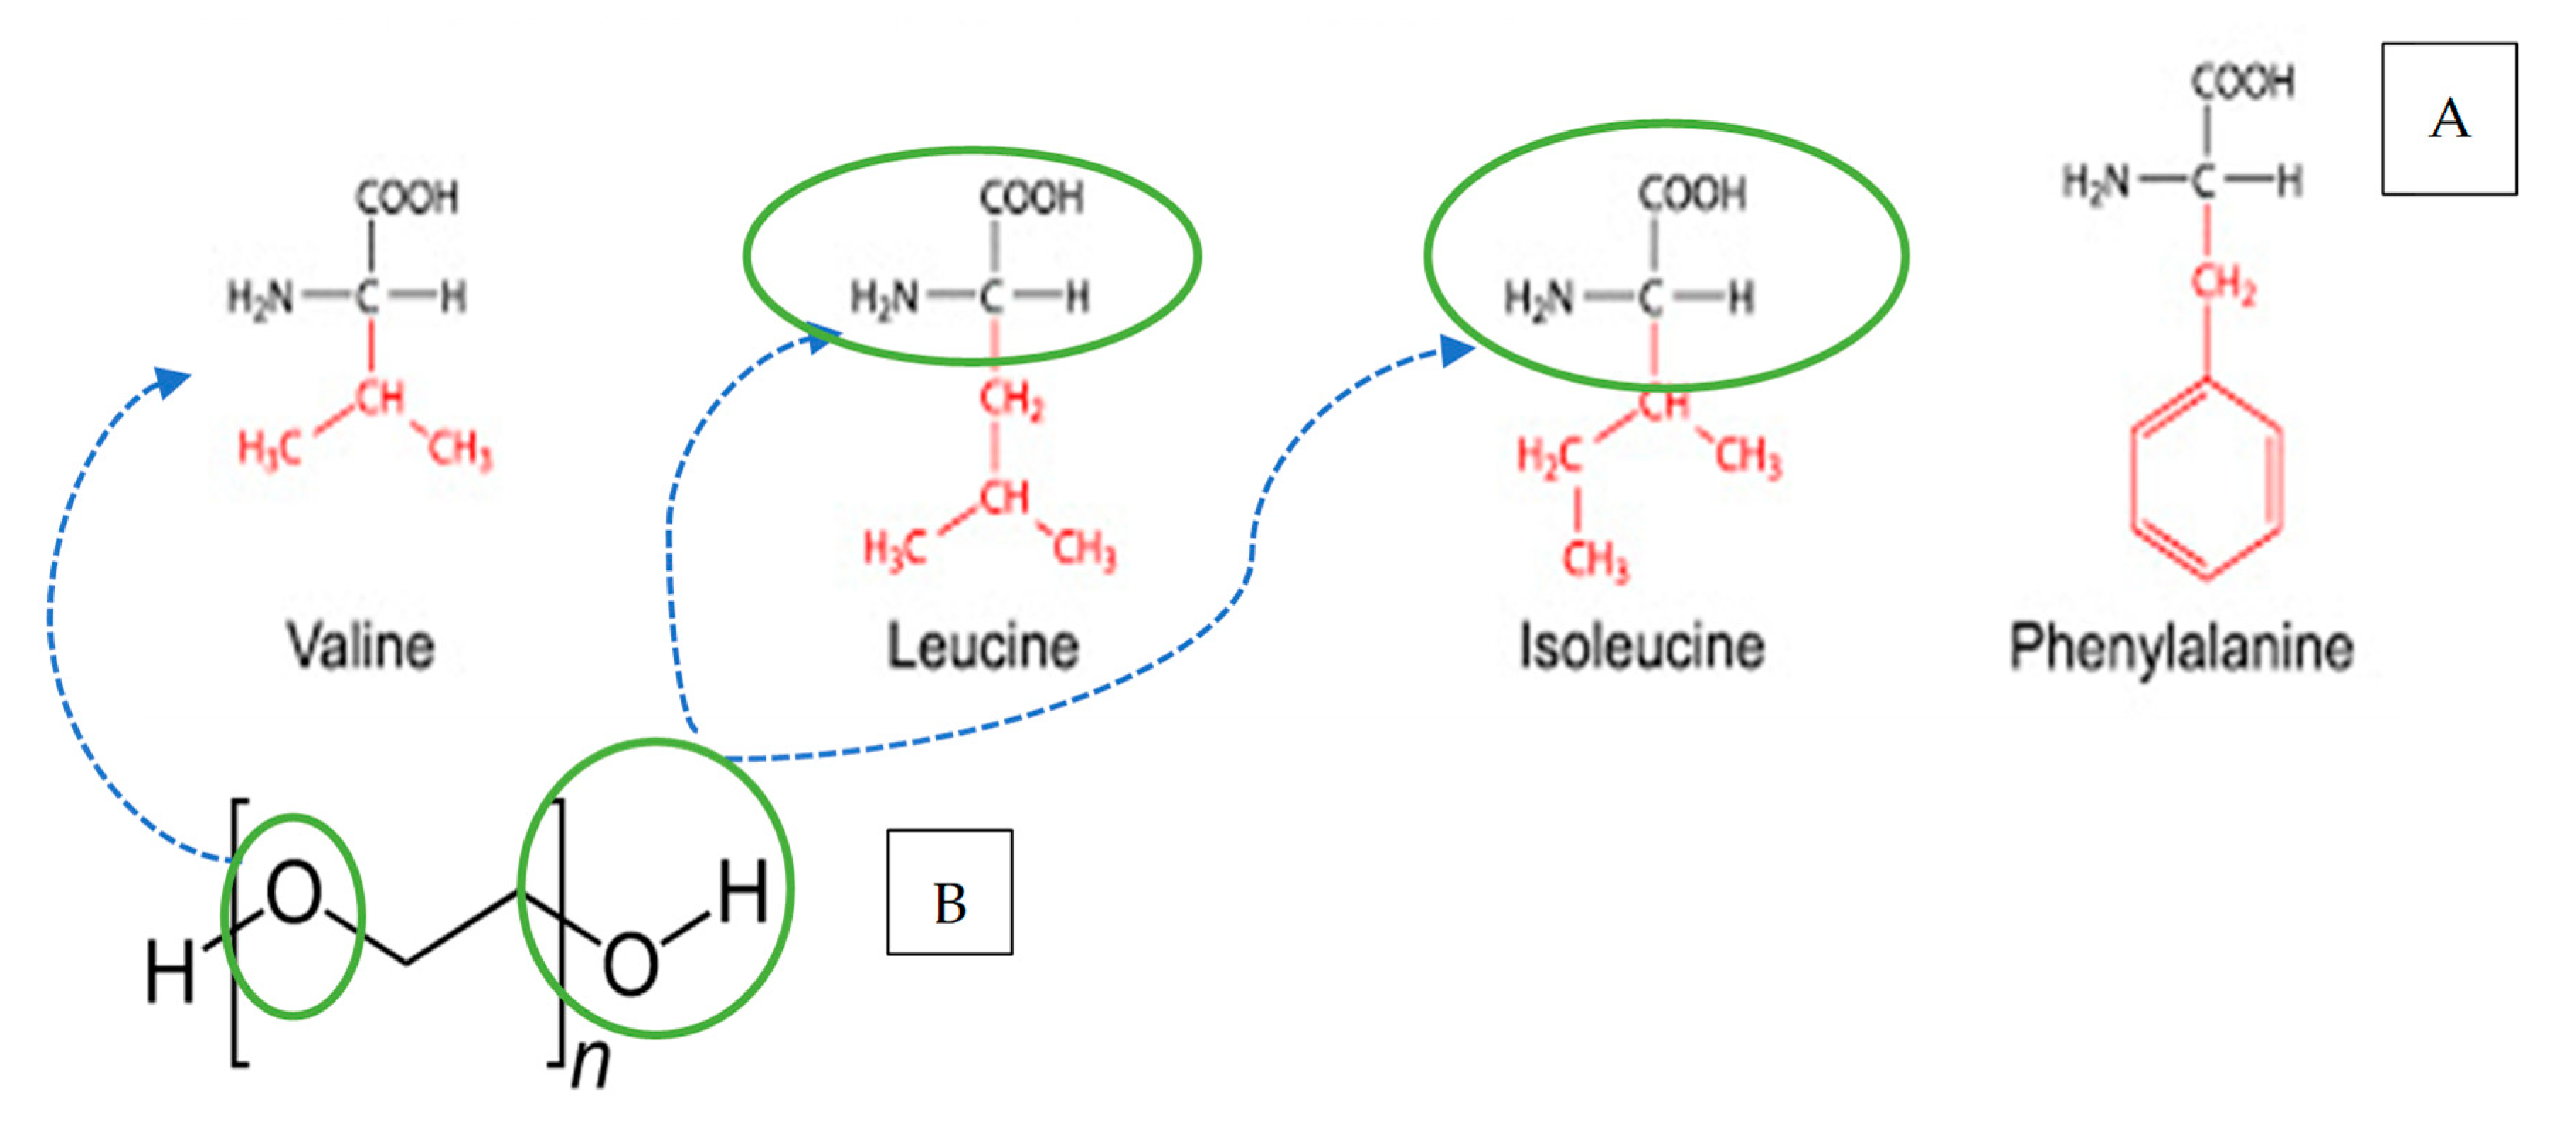
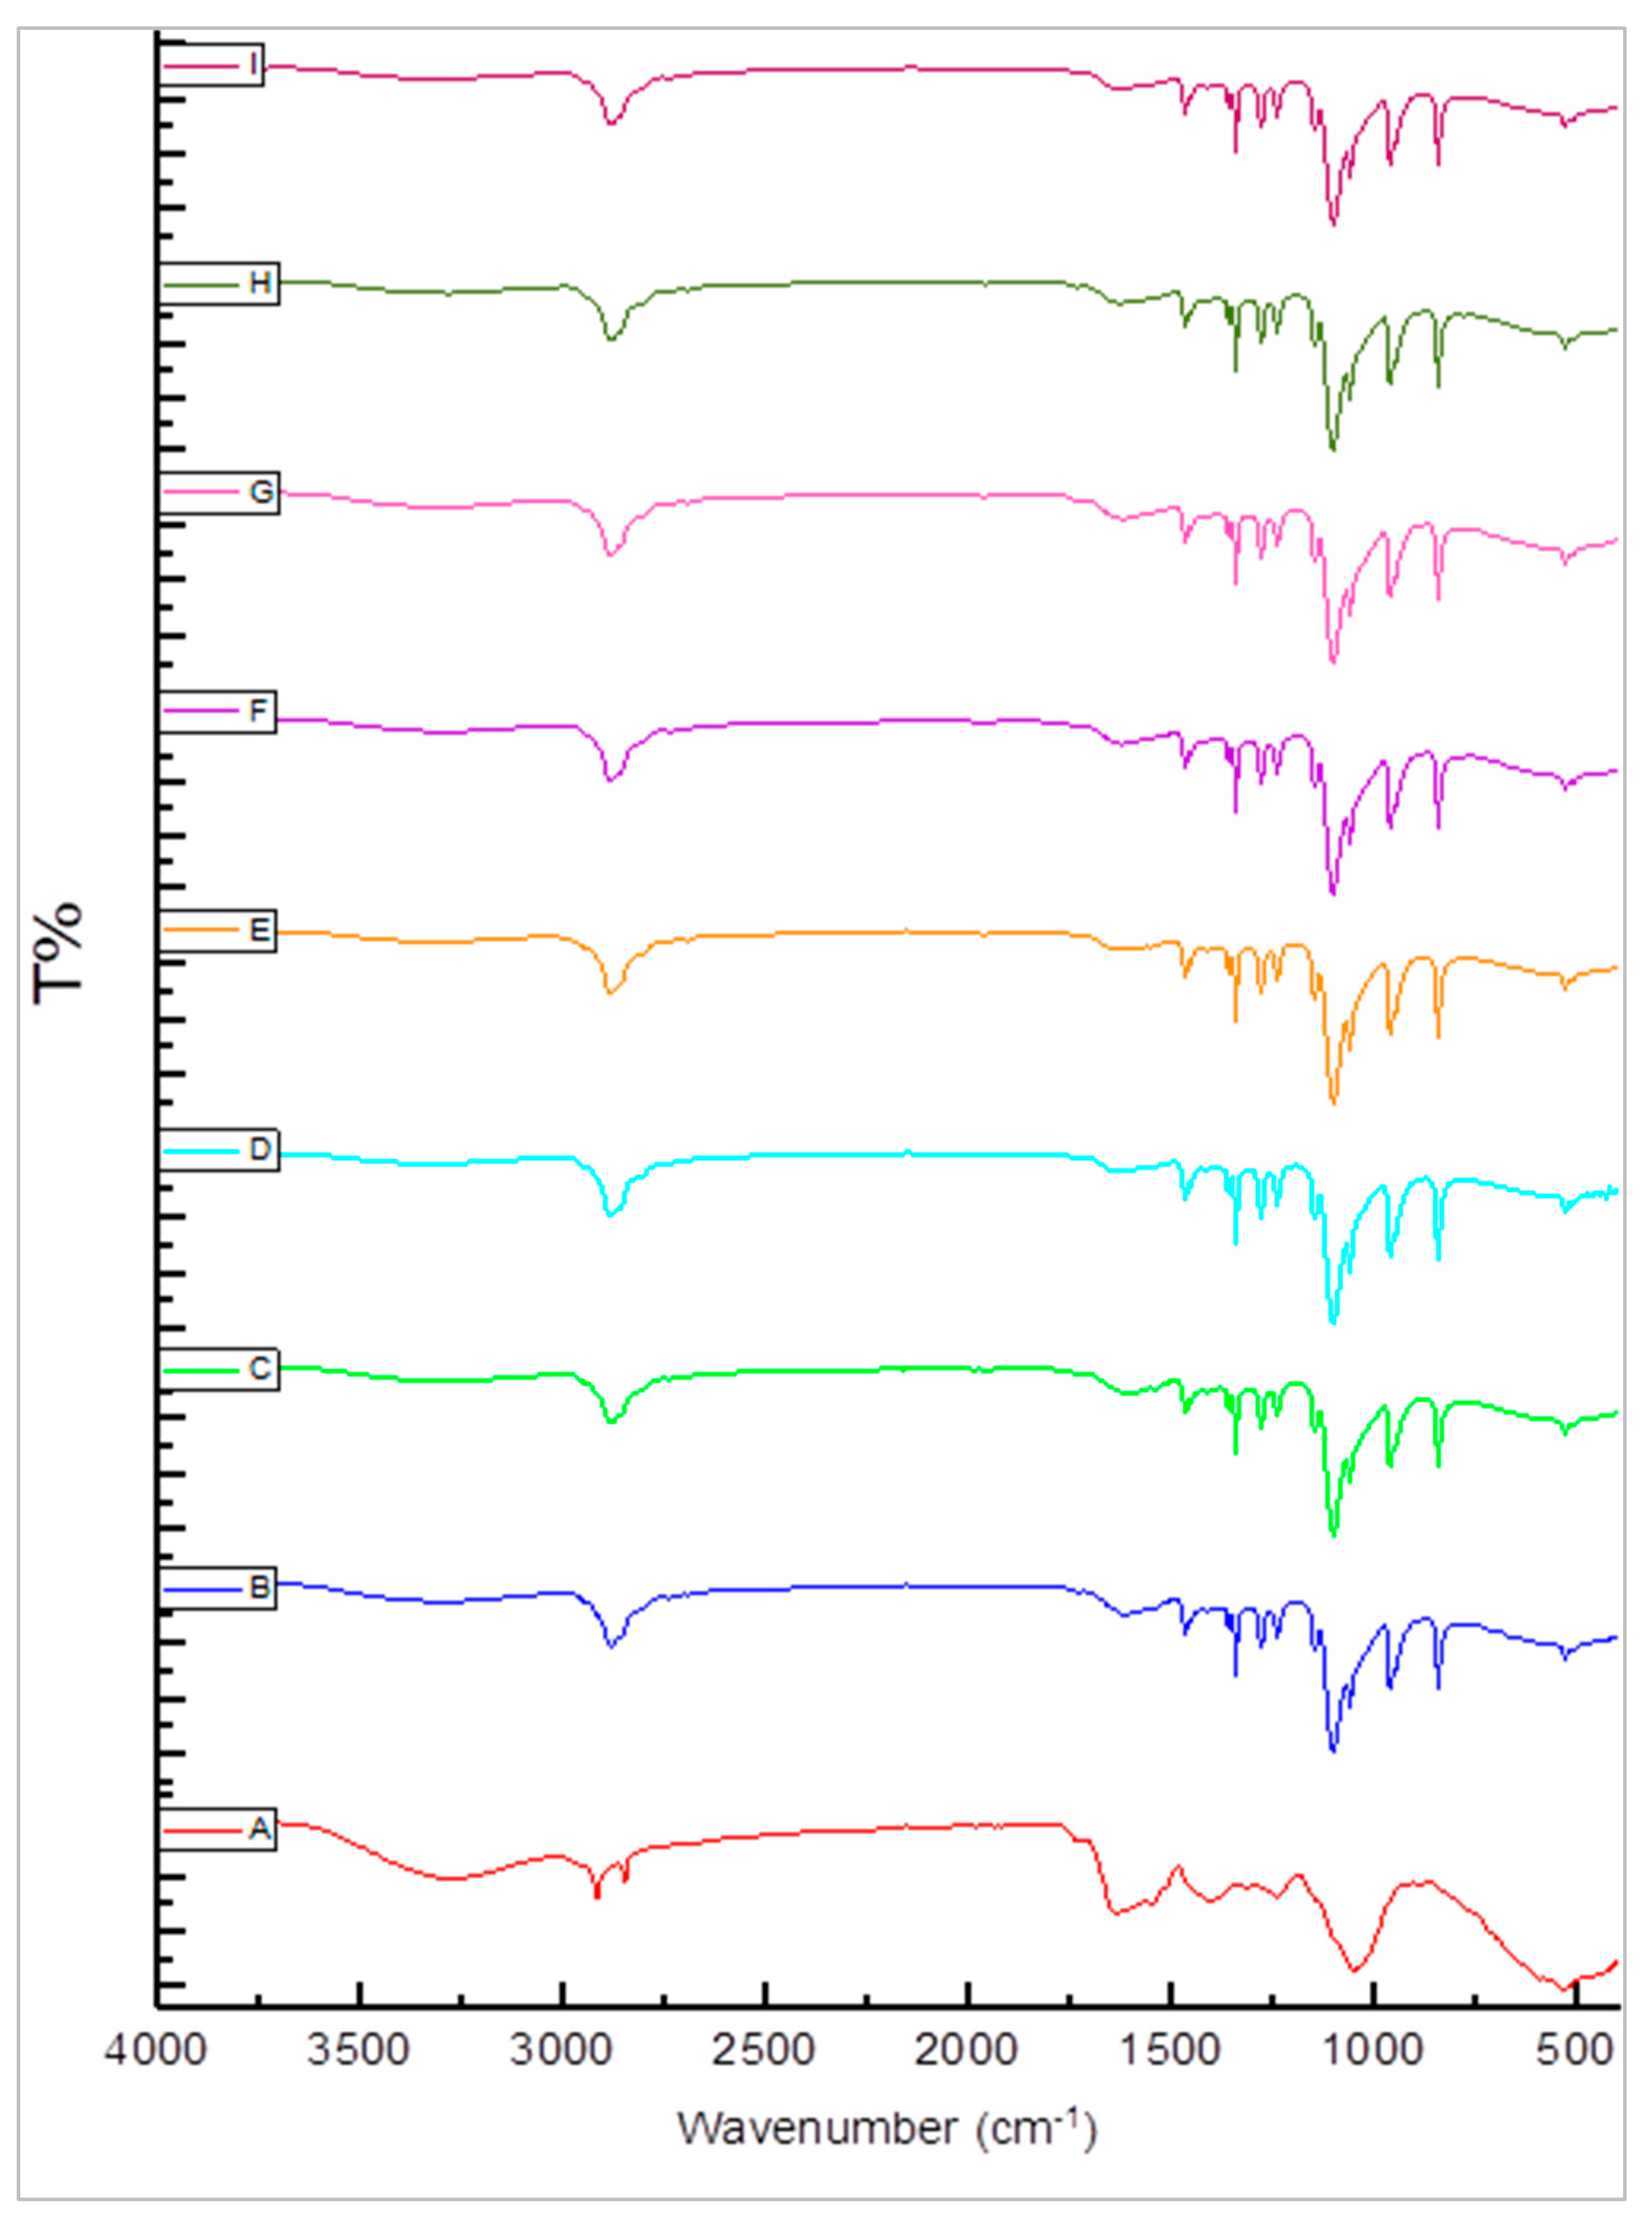
3.4. Fourier Transform Infrared (FTIR) Spectra of MOLP and SDMOLPs

FTIR was performed to investigate further the possibility of interactions between MOLP and PEGs (PEG4000 and PEG600) in the solid state. This technique was equally employed to characterize the functional groups present in the samples. Figure 8 and Table 3 show the infrared (IR) spectra of pure MOLP and SDMOLPs. MOLP spectrum contained many characteristic bands connected with main Moringa oleifera leaf components. The MOLP spectrum exhibited a broad peak centered at 3295.4 cm−1, attributed to the stretching vibration band of O−H. This band is associated with polyphenol structures such as flavonoids, tannins, glycoside derivatives, and fiber. This functional group also appears predominantly in the protein and fatty acid structures in Moringa oleifera leaves (3290 and 3309 cm−1) as reported by Huang et al. [7]. Moreover, since MOLP is a source of protein, the region at 3295.4 cm−1 can also be associated with the N−H functional group. This is evidenced in Figure 9. Other sharp characteristic peaks at 2921.2, 2850.6, 1990, 1640.9, 1553.6, 1420.6, 1316.6, 1246, 1058.9, 530.95, and 468.6 cm−1 were observed. The peaks at 2921.2 cm−1 and 2850.6 cm−1 were attributed to C-H’s asymmetric and symmetric stretching vibrations in aliphatic chains. These methyl groups are usually present in fatty acids. Exact results were reported by Araújo et al. [30] for the Moringa oleifera seed powder, which revealed the methyl groups at 2923 cm−1 and 2852 cm−1, respectively. Moreover, Bello et al. [51] also observed similar functional groups at 2917 and 2849 cm−1 in the FTIR spectrum of raw MOLP. The characteristic peak observed at 1640.9 cm−1 was associated with the primary amide (amide I) of the protein group in MOLP, corresponding to the C=O carbonyl asymmetric. The amide I band maximum centered at 1640.91 cm−1 indicates that MOLP contains proteins with pronounced α-helix and β-sheet secondary structure. In this band, the C=O vibrations have the predominant role, followed by C−N. There is also some in-plane N−H bending contribution to amide [55] This region also indicates the C=O carbonyl stretching of the ester carbonyl functional group of the triglycerides of fatty acids. This carbonyl group is present in the fatty acids and protein structure of the Moringa oleifera leaves. Moreover, the signals at 1640.9 cm−1 also correspond to C=O bonds of ether, ester, and phenol found in MOLP. These results are in good agreement with the values reported by Bello et al. [51] for the Moringa oleifera leaf powder (1636 cm−1). More so, the characteristic peak around 1553.6 cm−1 marked the secondary amide (amide II) band, showing the N-H group of the protein in Moringa oleifera leaves, corresponding to C=O and N−H bending vibration [7]. The amide III bands were relatively weak and appeared at about 1420.6 and 1316 cm−1. It was associated with N−H plane bending coupled with C−N stretching and C–H and N-H deformation vibrations [55]. These bands also were representatives of C=O asymmetric stretching and the deformation band of aliphatic methylene group CH2.
The band observed at 1246 cm−1 corresponds to the C−O stretching, common in several organic compounds. Due to the high protein content in Moringa oleifera leaves, there might also be a contribution from the amides group’s N−H stretching. The intense characteristic peak observed at 1058.9 cm−1 corresponds to C−O−C bonds of ether, phenol, and ester or related compounds. This band is characteristic of carbohydrates. Tran et al. [55] also reported that the absorption of infrared energy in the 1200 cm−1 to the 900 cm−1 region is due to carbohydrate components. Furthermore, stretching vibrations at around 473–703 cm−1 represent C−H, C=C, and N−H [56]. The peak at 651–535 cm−1, attributed to C−N. Moreover, the absorption band at 651 cm−1 is related to C−C−N bend amines and N−C=O bend amide [57]. The presence of this bend confirms the protein structure in the Moringa leaves. Thus, the components of Moringa oleifera leaf powder could be aliphatic or aromatic. It may therefore be inferred that aliphatic or aromatic alcohols, phenols, amine, ketones, esters, and some nitrogen-containing compounds are the constituents of the leaf of Moringa oleifera. The FTIR results obtained in this study for MOLP were per those reported in the literature [7].
FTIR spectroscopy of PEG4000 and PEG6000 (spectra not reported) indicated significant vibrations, which included the broadband at 3425 cm−1 which was due to O−H stretching, aliphatic C−H stretching at 2875 cm−1, C−O at 1100 cm−1 and 960 cm−1, and O−H primary or secondary, OH in-plane bending or stretching at 1341 cm−1. These results are in good agreement with the previously recorded spectrum or values for the polymer [58].
Solid dispersions prepared by freeze-drying, melting, solvent evaporation, and microwave methods (Figure 10) resulted in clear band shifts and increased peak intensity. The appearance of broadband at 3413 cm−1 and 3416 cm−1 in MOLP−PEG4000 and MOLP-PEG6000 solid dispersions belongs to stretching vibration of a phenolic hydroxyl group (O−H) which represents hydrogen bonding between MOLP and carriers. Strong hydrogen bonding occurs between the amide (NH2) functional group of MOLP and the ether group (−O−) of the PEG polymer, depicted in Figure 10. Another hydrogen bonding interaction occurs between NH2 (MOLP) and O−H (PEG6000). Hydrogen bonds are essential in solid dispersions because they can reduce molecular mobility, depress the driving force of crystallization, and thus enhance the stability and solubility of the solid dispersion compared to pure MOLP. Kumavat et al. [59] reported similar results (intermolecular hydrogen bonding) for Curcumin and PEGs (PEG4000 and PEG6000) solid dispersions. Guedes et al. [60] also reported the same findings for Imidazolidinedione and PEG000 solid dispersions. In pure MOLP (3287 cm−1), the O−H peak position was greatly shifted to 3413 cm−1 and 3416 cm−1 in MOLP−PEG4000 and MOLP−PEG6000 solid dispersions, respectively. This indicated an intermolecular interaction between MOLP and PEG, which may be from Van der Waal interactions, hydrogen bonding (through O−H and N−H groups). Moreover, when comparing the solid dispersions, the redshift of the O−H spectral peak in MOLP−PEG6000 solid dispersion was greater than MOLP−PEG4000. This may be due to the increase of the PEG molecular weight [43]. The spectral peak observed at 2992 cm−1 (C-H) in pure MOLP disappeared in the spectral analysis of solid dispersions, suggesting that binding occurred between MOLP−PEG (through hydrogen bonding). Whereas the peak at 2853 cm−1 in pure MOLP attributed to the symmetric C−H group shifted to 2892 cm−1 (higher wavenumber), indicating hydrogen bonding between ether (−O−) group in PEG and methyl (C−H) group in MOLP, as shown in Figure 9. The spectral peaks at 1641, 1541, 1237, 1064, 668 cm−1, assigned to C=O and N-H, primary amide group, secondary amine group, symmetric bending of C−O, C−H bending, and C−N, respectively, all shifted to higher wavenumbers. In addition to peak shifts of the primary and secondary amide groups, the peak intensity of these peaks was reduced. These changes prove that MOLP and PEG interacted via hydrogen bonds through their N−H and O−H functional groups. When mixed with PEG carriers, significant shifts in the position of characteristic peaks of the MOLP indicated compatibility between the two components. Therefore, strong intermolecular interactions via hydrogen bonding are important in solid dispersions. They may help avoid thermal degradation of ingredients and improve solid dispersions’ miscibility and physical stability. The region for aromatics (900–530 cm−1) of MOLP displayed a marked increase in intensity, suggesting van der Waals-type interactions in solid dispersions. Results obtained in this study are in agreement with the XRD, DSC, and TGA studies.

4. Conclusions

The novel solid dispersions of MOLP prepared by freeze-drying, melting, solvent evaporation, and microwave irradiation methods using PEGs (4000 and 6000) hydrophilic carriers were more thermally stable than pure MOLP, sugesting that the PEGs conferred greater stability to the solid dispersions. Moreover, the solid dispersions were partially amorphous. The solid dispersions’ FTIR spectra revealed the formation of MOLP−PEG intermolecular interactions via hydrogen bonding between MOLP hydroxyl (O−H) or amine (N−H) functional groups and PEG O-H and −O− ether functional groups. These strong intermolecular interactions may aid in the prevention of thermal degradation of ingredients and the improvement of miscibility and physical stability of solid dispersion. Therefore, it is hoped that the novel solid dispersions of MOLP with improved solubility and good thermal stability would be a promising solution to broaden the application of MOLP in functional foods and beverages.

Author Contributions

Conceptualization, V.A.J.; Methodogy, V.A.J. and N.N.T.; Conducted the experiment, N.N.T.; Data Analyses and Interpretation, V.A.J.; Resources, V.A.J.; Writing-Original Draft Preparation, N.N.T.; Writing-Review & Editing, V.A.J.; Visualization, N.N.T.; Supervision, V.A.J. All authors have read and agreed to the published version of the manuscript.

Funding

This research received no external funding.

Institutional Review Board Statement

Not applicable.

Informed Consent Statement

Not applicable.

Data Availability Statement

There is no data outside that reported in this article.

Acknowledgments

This research was funded by the Cape Peninsula University of Technology Vice Chancellor’s Prestigious Achievers Award Scholarship 2021. The authors acknowledge the Cape Peninsula University of Technology research funding for financial support.

Conflicts of Interest

The authors declare no conflict of interest.

References

  1. Zhu, Q.; Harris, M.T.; Taylor, L.S. Modification of crystallization behavior in drug/polyethylene glycol solid dispersions. Mol. Pharm. 2012, 9, 546–553. [Google Scholar] [CrossRef] [PubMed]
  2. Lan, Y.; Xu, M.; Ohm, J.B.; Chen, B.; Rao, J. Solid dispersion-based spray-drying improves solubility and mitigates beany flavour of pea protein isolate. Food Chem. 2019, 278, 665–673. [Google Scholar] [CrossRef] [PubMed]
  3. Zawar, L.; Bari, S. Microwave Induced Solid Dispersion as a Novel Technique for Enhancing Dissolution Rate of Repaglinide. Adv. Pharmacol. Pharm. 2013, 1, 95–101. [Google Scholar] [CrossRef]
  4. Alshehri, S.; Imam, S.S.; Altamimi, M.A.; Hussain, A.; Shakeel, F.; Elzayat, E.; Mohsin, K.; Ibrahim, M.; Alanazi, F. Enhanced Dissolution of Luteolin by Solid Dispersion Prepared by Different Methods: Physicochemical Characterization and Antioxidant Activity. ACS Omega 2020, 5, 6461–6471. [Google Scholar] [CrossRef] [Green Version]
  5. Ishimoto, K.; Miki, S.; Ohno, A.; Nakamura, Y.; Otani, S.; Nakamura, M.; Nakagawa, S. β-Carotene solid dispersion prepared by hot-melt technology improves its solubility in water. J. Food Sci. Technol. 2019, 56, 3540–3546. [Google Scholar] [CrossRef]
  6. Weerapol, Y.; Tubtimsri, S.; Jansakul, C.; Sriamornsak, P. Improved dissolution of Kaempferia parviflora extract for oral administration by preparing solid dispersion via solvent evaporation. Asian J. Pharm. Sci. 2017, 12, 124–133. [Google Scholar] [CrossRef]
  7. Huang, X.; Liang, K.H.; Liu, Q.; Qiu, J.; Wang, J.; Zhu, H. Superfine grinding affects physicochemical, thermal and structural properties of Moringa Oleifera leaf powders. Ind. Crops Prod. 2020, 151, 112472. [Google Scholar] [CrossRef]
  8. Bolourchian, N.; Mahboobian, M.M.; Dadashzadeh, S. The effect of PEG molecular weights on dissolution behavior of simvastatin in solid dispersions. Iran. J. Pharm. Res. 2013, 12, 9–18. [Google Scholar]
  9. Ma, X.; Williams, R.O. Characterization of amorphous solid dispersions: An update. J. Drug Deliv. Sci. Technol. 2019, 50, 113–124. [Google Scholar] [CrossRef]
  10. Janssens, S.; Van den Mooter, G. Review: Physical chemistry of solid dispersions. J. Pharm. Pharmacol. 2009, 61, 1571–1586. [Google Scholar] [CrossRef]
  11. Recharla, N.; Riaz, M.; Ko, S.; Park, S. Novel technologies to enhance solubility of food-derived bioactive compounds: A review. J. Funct. Foods 2017, 39, 63–73. [Google Scholar] [CrossRef]
  12. Hassouna, F.; Abo El Dahab, M.; Fulem, M.; De Lima Haiek, A.; Laachachi, A.; Kopecký, D.; Šoóš, M. Multi-scale analysis of amorphous solid dispersions prepared by freeze drying of ibuprofen loaded acrylic polymer nanoparticles. J. Drug Deliv. Sci. Technol. 2019, 53, 101182. [Google Scholar] [CrossRef]
  13. Zhao, C.; Cheng, H.; Jiang, P.; Yao, Y.; Han, J. Preparation of lutein-loaded particles for improving solubility and stability by Polyvinylpyrrolidone (PVP) as an emulsion-stabilizer. Food Chem. 2014, 156, 123–128. [Google Scholar] [CrossRef] [PubMed]
  14. Alshehri, S.; Shakeel, F.; Ibrahim, M.; Elzayat, E.; Altamimi, M.; Shazly, G.; Mohsin, K.; Alkholief, M.; Alsulays, B.; Alshetaili, A.; et al. Influence of the microwave technology on solid dispersions of mefenamic acid and flufenamic acid. PLoS ONE 2017, 12, e0182011. [Google Scholar] [CrossRef] [Green Version]
  15. Oliete, B.; Potin, F.; Cases, E.; Saurel, R. Microfluidization as Homogenization Technique in Pea Globulin-Based Emulsions. Food Bioprocess Technol. 2019, 877–882. [Google Scholar] [CrossRef]
  16. Delgado, A.Y.C.; Velásquez, H.J.C.; Molina, D.A.R. Thermal and thermodynamic characterization of a dye powder from liquid turmeric extracts by spray drying. Rev. Fac. Nac. Agron. Medellin 2016, 69, 7845–7854. [Google Scholar] [CrossRef]
  17. Sharma, V. A Review on Characterization of Solid Dispersion. Int. J. Eng. Appl. Sci. Technol. 2019, 4, 127–128. [Google Scholar] [CrossRef]
  18. Pang, S.; Ma, C.; Zhang, N.; He, L. Investigation of the solubility enhancement mechanism of rebaudioside D using a solid dispersion technique with potassium sorbate as a carrier. Food Chem. 2015, 174, 564–570. [Google Scholar] [CrossRef] [PubMed]
  19. Raj, A.L.; Kumar, Y.S. Preparation and Evaluation of Solid Dispersion of Nebivolol Using Solvent Evaporation Method. Int. J. Pharm. Sci. Drug Res. 2018, 10, 322–328. [Google Scholar] [CrossRef]
  20. da Silva, K.M.A.; de Lima Ramos Júnior, F.J.; Júnior, J.V.C.; Brandão, D.O.; Lins, T.B.; Macêdo, R.O.; de Souza, F.S. Characterization of solid dispersions of a powerful statin using thermoanalytical techniques. J. Therm. Anal. Calorim. 2019, 138, 3701–3714. [Google Scholar] [CrossRef]
  21. Enose, A.A.; Dasan, P.K.; Sivaramakrishnan, H.; Shah, S.M. Formulation and Characterization of Solid Dispersion Prepared by Hot Melt Mixing: A Fast Screening Approach for Polymer Selection. J. Pharm. 2014, 2014, 105382. [Google Scholar] [CrossRef]
  22. Fitriani, L.; Haqi, A.; Zaini, E. Preparation and characterization of solid dispersion freeze-dried efavirenz—Polyvinylpyrrolidone K-30. J. Adv. Pharm. Technol. Res. 2016, 7, 105–109. [Google Scholar] [CrossRef] [PubMed]
  23. Mogal, S.A.; Gurjar, P.N.; Yamgar, D.S.; Kamod, A.C. Solid dispersion technique for improving solubility of some poorly soluble drugs. Der Pharm. Lett. 2012, 4, 1574–1586. [Google Scholar]
  24. Khatri, P.; Shah, M.K.; Patel, N.; Jain, S.; Vora, N.; Lin, S. Preparation and characterization of pyrimethamine solid dispersions and an evaluation of the physical nature of pyrimethamine in solid dispersions. J. Drug Deliv. Sci. Technol. 2018, 45, 110–123. [Google Scholar] [CrossRef]
  25. Moyo, B.; Masika, P.J.; Hugo, A.; Muchenje, V. Nutritional characterization of Moringa (Moringa oleifera Lam.) leaves. African J. Biotechnol. 2011, 10, 12925–12933. [Google Scholar]
  26. Gopalakrishnan, L.; Doriya, K.; Santhosh, D. Moringa oleifera: A review on nutritive importance and its medicinal application. Food Sci. Hum. Wellness 2016, 5, 49–56. [Google Scholar] [CrossRef] [Green Version]
  27. Ferreira, L.F.; de Oliveira, A.C.S.; de Oliveira Begali, D.; de Sena Neto, A.R.; Martins, M.A.; de Oliveira, J.E.; Borges, S.V.; Yoshida, M.I.; Tonoli, G.H.D.; Dias, M.V. Characterization of cassava starch/soy protein isolate blends obtained by extrusion and thermocompression. Ind. Crops Prod. 2021, 160, 113092. [Google Scholar] [CrossRef]
  28. Fernandes, M.C.; Sellappan, K. Elemental composition and X-ray diffraction studies of strobilanthes species. Indian J. Biochem. Biophys. 2019, 56, 144–149. [Google Scholar]
  29. Fernandes, F.H.A.; De Almeida, V.E.; De Medeiros, F.D.; Da Silva, P.C.D.; Da Simões, M.O.S.; Veras, G.; Medeiros, A.C.D. Evaluation of compatibility between Schinopsis brasiliensis Engler extract and pharmaceutical excipients using analytical techniques associated with chemometric tools. J. Therm. Anal. Calorim. 2016, 123, 2531–2542. [Google Scholar] [CrossRef]
  30. Araújo, C.S.T.; Alves, V.N.; Rezende, H.C.; Almeida, I.L.S.; De Assunção, R.M.N.; Tarley, C.R.T.; Segatelli, M.G.; Coelho, N.M.M. Characterization and use of Moringa oleifera seeds as biosorbent for removing metal ions from aqueous effluents. Water Sci. Technol. 2010, 62, 2198–2203. [Google Scholar] [CrossRef]
  31. Vasa, D.M.; Dalal, N.; Katz, J.M.; Roopwani, R.; Nevrekar, A.; Patel, H.; Buckner, I.S.; Wildfong, P.L.D. Physical characterization of drug:Polymer dispersion behavior in polyethylene glycol 4000 solid dispersions using a suite of complementary analytical techniques. J. Pharm. Sci. 2014, 103, 2911–2923. [Google Scholar] [CrossRef] [Green Version]
  32. Obaidat, R.; Al-taani, B.; Al-quraan, H. Effect of Selected Polymers on Dissolution and Stabilization of Amorphous Form of Meloxicam. Int. J. Pharm. Pharm. Sci. 2017, 9, 33. [Google Scholar] [CrossRef] [Green Version]
  33. Jayaramudu, T.; Raghavendra, G.M.; Varaprasad, K.; Reddy, G.V.S.; Reddy, A.B.; Sudhakar, K.; Sadiku, E.R. Preparation and characterization of poly(ethylene glycol) stabilized nano silver particles by a mechanochemical assisted ball mill process. J. Appl. Polym. Sci. 2016, 133. [Google Scholar] [CrossRef]
  34. Kou, Y.; Wang, S.; Luo, J.; Sun, K.; Zhang, J.; Tan, Z.; Shi, Q. Thermal analysis and heat capacity study of polyethylene glycol (PEG) phase change materials for thermal energy storage applications. J. Chem. Thermodyn. 2019, 128, 259–274. [Google Scholar] [CrossRef]
  35. Krstić, M.; Manić, L.; Martić, N.; Vasiljević, D.; Mračević, S.Đ.; Vukmirović, S.; Rašković, A. Binary polymeric amorphous carvedilol solid dispersions: In vitro and in vivo characterization. Eur. J. Pharm. Sci. Off. J. Eur. Fed. Pharm. Sci. 2020, 150, 105343. [Google Scholar] [CrossRef]
  36. Tran, T.T.D.; Tran, P.H.L. Molecular interactions in solid dispersions of poorly water-soluble drugs. Pharmaceutics 2020, 12, 745. [Google Scholar] [CrossRef]
  37. Patel, R.P.; Patel, D.J.; Bhimani, D.B.; Patel, J.K. Physicochemical characterization and dissolution study of solid dispersions of furosemide with polyethylene glycol 6000 and polyvinylpyrrolidone k30. Dissolution Technol. 2008, 15, 17–25. [Google Scholar] [CrossRef]
  38. Muthu, M.J.; Kavitha, K.; Chitra, K.S.; Nandhineeswari, S. Soluble curcumin prepared by solid dispersion using four different carriers: Phase solubility, molecular modelling and physicochemical characterization. Trop. J. Pharm. Res. 2019, 18, 1581–1588. [Google Scholar]
  39. Jeyakumar, N.; Narayanasamy, B.; Balasubramanian, D.; Viswanathan, K. Characterization and effect of Moringa Oleifera Lam. antioxidant additive on the storage stability of Jatropha biodiesel. Fuel 2020, 281, 118614. [Google Scholar] [CrossRef]
  40. Hugo, F.; Fernandes, A.; Santana, C.; Correia, L.P. Thermal characterization of dried extract of medicinal plant by DSC and analytical techniques. J. Ther. Anal. Calorim. 2013, 113, 443–447. [Google Scholar] [CrossRef]
  41. Dzulhi, S.; Anwar, E.; Nurhayati, T. Formulation, Characterization and In Vitro Skin Penetration of Green tea (Camellia sinensis L.) Leaves Extract-Loaded Solid Lipid Nanoparticles. J. Appl. Pharm. Sci. 2018, 8, 57–62. [Google Scholar] [CrossRef] [Green Version]
  42. Pandit, A.P.; Joshi, S.R.; Dalal, P.S.; Patole, V.C. Curcumin as a permeability enhancer enhanced the antihyperlipidemic activity of dietary green tea extract. BMC Complementary Altern. Med. 2019, 1, 129. [Google Scholar] [CrossRef] [Green Version]
  43. El Maghraby, G.M.; Elsergany, R.N. Fast disintegrating tablets of nisoldipine for intra-oral administration. Pharm. Dev. Technol. 2014, 19, 641–650. [Google Scholar] [CrossRef]
  44. Biswal, S.; Sahoo, J.; Murthy, P.N.; Giradkar, R.P.; Avari, J.G. Enhancement of dissolution rate of gliclazide using solid dispersions with polyethylene glycol 6000. AAPS PharmSciTech 2008, 9, 563–570. [Google Scholar] [CrossRef] [PubMed] [Green Version]
  45. Ali, M.A.; Yusof, Y.A.; Chin, N.L.; Ibrahim, M.N. Processing of Moringa leaves as natural source of nutrients by optimization of drying and grinding mechanism. J. Food Process Eng. 2017, 40, e12583. [Google Scholar] [CrossRef]
  46. Valdez-Solana, M.A.; Mejía-García, V.Y.; Téllez-Valencia, A.; García-Arenas, G.; Salas-Pacheco, J.; Alba-Romero, J.J.; Sierra-Campos, E. Nutritional content and elemental and phytochemical analyses of moringa oleifera grown in Mexico. J. Chem. 2015, 2015, 860381. [Google Scholar] [CrossRef] [Green Version]
  47. Mikore, D.; Mulugeta, E. Determination of proximate and mineral compositions of Moringa oleifera and Moringa stenopetala leaves cultivated in Arbaminch Zuria and Konso, Ethiopia. Afr. J. Biotechnol. 2017, 16, 808–818. [Google Scholar] [CrossRef] [Green Version]
  48. Malucelli, L.C.; Massulo, T.; Magalhães, W.L.E.; Stofella, N.C.F.; Vasconcelos, E.C.; Aurélio, M.; Filho, S.C.; Murakami, F.S. Thermal and chemical characterization of Dicksonia sellowiana extract by means of thermal analysis. Rev. Bras. Farmacogn. 2018, 28, 626–630. [Google Scholar] [CrossRef]
  49. Su, B.; Chen, X. Current Status and Potential of Moringa oleifera Leaf as an Alternative Protein Source for Animal Feeds. Front. Vet. Sci. 2020, 7, 53. [Google Scholar] [CrossRef] [PubMed]
  50. Li, L.; Yao, X.; Li, H.; Liu, Z.; Ma, W.; Liang, X. Thermal stability of oxygen-containing functional groups on activated carbon surfaces in a thermal oxidative environment. J. Chem. Eng. Japan 2014, 47, 21–27. [Google Scholar] [CrossRef]
  51. Bello, O.S.; Adegoke, K.A.; Akinyunni, O.O. Preparation and characterization of a novel adsorbent from Moringa oleifera leaf. Appl. Water Sci. 2017, 7, 1295–1305. [Google Scholar] [CrossRef] [Green Version]
  52. Ram, V.R.; Ram, P.N.; Khatri, T.T.; Vyas, S.J.; Dave, P.N. Thermal analytical characteristics by TGA-DTA-DSC analysis of Carica papaya leaves from Kachchh. Int. Lett. Natl. Sci. 2014, 26, 12–20. [Google Scholar] [CrossRef]
  53. Regdon, G.; Korteby, Y. Quantitative and qualitative use of thermal analysis for the investigation of the properties of granules during fluid bed melt granulation. J. Therm. Anal. Calorim. 2018, 133, 619–632. [Google Scholar] [CrossRef] [Green Version]
  54. Zeng, Q.; Ou, L.; Zhao, G.; Cai, P.; Liao, Z.; Dong, W.; Liang, X.; Tao, Y. Preparation and Characterization of PEG4000 Palmitate/PEG8000 Palmitate-Solid Dispersion Containing the Poorly Water-Soluble Drug Andrographolide. Adv. Polym. Technol. 2020, 2020, 4239207. [Google Scholar] [CrossRef] [Green Version]
  55. Tran, T.L.N.; Miranda, A.F.; Mouradov, A.; Adhikari, B. Physicochemical characteristics of protein isolated from thraustochytrid oilcake. Foods 2020, 9, 779. [Google Scholar] [CrossRef]
  56. Matinise, N.; Fuku, X.G.; Kaviyarasu, K.; Mayedwa, N.; Maaza, M. ZnO nanoparticles via Moringa oleifera green synthesis: Physical properties & mechanism of formation. Appl. Surf. Sci. 2017, 406, 339–347. [Google Scholar] [CrossRef]
  57. Girma, T.; Abebaw, A.; Dube, S. Study on adsorption of some common metal ions present in industrial effluents by Moringa stenopetala seed powder Journal of Environmental Chemical Engineering Study on adsorption of some common metal ions present in industrial e ffl uents by Moringa steno. J. Environ. Chem. Eng. 2018, 6, 1378–1389. [Google Scholar] [CrossRef]
  58. Shameli, K.; Bin Ahmad, M.; Jazayeri, S.D.; Sedaghat, S.; Shabanzadeh, P.; Jahangirian, H.; Mahdavi, M.; Abdollahi, Y. Synthesis and characterization of polyethylene glycol mediated silver nanoparticles by the green method. Int. J. Mol. Sci. 2012, 13, 6639–6650. [Google Scholar] [CrossRef] [PubMed] [Green Version]
  59. Kumavat, S.; Chaudhari, Y.; Borole, P.; Shenghani, K.; Badhe, M. Enhancement of Solubility and Dissolution Rate of Curcumin By Solid Dispersion Technique. Int. Res. J. Pharm. 2013, 4, 226–232. [Google Scholar] [CrossRef]
  60. Guedes, F.L.; De Oliveira, B.G.; Hernandes, M.Z.; De Simone, C.A.; Veiga, F.J.B.; De Lima, M.D.C.A.; Pitta, I.R.; Galdino, S.L.; Neto, P.J.R. Solid dispersions of imidazolidinedione by PEG and PVP polymers with potential antischistosomal activities. AAPS PharmSciTech 2011, 12, 401–410. [Google Scholar] [CrossRef] [Green Version]
Figure 1. Powder X-ray diffraction pattern of pure Moringa oleifera leaf powder (MOLP).
Processes 09 02230 g001
Figure 2. Powder X-ray diffraction patterns of (A) PEG4000 and (B) PEG6000.
Processes 09 02230 g002
Figure 3. Powder X-ray diffraction patterns of the solid dispersions of MOLP using PEG as a carrier prepared through (A) freeze-drying method (FD4000 and FD6000), (B) melting method (M4000 and M6000), (C) solvent evaporation (SE4000 and SE6000), and (D) microwave irradiation method (MWI4000 and MWI6000).
Processes 09 02230 g003
Figure 4. DSC thermograms of (A) MOLP (B) PEG4000 (C) PEG6000.
Processes 09 02230 g004aProcesses 09 02230 g004b
Figure 5. DSC thermograms of solid-dispersed MOLP through freeze-drying with PEG6000 (a), PEG4000 (b,c) and microwave (d) using PEG6000; and (e) Solvent evaporation, (f) Freeze-drying, (g) Melting and (h) microwave prepared using PEG4000.
Processes 09 02230 g005aProcesses 09 02230 g005b
Figure 6. Thermogravimetric curves of (A) MOLP, (B) PEG4000, and (C) PEG6000 at a heating rate of 10 °C·min1.
Processes 09 02230 g006
Figure 7. Thermogravimetric curves of MOLP solid dispersions prepared through (A) freeze-drying method (FD4000 and FD6000), (B) melting method (M4000 and M6000), (C) solvent evaporation method (SE4000 and SE6000), and (D) microwave method (MWI4000 and MWI6000).
Processes 09 02230 g007
Figure 8. FTIR spectrum of Moringa oleifera leaf powder (MOLP).
Processes 09 02230 g008
Figure 9. Chemical structures of some of the essential amino acids present in (A) MOLP and (B) general chemical structure of polyethylene glycol showing potential positions of hydrogen bonding between the components.
Processes 09 02230 g009
Figure 10. FTIR spectra of (A) pure Moringa oleifera leaf powder (MOLP), (B) Solid dispersed Moringa oleifera leaf powder (SDMOLP) prepared by the freeze-drying method (MOLP-PEG4000), (C) SDMOLP prepared by the freeze-drying method (MOLP−PEG6000), (D) SDMOLP prepared by the melting method (MOLP−PEG4000), (E) SDMOLP prepared by the melting method (MOLP−PEG6000), (F) SDMOLP prepared by the solvent evaporation (MOLP−PEG4000), (G) SDMOLP prepared by the solvent evaporation method (MOLP−PEG4000), (H) SDMOLP prepared by the microwave method (MOLP-PEG4000), (I) SDMOLP prepared by microwave method (MOLP-PEG4000).
Processes 09 02230 g010
Table 1. Thermal properties of MOLP and solid dispersions at the heating rate of 10 °C min1.
Sample 1PeakTonset (°C)Tpeak (°C)Tendset (°C)∆H (J/g)Tg (°C)
Pure MOLP144.1480.09128.23111.3537.27
2128.23159.35179.975.0176141.97
3185.862102301.54180.69
4230253.7274.483.69238.56
5274.48312.56345.7923.84277.72
Pure PEG4000159.6260.2161.3817922.89
Pure PEG6000159.6263.1064.68193.7460.11
PEG4000
  Freeze-drying153.3557.7860.8094.4564.01
  Melting156.2459.1061.40102.2162.85
  Solvent evaporation153.3260.1962.2275.2254.95
  Microwave irradiation155.1059.4861.29108.4452.84
PEG6000
  Freeze-drying156.4860.8862.5090.2964.86
  Melting157.4360.9362.84104.0764.44
  Solvent evaporation155.7660.9663.0595.5950.34
  Microwave irradiation158.0061.7663.6794.7756.95
1 MOLP: Moringa oleifera leaf powder. PEG: Polyethylene glycol. Tonset: onset temperature. Tp: Peak temperature. Tendset: end set temperature. Tg: Glass transition temperature.
Table 2. Thermogravimetric data showing decomposition behavior of MOLP, PEG6000, and solid dispersions as a function of temperature at a heating rate of 10 °C·min1.
Method 1Treatment 1∆Mass Loss (%) 1Temperature Range (°C)
-Pure MOLP4.9632.21–151.07
44.16151.07–371.86
24.91392.16–531.96
Pure PEG400098.22356.4–483.84
-Pure PEG600096.0330.78–451.32
Freeze-dryingPEG40001.9325.06–130.87
22.19130.87–369.82
59.88369.82–569.78
PEG60001.9325.06–130.87
22.19130.87–369.82
55.02369.82–569.78
MeltingPEG40001.8332.12–131.35
19.49131.35–371.74
60.69371.74–572.01
PEG60001.2724.97–111.48
18.30111.48–371.74
54.38371.74–572.01
Solvent evaporationPEG40002.1032.13–130.27
22.27130.27–369.72
57.66369.27–569.86
PEG60002.1032.13–169.82
22.27169.82–389.85
57.66389.85–489.99
MicrowavePEG40002.2631.97–130.34
22.93130.34–369.77
57.18369.77–569.55
PEG60002.2631.97–130.34
22.93130.34–369.77
57.18369.77–569.55
1 MOLP: Moringa oleifera leaf powder. PEG: Polyethylene. ∆m% = %mend − %minitial represents the percentage of mass loss at each stage.
Table 3. Functional groups from the FTIR spectra of MOLP, PEG, and solid dispersions 1.
MethodCarrierWavenumber (cm−1)
Pure MOLP 3287, 2921.2, 2850.6, 1990, 1640.9, 1553.6, 1420.6, 1316.6, 1246, 1058.9, 530.95, 468.6
Freeze-drying PEG60003380, 2883.59, 1466.43, 1359.72, 1341.67, 1279.27, 1241.01, 1146.89 1100.39, 1059.90, 961.28, 841.58, 528.43
PEG40003315, 2893, 1628, 1467, 1342, 1280, 1241, 1104, 962, 842, 526
MeltingPEG60003361, 2892, 1634, 1467, 1342, 1280, 1241, 1101, 962, 842,531
PEG40003289, 2891, 1634, 1467, 1342, 1241, 1104, 960, 840, 529, 427
Solvent evaporationPEG60003424, 2888, 1634, 1468, 1342, 1280, 1242, 1105, 960, 842, 530
PEG40003288, 2892, 1649, 1467, 1342, 1280, 1242, 1104, 960, 842, 531
MicrowavePEG60003351, 2891, 1652, 1467, 1467, 1342, 1280, 1149, 1103, 962, 842, 526
PEG40003341, 2891, 1628, 1467, 1342, 1280, 1241, 1104, 961, 842, 532
1 SD: solid dispersion; MOLP: Moringa oleifera leaf powder; PEG4000 and PEG6000: Polyethylene glycol 4000 and 6000 molecular weight, respectively.
Publisher’s Note: MDPI stays neutral with regard to jurisdictional claims in published maps and institutional affiliations.

