Abstract
Seasonal thermal stratification has a significant impact on water quality. In this paper, the variation of vertical distribution of ammonia nitrogen in a source water reservoir was studied, on the base of field monitoring data. The dominant factor of the variation in ammonia nitrogen is the anaerobic environment caused by the seasonal thermal stratification, which leads to the degradation of nitrogen-containing organic compounds in the sediments. To determine the rates of ammonia accumulation, an in situ experimental chamber was used. The results showed that, before the formation of thermal stratification in the reservoir, sediments in the bottom of the water have a high tendency to release ammonia; the rates of ammonia accumulation in the overlying water are 40.31–111.41 mg·m−2·d−1. However, thermal stratification causes changes in the physical and chemical properties of the sediment and reduction in the degradability of the nitrogen-containing compound in the sediment. The rates of ammonia accumulation (39.44–44.65 mg·m−2·d−1) after thermal stratification are lower than before. Considering the water pollution hazards caused by seasonal thermal stratification, it is necessary to take corresponding emergency response measures to cope with the possibility of water pollution risk.
1. Introduction
The concentration of ammonium nitrogen in surface, near-bottom and interstitial waters is a good indicator of water-basin pollution and the intensity of mineralization processes of organic matter in sediment and water [1]. The estimation of ammonia fluxes from the sediment to the near-bottom water allows conclusions to be drawn on the intensity of biogeochemical processes at the water-sediment interface [2,3].
As the water supply source of a city, more and more attention has been turned to reservoirs, lakes and other surface waters. In temperate reservoirs over 10 m deep, a three-tiered structure of epilimnion, thermocline and hypolimnion appear in the vertical direction of the water during summer [4,5,6]. The stable stratification impedes the exchange between surface water and the bottom and has remarkable influence on the water’s physical and chemical indicators [7]. Thermal stratification cuts off the reaeration pathway of the bottom water, and under chemical and biological effects, at the same time, the dissolved oxygen (DO) in the water is consumed, leading to the formation of anaerobic environment in the bottom water [8,9]. Studies show that the anaerobic condition is the main reason for the release of pollutants in the sediments [10,11,12]. As anaerobic conditions at the profundal sediment–water interface progress, bottom waters accumulate a range of compounds that exacerbate eutrophication, are toxic to aquatic biota, and limit the potential for potable water use. In the process, ammonia is released from the sediment into the overlaying water.
This study was motivated by the degradation of water quality during the summer because of thermal stratification, as observed in many reservoirs and lakes around the world. The Zhoucun Reservoir (ZCR), an important source water reservoir of Zaozhuang, a medium-sized city east of China, was selected as the study site, because the reservoir experiences dense stratification during the summer months, leading to the deterioration of water quality.
Available research works mainly concentrate on the prediction of the distribution of water temperature, space–time evolution of some pollutants, and their ecological impacts [13,14,15], but there is a lack of field monitoring data on how the thermal stratification affects the water quality. The goal of this research is to ascertain the “build-stability-instability” of thermal stratification and its influence on the distribution of ammonia. The rate of ammonia release from sediments to the overlying water is also calculated. We expect to provide a theoretical basis for the reservoir operation and management as well as the water pollution control of reservoirs.
2. Study Site
ZCR was built in 1959 and began operations in June 1960. It is a provincial key medium-sized reservoir, and it is one of the five local medium-sized reservoirs in Zaozhuang City. The total storage capacity of ZCR is 8.404 × 10⁹ m3. It is an agricultural irrigation, flood control, and power generation reservoir. The catchment area is 121 km2, which is a hilly watershed, with a begonia leaf-shaped basin, and the main stream length is 19.7 km. There are seven small reservoirs and eight ponds in the upstream area of the reservoir, which control a drainage area of about 14.91 km2. In this study, sampling sites were picked at the deepest area of the main reservoir, as the physical and chemical properties of the site more clearly reflect the variation of vertical water quality of the reservoir as is shown in Figure 1.
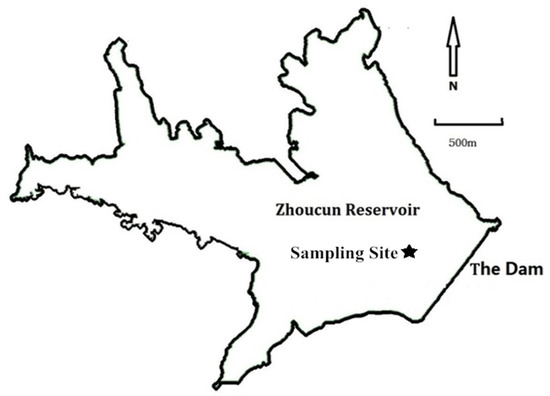
Figure 1.
Bathymetric map of Zhoucun reservoir with location of sampling site.
3. Materials and Methods
In situ water quality monitoring was carried out for a full hydrological year. The sampling frequency was 2–4 times per month: the water quality during the thermal stratification period changed greatly, and the sampling frequency was once a week; the water quality during the mixing period changed little, and the sampling frequency was once every half month. The sampling time was generally selected from 10 to 12 o’clock in the morning on a sunny day. Water samples were obtained with a 1.0 L sterile Van Dorn bottle, at intervals of 2.5 m, from the surface to the bottom (0.2 m above the sediment). Vertical profiles of water temperature, DO, were measured in situ with increments of 0.5 m, using a multiparameter water quality analyzer (Hydro lab DS5, Hach, Loveland, CO, USA). The concentration of ammonia nitrogen was determined using Nessler’s reagent colorimetric method at the circum-neutral pH condition. Sediment samples and their determination reference the work of Cheng Xiangju [16].
To determine the rates of ammonia accumulation, an in situ experimental chamber on the bottom which can control a certain volume of bottom water and maintain the natural conditions of the water-sediment-microbes multi-phase interface was used. The in situ release experiment of sediment pollutants was carried out twice. The first experiment began in February, before the water was stratified, and lasted 80 days. The second experiment began at the end of October and lasted for 60 days after the stratification of the water. The schematic diagram of the in situ reactor and the photos of the experimental operation photos are shown in Figure 2. To take samples, water samples from the in situ reactor are lifted through small pumps at the surface of the water. The pressure regulator is activated to ensure that the water sample in the in situ reactor can be removed smoothly without affecting the continuation of the experiment. A detailed introduction of the composition and operation method of the in situ reactor is referred to in the article published by the author in 2016 [17]. The calculation of the rates of ammonia accumulation references the work of Marc Beutel [18].
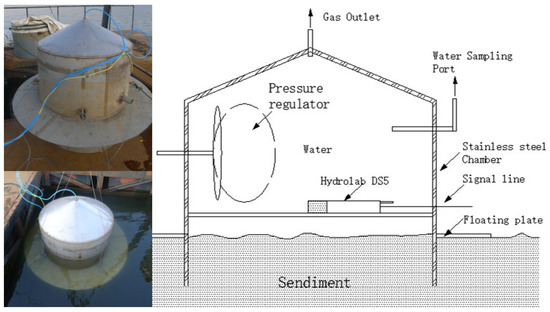
Figure 2.
The schematic diagram of the in situ reactor and the photos of the experimental site.
Microsoft Excel software was used to export and process data; Origin 10.0 software was used for drawing; and SPSS 18.0 software was used for the one-way analysis of variance (one-way ANOVA).
4. Results
4.1. Space–Time Transformation of Thermal Stratification
There are obvious seasonal characteristics to the water temperature variation in the vertical cross section of ZCR. As is shown in Figure 3, the variation of surface water temperature is basically consistent with that of the air temperature but lags slightly behind, and the range of such variation is 3.8–30 °C within a year; the range of the bottom water temperature variation is smaller, usually stabilized within 3.8–12 °C.
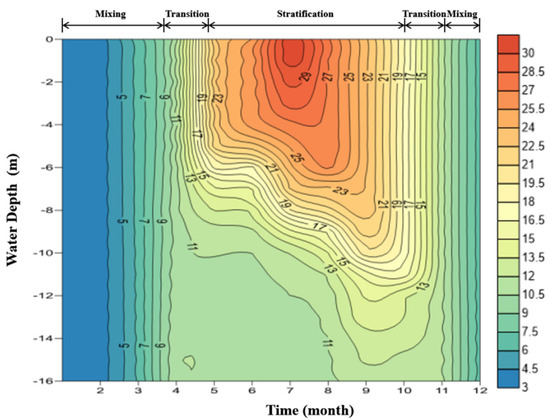
Figure 3.
Profile of temperature and the division of stratified periods of ZCR.
In mid-April each year, the layered structure is not yet formed. A smooth transition appears between the epilimnion and thermocline; the boundary between the two layers cannot be clearly defined. Temperature change is concentrated in the region from the surface to a depth of 10 m, with the water temperature below 10 m stabilized at around 10 °C. In June, a continuous rise in temperature increases the amount of heat received by the water. This leads to a rapid increase in the upper layer water temperature and slow increase in the lower layer water temperature, and a pattern of “three-layered” water temperature distribution is formed gradually. Stratification of the water remains stable until the end of September when the temperature starts to fall. The surface water temperature continues to drop, the water density increases, and the water goes down from top to bottom. During this period, the temperature gradient in the epilimnion layer decreases continuously, the hypolimnion layer becomes compressed, and the depth of the thermocline increases. In October and November, the vertical difference in the water temperature between the upper and lower layers continues to shrink, and the water temperature achieves uniformity in late November.
The existence of the temperature gradient effectively inhibits the vertical heat transfer and reduces the influence of the upper water temperature on the lower layer. However, with the end of stratification, the “bottleneck” blocking heat transfer disappears, and the strong convection accelerates the heat exchange of each layer. At this time, the water temperature of the reservoir is still losing heat with the air temperature drop, which causes the overall cooling of the vertical water after mixing. The water temperature of the reservoir continues to drop throughout the winter, and the minimum water temperature, 3.8 °C, appears in February. With the arrival of the spring warming period, a new round of stratified succession begins.
The definition of the reservoir mixing depth is the thickness of the water layer, where the physical and chemical parameters are consistent. The seasonal variation of the mixing depth indicates the interannual evolution of stratification. It is clear from Figure 3 that the stratification process of ZCR can be divided into three periods: the stable stratification period, the transitional period, and the isothermal mixing period. From June to September, the water in the reservoir is divided into three distinct layers from top to bottom, and the mixing depth does not exceed 5 m; thus, this is a stable stratification period. From November to March of the next year, the water temperature of the reservoir is consistent from top to bottom, and the mixing depth extends to over 16 m; thus, this is an isothermal mixing period. All the other months are considered part of the transitional period. During the stratification period and the transitional period, vertical stratification exists in the water body. It is not difficult to see that the stratification period of ZCR lasts for a long time (April to October) and the isothermal mixing period lasts for a short time (November to March of the next year), showing a pattern of single-cycle mixing.
4.2. Variation of Dissolved Oxygen
The variation of vertical DO distribution has obvious seasonal characteristics, and it is closely related to the thermal stratification of water. The profile of DO of ZCR is shown in Figure 4.
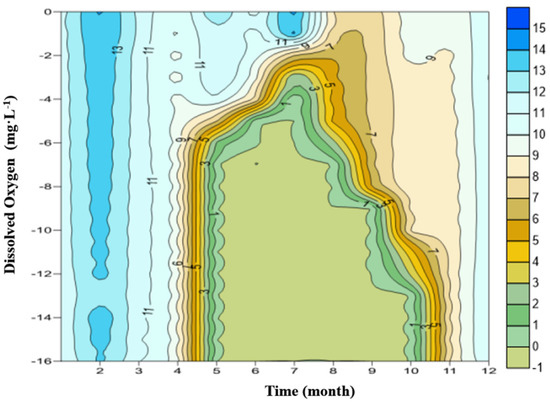
Figure 4.
Profile of dissolved oxygen of ZCR.
According to the division of the water thermal stratification period, April is the transitional period when the temperature stratification gradually formed. It is also the period when the vertical distribution of DO starts to change, with high DO concentration on the top and low DO concentration on the bottom. However, due to the vertical mixing reaeration of both the upper and lower waters in the winter, the overall concentration of DO is higher. Even at the bottom, the DO concentration is usually from 2 mg·L−1 to 4.0 mg·L−1. There are no anoxic or anaerobic zones in the whole reservoir.
In June, the reservoir water forms a stable stratification. The vertical distribution of dissolved oxygen also shows an obvious gradient: in the surface water, the DO concentration is 8–9 mg·L−1, close to or at saturation. As the water depth increases, the DO concentration decreases, especially in the thermocline, and the DO decline rate is extremely fast. At the hypolimnion, the concentration of DO is already reduced to about 0 mg·L−1. The hypolimnion’s anaerobic environment lasts for more than six months. Figure 3 shows clearly that the concentration of DO at the hypolimnion decreases continuously, from March to May. It is 11.0 mg·L−1 in March, and only 0.1 mg·L−1 at the end of May, which indicates a completely anaerobic environment from then on. After November, water stratification disappears, and the cold, oxygen-rich water from the surface replenishment moves to the bottom. As a result, the concentration of DO at the hypolimnion increases sharply.
During the winter, from December to February of the next year, the reservoir is in a mixing state. In the meantime, because the water temperature is lower and the saturation concentration of DO in cold water is higher than that in warm water, the concentration of DO reaches the highest value throughout the year (>10 mg·L−1). Thereafter, as the water is stratified again, the DO concentration decreases again and undergoes a new cycle.
4.3. Variation of Ammonia Nitrogen
Pollution caused by ammonia is an important problem for ZCR. Ammonia in raw water piped to the water plant reaches 1.6 mg·L−1, and it is difficult to remove ammonia by conventional water treatment technology for water plants in China. This causes a lot of trouble for water treatment plants and increases the cost of drinking water.
Figure 5 describe the variation of the vertical distribution of ammonia in ZCR every month. From January to March, there is no obvious difference in concentration of ammonia between the upper water and lower water, with the concentrations at the lowest levels throughout the year; the concentrations of ammonia are 0–0.5 mg·L−1. The concentration of ammonia in the water begins to increase from May, and this process is synchronized with the formation of anaerobic zones in the hypolimnion.
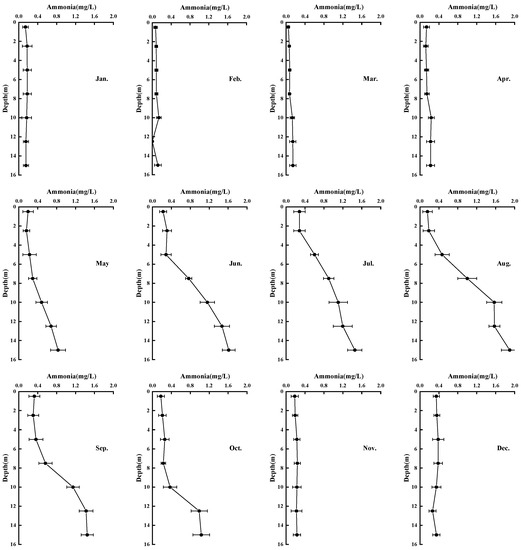
Figure 5.
Variation of the vertical distribution of ammonia in ZCR.
The concentration of ammonia in the hypolimnion reaches the peak level in August (1.85 mg·L−1). At this time, the vertical distribution of ammonia becomes obviously stratified. The concentration of ammonia in the surface water is much lower than that in the hypolimnion. The maximum value of the surface water ammonia concentration occurs in December when the thermal stratification has disappeared (0.36 mg·L−1).
4.4. Rates of Ammonia Accumulation
Sediment is the source of such nutrients as ammonia, which is released to the overlying water under certain conditions. In order to investigate the contribution of sediment on the concentration of ammonia in the water, we monitor the process of sediments releasing ammonia to the overlying water via an in situ reactor before and after stable stratification. The concentration curve of ammonia in the in situ reactor before and after stratification can be seen in Figure 6. The accumulation rates of ammonia in the in situ experimental reactor are listed in Table 1.
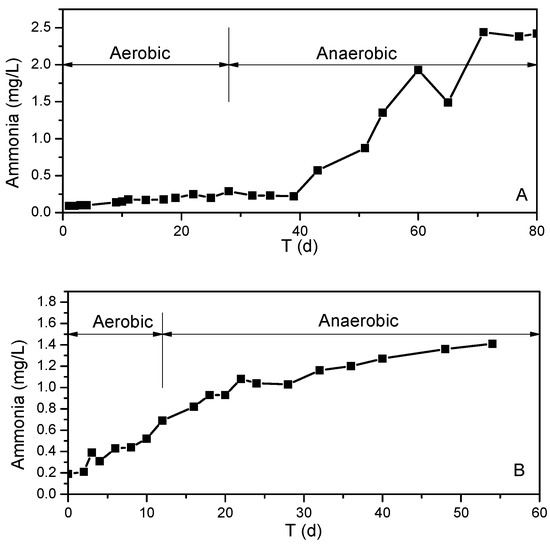
Figure 6.
Ammonia nitrogen in the overlying water of in situ experimental reactor over time. (A) Before stratification. (B) After stratification.

Table 1.
Accumulation rates of ammonia in the in situ experimental chambers.
Evidently, the change in concentration of ammonia in two in situ experiments is different. In the first experiment, before stratification in water, the dissolved oxygen in the overlying water drops to zero on day 28, indicating that the reactor is in an anaerobic state. There is only a small change in ammonia concentration over the first 40 days, with 0.08–0.25 mg·L−1. After the reactor is anaerobic for 12 days, the concentration of ammonia nitrogen in the overlying water begins to rise sharply, with an accumulation rate of 74.58 mg·m−2·d−1 (Table 1). After 70 days of the experiment, the concentration of ammonia in the overlying water reaches 2.52 mg·L−1 and does not increase until the end of the experiment.
The second experiment, after stratification, is very different from the first. DO drops at a faster rate, and it takes only 12 days for the reactor to reach anaerobic status. The water is still aerobic at the initial stage, while ammonia accumulates at a rate of 44.80 mg·m−2·d−1. The concentration of ammonia increases from 0.19 mg·L−1 to 0.69 mg·L−1. After 12 days of the experiment, when the DO is reduced to zero, the accumulation rate of ammonia is basically constant (41.92 mg·m−2·d−1). From the 22nd day of the experiment, the release of ammonia reaches equilibrium, and the ammonia concentration in the reactor is increased slightly, from 1.08 mg·L−1 to 1.42 mg·L−1.
5. Discussion
5.1. Effect of Thermal Stratification on Dissolved Oxygen and Ammonia
The sources of DO in water mainly include the following three aspects: (1) oxygen transfer from air to water, (2) oxygen generated by the photosynthesis of aquatic plants, and (3) dissolved oxygen carried by upstream runoff [19,20,21]. The first two sources can increase dissolved oxygen in the surface water, and upstream runoff can act on middle and lower waters. The water area of ZCR is large, and the inflow water first mixes in the shallow water area before entering the main reservoir area. As the shallow water enters the main reservoir area, the water temperature is close to the surface water. Therefore, the inflow depth of upstream water into the main reservoir is above the thermocline, which is unable to effectively replenish oxygen to the hypolimnion.
Therefore, DO of the hypolimnion water only relies on the supplement of the convection exchange with the upper water. During the mixing state, the good convection exchange in the water always makes the bottom water maintain a high level of DO. However, during the stratification time, there are two reasons that lead to the anaerobic status of the water: on the one hand, the existence of the thermocline layer stops the oxygen transfer of the bottom water with the surface water; on the other hand, sediments at the bottom of the reservoir decompose and are released through both biological and chemical processes, consuming the oxygen in the water and reducing the concentration of DO. During the thermal stratification period, the average concentration of DO in the aquitard layer declines linearly with time. After the isothermal mixing period starts, the DO concentration at the bottom is soon restored to a higher level. In addition, the release of sediments is closely related to water temperature. It is generally thought that higher temperature is conducive to the decomposition and release of pollutants through biological processes. The data from monitoring the sharp decline in the concentration of DO at the bottom water during the spring are also consistent with the theory of sediment release.
It is generally believed that hydrolysis enzymes break down nitrogen-containing organic compounds into low molecular weight components, such as amino acids, peptides, and nucleic acids, in the process of ammoniation taking place in the water–sediment interface [22,23]. These low molecular weight substances are quickly degraded by bacteria in the water and sediments, together with the release of organic acids and ammonia. In addition, the increase in ammonia nitrogen may be caused by nitrate denitrification. However, the increase in the ammonia nitrogen concentration caused by denitrification only accounts for a small part. Comparing Figure 6 with Figure 7, it can be seen that nitrate in the in situ reactor is exhausted, but the ammonia concentration continues to rise. This indicates that a large part of ammonia in the overlying water comes from the release process of sediment.
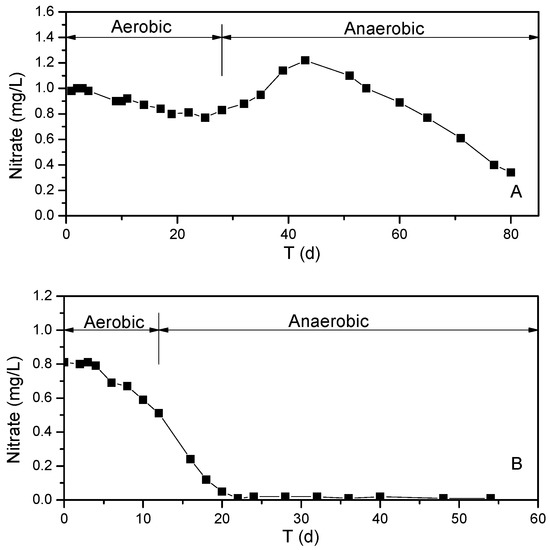
Figure 7.
Nitrate nitrogen in the overlying water of in situ experimental reactor over time. (A) Before stratification. (B) After stratification.
The intensification of thermal stratification gradually lowers the DO concentration in the bottom water and ammonia release in the sediments, resulting in the increasing concentration of underlying ammonia. At the same time, the ammonia concentration in the surface water does not have a noticeable shift. As is shown in Table 2, the rate of change in ammonia concentration in the surface, middle and bottom waters per month shows that the rate of annual surficial ammonia changes scarcely, experiences positive and negative fluctuations and soars to the most remarkable value in November. The main reason is that the bottom ammonia is brought to surface water after stratification disappears. In the transitional period of thermal stratification formation, the middle ammonia concentration has a dramatic alteration and rises strikingly in May, followed by a notable fall in October. Variation of the underlying ammonia concentration has the greatest relevance with thermal stratification formation and destruction. In the stratification stage, the ammonia concentration in the bottom layer is increased, while in the mixing stage, it is decreased.
Table 2.
Variation of concentration of ammonia in every month.
In summary, thermal stratification affects the variability of ammonia concentration by influencing the distribution of DO in water. The anaerobic environment in the bottom of the reservoir is suitable for sediments to release ammonia to the overlying water, which can lead to a boom in the concentration of bottom ammonia. Meanwhile, due to the presence of “thermocline”, the way that the high concentration of ammonia nitrogen diffuses from the bottom to the surface water is cut off so that the distribution of ammonia in the water presents as low in the top and high in the bottom. During the period of thermal stratification, the reduction in the redox potential next to the sediments pushes the nonstop transformation of ammonia into interstitial water with the seasonal emergence of the anaerobic state in the bottom of the reservoir, which gives rise to increasing ammonia in the bottom water as well as its diffusion from the overlying water to the middle layer but has a minor impact on the surface water. After isothermal mixing, the whole reservoir is under an aerobic condition, and the release of ammonia tends to stagnate. The high concentration of contaminants in the bottom is carried into the upper layer, and gradually presents a balanced state during the mixing process. In addition, the maximum concentration of ammonia in the surface water occurs after the mixing of the reservoir water.
5.2. Effect of Thermal Stratification on Rates of Ammonia Accumulation
In terms of research on the rule of ammonia release in sediments, the current research can be divided into two categories in accordance with different experimental methods: simulation experiment in the laboratory and in situ reaction. Comparatively speaking, laboratorial simulation experiments with simplification, feasibility and controllability are preferred by the majority of researchers [24]. However, in situ experiments can help us obtain data that are closer to the real environment in spite of the complicated operation. The present research results can be summarized as follows: since ammonia is an easily oxidized substance, the level of DO in the overlying water is the key factor to control nitrogen release in the sediments. Ammonia release in the sediment is from reducing assimilation produced by biological denitrification under an anaerobic condition [25,26].
Particularly, two points need to be paid attention in our in situ experiments. The first one is that the accumulation rate of ammonia before thermal stratification is greater than that after thermal stratification (Table 1), owing to the fact that ammonia release is exposed to multiple elements, including temperature, microbial activity, nitrogen compound formation, nitrification, denitrification, etc. A possible reason is that the anaerobic environment around the sediment lessens the absolute value of degradable nitrogen-containing organic compounds during thermal stratification. Relevant studies confirm that SOEF-Nitrogen extracted by strong oxidants, is the dominant one of convertible nitrogens and is the largest organic nitrogen compound contributing to the nitrogen cycle. After the 55 days’ anaerobic releasing process, the content of SOEF-N in the sediment is decreased by 53.67% [27].
The second issue to illustrate is that the accumulation of ammonia does not only emerge in the anaerobic phase before stratification; instead, it is found in the aerobic phase after thermal stratification. On the one hand, higher concentration of ammonia can be seen in sediment pore water after the end of thermal stratification (Table 3). Ammonia in sediment pore water diffuses into the overlying water, driven by the concentration gradient. During thermal stratification, changes in the physical and chemical properties of the sediment are more beneficial for diffusion [28]. On the other hand, low rates of mixing and turbulence at the sediment–water interface can result in the formation of a thick diffusive boundary layer that impedes the diffusion of oxygen into sediments. Thus, low turbulence in the in situ experimental chambers can enhance conditions that lead to the apparent contradiction of an anaerobic sediment–water interface with an oxygenated water column.
Table 3.
Concentration of ammonia in pore water of the sediments.
5.3. The Destruction of the Stratified Structure
During the late phase of thermal stratification, when its stability weakens, vertical water exchange occurs and pollutants in the lower water diffuse into the upper water. Although the process is relatively short, its impact on the water environment should not be ignored.
The testing results of water quality in the mixing process show that the DO concentration in reservoir water increases 7 mg·L−1 or more, with the water quality appearing to be improving. However, during the same period, the surface ammonia concentration is increased 2–3 times on average and peaks at 0.2 mg·L−1. This detail reflects the effect of the cyclical “mutations” in water quality brought by the destruction of the stratified structure. Studies by Wang Yuchun et al. conclude that the seasonal deterioration in water quality, which has happened frequently in recent years, is caused by the imbalance between oxygen consumption and reaeration in the vertical exchange process and by the instability in the water stratification caused by a sudden temperature drop during the fall [29].
As shown in Table 3, the concentrations of pollutants in the sediment pore water in ZCR all exceed the control standards by multiple times. Once the load of internal pollution accumulation exceeds the capacity of the water environment, the dilution effect of the water in the reservoir cannot effectively alleviate the pollution, and the risks of sudden pollution caused by seasonal instability in water stratification will sharply increase. If emergency treatment technologies are not adopted, there will be an immeasurable negative impact on the urban water supply [30].
6. Conclusions
The conclusions obtained from this study are as follows.
First, the water stratification process of ZCR can be divided into three periods: the typical thermal stratification period, the transitional period, and the isothermal mixing period. During the typical thermal stratification period, water temperatures at the surface and bottom of the reservoir differ by 20 °C. The temperature difference is so large that the thermocline acts like a wall, blocking the exchange of materials between the surface and bottom layers of the reservoir. As a result, a large area of an anaerobic zone is formed in the hypolimnion.
Second, ammonia decomposed from nitrogen-containing organic matter in the sediment enters into the sediment pore water under the anaerobic condition of hypolimnion, then diffuses into the overlying water.
Third, the effect of the thermal stratification on ammonia release in the sediment is focused on the fact that, in an anaerobic environment during stratification, the biodegradability of nitrogen-containing compounds and the physicochemical properties of sediments are changed, and the concentration of ammonia nitrogen in the interstitial water is increased greatly. As a result, after stratification, the rate at which the sediment releases ammonia nitrogen is reduced, and diffusion is dominant.
Author Contributions
Conceptualization, T.H.; data curation and investigation, J.S.; formal analysis, Y.Y. and L.W.; original draft, J.S. All authors have read and agreed to the published version of the manuscript.
Funding
This research was funded by Natural Science Foundation of Shandong Province, grant number ZR2020QE225 and The National Science and Technology Pillar Program (No. 2012BAC04B02).
Institutional Review Board Statement
Not applicable.
Informed Consent Statement
Not applicable.
Data Availability Statement
The datasets generated and/or analysed during the current study are available from the corresponding author on reasonable request.
Conflicts of Interest
The authors declare no conflict of interest.
References
- Beutel, M.W. Inhibition of ammonia release from anoxic profundal sediments in lakes using hypolimnetic oxygenation. Ecol. Eng. 2006, 28, 271–279. [Google Scholar] [CrossRef]
- He, J.; Deng, W.; Chen, C.; Xu, X.; Wang, S.; Liu, W.; Wu, X. Ammonia nitrogen adsorption and release characteristics of surface sediments in Dianchi Lake, China. Environ. Earth Sci. 2015, 74, 3917–3927. [Google Scholar] [CrossRef]
- Akomeah, E.; Lindenschmidt, K.-E. Seasonal Variation in Sediment Oxygen Demand in a Northern Chained River-Lake System. Water 2017, 9, 254. [Google Scholar] [CrossRef] [Green Version]
- Elçi, Ş. Effects of thermal stratification and mixing on reservoir water quality. Limnology 2008, 9, 135–142. [Google Scholar] [CrossRef] [Green Version]
- Chuo, P.Y.; Ball, J.E.; Fisher, I.H. Thermal stratification in drinking water service reservoirs. Australas. J. Water Resour. 2003, 6, 159–167. [Google Scholar] [CrossRef]
- Balangoda, A. Artificial destratification effects on nitrogen and phosphorus dynamics in a eutrophic impoundment in the northern Great Plains. Environ. Monit. Assess. 2016, 188, 469. [Google Scholar] [CrossRef] [PubMed]
- Beutel, M.; Hannoun, I.; Pasek, J.; Kavanagh, K.B. Evaluation of Hypolimnetic Oxygen Demand in a Large Eutrophic Raw Water Reservoir, San Vicente Reservoir, Calif. J. Environ. Eng. 2007, 133, 130–138. [Google Scholar] [CrossRef]
- Beutel, M.; Dent, S.; Reed, B.; Marshall, P.; Gebremariam, S.; Moore, B.; Cross, B.; Gantzer, P.; Shallenberger, E. Effects of hypolimnetic oxygen addition on mercury bioaccumulation in Twin Lakes, Washington, USA. Sci. Total Environ. 2014, 496, 688–700. [Google Scholar] [CrossRef] [PubMed]
- Li, N.; Huang, T.; Chang, Z.; Li, K. Effects of benthic hydraulics on sediment oxygen demand in a canyon-shaped deep drinking water reservoir: Experimental and modeling study. J. Environ. Sci. 2021, 102, 226–234. [Google Scholar] [CrossRef]
- Beutel, M.W.; Leonard, T.M.; Dent, S.R.; Moore, B.C. Effects of aerobic and anaerobic conditions on P, N, Fe, Mn, and Hg accumulation in waters overlaying profundal sediments of an oligo-mesotrophic lake. Water Res. 2008, 42, 1953–1962. [Google Scholar] [CrossRef] [PubMed]
- Beutel, M.W. Hypolimnetic Anoxia and Sediment Oxygen Demand in California Drinking Water Reservoirs. Lake Reserv. Manag. 2003, 19, 208–221. [Google Scholar] [CrossRef] [Green Version]
- Gantzer, P.A.; Bryant, L.D.; Little, J.C. Effect of hypolimnetic oxygenation on oxygen depletion rates in two water-supply reservoirs. Water Res. 2009, 43, 1700–1710. [Google Scholar] [CrossRef] [PubMed]
- Liu, L.; Liu, D.; Johnson, D.M.; Yi, Z.; Huang, Y. Effects of vertical mixing on phytoplankton blooms in Xiangxi Bay of Three Gorges Reservoir: Implications for management. Water Res. 2012, 46, 2121–2130. [Google Scholar] [CrossRef] [PubMed]
- Gerling, A.B.; Browne, R.G.; Gantzer, P.A.; Mobley, M.H.; Little, J.C.; Carey, C.C. First report of the successful operation of a side stream supersaturation hypolimnetic oxygenation system in a eutrophic, shallow reservoir. Water Res. 2014, 67, 129–143. [Google Scholar] [CrossRef]
- Ma, W.-X.; Huang, T.-L.; Li, X. Study of the application of the water-lifting aerators to improve the water quality of a stratified, eutrophicated reservoir. Ecol. Eng. 2015, 83, 281–290. [Google Scholar] [CrossRef]
- Cheng, X.J.; Guo, Z.R.; Liu, G.; Li, B. Study on flux of nitrogen and phosphorus across the interface of sediment-water and their diffusion areas in seawater at the aquaculture region of Daya Bay. J. Trop. Oceanogr. 2014, 33, 77–84. [Google Scholar]
- Shi, J.-C.; Huang, T.-L.; Wen, G.; Liu, F.; Qiu, X.-P.; Wang, B.-S. The Variation Characteristic of Sulfides and VOSc in a Source Water Reservoir and Its Control Using a Water-Lifting Aerator. Int. J. Environ. Res. Public Health 2016, 13, 427. [Google Scholar] [CrossRef] [Green Version]
- Beutel, M. Dynamics and Control of Nutrient, Metal and Oxygen Fluxes at the Profundal Sediment-Water Interface of Lakes and Reservoirs. Ph.D. Thesis, University of California, Berkeley, CA, USA, 2000. [Google Scholar]
- Humborg, C.; Ittekkot, V.; Cociasu, A.; Bodungen, B.V. Effect of Danube River dam on Black Sea biogeochemistry and ecosystem structure. Nat. Cell Biol. 1997, 386, 385–388. [Google Scholar] [CrossRef]
- Fan, C.W.; Kao, S.J. Effects of climate events driven hydrodynamics on dissolved oxygen in a subtropical deep reservoir in Taiwan. Sci. Total Environ. 2008, 393, 326–332. [Google Scholar] [CrossRef] [PubMed]
- Grenz, C.; Denis, L.; Pringault, O.; Fichez, R. Spatial and seasonal variability of sediment oxygen consumption and nutrient fluxes at the sediment water interface in a sub-tropical lagoon (New Caledonia). Mar. Pollut. Bull. 2010, 61, 399–412. [Google Scholar] [CrossRef]
- Xu, J.R.; Wang, Y.S.; Sun, S. The characteristics of nitrogen fixation, ammonification, nitrification and denitrification in coastal zones. Acta Ecol. Sin. 2004, 24, 2907–2915. [Google Scholar]
- Hu, S.; Wang, T.; Xu, S.; Ma, L.; Sun, A.X. Seasonal Release Potential of Sediments in Reservoirs and its Impact on Water Quality Assessment. Int. J. Environ. Res. Public Health 2019, 16, 3303. [Google Scholar] [CrossRef] [PubMed] [Green Version]
- Arega, F.; Lee, J.H.W. Diffusional Mass Transfer at Sediment–Water Interface of Cylindrical Sediment Oxygen Demand Chamber. J. Environ. Eng. 2005, 131, 755–766. [Google Scholar] [CrossRef]
- Weston, N.B.; Giblin, A.E.; Banta, G.T.; Hopkinson, C.S.; Tucker, J. The Effects of Varying Salinity on Ammonium Exchange in Estuarine Sediments of the Parker River, Massachusetts. Chesap. Sci. 2010, 33, 985–1003. [Google Scholar] [CrossRef]
- Hou, D.; He, J.; Lü, C.; Dong, S.; Wang, J.; Xie, Z.; Zhang, F. Spatial variations and distributions of phosphorus and nitrogen in bottom sediments from a typical north-temperate lake, China. Environ. Earth Sci. 2014, 71, 3063–3079. [Google Scholar] [CrossRef]
- Chai, B. Pollutants Flux on the Sediments Multi-Phase Interface in Drinking Water Reservoir and Pollution Controlling Technology. Ph.D. Thesis, Xi’an University of Architecture and Technology, Xi’an, China, 2012. [Google Scholar]
- Huang, T.-L.; Liu, F.; Shi, J.-C. Distribution Characteristics and Pollution Status Evaluation of Sediments Nutrients in a Drinking Water Reservoir. Huan Jing Ke Xue Huanjing Kexue 2016, 37, 167–172. [Google Scholar]
- Wang, Y.; Zhu, J.; Ma, M.; Yin, C.; Liu, C. Thermal Stratification and Paroxysmal Deterioration of Water Quality in a Canyon Reservoir, Southwestern China. J. Lake Sci. 2005, 17, 54–60. [Google Scholar]
- Visser, P.M.; Ibelings, B.W.; Bormans, M.; Huisman, J. Artificial mixing to control cyanobacterial blooms: A review. Aquat. Ecol. 2015, 50, 423–441. [Google Scholar] [CrossRef] [Green Version]
Publisher’s Note: MDPI stays neutral with regard to jurisdictional claims in published maps and institutional affiliations. |
© 2021 by the authors. Licensee MDPI, Basel, Switzerland. This article is an open access article distributed under the terms and conditions of the Creative Commons Attribution (CC BY) license (https://creativecommons.org/licenses/by/4.0/).